Physical Science Laboratory Manual 2015-2016mrfitzics.com/s/PS Lab Manual 2015-2016.pdf ·...
123
Physical Science Laboratory Manual 2015-2016 prepared by Brian Martin John Campbell Kristin Collins Thomas Fitzpatrick Written September 2012 (Allegra Viola), Revised August 2015
Transcript of Physical Science Laboratory Manual 2015-2016mrfitzics.com/s/PS Lab Manual 2015-2016.pdf ·...

Physical Science Laboratory Manual
2015-2016
prepared by
Brian Martin
John Campbell
Kristin Collins
Thomas Fitzpatrick
Written September 2012 (Allegra Viola), Revised August 2015

1
Table of Contents
Laboratory Regulations……………………………………………………………………………2
Format for Physical Science Lab Report……………….…………………………………………4
Experiment 1………………………………Physics Skill-Building………………………………9
Experiment 2………………………………Motion of a Toy Car...…………………………..…17
Experiment 3………………………………Projectile Motion: Bull’s Eye…………………..…22
Experiment 4………………………………Force………………...………………………..……27
Experiment 5………………………………Momentum: Egg Drop...……………………..……30
Experiment 6………………………………Energy of a Tossed Ball.……………………..……32
Experiment 7………………………………Work and Power…….………………………..……36
Experiment 8………………………………Simple Machines……………………………..……39
Experiment 9………………………………Sound Waves: Mach One...……………………..…44
Experiment 10………………..……………Lenses and Images………………….…………..…47
Experiment 11-1…………………..………Electricity: A Qualitative Approach…………...…..50
Experiment 11-2…………………..………Electricity: A Quantitative Approach………..….....54
Experiment 12………………..……………Chemistry Skill-Building..………….………..……58
Experiment 13………………..……………Thermal Energy from Foods….…….…………..…69
Experiment 14………………..……………Properties of Matter……...………….…………..…73
Experiment 15………………..……………Physical and Chemical Changes...….…………..…78
Experiment 16………………..……………Separating a Mixture….....………….…………..…83
Experiment 17………………..……………Chemical Structures……..………….…………..…86
Experiment 18………………..……………Chemical Reactions……...………….………..……89
Experiment 19………………..……………Striking it Rich!.................………….…….…….…94
Experiment 20………………..……………Analysis of the Reaction between AgNO3 & NaCl..97
Experiment 21………………..……………pH………………………..………….……………101
Experiment 22………………..……………Titration……………….....………….……………106
Appendix 1………………….……………..Percent Error…………………………..…………111
Appendix 2………………….……………..Graphing in Microsoft Excel…………..…………112
Appendix 3………………….……………..Some Basic Tools in Microsoft Word…..……..…121

2
Laboratory Regulations
Pay close attention to the instructions given before each experiment.
Your work in the laboratory should be done quietly and carefully. Take your time; do the
work well.
Be careful. Some of the materials which you will use are poisonous. Some might be
explosive under various conditions; others are flammable. To avoid danger, follow the
directions given by the instructor and those in the laboratory manual.
Laboratory equipment should be used only for its intended purpose: completing the
experiment. Misuse of equipment is not permitted.
Be sure that you are using the materials called for and the amounts indicated in the
directions. READ DIRECTIONS AND BOTTLE LABELS CAREFULLY.
Original experiments (mixing chemicals “to see what will happen”) are forbidden.
Solid waste materials and spent matches which have cooled should be placed in the trash
receptacles, not in the sink or trough.
Broken glass must be placed in the special receptacle provided for this purpose. Nothing
else should be placed in this container.
To prevent corrosion and possible accidents, flush the sink with water when liquids are
poured into them.
Look through a test tube, never into it. When heating a test tube, never point it at yourself
or your fellow students.
During chemistry experiments, laboratory aprons must be worn at all times. They should
be put away neatly when instructed by your teacher.
During chemistry experiments, safety goggles must be worn at all times. They are the first
thing you put on when you enter the laboratory and the last thing you take off before
leaving.

3
When examining a substance, use the sense of sight always, the sense of smell cautiously,
and never the sense of taste.
Before leaving the laboratory, be sure that your apparatus and bench top are clean, dry, and
ready for the next group to use. During chemistry experiments, use the sponges provided
and wet them thoroughly and squeeze out the excess water. Then use the sponge to wipe
down your bench. Wash and dry your hands before leaving the laboratory.
Be sure to notes the location of fire extinguishers in the laboratory.
Be sure to note the location of the emergency eye wash sink in the laboratory.
Be sure to note the location of the emergency shower in the laboratory.
First aid equipment is available in the laboratory. Should an accident occur, no matter how
minor it may seem, notify the instructor at once.

4
Format for Physical Science Laboratory Report
Not all instructors will require this format. Check with your instructor to determine the format
required.
Each experiment is to be handed in as a separate laboratory report. These reports are your
own work. Although you will perform the experiments with a partner, the final report
needs to be produced by you.
All experiments done on a particular day are to be stapled together.
Laboratory reports should be typed if possible. If they cannot be typed, they must be neatly
hand-written. Rulers should be used to make any data tables.
Lab reports may not be submitted via email.
All heading and numbering schemes shown below are to be part of your laboratory report.
All sections should fall in order and may not be attached to the back.
Your Name
Report Due Date
Experiment Number: Experiment Title
I. Purpose
The purpose section should explain the reason for doing the experiment. You should state what
physical or chemical principles or concepts are being examined. The introduction in the
laboratory manual and your textbook should be of help writing the purpose. This section should
not be more than 1-2 sentences. It should be written in past tense and passive voice.
II. Procedure
The procedure section should summarize the important activities done during the experiment.
This excludes cautions and tips that are provided for you in the manual. This section should not
be copied from the manual. It should be written in past tense, passive voice, and paragraph form.
III. Data & Observations
This section should contain a neat presentation of your data or measurements, preferably, in
tabular form. Your data and observations should be labeled to indicate exactly what the
measurement represents. Data is to be listed under each other, not in paragraph form. All
measurements should include the appropriate number of significant figures and should include
both the number and the unit of measurement. Any tables should have titles above them.

5
IV. Calculations & Graphs
This section should show all calculations that were needed to arrive at data reported above or
data required by questions or calculations. All calculations should be labeled to indicate
exactly what was being calculated or what question was being answered. If there are no
calculations, you should include the heading for this section and under it the word NONE should
appear. Calculations should be numbered as they are in the laboratory manual. Graphs
should have titles and axis titles with units, if appropriate.
V. Questions
Any questions posed anywhere in the experiment should be answered in this section. Your
answers are to be in complete, correct sentences. If there are no questions or problems, you
should include the heading for this section and under it the word NONE should appear.
Questions should be numbered as they are in the laboratory manual.
VI. Conclusions
This section should be written in paragraph form. Below are a set of questions to guide you. A
conclusion in a lab report is not simply a place to list answers to these questions. It is similar to
the conclusion of an essay in that it should summarize and wrap up the whole report.
Was the purpose achieved?
Briefly summarize the results of the experiment.
What can be concluded after doing this experiment?
What are sources of error that could have affected the results (during the actual experiment)?
It is definitely acceptable to say that you did not achieve your purpose. Science does not always
go as planned. If you made a mistake during the experiment, you may explain that. However,
“human error” and “instrumental error” are NOT acceptable mistakes. Think about what could
have happened during the experiment to adversely affect your results. Messed up calculations
are not sources of error. Even if you think the experiment went perfectly, you can still propose
possible errors.
Your instructor might ask you to turn in a “mini” lab report that consists of 1 or more of
these sections. Always follow given directions.
Mini Format 1:
Purpose, Data & Observations, Calculations & Graphs, Questions
Mini Format 2:
Purpose, Data & Observations, Calculations & Graphs, Questions, Conclusion

6
Sample Physical Science Laboratory Report1
John Doe
September 1, 2013
Experiment 1: Determining the Boiling Point of Water
I. Purpose: The purpose of this experiment was to determine the boiling point of water.
II. Procedure:
The beaker was filled with approximately 300 mL of distilled water and then placed
above the Bunsen burner. The initial temperature of the water was measured. The
water was then heated by the Bunsen burner flame. The temperature of the water was
recorded every two minutes until six minutes after boiling began. Observations were
also made every two minutes. The flame was then turned off and the materials allowed
to cool.
III. Data & Observations:
Table 1: Temperatures and Observations of Water while Heating
Time (min) Temperature (°C) Observations
0 20.0 Water is clear and still
2 41.5 No change
4 60.6 No change
6 79.4 -Water is still clear
-Small bubbles appear in
water
8 97.1 -Water is still clear
-Large bubbles appear in
water
10 99.7 Same color and bubbling
continues
12 99.9 Same color and bubbling
continues
14 99.9 Same color and bubbling
continues
1 Adapted from Liberty High School: http://www-lhs.beth.k12.pa.us/departments/science/Science%20Department%20Lab%20Report%20Format.pdf

7
IV. Calculations & Graph:
There are no calculations for this experiment.
V. Questions:
1. Using your graph and observations, identify the time when boiling began and the
boiling point of water.
On a temperature vs. time graph, a section with a slope of zero (flat) corresponds
to a change in state of matter. According to the graph constructed from this
experiment, the boiling point of water is approximately 100 °C. This corresponds
with the observations taken during the experiment. At 8 minutes, the water was
bubbling quite a bit, which is a sign of boiling. These large bubbles started to
appear when the temperature was 97.1 ºC, which is just under the boiling point
obtained from the graph.
2. Explain the meaning of the positive slope for part of the graph and the slope of
zero for the next part of the graph.
On a temperature vs. time graph, a positive slope means that the temperature of
the substance is increasing because it is absorbing energy, making the molecules
move faster. In this time period, the state of matter is not changing. A flat
portion (slope = 0) means that the substance is changing its state of matter. This
happens because energy is still being added to it (by the Bunsen burner flame) but
is now being used to break the attraction between the water molecules and make
the water go from a liquid to a gas.
0
10
20
30
40
50
60
70
80
90
100
110
0 2 4 6 8 10 12 14 16
Tem
pe
ratu
re (
ºC)
Time (min)
Temperature vs. Time for the Heating of Water

8
VI. Conclusion:
The purpose of this experiment was to find the boiling point of water, which was
achieved. It was determined to be 100 °C. To determine this, a temperature vs. time
graph was created from data gathered during the experiment. The flat portion of this
graph corresponded to the boiling of the water. When the temperature levels off, it
indicates that a phase change is occurring. The temperature leveled off at 100 ºC,
which must therefore be the boiling point of the water. In this experiment, it is clear
that energy was transferred to the water from the Bunsen burner flame throughout the
period of data collection. After analyzing the graph, it can be concluded that the
energy first caused the molecules of liquid water to speed up, thereby increasing the
temperature of the water. This conjecture is based on the fact that temperature is a
measure of average kinetic energy of the particles in a substance. Eventually, the
energy from the flame was used to boiling the water, breaking the attraction between
the water molecules and allowing them to escape into the gas phase. This conclusion
is supported by the flat portion of the graph.
There are many possible sources of error that could have affected the results of
this experiment. For example, if impure water was used, that could have affected the
boiling point that was determined. When a liquid has substances dissolved in it, as
might be the case with impure water, the boiling point of the liquid is elevated. The
result would have been that the last set of temperatures measured would have been
higher than the actual boiling point of pure water. Distilled water was used in this
experiment in an effort to avoid this source of error.

9
EXPERIMENT 1
Physics Skill-Building
Throughout the course of the school year, you will learn many new techniques, skills, and
approaches to analysis of scientific material. Some material you learn will pervade your career
as a student of science while other parts will be specific to physics. The skills you will develop
during physics experiments will serve as a foundation and a jumping point moving forward.
One concept central to any quantitative-based experiment is measurement. You will become an
expert in recording measurements with the correct number of digits and the correct unit. The
tools used will include meter sticks, thermometers, stopwatches, and balances, among others.
Computers will also be an aid in taking some digital measurements.
Of what use would measurements be if they were not analyzed? Imagine looking at a piece of
paper with Philadelphia temperatures written down from every September 1st since 1900.
Without taking an average, looking at the record high or low, the 113 measurements would be
overwhelming. After taking measurements, you will often perform calculations, plot graphs, or
process the data in another fashion. This analysis may be performed by hand, with calculators,
or with computers.
OBJECTIVES
In this experiment, you will
practice techniques and taking measurements with the correct number of significant
figures.
learn one way to approach error in your data.
practice conversions and graphing.
become comfortable and familiar with tools for future experiments.
MATERIALS
meter sticks balances
small weights stopwatch
pendulum computer for graphing
given information for conversions, graphing, and other laboratory concepts
10
PROCEDURE
Station 1: Measurements (Length & Mass)
Length Measurement
How to Take a Measurement
All measurements must include units. When taking a measurement with a non-digital tool, you
always include all of the digits that the tools provides, plus one estimated digit.
Look at the examples below.
Figure 1
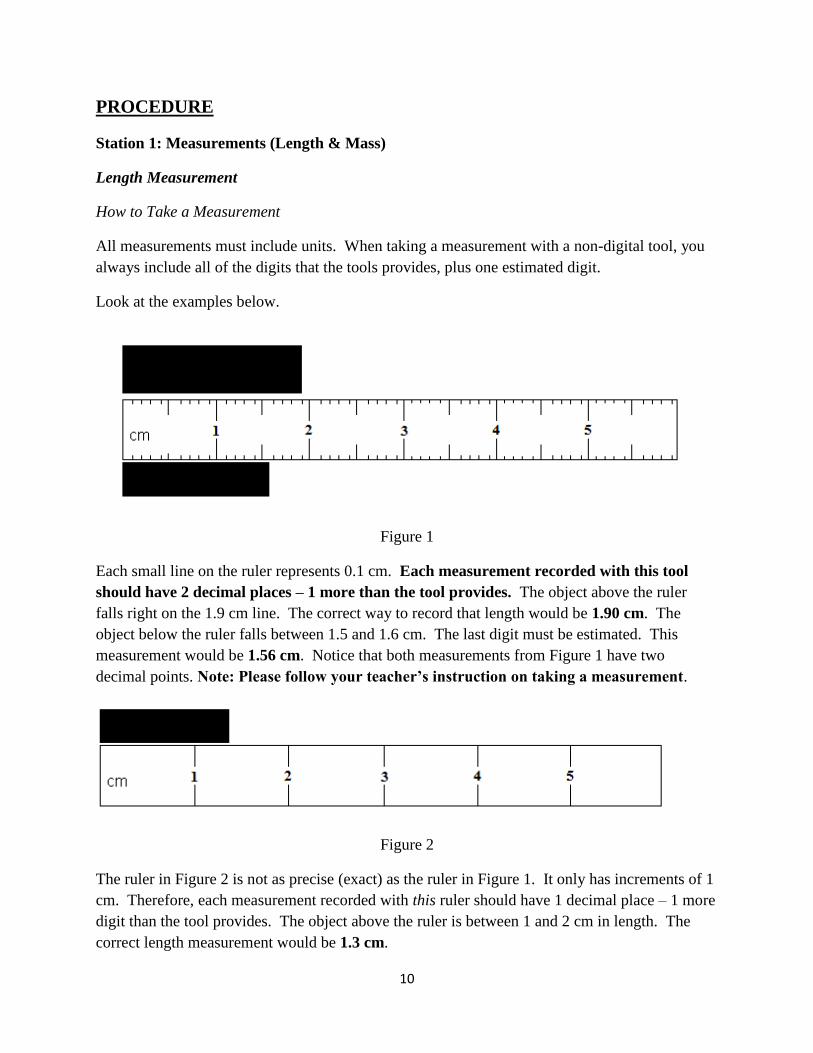
Each small line on the ruler represents 0.1 cm. Each measurement recorded with this tool
should have 2 decimal places – 1 more than the tool provides. The object above the ruler
falls right on the 1.9 cm line. The correct way to record that length would be 1.90 cm. The
object below the ruler falls between 1.5 and 1.6 cm. The last digit must be estimated. This
measurement would be 1.56 cm. Notice that both measurements from Figure 1 have two
decimal points. Note: Please follow your teacher’s instruction on taking a measurement.
Figure 2
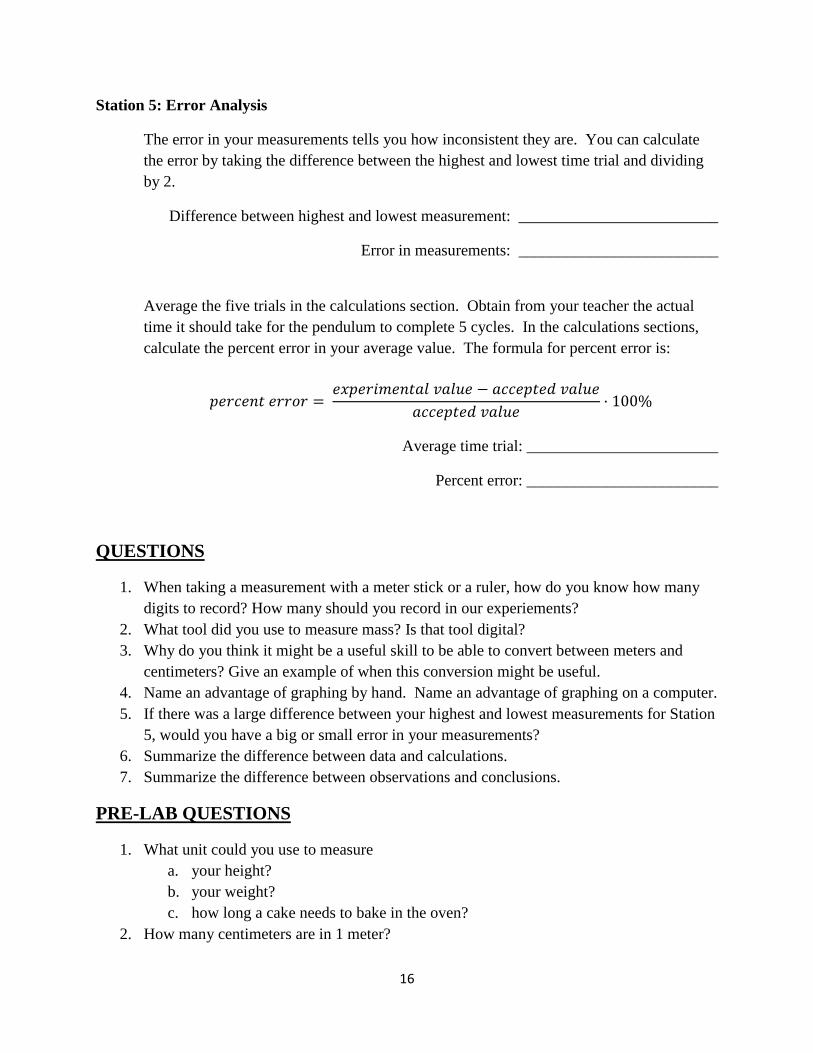
The ruler in Figure 2 is not as precise (exact) as the ruler in Figure 1. It only has increments of 1
cm. Therefore, each measurement recorded with this ruler should have 1 decimal place – 1 more
digit than the tool provides. The object above the ruler is between 1 and 2 cm in length. The
correct length measurement would be 1.3 cm.

11
Practice Taking Length Measurements
1. There are three objects at your bench and a meter stick. Examine the meter stick and
right down what the smallest increment represents in the data section.
2. Measure the (longest) length of each object using the meter stick at the station. Record
each value in the data section.
Mass Measurement
When using a digital tool, no extra estimate is needed. The tool provides all of the precision that
it can.
1. Examine the balance at your bench.
a. The ON/OFF button is self-explanatory. At the end of a lab period, balances
should be turned off to conserve battery. You need to hold down the power
button to do this.
b. The display should be show a ‘g’ for grams. If it does not, switch the mode until
it does. Having the wrong unit is like stepping on a scale in Europe and thinking
you weight 56 lb instead of 56 kg!
c. There is also a ZERO button. This sets the balance reading to zero, no matter
what is sitting on it. Thus, you could set the empty balance to read zero, or place
an object on it and have the balance read zero.
2. Make sure the balance is on and reads 0.0 g. If it does not, hit the ZERO button.
3. Measure the mass of the three objects at your lab bench. Record these masses in the data
section.
4. Convert each of the masses to kilograms. (Note that this should go in the “calculations”
section.)
Station 2: Error Analysis
1. There is a pendulum at this station (like a grandfather clock). Using a stopwatch,
measure the time it takes for the pendulum to go 5 complete cycles. (Say it starts on the
left. It will move all the way to the right and then return to its original position. That is
one cycle.)
2. Record the time in the data section. Repeat this time measurement 4 more times.
3. The following also appears in the data analysis section:
The error in your measurements tells you how inconsistent they are. You can calculate
the error by taking the difference between the highest and lowest time trial and dividing
by 2.
4. Average the five trials in the calculations section

12
5. Obtain from your teacher the actual time it should take for the pendulum to complete 5
cycles. In the calculations sections, calculate the percent error in your average value.
The formula for percent error is:
𝑝𝑒𝑟𝑐𝑒𝑛𝑡 𝑒𝑟𝑟𝑜𝑟 = 𝑒𝑥𝑝𝑒𝑟𝑖𝑚𝑒𝑛𝑡𝑎𝑙 𝑣𝑎𝑙𝑢𝑒 − 𝑎𝑐𝑐𝑒𝑝𝑡𝑒𝑑 𝑣𝑎𝑙𝑢𝑒
𝑎𝑐𝑐𝑒𝑝𝑡𝑒𝑑 𝑣𝑎𝑙𝑢𝑒· 100%
Station 3: Conversions
There are several measurements written down at your station. Follow the instructions at the
station for converting these measurements to different units. Record your work in the
“calculations” section.
Station 4: Graphing by Hand
Follow the instructions at Station 4 for constructing a graph by hand. The hand-drawn graph
should be done on a separate sheet of graph paper. Insert this graph in the “calculations and
graph” section of your lab report.
Station 5: Graphing on the Computer
Follow the instructions at Station 4 for constructing a graph by hand. Print the graph on the lab
computer. Insert this graph in the “calculations and graph” section of your lab report.
Station 6: Other Important Laboratory Concepts
There are some concepts that we will use many times in the laboratory that can be easily
confused. Here we will practice telling the difference between them. At your station are a series
of statements. Identify them as data, calculation, observation, or conclusion, using the
information below as your guide. Record your results in the data section.
Data vs. Calculation
A piece of data is very different than a calculation.
You can use a ruler to take a length measurement, a thermometer to measure the
temperature, or a stopwatch to take a time measurement. These examples would qualify
as pieces of data.
Later, you might gather your data and take an average or find a new quantity entirely.
For example, if you walked 3 miles and it took 1.5 hours, you could calculate your
average walking speed. You did not measure your speed, you calculated it. Calculations
are a result of processing the data you obtained.
Measurements are considered data. You cannot measure a calculation.

13
Observation vs. Conclusion
Observations are often grouped with data. An observation is a quality that you see, hear, etc. and
record. Usually data is thought of as quantitative concept (contains a number) and an observation
is qualitative (e.g. the liquid is clear). This distinction is less critical than that of data vs.
calculation.
Observations are sometimes confused with conclusions. An observation simply states a quality
of something: its color, size, shape, etc. For example, “the liquid is clear” is an observation. A
conclusion is not something you can observe. It is something that you infer based on
observations and previous knowledge. For example, “the liquid is clear, therefore it is water” is
a conclusion based on an observation and what you know about water. Not all conclusions are
valid.
DATA & RESULTS
Data Table for Station 1: Length Measurement
Be sure to include units.
Number of centimeters represented by each gradation: ________________________
Number of decimals placed that this measurement should have: _________________
Object (name) Longest length
Data Table for Station 1: Mass Measurement
Be sure to include units.
Object (name) Mass

14
Data Table for Station 2: Error Analysis
Be sure to include units.
Trial Time for 5 Cycles
1
2
3
4
5
6
7
8
9
10
Table for Station 6: Other Important Laboratory Concepts
Statement Identification of Statement Type
1
2
3
4
5
6
7
8
9
10
CALCULATIONS
Station 1: Mass Measurement Conversions

15
Station 3: Conversions
16
Station 5: Error Analysis
The error in your measurements tells you how inconsistent they are. You can calculate
the error by taking the difference between the highest and lowest time trial and dividing
by 2.
Difference between highest and lowest measurement: _________________________
Error in measurements: _________________________
Average the five trials in the calculations section. Obtain from your teacher the actual
time it should take for the pendulum to complete 5 cycles. In the calculations sections,
calculate the percent error in your average value. The formula for percent error is:
𝑝𝑒𝑟𝑐𝑒𝑛𝑡 𝑒𝑟𝑟𝑜𝑟 = 𝑒𝑥𝑝𝑒𝑟𝑖𝑚𝑒𝑛𝑡𝑎𝑙 𝑣𝑎𝑙𝑢𝑒 − 𝑎𝑐𝑐𝑒𝑝𝑡𝑒𝑑 𝑣𝑎𝑙𝑢𝑒
𝑎𝑐𝑐𝑒𝑝𝑡𝑒𝑑 𝑣𝑎𝑙𝑢𝑒· 100%
Average time trial: ________________________
Percent error: ________________________
QUESTIONS
1. When taking a measurement with a meter stick or a ruler, how do you know how many
digits to record? How many should you record in our experiements?
2. What tool did you use to measure mass? Is that tool digital?
3. Why do you think it might be a useful skill to be able to convert between meters and
centimeters? Give an example of when this conversion might be useful.
4. Name an advantage of graphing by hand. Name an advantage of graphing on a computer.
5. If there was a large difference between your highest and lowest measurements for Station
5, would you have a big or small error in your measurements?
6. Summarize the difference between data and calculations.
7. Summarize the difference between observations and conclusions.
PRE-LAB QUESTIONS
1. What unit could you use to measure
a. your height?
b. your weight?
c. how long a cake needs to bake in the oven?
2. How many centimeters are in 1 meter?
17
EXPERIMENT 2
Motion of a Toy Car
Sometimes two quantities are related to each other and the relationship is easy to see. Sometimes
the relationship is less evident. In either case, a graph of the two quantities often reveals the
nature of the relationship. In this experiment, a graph will be constructed that represents the
motion of a toy car. By keeping track of its position relative to time, you will collect the data for
the graph. To do this, the car will run along the length of a strip of paper. At regular time
intervals, you will mark the position of the car. This will result in several ordered pairs of data –
positions at corresponding times. You can then plot these ordered pairs to make a graph
representing the motion of the car.
OBJECTIVES
In this experiment, you will
Use tools to collect data on the motion of a toy car.
Analyze the data to draw conclusions about the speed of the car and the nature of its
motion.
MATERIALS
paper meter stick
pencil constant velocity toy car
stopwatch tape
Logger Pro Vernier motion detector
computer
PROCEDURE
1. Tape the long sheet of blank paper to the bench. It should be as flat as possible.
2. Aim the car so that it will run the length of the bench. It should face the wall so that it
will not fall off the end of the table. Turn on the car and give it a few trial runs to check
the alignment.
3. Using a meter stick and a pencil, draw a start line at the front tires of the toy car.
4. Practice using the stopwatch. Partner 1 will be the timer. At each one-second interval,
he will call “go” and Partner 2 will mark the position of the front tires on the paper using
the eraser end of a pencil. Allow the car to keep moving as you mark the intervals but
stop the car before it hits the wall. Practice this until you feel comfortable with the
timing.

18
5. Performing the experiment: When the car starts moving at the start line, start the
stopwatch. At each one-second interval, the stopwatch operator will call “go” and the
second partner will mark the position of the front tires on the paper using a pencil. Stop
the car before it hits the wall. Depending on the speed of your car, you may not reach 7
seconds on your data table.
6. Measure the distances (in cm) of each point from the start line. (At time = 0 s, the
distance was 0 cm). Record these positions on the Data Table. Be sure your
measurements have the correct number of digits.
Getting the velocity from the computer:
7. You will use the computer and the motion sensor to get the velocity of the toy car. Open
the program Logger Pro as instructed by your teacher.
8. Line up the toy car so that the motion detector can detect it. Turn off the car and place it
near the motion detector, ready to start.
9. Click the “Collect” button. Right afterward, start the toy car. Hit the “Stop” button when
the car runs out of room or is out of reach of the motion detector.
10. In the data section, write down the velocity of the toy car from the computer.
DATA
Data Table: Motion of a Toy Car
Time
t (s)
Position
d (cm)
0
1
2
3
4
5
6
7
Velocity of toy car from the computer: ________________________

19
CALCULATIONS & GRAPH
On a sheet of graph paper, make a graph of position vs. time. A sample graph is shown in Figure
1.
Title the graph “Position vs. Time.”
Label each axis with a variable followed by a unit in parentheses. Position will be on the
y-axis (in units of centimeters) because it is the dependent variable. Time will be on the
x-axis (in units of seconds) because it is the independent variable. Try to fill up as much
of the graph paper as possible. (Hint: Decide what range of positions or times need to fit
on an axis before you start counting. Each square doesn’t have to equal 1 second or 1
centimeter.)
Draw a line of best fit. This line does not necessarily “connect the dots.” Rather, it is a
single, straight line that approximates your data. Use a ruler; place it across your data
points so that your line will pass as close as possible to all of your points. The line may
pass above some points and below others. Do not simply draw a line connecting the first
point to the last point.
Determine the slope of the best-fit line.
Pick two convenient points on your line. They should be pretty far away from each
other. Convenient points are those that intersect grid lines on the graph paper. Do not
choose your own data points.
0
10
20
30
40
50
60
70
80
90
0 1 2 3 4 5
Dis
tan
ce (
cm)
Time (s)
Figure 1: Distance vs. Time

20
“Rise over run” method:
Extend a horizontal line to the right of the lower convenient point and a vertical line
downward from the upper convenient point until you have a triangle as shown in Figure
2. Find and record the length of the horizontal line on your graph. This is the “run.” Do
not use a ruler to measure this length. It must match the units and scale used on the x-
axis.
Run: ________________ s
Determine the length of the vertical line. This is the “rise.” Again, be sure the units and
scale match that of the y-axis.
Rise: _______________ cm
Calculate the slope by dividing the rise by the run. Show your calculation in your report.
Slope = 𝑟𝑖𝑠𝑒
𝑟𝑢𝑛 = _____________ cm/s
Formula method:
Find the coordinates of your two chosen points. They will be substituted into the formula
below. For example, if one point is (3.8, 78), then x1 is 3.8 and y1 is 78. If the second
point is (0.5, 10), then x2 is 0.5 and y2 is 10.
Slope = 𝑦2−𝑦1
𝑥2−𝑥1 = _____________ cm/s

21
QUESTIONS
1. Look at the units for the calculated slope. What does the slope tell you about the car?
2. Suppose a faster car were used in this experiment. What would have been different about
a. the distance between the marks on the paper?
b. the number of seconds the car would have spent on the paper before reaching the
edge?
c. the resulting position vs. time graph. (How would the slope have been different?)
3. Add a line to your graph that represents a faster car. Label it appropriately.
4. Suppose a slower car were used in this experiment. What would have been different
about
a. the distance between the marks on the paper?
b. the number of seconds the car would have spent on the paper before reaching the
edge?
c. the resulting position vs. time graph. (How would the slope have been different?)
5. Add a line to your graph that represents a slower car. Label it appropriately.
6. Suppose the car’s battery ran out during the run so that the car slowly came to a stop.
What would happen to the space
between marks as the car slowed
down?
7. What motions do the graphs in
Figure 3 represent? In other
words, what was the car doing to
generate these motion graphs?
a. Line A
b. Line B
8. Compare your calculated velocity
to the one given by the computer.
PRE-LAB QUESTIONS
1. What two quantities will be measured in this lab? In what units, respectively?
2. Should the car be stopped after each time interval or should it be allowed to continue?
3. On a position vs. time graph, which variable is on the y-axis and which on the x?
Line B
Line A
0
10
20
30
40
50
60
70
80
90
0 2 4 6
Dis
tan
ce (
cm)
Time (s)
Figure 3: Distance vs. Time

22
EXPERIMENT 3
Projectile Motion: Bull’s Eye
Projectile motion is a concept combining both vertical and horizontal motion into one problem. In
this lab, a marble will serve as your “projectile”. You will be rolling it off of the lab bench and
predicting, through calculations, where it will land. Vertical and horizontal motion can be
considered as separate calculations, linked by a common variable: time (in this case, the time that
the marble is in the air).
Without gravity, the marble you roll off the edge of the table would keep going (horizontally)
forever. You know that gravity makes the marble fall to the ground, similar to the picture above.
To predict where the marble will land, follow the steps outlined below. Horizontal motion will be
considered the “x” direction while vertical will be the “y.” Horizontal motion will be governed by
the following formula:
dx=vx·t
where dx is the horizontal distance travelled by the marble, vx is the average horizontal velocity of
the marble, and t is the time that the marble travels. Notice that time does not have a direction. It
is simply the time that the marble is moving. You will use this equation in two different scenarios:
once to calculate the velocity of the marble when it leaves the bench and once to figure out how
far from the bench it will land. dx will represent the latter.
Vertical motion will be governed by the following formula:
dy= ½gt2
where dy is the vertical distance travelled by the marble (a.k.a. the height of your lab bench), g is
the acceleration due to gravity and t is the time that the marble is in the air. Note that the initial
vertical velocity must be zero for this formula to be valid.

23
OBJECTIVES
In this experiment, you will
investigate the independence of horizontal and vertical motion.
predict the landing point of a projectile.
MATERIALS
target paper or cup meter stick
ramp marble
Vernier photogates Logger Pro and computer
masking tape
PROCEDURE
Getting the horizontal
average velocity:
1. Be sure your ramp is set up such that the distance from the bottom of the ramp to the end
of the table is about 20 cm. The whole point of the ramp is to get the marble moving, but
a horizontal portion is necessary.
2. Position the Photogates so that the ball rolls through each of them while rolling on the
horizontal table surface (but not on the ramp).
24
3. With masking tape, mark a starting position on the ramp so that you can repeatedly roll
the ball from the same place. Roll the ball down the ramp through each Photogate and off
the table. Make sure you catch the marble and do not let it hit the floor. It should
also not hit the Photogates.
4. Open the file “08 Projectile Motion” in the Physics with Vernier folder.
5. Place the Photogates so that they are about 8-10 cm apart.
6. Measure the exact distance from the front of the first photogate to the front of the second
photogate.
7. Enter in to the computer the distance between the photogates. This is needed in order for
Logger Pro to calculate the velocity of the marble. The program will divide this distance
by the time interval it measures to get the velocity. Carefully measure the distance from
the front of the first Photogate to the front of the second Photogate.enter it into the
computer.
8. Check to make sure the Photogates are working by moving your finger through the one
closer to the ramp and then the one further. The red light should flash when your finger
passes through. (Be sure not to move the Photogates.)
9. Click COLLECT. Roll the ball from the mark on the ramp through both Photogates and
catch it immediately after it leaves the table. Repeat 9 times. Do not move the
equipment. (Note: Data collection will stop after 2 minutes. If you need more time, click
COLLECT to restart, choosing APPEND.) Click STOP after the 10th trial.
10. Click on the EXAMINE button and record the velocity for each trial in the data section.
Click on the velocity vs. time graph and then click the STATISTICS button to get the
average velocity of all the trials. Record this in Data Table 1. This velocity will also be
the marble’s average horizontal velocity while it is in the air.
Now that your ramp is set up and you’ve done calculations, be sure not to move it!
Getting information on the vertical component (FREE FALL!):
11. Measure the height of the table, which is the vertical distance the marble will travel as a
projectile. Record this height, dy, in Data Table 2.
12. Convert dy from centimeters to meters. Record this value in Data Table 2.
13. You know dy, the vertical distance that the projectile travels, in meters. You can use this
knowledge to figure out how long (time) the marble will be in the air. Calculate t and fill
in your result in Data Table 2. Hint: Watch your units!
Predicting where the marble will hit:
14. You know how long the marble will be in the air (t from Step 7). You know with what
horizontal velocity the marble leaves the table (vx from Step 4). With these two pieces of
information, you can calculate how far (dx) the marble should go from the table. In other

25
words, you can figure out the horizontal distance travelled by the projectile, dx. Do so and
record your result in Data Table 3.
Testing:
15. When you are ready, ask the teacher for your target carbon paper or cup. Measure where
the paper should be placed on the ground. Your goal is to hit the target! The teacher will
observe your test. Measure the actual horizontal distance travelled by the marble and
record your result in the data section.
DATA
Data Table and In-Lab Calculations 1: Horizontal Motion on the Lab Bench
Formula used by the computer: vx = 𝑑
𝑡
Trial Velocity (m/s)
1
2
3
4
5
6
7
8
9
10
Average
Data Table and In-Lab Calculations 2: Vertical Information
Vertical height of lab bench (dy)
in cm
Vertical height of lab bench (dy)
in m
Formula
dy = ½gt2
Rearranged formula
Time marble is in the air
Scratch work:

26
Data Table and In-Lab Calculations 3: Predicting Landing Point
Average horizontal velocity (vx)
(From Table 1)
Time marble is in the air
(From Table 2)
Formula
dx = vx·t
Horizontal distance travelled by
marble (dx)
(Predicted)
Actual result: Horizontal distance travelled by marble (dx): ______________ cm
CALCULATIONS (Post-experiment)
1. In your lab report, show all of the work for calculating the values that were put in the data
tables. This includes how you solved for average vx, converted dy, time, and predicted dx.
2. Percent error is a number that quantitatively expresses how accurate or inaccurate your
experimental result is when compared to your predicted result. Check Appendix 1 for
the formula for percent error. The "experimental value" is the actual distance travelled
by the marble and the "accepted value" is your predicted distance.What was the percent
error for your predicted horizontal distance? Show your work.
QUESTIONS
1. Did your marble travel too far or not far enough?
2. What would air resistance do to the motion of the marble? Be specific.
PRE-LAB QUESTIONS
1. Identify what the following variables stand for in this experiment.
dx vx dy vy
2. Consider the variables in #1. Which of these will be given by the computer?
3. What distance decides how long the marble will be airborne: horizontal or vertical?
(Hint: compare the lab to a marble rolling off of a cliff.)
4. In which direction will the marble accelerate while it is in the air: horizontal or vertical?
What causes the acceleration?
5. Rearrange the formula in Data Table 2 to solve for time. Write the rearranged form of the
equation in the data table as well as on your pre-lab.

27
EXPERIMENT 4
Force
In the first part of this experiment, you will gather data to analyze the relationship between force
and mass. You will use a graph to find the quantitative relationship between them. The second
part of the experiment will analyze the motion of a cart, which will move by attaching it to a
weight connected by a string. In this section, you will take measurement and perform
calculations to eventually calculate the force acting on the cart.
OBJECTIVES
In this experiment, you will
investigate the relationship between force, mass, and acceleration through data collection,
calculations and graphing.
manipulate equations to calculate unknown variables using data gathered in lab.
MATERIALS
weights Force sensor
balance string
pulley tape
meter stick dynamics cart
stopwatch
PROCEDURE
Part 1
1. There are five weights in front of you. Record the mass, in kilograms, of one of the
weights in the data table below. Do not record any other masses until after Step 2.
2. Attach that weight to the force sensor. Read the force from the computer. Record the
force required to hold the weight up in Data Table 1.
3. Then, repeat this for the remaining four weights.

28
Part 2
4. Record the mass of a dynamics cart on the data sheet.
5. Attach the string to the dynamics cart as instructed by your teacher.
6. Select a small weight from Part 1 and record its mass in Data Table 2.
7. Connect the weight to the string and move the weight to the top just under the pulley.
Using a piece of masking tape, mark the position of the cart when the weight is at the top.
8. Slowly lower the weight to the floor. Using masking tape, mark the position of the cart
when the weight first touches the floor. You have now set the distance required for the
experiment. Measure the distance and record it in Data Table 2.
9. Pull the cart back to the starting point and release the cart. Using a stopwatch, measure
the time for the cart to move from the start to the second piece of masking tape. Record
the time in Data Table 2. Repeat three times. Calculate the average of the trials and
record it in the data table.
DATA
Data Table 1: Measuring Force and Mass
Weight Mass Force
1
2
3
4
5
Data Table 2: Motion of Dynamics Cart
Mass of dynamics cart
Mass of small weight
Distance travelled by cart
Time travelled (all trials)
Average time travelled

29
CALCULATIONS & GRAPH
Part 1
Follow the instructions of your teacher for making the following graph and calculating its slope.
1. Make a graph of force (y-axis) vs. mass (x-axis). Note that mass must be in kilograms
before you graph. Be sure that your graph includes a title, and labels for each axis with
appropriate units.
2. Add a best-fit line.
3. Determine the slope of the graph. Show all work and give your final answer with
appropriate units.
NOTE: If you make the graph and insert the best-fit line on the computer, it can give you
the equation of the line in slope-intercept format (y=mx+b) where m, the number in front
of x, is the slope!
Part 2
4. Calculate the weight of the dynamics cart using the following equation:
Weight = Fg = mg
5. Calculate the acceleration of the cart between the two points using the following equation.
Remember, we can only use this equation because vi=0
d = ½at2
6. Calculate the force on the cart using the following formula:
F = (mcart)(acart)
QUESTIONS
1. In Part 1, what does the slope of the force vs. mass graph tell you? What units does it
have?
2. Compare the slope that was calculated in Part 1 with the acceleration due to gravity.
3. In Part 2, what is causing the cart to accelerate?
PRE-LAB QUESTIONS
1. In Part 1, what tool will you use to measure mass? To measure force?
2. In Part 2, a weight will pull the cart along the lab bench. Why do you think it is
necessary to use a small weight?
3. For Part 2, list the variables that you will be measuring and with what units they will
likely be measured.

30
EXPERIMENT 5
Momentum: Egg Drop
During this experiment, you will drop an egg from a great height and, hopefully, not damage it.
The nature of this experiment is largely exploratory. You will be given limited resources with
which to build a device capable of granting your egg safe passage. The pre-lab questions will
help you explore what your goals should be for the device.
OBJECTIVE
In this experiment, you will use your understanding of momentum to build something to carry an
egg safely to the ground.
MATERIALS
??????????????????????
(Will be revealed in lab)
PROCEDURE
1. Obtain your allocated materials from the teacher.
2. Construct your device.
3. Inform your teacher when you are finished. Follow any further instruction given.
OBSERVATIONS
In flight:
Upon impact:

31
QUESTIONS
1. Was your device successful (i.e. did your egg survive)?
If so, comment on what features made it so. Relate these features to concepts in
physics, specifically momentum.
If not, comment on what flaw or lack of foresight caused the demise of your egg.
Relate your comments to concepts in physics, specifically momentum.
2. No matter if your run was successful or not, how do you think you could improve your
device if you were to try again?
PRE-LAB QUESTIONS
1. After reading the introduction, you are probably already thinking of ways to ensure your
egg’s survival. There are two main concerns to address: one while the egg falls, the other
with the egg hitting the ground.
a. While the egg is airborne, what should the goal of your device be?
b. When the egg hits the ground, what should the goal of your device be?
2. In #1, you thought of two strategies to grant your egg safe passage.
a. How does your answer to 1(a) relate to momentum? Use the formula p = mv in
your answer.
b. How does your answer to 1(b) relate to impulse? Use the formula Δp = Ft in your
answer.

32
EXPERIMENT 6
Energy of a Tossed Ball2
When a juggler tosses a bean ball straight upward, the ball slows down until it reaches the top of
its path and then speeds up on its way back down. In terms of energy, when the ball is released it
has kinetic energy, KE. As it rises during its free-fall phase it slows down, loses kinetic energy,
and gains gravitational potential energy, PE. As it starts down, still in free fall, the stored
gravitational potential energy is converted back into kinetic energy as the object falls.
If there is no work done by frictional forces, the total energy will remain constant. In this
experiment, we will see if this works out for the toss of a ball. We will study these energy
changes using a Motion Detector.
OBJECTIVES
In this experiment, you will
measure the change in the kinetic and potential energies as a ball moves in free fall.
see how the total energy of the ball changes during free fall.
2 aken in large part from “Physics with Vernier”

33
MATERIALS
computer Vernier computer interface
Logger Pro Vernier motion detector
wire basket balance
volleyball, basketball, or other similarly heavy ball meter stick
PROCEDURE 1. Measure and record the mass of the ball used in this experiment.
2. Place the Motion Detector on the floor and protect it by placing a wire basket over it.
3. Turn on the computer. Open the file “16 Energy of a Tossed Ball” from the Physics with
Vernier folder.
4. DO NOT THROW THE BALL YET. The ball should not exceed a height of about 1.5
m. This is less than 5 feet. Therefore, the ball should not go way over your head.
5. Hold the ball directly above and about 1.0 m from the Motion Detector. In this step, you
will toss the ball straight upward above the Motion Detector and let it fall back toward
the Motion Detector. Have your partner click to begin data collection. Toss the ball
straight up after you hear the Motion Detector begin to click. Use two hands. Be sure to
pull your hands away from the ball after it starts moving so they are not picked up by the
Motion Detector. Throw the ball so it reaches maximum height of about 1.5 m above the
Motion Detector. Catch the ball close to the ground. You can stop the data collection
after the ball is caught.
6. Verify that the position vs. time graph corresponding to the free-fall motion is parabolic
in shape, without spikes or flat regions, before you continue. This step may require some
practice. If necessary, repeat the toss, until you get a good graph. When you have good
data on the screen, proceed to the Analysis section.
7. Click on the Examine button and move the mouse across the position or velocity graphs
of the motion of the ball to answer these questions.
a. Identify the portion of each graph where the ball had just left your hands and was
in free fall. Determine the height and velocity of the ball at this time. Enter your
values in your data table.
b. Identify the point on each graph where the ball was at the top of its path.
Determine the time, height, and velocity of the ball at this point. Enter your values
in your data table.
c. Find a time where the ball was moving downward, but a short time before it was
caught. Measure and record the height and velocity of the ball at that time.
34
DATA
Mass of the ball: _______________________
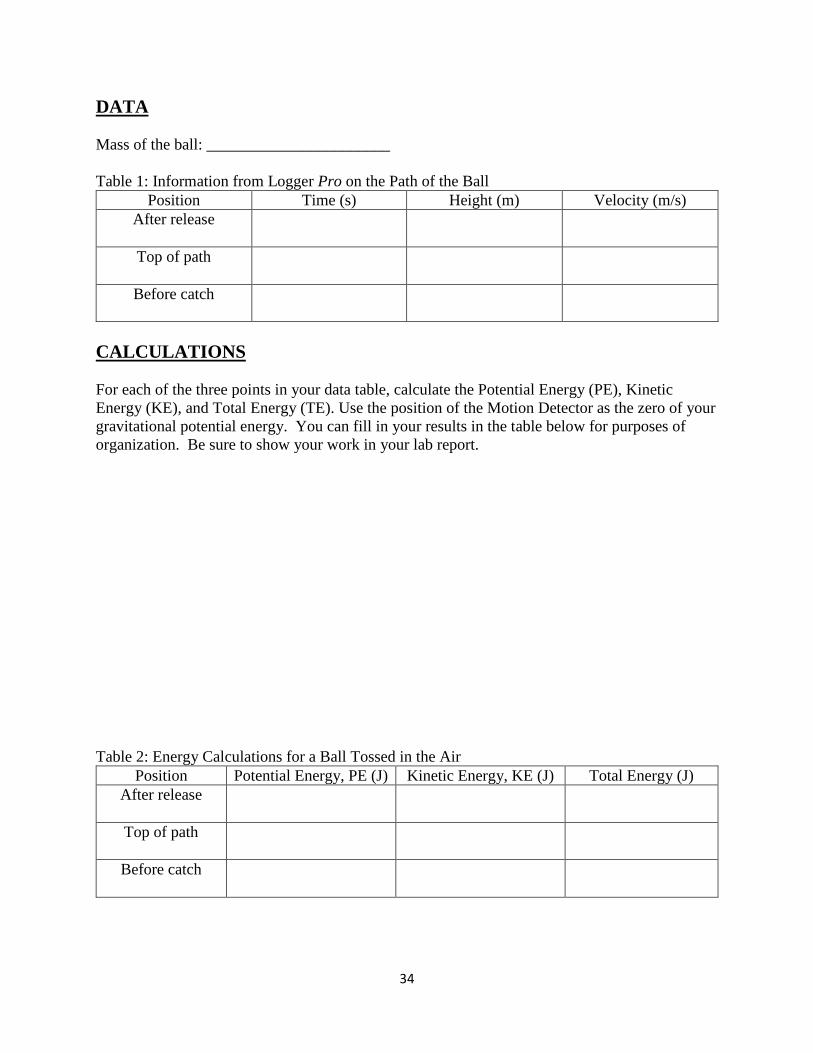
Table 1: Information from Logger Pro on the Path of the Ball
Position Time (s) Height (m) Velocity (m/s)
After release
Top of path
Before catch
CALCULATIONS
For each of the three points in your data table, calculate the Potential Energy (PE), Kinetic
Energy (KE), and Total Energy (TE). Use the position of the Motion Detector as the zero of your
gravitational potential energy. You can fill in your results in the table below for purposes of
organization. Be sure to show your work in your lab report.
Table 2: Energy Calculations for a Ball Tossed in the Air
Position Potential Energy, PE (J) Kinetic Energy, KE (J) Total Energy (J)
After release
Top of path
Before catch

35
QUESTIONS 1. How well does this experiment show conservation of energy? Explain.
2. Does the total energy of the ball remain constant? Should the total energy remain
constant? Why? If it does not, where could the missing energy have gone?
3. What would change in this experiment if you used a very light ball, like a beach ball?
PRE-LAB QUESTIONS For each question, consider the motion of a ball tossed straight upward that falls down again.
Assume that there is very little air resistance.
1. What form or forms of energy does the ball have while momentarily at rest at the top of
the path?
2. What form or forms of energy does the ball have while in motion while moving
downward?
3. Sketch a graph of velocity vs. time for the ball, starting when it is tossed up and ending
when it is caught. (This is just qualitative: think about if it will go up/down, and when
that will happen.)
4. Sketch a graph of kinetic energy vs. time for the ball.
5. Sketch a graph of potential energy vs. time for the ball.
6. If there are no frictional forces acting on the ball, how is the change in the ball’s potential
energy related to the change in kinetic energy?

36
EXPERIMENT 7
Work and Power
The word work represents a
concept that has a special meaning
in science that is somewhat
different from your everyday
concept of the term. In science, the
concept of work is concerned with
the application of a force to an
object and the distance the object
moves as a result of the force.
Work (W) is defined as the
magnitude of the applied force (F)
multiplied by the distance (d)
through which the force acts.
W = Fd
You are doing work when you walk up a stairway since you are lifting yourself through a distance.
You are lifting your weight (the force exerted) the vertical height of the stairs (distance through
which the force is exerted). Running up the stairs rather than walking is more tiring because you
use up your energy at a greater rate when running. The rate at which energy is transformed or the
rate at which work is done is called power. Power (P) is defined as work (W) per unit of time (t).
P = 𝑊
𝑡
When the steam engine was first invented there was a need to describe the rate at which the engine
could do work. Since people at that time were familiar with using horses to do their work, the
steam engines were compared to horses. James Watt, who designed a workable steam engine,
defined horsepower (hp) as a power rating of 550 ft·lb/s. In SI units, power is measured in Joules
per second, call the Watt (W). It takes 746 W to equal 1 hp, and 1 kW is equal to about 1 13⁄ hp.
746 W = 1 hp
1 kW = 1000 W ≈ 1.33 hp
OBJECTIVES
37
In this experiment, you will
identify how measurable quantities affect work and power.
relate physical quantities to everyday activities.
MATERIALS
staircase stopwatch
meter stick
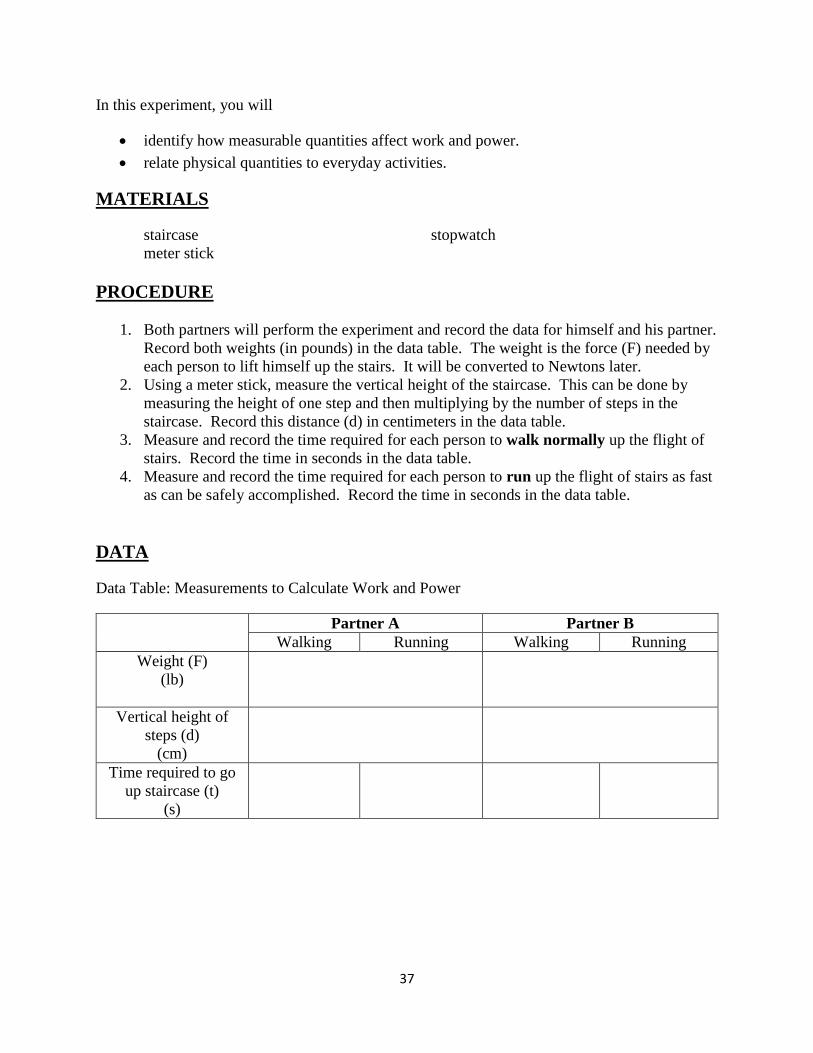
PROCEDURE
1. Both partners will perform the experiment and record the data for himself and his partner.
Record both weights (in pounds) in the data table. The weight is the force (F) needed by
each person to lift himself up the stairs. It will be converted to Newtons later.
2. Using a meter stick, measure the vertical height of the staircase. This can be done by
measuring the height of one step and then multiplying by the number of steps in the
staircase. Record this distance (d) in centimeters in the data table.
3. Measure and record the time required for each person to walk normally up the flight of
stairs. Record the time in seconds in the data table.
4. Measure and record the time required for each person to run up the flight of stairs as fast
as can be safely accomplished. Record the time in seconds in the data table.
DATA
Data Table: Measurements to Calculate Work and Power
Partner A Partner B
Walking Running Walking Running
Weight (F)
(lb)
Vertical height of
steps (d)
(cm)
Time required to go
up staircase (t)
(s)

38
CALCULATIONS
1. Convert both weights to Newtons. There are 4.4 N in 1 lb
2. Calculate the work accomplished (in Joules) by both you and your partner, walking and
running. (Make sure that distance is in the correct units!)
3. Calculate the power developed (in Watts) by both you and your partner, walking and
running.
4. Convert the power developed by both you and your partner, walking and running, from
Watts to horsepower.
QUESTIONS
1. Explain why there is a difference in power developed while walking and running up the
flight of stairs.
2. Could the power developed by a slower-moving student ever be greater than the power
developed by a faster-moving student? Explain.
3. Describe an experiment that you could do to measure the power you could develop for a
long period of time rather than for a short burst up a stairwell.
4. Picture two staircases, each with 10 steps. Staircase A has a gradual incline and Staircase
B is very steep. How would the distance (as measured in this experiment) differ? Would
force differ? Explain. Would work differ? Explain. A diagram below should help you.
Note that not all of the steps are shown.
PRE-LAB QUESTIONS
1. Using the information in the introduction, describe clearly what force and distance you will
record in this experiment.
2. Summarize the origin of the unit “horsepower” and identify what variable it is used for.
3. What should not change for walking and running up the stairs: work or power? Explain.
Photo credit: http://www.fotolia.com/id/32566257

39
EXPERIMENT 8
Simple Machines
We use machines every day to help us accomplish tasks. They take advantage of the relationship
between work, force, and distance. Simple machines can be combined to create a single, more
complex machine. A way to quantify the benefit is called mechanical advantage (MA). In this
lab, you will explore the relationship of work, force, and distance and evaluate how various
machines are of use to us.
One of the simplest machines that makes doing work easier is the incline plane, or a ramp. It is
much easier to push a heavy load up a ramp than it is to lift it vertically to the same height.
When it is lifted vertically, a greater lifting force is required but the distance moved is less.
When it is pushed op a ramp, the distance moved is greater but the force required is less. This
fact illustrates one of the most powerful laws of physics, the law of energy conservation.
Pulley systems can also be used to move loads. Sometimes, the direction of the force changes
when using a pulley. Some pulleys are fixed, meaning they stay in one spot, while others are
moveable. There are numerous combinations of fixed and moveable pulleys. You will be
examining different pulley configurations to help you understand the concept of mechanical
advantage. Simply put, the theoretical MA of a pulley system is the number of ropes pulling up
on the object being lifted. (You wouldn’t count the string that you pull down on.) You will also
determine the observed mechanical advantage by comparing the force required to lift an object to
the weight of the object.
Observed MA = 𝑤𝑒𝑖𝑔ℎ𝑡 𝑜𝑓 𝑡ℎ𝑒 𝑜𝑏𝑗𝑒𝑐𝑡
𝑚𝑒𝑎𝑠𝑢𝑟𝑒𝑑 𝑓𝑜𝑟𝑐𝑒 𝑟𝑒𝑞𝑢𝑖𝑟𝑒𝑑 𝑡𝑜 𝑙𝑖𝑓𝑡 𝑡ℎ𝑒 𝑜𝑏𝑗𝑒𝑐𝑡
OBJECTIVES
In this experiment, you will
investigate the force and the distance involved in moving an object up an incline.
explore the mechanical advantage provided by different pulley systems.
40
MATERIALS
board for inclined plane computers
Vernier force sensors meter stick
Vernier computer interfaces pole
clamp cart
pulleys string
weight ruler
PROCEDURE
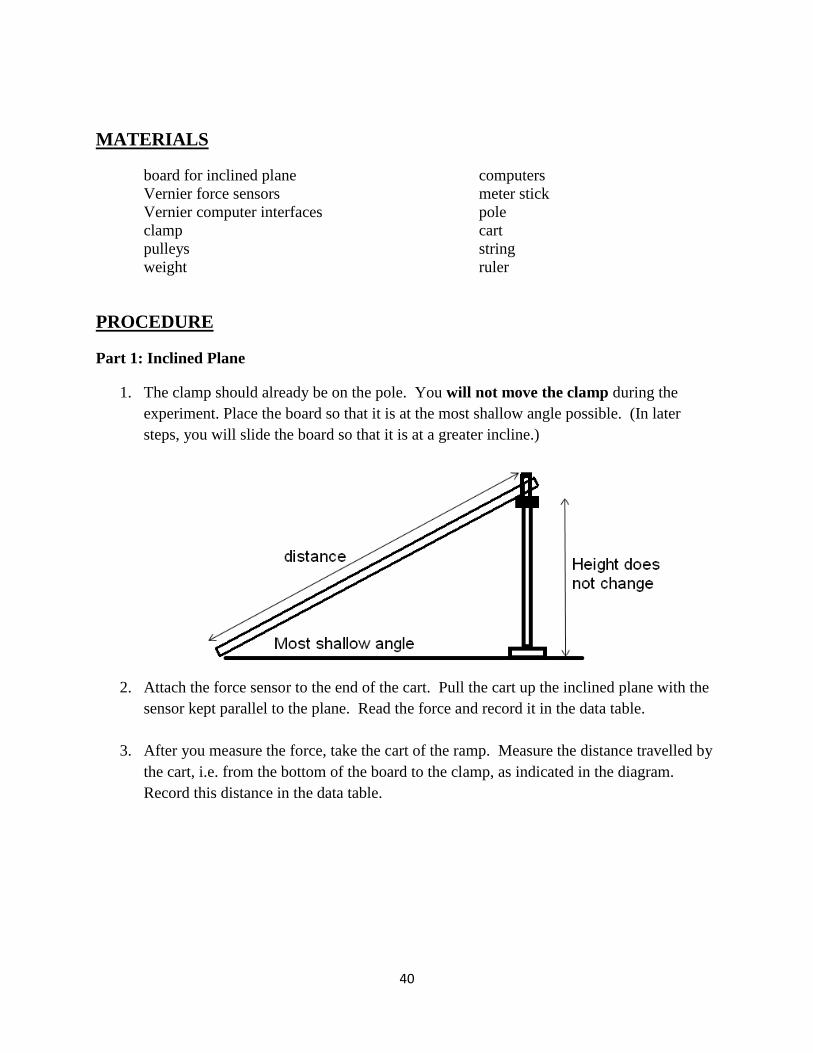
Part 1: Inclined Plane
1. The clamp should already be on the pole. You will not move the clamp during the
experiment. Place the board so that it is at the most shallow angle possible. (In later
steps, you will slide the board so that it is at a greater incline.)
2. Attach the force sensor to the end of the cart. Pull the cart up the inclined plane with the
sensor kept parallel to the plane. Read the force and record it in the data table.
3. After you measure the force, take the cart of the ramp. Measure the distance travelled by
the cart, i.e. from the bottom of the board to the clamp, as indicated in the diagram.
Record this distance in the data table.

41
4. Vary the angle while
keeping the height the
same by sliding the
board up or down along
the clamp to make 3
more angles of
increasing steepness.
Record the force and
distance each time. Use
the diagram for
clarification. Remember,
the distance will be
different every time, but not the height.
Part 2: Pulleys3
#1: Single Fixed Pulley #2: Single Fixed, Single Moveable #3: Double Fixed, Single Moveable
1. Weigh the metal weight using the force sensor by hanging it on the end. Record the
weight in the data section. It is the same for all three setups.
2. You will be making the three pulley configurations as shown above. If you have not
already, fill in the theoretical MA for each of the three configurations.
3 Pulley lab: http://teachingphysics.wordpress.com/2009/03/19/pulley-lab-mechanical-advantage/

42
3. For each configuration, you will
a. lift the load 20.00 cm.
b. measure the force required to lift the weight using the force sensor.
c. measure the how far the string was pulled during the same lift, using markers
and measured with the ruler. (See next step.)
4. In the starting position, use a marker to color the string in a specific spot in relation to the
pulley system, as instructed by your teacher. After the weight has been lifted, color the
string in the same relative location. To measure the distance that the string was pulled,
disassemble your pulley system and find the two colorings. Measure the distance
between them. Repeat this for the other two pulley setups.
Record all of this information in the data table.
DATA
Data Table 1: Inclined Plane
Angle (Increasing Order) Force (N) Distance (cm)
1
2
3
4
Data Table 2: Pulleys
Pulley
Configuration Theoretical
MA
Weight of the
Object
Force
Required to
Lift Weight
Height Lifted Length of
String Pulled
Single Fixed
20.00 cm
Single Fixed,
Single
Moveable
20.00 cm
Double fixed,
Single
Moveable
20.00 cm

43
CALCULATIONS
Part 1
1. Determine the work for each of the trials. W=Fd
Part 2
2. Calculate the observed MA for each pulley system using the formula provided in the
introduction.
3. Calculate the ratio of the length of string pulled to the height the object is lifted for each
pulley system.
Ratio: 𝑠𝑡𝑟𝑖𝑛𝑔 𝑝𝑢𝑙𝑙𝑒𝑑
ℎ𝑒𝑖𝑔ℎ𝑡 𝑙𝑖𝑓𝑡𝑒𝑑
QUESTIONS
Part 1
1. What pattern or relationship do you find between the forces and the distances?
2. How did the amount of work compare for each of the four trials? How should it
compare?
3. Would the amount of potential energy of the cart at the top of the ramp (i.e. at the clamp)
be different depending on the angle of the path taken to reach the top of the ramp?
Part 2
4. Compare the observed MA (Calculation #2) to the theoretical MA (filled in before lab)
for each pulley system.
5. Compare the ratio (Calculation #5) of string pulley/height lifted to the theoretical MA
(filled in before lab) for each pulley system.
6. How does this ratio (Calculation #5) relate to the formula you learned for mechanical
advantage that contains din and dout? Be specific.
PRE-LAB QUESTIONS
1. How does a ramp affect the force and distance that would be applied in lifting an object
vertically?
2. How will you vary the distance travelled by the cart in Part 1?
3. How do machines affect the work done?
4. Explain clearly the difference between a fixed and a moveable pulley.
5. Fill in the theoretical mechanical advantage for each of the pulley systems you will be
making in this experiment. You may need to read the introduction for help. Also write
your answer on the pre-lab.

44
EXPERIMENT 9
Sound Waves: Mach One
You are familiar with many applications of resonance. You may have
heard a vase across the room rattle when a particular note on a piano was
played. The frequency of that note was the same as the natural vibration
frequency of the vase. Your textbook has other examples of resonating
objects.
Gases can resonate as well. A vibrating tuning fork held over an open
tube can cause the air column to vibrate at a natural frequency that
matches the frequency of the tuning fork. This is resonance. The length
of the air column can be shortened by adding water to the tube. The sound
is loudest when the natural vibration frequency of the air column is the
same as (resonates with) the frequency of the tuning fork. For a tube open
at one end and closed at the other, the lowest frequency of natural
vibration is one for which the length of the air column is one fourth the
wavelength of the sound wave.
In this experiment, you will use the concept of resonance to determine the wavelength of a sound
wave of known frequency. You can then compute the speed of sound by multiplying the frequency
by the wavelength.
OBJECTIVE
In this experiment, you will determine the speed of sound using the concept of resonance.
MATERIALS
resonance tube (approx. 50 cm long) meter stick
one-liter plastic graduated cylinder tuning forks of 256 Hz or more
rubber band thermometer
PROCEDURE 1. Measure and record the temperature in the laboratory.
2. Fill the graduated cylinder with water to about two thirds of its capacity. Place the
resonance tube in the cylinder. You can vary the length of the air column in the tube by
moving the tube up or down.

45
3. Select a tuning fork and record the frequency imprinted on it in the data table under
“Tuning Fork 1.”
4. Strike the tuning fork on the heel of your shoe (NOT on the cylinder). Hold the tuning
fork about 1 cm above the open end of the tube, horizontally, with its tines one above the
other. Move both the fork and the tube up and down to find the air column length that
gives the loudest sound. (There are several loud spots.) Mark the water level on the tube
for this loudest sound with a rubber band stretched around the cylinder.
5. Measure the distance from the top of the resonance tube to the water-level mark. This is
the length of the air column. Record this measurement in the data table.
6. Measure the diameter of the resonance tube. Record this measurement in the data table.
7. Repeat Steps 2-5 for three additional tuning forks.
DATA
Room Temperature _________________________
Data Table: Tuning Fork Measurements
Tuning Fork 1 Tuning Fork 2 Tuning Fork 3 Tuning Fork
4
Frequency
(Hz)
Length of air
column (m)
Diameter of
resonance tube (m)
CALCULATIONS
1. Calculate the corrected length of the resonance tube for each tuning fork trial by adding
0.4 times the diameter of the tube to the measured length of the air column. This
corrected length accounts for the air just above the tube that also vibrates. Show your
work.
Corrected length = (measured length of the air column) + 0.4(diameter of tube)
2. The corrected length is one fourth of the wavelength of the sound vibrating in the air
column. Compute the wavelength of that sound for each tuning fork trial, showing your
work.
4(Corrected length) = sound wave’s wavelength
3. Using the frequency and the wavelength of the sound, compute the speed of sound in air
for each tuning fork trial. Show your work.
Wavespeed = frequency · wavelength

46
4. The accepted value for the speed of sound in dry air is 331 m/s at 0 °C. This speed
increases by 0.6 m/s for each additional degree Celsius above zero. Compute the
accepted value for the speed of sound in dry air at the temperature of your room.
5. How do your computed speeds of sound compare with the accepted value? To answer
this question, compute the percent error in the experimental value for each trial, using
your answer from Calculation #4 as the accepted value.
𝑝𝑒𝑟𝑐𝑒𝑛𝑡 𝑒𝑟𝑟𝑜𝑟 = 𝑒𝑥𝑝𝑒𝑟𝑖𝑚𝑒𝑛𝑡𝑎𝑙 𝑣𝑎𝑙𝑢𝑒 − 𝑎𝑐𝑐𝑒𝑝𝑡𝑒𝑑 𝑣𝑎𝑙𝑢𝑒
𝑎𝑐𝑐𝑒𝑝𝑡𝑒𝑑 𝑣𝑎𝑙𝑢𝑒· 100%
PRE-LAB QUESTIONS
1. What is resonating: the column of air or the water?
2. Why will you be calculating the “corrected” length?
3. Which is bigger: the corrected length of the resonance tube or the wavelength of the
sound wave that you will hear? By what factor is it bigger (this should be a whole
number)?
4. Read through the calculations. Why do you need to measure the temperature of the
laboratory? In other words, what does temperature affect?
5. Which of the three calculated values should be the same for all trials: the corrected length
of the tube, the wavelength of the sound wave, or the speed of the sound in air? Defend
your answer.

47
EXPERIMENT 10
Lenses and Images4
Pretend you are an optical engineer for a camera company. You have been given a lens for
which your job is to figure out the focal length. Based on the specifications you obtain by doing
an experiment, a new model of camera will be designed that uses that lens.
The shape of a lens determines the size, position, and types of images that it may form. When
parallel rays of light from a distant object pass through a converging lens, they come together to
form an image at a point called the focal point. The distance from this point to the lens is called
the focal length. In this experiment, you will find the focal length of a lens. Then, verify this
value by forming images, measuring distances, and using the lens formula below.
1
𝑑𝑜+
1
𝑑𝑖=
1
𝑓
where do = object distance
di = image distance
f = focal length
OBJECTIVES
In this experiment, you will
observe images formed by a converging lens.
measure the distances of objects and images from the lens.
analyze your results to determine the focal length of the lens.
MATERIALS
candle screen lens meter stick
PROCEDURE
Part 1: Determining Focal Length
1. Stand on the side of the room closer to the windows. Point the meter stick at a tree. Hold
the screen at the end of the meter stick closer to you, further from the window.
2. Slide the lens along the meter stick (between the window and the screen) until a clear image
of the tree forms on the screen.
3. Measure the distance between the lens and the screen in centimeters. This distance is the
focal length of the lens. Record it in the data section.
4 Experiment from Holt, Physical Science.

48
Part 2: Forming Images
4. Set up the equipment as illustrated in the figure. Place the lens more than twice the focal
length from the light source and keep it at that position.
5. Move the screen along the meter stick until a clear image forms. Record the distance from
the light to the lens, do, and the distance from the lens to the screen, di, in centimeters as
Trial 1 in the data table. Also record the height of the object and of the image in
millimeters. The object in this case is the flame. Be careful not to burn the meter stick.
6. For Trial 2, place the lens exactly twice the focal length from the candle and keep it at that
position. Slide the screen along the stick until a clear image is formed, as in Step 5. Record
the distances from the screen and the sizes of the object and image as you did in Step 5.
7. For Trial 3, place the lens at a distance from the object that is greater than the focal length
but less than twice the focal length. Adjust the screen and record the measurements as
you did in Step 6.
DATA

49
Focal length, f = ________________________
Measurements of Object and Image Distances and Sizes
Object distance,
do (cm)
Image distance,
di (cm)
Size of object
(mm)
Size of image
(mm)
Trial 1
Trial 2
Trial 3
CALCULATIONS
1. Calculate 1
𝑑𝑜 and
1
𝑑𝑖 . Add your results to get
1
𝑑𝑜+
1
𝑑𝑖 .
2. Calculate 1
𝑓 using the focal length obtained in Part 1 of the procedure.
Calculation Results:
1
𝑑𝑜
1
𝑑𝑖
1
𝑑𝑜+
1
𝑑𝑖
1
𝑓
Trial 1
Trial 2
Trial 3
QUESTIONS
1. According to the formula in the introduction, 1
𝑑𝑜+
1
𝑑𝑖 should equal
1
𝑓 . How do your results
compare?
2. If the object distance is greater than the image distance, how will the size of the image
compare with the size of the object?
PRE-LAB QUESTIONS
1. What is focal length?
2. What kind of lens is used in this lab? What does it do to incoming parallel rays?
3. If the focal length of your lens happened to be 15 cm, give sample object distances that you
could use for Trials 1, 2, and 3 respectively.
50
EXPERIMENT 11-1
Electricity: A Qualitative Approach
We often take our electrical devices for granted. Imagine a day without any cells phones or
televisions running in the dining hall. In this experiment, you will construct circuits yourself and
practice translating real-world objects into circuit diagrams using the conventions you have
learned in class. By manipulating the circuits, you will see how small changes can have greater
effects on the function of the circuit.
OBJECTIVES
In this experiment, you will
set up circuits using the guidebook.
sketch circuit diagrams.
manipulate the circuits to explore changes in the flow of current.
MATERIALS
snap-circuit kit
PROCEDURE
You may jot answers to the proposed questions within the procedure section. There is room for
circuit diagrams in the observations section.
Project 2
1. Set up Project 2. Sketch your circuit using circuit diagram conventions.
2. Turn the switch on. Describe what happens.
3. Flick the fan. Does it fly?
4. Turn the switch off, reverse the motor, and turn it on. Flick the fan. Does it fly?
5. Examine the fan blades and offer an explanation of your results.
Project 5
6. Set up Project 5. Sketch your circuit using circuit diagram conventions.
7. Turn it on and describe what happens. Offer an explanation.
Project 6
8. Set up Project 6. Sketch your circuit using circuit diagram conventions.
9. Turn it on and describe what happens.
10. Flick the fan. Does it fly?
11. Reverse the motor, flick the fan again (you might not need to). Does it fly?
12. Rearrange your circuit so that the switch turns off only the fan, but the light stays on.
Feel free to use more circuit parts. Both the light and the fan must be part of a closed
circuit. Sketch your circuit using circuit diagram conventions

51
OBSERVATIONS
Project 2 Circuit Diagram
Observations and Propositions for Project 2
Step 2: With
switch on
Step 3: Fan
flicked
Step 4: Motor
reversed and
fan flicked
Step 5:
Proposed
explanation
Project 5 Circuit Diagram

52
Observations and Propositions for Project 5
Step 6: With
switch on.
Proposed
explanation.
Project 6 Circuit Diagram
Observations and Propositions for Project 6
Step 9: With
switch on
Step 10: Fan
flicked
Step 11:
Motor
reversed and
fan flicked
Step 12 Circuit Diagram:
53
QUESTIONS 1. Compare your observations for Projects 2, 5, and 6. Comment on similarities and
differences. Offer explanations.
2. Including your rearrangement in Step 12 of the procedure, which of the four circuits are
in series and which parallel?
3. What is the relationship between voltage, current, and resistance?
4. How does the location of the switch affect the circuit? Use you rearrangement as an
example in explaining your answer.
PRE-LAB QUESTIONS 1. Describe the difference between a series and a parallel circuit.
2. Draw the symbol for a light bulb, a battery, and a resistor that is used in circuit diagrams.

54
EXPERIMENT 11-2
Electricity: A Quantitative Approach
In this experiment, you will build circuits and examine how current, voltage, and resistance are
related to one another. You will measure current with a device called an ammeter. Batteries will
serve as a voltage source and light bulbs will be a part of the circuits with resistance.
Before starting the lab, assign each person in the group a job. If there are more than four people
in a group, Reader/Recorder and Reporter/Lab Assistant can be split into two jobs.
Lab Roles:
Group Manager – this person is going to the lead the group for the day. It is this person’s
responsibility to make sure that the group stays on task, completes all the tasks in the time given,
and asks the teacher if there are any questions. This is the only person who can ask the teacher
questions.
Name:
Reader/Recorder – this person will read the directions aloud to the group. This person will
also be responsible for writing down the group’s data and answers to questions. However, all
group members’s are responsible for contributing to answers and must copy answers/data after
the lab is completed. Any whiteboarding that needs to be done to share out will be completed by
the Reader/Recorder.
Name:
Lab Coordinator – this person is responsible for collecting, caring for, and returning the
materials. This person will be the main experimentalist and will follow the directions given by
the Group Manager and Reader. The lab coordinator will carry out the procedure.
Name:

55
Reporter/Lab Assistant – this person’s first duty is to aid the lab coordinator as most
experiments require two sets of hands. Secondly, when sharing out, the Reporter will deliver
results to the class and answers questions other classmates may raise.
Name:
OBJECTIVE
In this experiment, you will quantitatively analyze the relationship between current, voltage, and
resistance through measurements and graphs.
MATERIALS
ammeter computer
light bulbs batteries
wires
PROCEDURE
Part 1: Series Circuits
1. Your teacher will put on the board the voltage supplied by the
batteries and resistance in one light bulb. Record those in the
data section.
2. Connect a light bulb in series with an ammeter and the batteries
as shown in the diagram above. Remember that an ammeter
measures current. Record the current the ammeter measures in
the data table.
3. Do this again, each time connecting more light bulbs in series until there are 4 light bulbs
in the circuit. Record the current each time.
Part 2: Parallel Circuits
4. Connect a light bulb with an ammeter and the batteries as before. Remember that an
ammeter measures current. Record the current the ammeter measures in second data
table.
5. Do this again, each time connecting more light bulbs in parallel until there are 4 light
bulbs in the circuit. Record the current each time.
6. Continue to the “Processing the Data” section.

56
DATA
Voltage from batteries: ___________________
Resistance in one light bulb: __________________
Data Table 1: Series Circuits
Trial # # of light bulbs Total Resistance (Ω) Current (A)
1 1
2 2
3 3
4 4
To get the total resistance in a series circuit, add up the resistance of each light bulb. (Rtot =
R1 + R2 + etc.)
Data Table 2: Parallel Circuits
Trial # # of light bulbs Total Resistance (Ω) Current (A)
1 1
2 2
3 3
4 4
This time, getting the total resistance is a bit trickier. Ask your teacher for help with the
calculation. The formula is below.
1/Rtot = 1/R1 + 1/R2 + etc.
GRAPHS
Part 1: Series Circuits
1. On the computer, plot the Current on the y axis and the Total Resistance on the x axis.
2. Describe the curve/line that is formed by this plot. What kind of relationship exists
between current and resistance? Sketch your graph below.

57
Part 2: Parallel Circuits
3. On the computer, plot the Current on the y axis and the Total Resistance on the x axis.
4. Describe the curve/line that is formed by this plot. What kind of relationship exists
between current and resistance? Sketch your graph below.
5. What happens if you multiply the Current and Total Resistance for any of the points on
the graph? Do so for a few of the points. How does it compare to the value of the
batteries’ voltage?
QUESTIONS
What must be true about the resistance of the ammeter if we are not considering it when we
calculate the total resistance?
PRE-LAB QUESTIONS
We will be connecting light bulbs, batteries, and meters in a circuit and looking at how different
arrangements change the properties of the circuit.
1. Write a sentence describing current to someone who has never taken physics.
2. In our circuits, the power to light a light bulb comes from the battery. Where do most
light bulbs get their power from?
3. What is Ohm’s Law? Explain the relationship with words.
4. A light bulb is most nearly what kind of equipment that we draw in circuit diagrams?
How do you know?
5. What does it mean to put resistors in series? What do you think will happen to brightness
if we put two light bulbs in series?
6. What does it mean to put resistors in parallel?

58
EXPERIMENT 12
Chemistry Skill-Building5
Techniques used in different fields of science vary greatly. The skills you have developed during
physics experiments will serve as a foundation and a jumping point for learning additional
practices used in chemistry. In this experiment, you will be introduced to new equipment. You
will identify its purpose and practice using some of it so that you will be more comfortable using
it in future experiments.
Volume is a three-dimensional measurement that tells us how much space something is taking
up. Some units that we will use include liters (L), milliliters (mL), and cubic centimeters (cm3).
1 mL is the same volume as 1 cm3. To measure volume, we will most frequently use a graduated
cylinder.
Mass tells you how much matter is in an object. Early in the school year you used a triple-beam
balance and a digital balance to measure mass. Both of those gave you a number with units of
grams (g). When discussing the mass of a person, kilograms (kg) would be a more convenient
unit.
A Bunsen burner is a metal device connected to a gas line via rubber tubing that provides a
controlled, variable flame. By adjusting the bottom portion, the flame will become stronger or
weaker. To light the burner, the gas line must be on and then a match or lighter can ignite the
gas. It is important that the gas never be on unless the Bunsen burner is about to be lit.
Sometimes liquids contain particles of solids that are not dissolved. Fine particles or particles
that settle slowly are often separated from a liquid by filtration. Filtration is a technique that we
will use to separate a solid from a liquid or a solution (a kind of mixture where something is
dissolved, like salt water). A piece of filter paper will be folded in such a way that the liquid
portion can pass through but solids are left behind. The liquid or solution that passes through is
called the filtrate.
You will also answer safety questions that will, in part, re-familiarize you with equipment in the
laboratory. Because you use many chemicals in the chemistry laboratory, it is important to know
something about them. Most chemicals are dangerous – e.g., poisonous when they enter the
body, burn or irritate the skin, eyes and/or membranes of your digestive and respiratory tracts.
Some chemicals destroy fabrics, especially synthetic or protein fibers. Chemicals can even make
some things burn. Generally, most chemicals combine at a reasonable rate; however, under
5 Sections from Bolton, Ruth P., Lamphere, Elizabeth V., and Menesini, Mario. (1979). Laboratory Experiments in ACTION CHEMISTRY.
Holt, Rinehart and Winston, Publishers, New York. p. 4-10.

59
certain conditions they can get out of control. Knowing these things about chemicals helps you
to prevent accidents and to work safely in the laboratory. Besides safety equipment, you will
also learn the names and purposes of other tools used in chemistry experiments.
OBJECTIVES
In this experiment, you will
practice techniques and taking measurements with the correct number of significant
figures.
become comfortable and familiar with safety equipment and tools for future experiments.
understand the purpose of various safety practices.
MATERIALS
graduated cylinders sugar water solution
balances beakers
evaporating dish spatula
sodium chloride Bunsen burner/matches
ring stand/iron ring wire gauze
thermometer sand-water mixture
filtration setup, including funnel, filter paper, pipestem triangle, ring stand, iron ring
other various pieces of laboratory equipment
including tongs, stirring rod, forceps, test tube clamp, test tubes, test tube rack,
test tube brush, watch glass

60

61

62
PROCEDURE
This experiment is set up in stations. You may not complete the stations in order, but you will
complete all of them.
Station 1: Volume
1. At your station, there is a graduated cylinder containing water. You will be reading the
volume of the water in milliliters (mL).
2. Examine the graduated cylinder containing water.
Determine how many milliliters each line represents.
3. Look carefully at the scale. Some graduated cylinders
are marked differently.
4. In order to correctly read the volume, you will
have to lower your eye level. You should not
pick up the graduated cylinder to read it, for
two reasons. First, your hand is not as steady as
the bench and the level of the liquid will
change. Second, there is a danger of spilling
the contents, which may be harmful.
5. Read at the bottom of the meniscus (the curved
surface of the liquid).
6. The meniscus diagram reading has increments of 1 mL. The
bottom of the meniscus is on the 11 mL line. When taking a
measurement, you always include one estimated digit. In this example, since it is right on
the line, the correct reading would be 11.0 mL. If it is between the lines, you have to
estimate the last digit. If the increments are 0.5 mL each, then estimate to the tenths
place.
7. Record your volume reading of the graduated cylinder on your bench. Write it in the data
section.

63
8. There is a second, empty graduated cylinder at your station. Try to measure out 10 mL of
the sugar water solution at your station. If you go over the 10 mL line, do NOT pour the
sugar water back in the container. It is considered contaminated and should go down the
sink (NOTE: It is safe for sugar water to go down the sink. Always check with your
instructor before disposing of chemicals in this way.).
9. Record your actual volume reading for the sugar water. It’s okay if it is not exactly 10
mL.
Station 2: Mass
5. Examine the balance at your bench.
a. The ON/OFF button is self-explanatory. At the end of a lab period, balances
should be turned off to conserve battery. You need to hold down the power
button to do this.
b. The display should be show a ‘g’ for grams. If it does not, switch the mode until
it does. Having the wrong unit is like stepping on a scale in Europe and thinking
you weight 56 lb instead of 56 kg!
c. There is also a ZERO button.
6. Often times in chemistry, we want to know the mass of a substance but we cannot
directly place that material on the balance. This situation is especially true for liquids,
but it is also bad practice to pour solids on the balance. The ZERO button is crucial to
solving this inconvenience.
7. Make sure the balance is on and reads 0.0 g. If it does not, hit the ZERO button.
8. Place the evaporating dish on the balance and hit the ZERO button. You are essentially
telling the balance not to include the mass of the beaker in the measurement.
9. Using the spatula, try to measure out 1.3 g of sodium chloride. Add slowly to the dish. If
you go over 1.3 g, do NOT add it back to the container. The sodium chloride is
considered contaminated and the extra should go in the trash can.
10. Record the reading on the balance in the data section. Since it is digital, you do not add
an estimate.
Station 3: Bunsen burner
1. Fire requires three parts: (1) heat, (2) fuel, and (3) oxygen. Remove any one of these and
the fire will be extinguished. There are several styles of burners available but all share
the combining of heat, fuel, and oxygen. In this class, you will use a Bunsen burner.
2. Gas intake can be adjusted at the main gas valve or by a valve at the base of the burner.
Oxygen intake can be adjusted at the air intake. The style of the burner and the source of
heat will determine the steps you follow.

64
The hottest part of any flame is the tip of the inner blue cone.
3. Rubber tubing connects the burner to the gas valve.
4. Strike match.
5. Turn on the main gas valve. The handle needs to
be parallel to the rubber tubing.
6. Bring lighted match up to the chimney to ignite
the gas. (If you smell gas, turn off the main gas
valve and wait a couple of minutes for the odor to
dissipate.)
7. Adjust the height of the flame with the main gas
valve. Turn off the gas valve to turn the flame off.
8. Each partner should feel comfortable with each step. Switch roles to practice.
9. Place the Bunsen burner on the base of the ring stand so that it is right under the beaker.
10. Record the initial temperature of the water in the data section.
11. Light the Bunsen burner and heat the water up about 5 °C. Monitor the temperature with
the thermometer and record the final temperature in the data section. Turn off the gas
after heating the water.
Station 4: Filtration6
1. Fold a piece of filter paper in half. Now fold it again in quarters.
2. Hold the folded paper so that the point is facing down and look at
it from above. You should be able to distinguish 4 flaps of paper.
3. Take three of the flaps to one side, separated from one of the
flaps. Your filter paper should now look like a cone.
4. Place the filter paper in the funnel. (You may have to hold it there
until you start pouring.)
5. Place the funnel in the pipestem triangle, which should be sitting
on the iron ring.. Make sure there is a beaker under the funnel to
catch the filtrate.
6. There is a mixture at your station (sand and water). Gently swirl
the mixture and pour it into the filtration setup. Try to pour while the sand is suspended
in the water. If some sand remains in the beaker, you can add water to try to flush it out.
This technique gets easier with practice. Each partner should try. If sand leaks through,
it means that the mixture is not being poured directly into the filter paper.
6 Diagram: http://seattlecentral.edu/faculty/ptran/pix/fold.jpg

65
7. When you are finished, put as much of the filtered sand back in the filtrate (water) as you
can for the next group. Discard the filter paper.
Station 5: Safety
Answer the safety questions in the Questions section.
Station 6: Chemistry Equipment and Tools
Try to identify the equipment on the lab bench. Then, using the equipment diagram in
the Materials section, answer the equipment questions in the Questions section. Lastly,
identify each of the pictures in that section.
DATA
Station 1: Volume
Volume measurement for water: ___________________________
Volume measurement for sugar water: ___________________________
Station 2: Mass
Mass of the sodium chloride: ___________________________
Station 3: Bunsen burner
Initial temperature of water: ___________________________
Final temperature of water: ___________________________
QUESTIONS
1. What unit does a graduated cylinder give volume in?
2. What does the ZERO button do on a balance?
3. How do you turn off a Bunsen burner?
4. When filtering, why do you have to put a beaker under the funnel?

66
Station 5: Safety
5. While you are working in the laboratory, why should you
a. wear safety goggles?
b. wear a laboratory apron?
c. use only the amounts and materials given in the directions?
d. use clean glassware?
6. Why are unused chemical never returned to their original containers?
7. Why are bottles of chemicals kept tightly closed except when a quantity of chemical
is being removed?
8. Why should the teacher be informed if you are wearing contact lenses?
9. How should you dispose of chemicals that you used in the experiment?
10. If your skin itches, burns or appears red while you are using chemicals, what should
you do?
11. What procedures should you follow to
a. report an accident resulting in injury to you or someone else?
b. report spilling a chemical or breaking equipment?
c. cope with a fire on your laboratory bench?
d. dispose of cracked or broken glassware?
12. Where are the following items located in the laboratory?
a. Fire extinguisher:
b. Fire blanket:
c. Shower:
d. Eye wash device:
13. Why is it important to work in a business-like manner, quietly, and with a minimum
of distraction or migration around the classroom?

67
14. What is the meaning of the following words often found on the labels of chemicals?
a. Caustic:
b. Corrosive:
c. Hazardous:
d. Volatile:
15. Why are you not allowed to eat or drink anything in the chemistry classroom?
16. Why should you read the label on a bottle twice before using its contents?
17. A cap, cork, or stopper from a bottle of liquid is not put down on a desk while you are
pouring out some of the liquid. Why?
18. Explain the statement: “You are only as safe as the LEAST safe person in the
laboratory.”
Station 6: Equipment
19. Name the apparatus or glassware that is used.
a. to pick up and hold apparatus?
b. to clean glassware?
c. as a cover for a beaker?
d. to transfer solid chemicals in massing?
e. as a container for small amounts of
liquid being evaporated?
f. to grind chemicals to a powder?
g. to measure a volume of a liquid?

68
h. to measure length?
i. to measure mass?
20. Identify each of the following items.
a.
b. c.
d. e. f.
g. h. i.
j. k.
PRE-LAB QUESTIONS
1. Define the following terms:
Volume, Mass, Bunsen burner, Filtration, Filtrate
2. Give two reasons why safety in the laboratory is important.
3. Familiarize yourself with the equipment diagrams provided in this experiment.

69
EXPERIMENT 13
Thermal Energy from Foods
You use food as fuel for your body. Food contains the stored energy you need to walk, run,
think, and so on. To keep your body process going, your body must release the energy stored in
food by digesting the food.
You cannot directly measure the energy contained in food. However, you can determine the
amount of thermal energy released as a sample of food is burned by determining the thermal
energy absorbed by water heated by the burning sample. The water absorbs the energy released
by the burning sample. By measuring the temperature change of a given mass of water, you can
calculate the energy released from the food sample. Raising the temperature of 1 gram of water
by 1 degree Celsius requires 4.19 joules of energy. This information can be expressed as the
specific heat of water:
cwater = 4.19 𝐽
𝑔·°𝐶
It is easier to measure information about water than about the unfamiliar food sample. You will
use your knowledge of water to figure out the energy released by the food sample. Since the
energy released by the food should be absorbed by the water, the absolute values of energy
absorbed and released are equal:
|𝑒𝑛𝑒𝑟𝑔𝑦 𝑟𝑒𝑙𝑒𝑎𝑠𝑒𝑑| = |𝑒𝑛𝑒𝑟𝑔𝑦 𝑎𝑏𝑠𝑜𝑟𝑏𝑒𝑑|
You can use the following equation to determine the value of the heat (Q) released when a food
sample is burned:
Q = mwcwΔT = mwcw(Tf – Ti)
where Q is the energy absorbed by the water, mw is the mass of the water, cw is the specific heat of
water, and ΔT is the change in temperature of the water.
OBJECTIVES
In this experiment, you will
calculate a change in thermal energy.
determine the heat absorbed per gram of food burned.
relate chemical concepts to nutritional information on the foods you eat.

70
MATERIALS
flask paper clip
ring stand/iron ring wire gauze
food samples thermometer
evaporating dish wood splint
matches balance
graduated cylinder
PROCEDURE
1. Straighten the paper clip and insert it through the first food sample. Balance the paper clip
across the evaporating dish. Measure the mass of the sample, paper clip, and evaporating
dish and record it as mis (initial mass of the sample) in the data section.
2. Place the clean, dry flask on the balance and hit the “zero” button.
3. Measure 50 mL of water using the graduated cylinder.
4. Pour the water into the flask on the balance. Record the reading on the balance, which is
the mass of the water, in the data section as mw.
5. Place the flask on the wire gauze as shown by your instructor. Measure the temperature of
the water. (Remember, your measurement should include all of the digits that the tool
provides plus one estimated digit.) Record this temperature as Ti.
6. Light the wood splint with a match. Use the burning splint to ignite the food sample. Once
the food sample is burning, safely extinguish the splint. Position the evaporating dish under
the flask. The water in the flask should absorb most of the energy released by the burning
food.
7. Gently stir the water with the temperature probe and closely observe the temperature rise.
8. Blow out the flame of the burning food after about 2 minutes. (Your sample might take
more or less time: try to burn as much of it as possible.) Record the highest temperature
of the water during the 2 minutes as Tf.
9. Allow the evaporating dish and its contents to cool. Determine the mass of the dish, paper
clip, and remaining food sample. Record this value as mfs (the final mass of the sample).
10. Repeat Steps 1-9 for a different food sample. Wipe off the paper clip so that no residual
food from the first trial remains. Be sure to clean out the evaporating dish and get new
water for the flask.

71
DATA
Food
Sample
Mass of Sample Set-up
(g)
mis mfs
Mass of water (g)
mw Temperature of Water (°C)
Ti Tf
CALCULATIONS
Remember to label each calculation and to show all work, including formulas and units.
1. Calculate the change in temperature, ΔT, for each trial.
2. Use the equation given in the introduction to calculate the energy absorbed by the water
for each trial. Be sure to use the mass of the water, NOT the mass of the food sample set-
up.
3. Calculate the mass of the food that was burned by subtracting the final mass from the initial
mass. (Note that this calculation, ‘initial – final,’ is a bit “backwards” because we want a
positive answer. (mis – mfs) will tell us the mass of food burned.)
4. Calculate the heat absorbed per gram of food burned by dividing the energy absorbed by
the water by the mass of food burned. Don’t forget a unit! It will become evident when
you do the calculation.
heat absorbed per gram of food burned = 𝑄
𝑚𝑖𝑠−𝑚𝑓𝑠
5. Suppose 20.0 g of your first food sample is burned completely. Use your result from #4
above to calculate the value of energy released in this situation. (You know the heat
released PER ONE GRAM of food burned. How much will be released if you burned 20.0
g?)
QUESTIONS
1. In order to calculate the amount of energy released or absorbed by a substance, what
information do you need?
2. What measurement did you take that proves energy is being transferred in this experiment?
3. Did you measure information to directly calculate the energy released by the food sample
or the energy gained by the water?
4. Most of the energy of the burning food was absorbed by the water. What do you think
happened to the small amount of energy that was not absorbed by the water?
5. Look at the results of your calculations. Which food sample released
b. the most energy?
c. the most energy per gram of food burned?

72
PRE-LAB QUESTIONS
1. Why does the temperature of the water increase? Be very specific.
2. Consider the specific heat of water. How much energy would it take to raise the
temperature of 2 g of water by 1 °C? You can do the full calculation or you could try to
figure it out intuitively.
3. Why is it important to position the evaporating dish right below the flask of water?

73
EXPERIMENT 14
Properties of Matter
Everything that has mass and takes up space is called matter. Matter exists in four different
states: solid, liquid, gas, and plasma. This paper, your hand, water, and the air you breathe all
consist of matter. Even the planets and stars are made of matter.
Scientists use two types of properties to describe matter. Physical properties depend on the
nature of the matter. They are observed when there is no change in chemical composition. The
physical properties of water describe it as a colorless, nonmagnetic liquid between the
temperatures of 0 °C and 100 °C with a density of 1.0 g/mL. Chemical properties describe the
change in chemical composition of matter due to a chemical reaction. A chemical property of
water is its reaction with iron to form rust.
Matter is constantly changing. A physical change involves a change in shape, size, state, and so
on. When a material changes composition, a chemical change occurs.
OBJECTIVES
In this experiment, you will
find the density of salt water and of solid samples.
classify materials by states of matter.
identify physical and chemical properties.
distinguish between physical and chemical changes.
MATERIALS
table salt (sodium chloride, NaCl) graduated cylinder
beaker balance
stirring rod funnel
copper strip wood sample
iron sample rubber sample
magnet sugar solution
matches test tubes
chalk starch solution
iodine solution hydrochloric acid, HCl

74
PROCEDURE
Part 1: Density of Salt Water
1. Measure approximately 10 g of table salt into the beaker.
2. Measure 50 mL of water and pour it into the beaker. Stir the mixture thoroughly so that
all of the salt dissolves.
3. On the balance, “zero” the mass of the clean, dry graduated cylinder.
4. You are going to measure the mass and volume of five amounts of the salt water. Using
the funnel placed in the graduated cylinder, pour a small amount of the mixture (no more
than 15 mL) into the graduated cylinder.
5. Remove the funnel. Measure and record the mass and volume of this first sample in Data
Table 1.
6. Add some more salt water to the graduated cylinder. Measure and record the mass and
volume again. Do this three more times (a total of five samples).
Part 2: Density of Solids
7. There are two solids at your bench. Start with the cube and measure its mass. (Make sure
you have reset your balance.) Record the mass in Data Table 2.
8. Measure the dimensions of the cube so that you can calculate its volume. (Volume =
length*width*height). Record the information in the data table.
9. Measure and record the mass of the cylindrical solid.
10. To measure the volume of the cylinder, you will see how much water it displaces. Put 30
mL of water in the graduated cylinder. (It is not essential to have exactly 30 mL, but be
sure to note the exact amount of water you have on your data table). Slide the metal
cylinder along the side of the graduated cylinder into the water (to avoid water splashing
out or breaking the glass). Record the new volume of both the water and metal cylinder.
The difference is the volume of the cylinder.
Part 3: Physical Properties of Four Samples
11. Examine the samples of iron, wood, rubber, and copper. In Data Table 3, describe the
physical properties listed and any other properties you can readily observe.
12. Test each sample for its attraction to a magnet. Record your observations in Data Table 3.
13. Use each sample to complete the circuit provided. Record whether the sample conducts
electricity in the data table.
Part 4: Chemical Properties
14. Organize three clean, dry test tubes in your test tube rack.
15. One partner should be ready to light a match. Add about half an inch of hydrochloric
acid to the first test tube.
16. Make observations of the appearance of both hydrochloric acid and chalk, before they are
mixed.
17. Place a small amount of chalk in the acid and observe what happens. Light the match and
hold it directly inside the mouth of the test tube (without dropping it in). Record all of
your observations in Data Table 4.
18. In the second test tube, add 10-15 drops of starch solution.
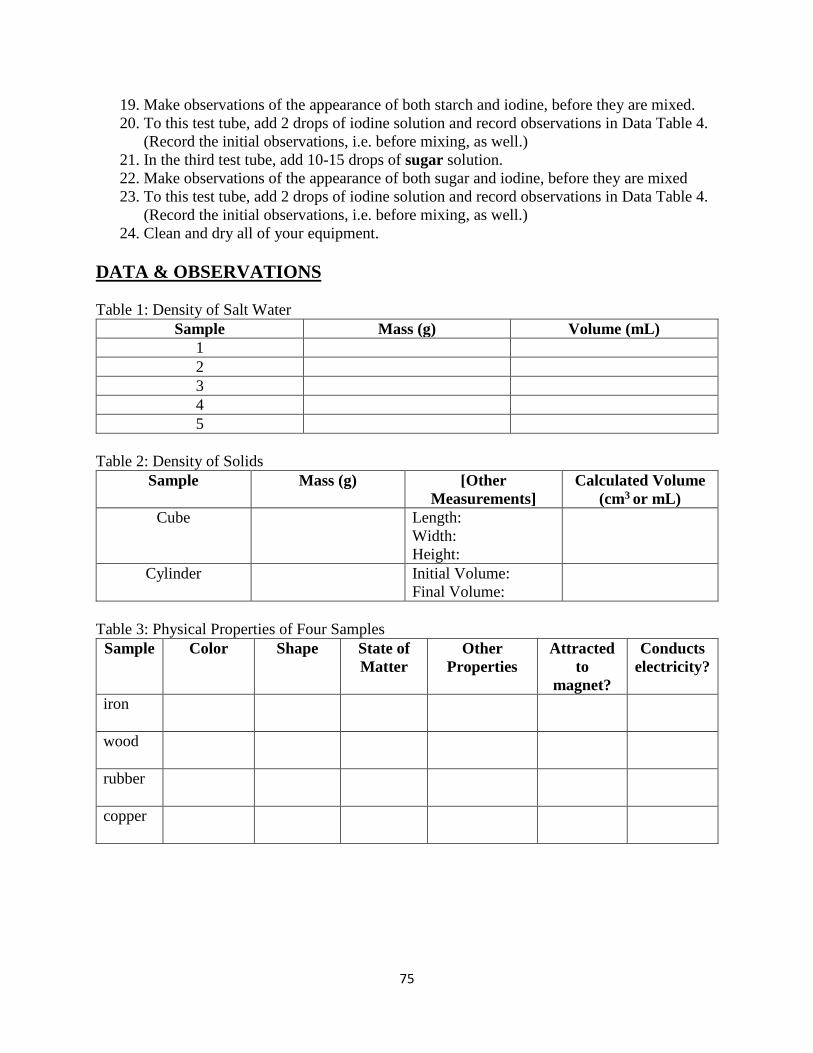
75
19. Make observations of the appearance of both starch and iodine, before they are mixed.
20. To this test tube, add 2 drops of iodine solution and record observations in Data Table 4.
(Record the initial observations, i.e. before mixing, as well.)
21. In the third test tube, add 10-15 drops of sugar solution.
22. Make observations of the appearance of both sugar and iodine, before they are mixed
23. To this test tube, add 2 drops of iodine solution and record observations in Data Table 4.
(Record the initial observations, i.e. before mixing, as well.)
24. Clean and dry all of your equipment.
DATA & OBSERVATIONS
Table 1: Density of Salt Water
Sample Mass (g) Volume (mL)
1
2
3
4
5
Table 2: Density of Solids
Sample Mass (g) [Other
Measurements]
Calculated Volume
(cm3 or mL)
Cube Length:
Width:
Height:
Cylinder Initial Volume:
Final Volume:
Table 3: Physical Properties of Four Samples
Sample Color Shape State of
Matter
Other
Properties
Attracted
to
magnet?
Conducts
electricity?
iron
wood
rubber
copper

76
Table 4: Observations of Chemical Properties
Remember that observations are much more informative when there is an “initial
observation,” i.e. what the materials looked like before they were mixed together.
Record this information as well.
Material Reacting Observations
Before After
hydrochloric acid + chalk
starch solution + iodine
solution
sugar solution + iodine solution
CALCULATIONS & GRAPH Part 1
1. Make a graph of Mass (y) vs. Volume (x) and plot the data points. Be sure to label the
axes and title the graph. Draw a line of best fit. Calculate the slope (with appropriate
units). The slope is the density of salt water. Follow any instructions your teacher might
give.
Part 2
2. Calculate the density of the cube and that of the cylinder.
QUESTIONS Part 1
1. Do you think the density of salt water should be greater than or less than that of water?
Explain. Is your value greater than or less than that of pure water? (It’s okay if your
result doesn’t match what you think it should be. Defend your answer choice).
2. Using your graph, determine what the mass of 60 mL of salt water would be.
3. Would salt water float on water? Why or why not?
Part 2
4. Compare the density of the two solids. They are made of the same metal. Should the
densities be the same or different? Comment on your results (i.e. if the densities match or
not).
5. What would happen to the density of the metal cylinder if it were cut in half?
Part 3
6. What are two physical properties that iron and copper have in common?
Part 4
7. When you added the chalk to the hydrochloric acid, what type of change took place?
How do you know?
8. Which solution do you think had a chemical reaction with iodine: starch or sugar? Why?

77
PRE-LAB QUESTIONS 1. Is density a physical or chemical property?
2. What is the formula for density? Give sample units for each part of the formula.
3. Distinguish between a physical and a chemical property.
4. Your younger sibling really likes orange juice but drinks so much that the acid is a
problem. Your parent adds water to the juice so it’s not too strong.
a. What happens to the color of the orange juice if a lot of water is added?
b. Is mixing orange juice and water a chemical reaction?
5. In Part 1, what equipment are you using to get the volume?
6. In Part 2, name the two ways (tool/technique) you will use to get volume.

78
EXPERIMENT 15
Physical and Chemical Changes
Matter undergoes many changes. You are familiar with both physical and chemical changes. A
physical change is one that does not alter the identifying properties of a substance. In can be a
change in form, state, or energy level, but no “permanent” change occurs in the properties of the
substance, i.e. no change in the bonding. A piece of paper torn into two parts, for example, still
has the properties of the original paper and no new substance has been formed. Thus tearing a
piece of paper into two parts is a physical change. Evaporation, condensation, melting, freezing,
and dissolving are all examples of physical changes.
A chemical change is one that produces new substances with new properties. A piece of paper
that burns produces gases and ash that have different properties than the original paper, so this is
an example of a chemical change. Heat, light, and electricity often produce chemical changes.
Chemical changes occurs as (1) atoms combine to form new compounds, (2) compounds break
down into simpler substances, and (3) compounds react with other compounds or elements to
form new substances. In short, chemical bonds are broken and/or formed.
OBJECTIVES
In this experiment, you will
determine if certain changes in matter are physical or chemical changes.
support your determinations with evidence.
MATERIALS
sodium chloride, NaCl graduated cylinder
evaporating dish Bunsen burner
nichrome wire tongs
magnesium ribbon small test tube
dilute hydrochloric acid (HCl) solution silver nitrate (AgNO3) solution
funnel filter paper
ring stand/iron ring clay triangle
copper(II) chloride (CuCl2) solution beakers (100 mL and 250 mL)
aluminum foil balance
stirring rod wire gauze
watch glass

79
PROCEDURE
Part 1: Sodium chloride solution
1. Measure 2.0 g of sodium chloride in a clean, dry evaporating dish. Pour the NaCl into a
small, clean, dry beaker.
2. Measure 50 mL of water in the graduated cylinder. Pour the water into the beaker. Use
the stirring rod to help dissolve the NaCl. Note the approximate level of the solution in
the beaker (for later comparison).
3. Continue dissolved 2 g samples of NaCl until a total of 10 g are dissolved. Watch the
level of the solution after each addition. Be sure to stir so that all of the salt is dissolved.
4. Record your observations of the level of the solution in the observations section. (Does it
change? How?)
5. Clean out your evaporating dish.
6. Measure about 5 mL of the sodium chloride solution in the graduated cylinder. Pour the
sample of the solution into the evaporating dish. Make observations of the sample.
7. Place the evaporating dish above the Bunsen burner on the wire gauze. Light the burner.
8. Heat the solution until a dry solid remains. Record observations of the heating process
and of the solid.
Part 2: Heating wires
9. Carefully examine the nichrome wire sample, noting the color, luster, flexibility, and
other properties you can observe in the observations section.
10. Light the Bunsen burner. Hold the wire with tongs and heat it strongly in the flame of the
burner until it glows brightly. After the wire cools, again examine the wire, recording
the properties as you did before.
11. Carefully examine the magnesium ribbon sample, noting the color, luster, flexibility, and
other properties you can observe in the observations section.
12. Hold the ribbon with tongs and ignite the end in the flame of a burner. CAUTION: Do
not look directly at the magnesium while it is burning. Afterward, again examine the
magnesium, recording the properties as you did before.
Part 3: Silver nitrate and hydrochloric acid
13. Carefully pour silver nitrate solution into the small test tube so that is about one-third to
one-half full. Record the color of both this solution and the hydrochloric acid, before
mixing.
14. Add several drops of dilute hydrochloric acid solution, gently swirling the mixture with
the addition of each drop. Record your observations.
15. Filter the solid that forms (the precipitate), using small amounts of water as necessary to
flush all the precipitate from the test tube.
16. Record your observations of the precipitate.

80
17. Discard the filtered liquid (the filtrate) and place the filtered precipitate on the watch
glass. Place the watch glass on a sunny part of your lab bench. Allow it to sit for two or
three minutes and then make another observation (you can move on in the meantime).
Part 4: Copper(II) chloride and aluminum foil
18. Place a piece of crumpled aluminum foil in a large, clean, dry beaker.
19. Record observations of both the aluminum and the copper(II) chloride solution before
mixing.
20. Pour enough copper(II) chloride solution in the beaker so that it is contact with aluminum
foil. Your teacher will show you how much is needed.
21. Observe the results.

81
OBSERVATIONS
Table: Observations of Physical and Chemical Changes
Action Observations
Part 1: Dissolving sodium chloride (level of
solution)
Part 1: Heating NaCl solution and observing
the solid
Before:
After:
Part 2: Heating nichrome wire Before:
After:
Part 2: Heating magnesium ribbon Before:
After:
Part 3: Silver nitrate + hydrochloric acid Before:
After:
Part 3: Precipitate in sunlight Before:
After:
Part 4: Aluminum foil + copper(II) chloride Before:
After:

82
QUESTIONS
1. What kind of change (physical or chemical) occurs when sodium chloride dissolves in
water? Give an explanation for your answer.
2. What kind of change (physical or chemical ) occurs when the salt water solution was
heated? What change was it, specifically (give the name)?
3. Use your observations to state whether a new substance was formed after heating each of
the following:
a. the nichrome wire.
b. the magnesium ribbon.
4. What evidence indicates if new substances with new properties were or were not formed
when hydrochloric acid was added to silver nitrate solution?
5. Did the precipitate exposed to sunlight undergo a physical or chemical change? Give an
explanation for your answer.
6. What kind of change occurred when the aluminum foil was in the copper(II) chloride
solution? Give an explanation for your answer.
PRE-LAB QUESTIONS
1. State whether the following observations/changes would indicate a physical or chemical
change.
a. Sugar dissolves in water
b. Bread left in the sunlight turns green
c. A piece of paper turns brown when lit on fire
d. An ice cube melts
e. A piece of metal has rusted
f. A nail left in copper(II) sulfate develops a red-brown coating
2. Give an example of a physical and chemical change that could occur to a tree branch.
3. Predict what will happen in Part 1 when the solution is heated. (You will need to read
carefully.)
4. Copper(II) chloride solution is blue. What color is copper metal? Give an example of
where a person could find copper metal.

83
EXPERIMENT 16
Separating a Mixture
A mixture is formed when substances combine without changing chemically. Each component
or ingredient of a mixture retains its own identity and properties. Physical changes are used to
separate the components of a mixture.
OBJECTIVES
In this experiment, you will
describe the characteristics of mixtures.
identify the substances in a mixture by their physical properties.
separate these substances according to physical properties.
MATERIALS
beakers (100 mL, 250 mL) funnel
clamp graduated cylinder
filter magnet
filter paper mixture
paper towels plastic bag
ring stand stirring rod
wire gauze water
pipestem triangle
PROCEDURE

84
1. Examine your mixture. Estimate the number of
components making the mixture. (You do not
need to record this.)
2. Unfold a paper towel and put it on your lab
bench. Holding the wire gauze over the paper
towel, filter the large pieces from the mixture.
(See right.) Place the large pieces aside on a
second paper towel and label them Component
A. Set this component aside.
3. Place another paper towel, labeled Component
B, on your lab bench. Use a magnet wrapped in
a plastic bag to separate the metal filings from the rest of the mixture. Remove the
magnet from the bag to release the metal filings on to the paper towel. DO NOT let the
metal filings get stuck to the magnet itself. Set aside Component B.
4. Place the remaining mixture in a 250-mL beaker. Add
about 25 mL of water and stir the mixture. Filter the
mixture (as demonstrated by your instructor and shown
to the right), collecting the filtrate in another beaker.
Place the beaker with the filtrate on a paper towel,
labeled Component C, and place it aside.
5. Allow the component on the filter paper to dry on
another paper towel. Label it Component D.
6. Complete the table below by making observations of the
physical properties of the various components. There
should be at least three observations for each
component. Some examples could be the color, state of
matter, if it is dissolved in anything, etc.
OBSERVATIONS
Table 1: Observations of Separated Components
Component Physical Properties
A
B
C
D

85
QUESTIONS
Table 2: Physical Properties of Known Substances
Component Physical Properties
sand does not dissolve in water, small grains, many colors including
orange/brown/tan, not attracted to magnet
iron metallic, attracted to a magnet, small, black filings
marble chips large rock pieces, many colors including white and pink
copper(II) sulfate dissolves in water, blue when dissolved, not attracted to magnet
1. Using the table above and your in-lab observations, identify each of the components of
your mixture. Note that it is not necessary to include Table 2 in your lab report.
2. Explain how you know that the combination of substances you began with was a mixture
and not one compound.
3. You observed several changes while separating the components of the original mixture.
Were these changes physical or chemical?
4. Name the specific change(s) that occurred in each of the following procedure steps. An
example of a “specific change” would be evaporation, although that did not occur in this
experiment.
a. Step 2 (identify 1 change)
b. Step 4 (identify 2 changes)
5. Explain the differences between physical and chemical changes and how this lab
furthered your understanding.
PRE-LAB QUESTIONS
1. When doing a filtration, what is the filtrate?
2. Identify the physical property in Procedure Steps 2, 3, and 4, respectively, which is
essential to that point in the separation. In other words, in each of those steps, what
property of a component allows you to separate it from the rest of the mixture?

86
EXPERIMENT 17
Chemical Structures
In your notebook or on the whiteboard, it can be hard to picture what a molecule or an ionic
network really “looks” like. Very powerful microscopes are needed to probe these structures but
we can also use macroscopic models to wrap our head around the three-dimensional nature of
matter.
In class, you have practiced drawing structures of molecules such as H2O or CO2 and have seen
diagrams of ionic compounds. On the atomic level, however, substances exist in three
dimensions. This concept will be explored hands-on.
OBJECTIVES
In this experiment, you will
use model kits to create three-dimensional structures of various molecules.
use model kits to discover the structure of more complex molecules.
investigate the three-dimensional nature of ionic lattices.
MATERIALS
model kits ionic lattice models
PROCEDURE
Part 1: Molecules
H2 H2O CO2 NH3 CCl4 C2H6 C2H4 C2H2 C6H14
1. You will use the model kits and the provided guide to construct each of the molecules
above. First, put together the first molecule. Proceed to Step 2.
2. Next, draw the structure of the molecule. You may have only used one “bond” from the
kit, but think about whether that must represent a single, double, or triple bond. Include
the correct number of bonds in your structure.
87
3. For C6H14, construct the molecule at least three different ways. Draw the structures for
each. Check with your teacher to make sure your three answers are actually different.
Part 2: Ionic Lattice
4. Look at the ionic lattice model. Try to decide the chemical formula based on the model.
You can use X for the cation and Z for the anion.
DATA
Part 1:Draw your molecular structures below. After you draw the molecule, include lone pairs
of electrons where appropriate. Label each structure with the appropriate chemical formula.
Part 2: Chemical formula of the ionic compound _____________

88
QUESTIONS
1. Is H2O a linear molecule?
2. Using the chemical formula for the ionic compound, which of these is the possible
identity? NaCl, BaI2, K2O, Mg2O2
3. What have you learned from this experiment? What have you found interesting? Do you
view chemical structures in the same way as you did before the experiment?
4. Define the word isomer. How is it relevant to this experiment?
PRE-LAB QUESTIONS
1. If the following elements were to form covalent bonds, how many bonds would each
element need?
a. Carbon
b. Hydrogen
c. Chlorine
d. Oxygen
e. Nitrogen
2. What is the difference between an ionic and a covalent bond?

89
EXPERIMENT 18
Chemical Reactions
The changes that occur during a chemical reaction are represented by a chemical equation. An
equation uses chemical symbols to represent the reactant and products. An arrow stands for the
word “yield” or “produce.” The reactants are the substances that react. The products are the
substances that are formed from the reaction. For example, the reaction of the elements sodium
and chlorine to produce sodium chloride is given by the following chemical equation.
2Na(s) + Cl2(g) → 2NaCl(s)
Reactants product
In a synthesis reaction, two or more substances react to form a new, more complex substance. You
may think of a synthesis reaction as putting substances together to produce a single new substance.
The synthesis reaction of hydrogen peroxide is given by the equation below.
2H2O(l) + O2(g) → 2H2O2(l) synthesis reaction
A decomposition reaction produces several simpler products from the breakdown of a single
compound. This process takes one compound and breaks it down into several compounds and/or
elements.
2H2O(l) → 2H2(g) + O2(g) decomposition reaction
In a single displacement reaction, two or more reactants change to form two or more products.
More specifically, one element replaces another in a compound. In the following reaction, carbon
displaces the hydrogen in water and elemental hydrogen is released as hydrogen gas.
C(s) + H2O(l) → CO(g) + H2(g) single displacement reaction
Chemical reactions often take place between two reactants in the same solution. When the reaction
occurs, solid particles may form within the container. These products, called precipitates, are
insoluble solids. For example, look at the following reaction.
AgNO3(aq) + NaCl(aq) → AgCl(s) + NaNO3(aq) double displacement reaction
AgCl is a precipitate, while the soluble product, NaNO3, remains in solution. Silver and sodium
cations are exchanged in this reaction. Such a reaction is called a double displacement reaction.
The formation of the precipitate is a visible indication that the reaction has occurred.
OBJECTIVES
In this experiment, you will
recognize the reactants and products of a chemical reaction.
identify the type of chemical reaction you observe.
learn how chemical equations can more simply represent the reaction occurring.
observe several double displacement reactions and distinguish when there is no reaction.

90
MATERIALS
aluminum foil/tray matches
tongs steel wool (Fe source)
test tubes wood splint
baking soda (sodium bicarbonate, NaHCO3) Bunsen burner
beaker copper(II) sulfate solution (CuSO4)
iron nail (Fe) barium chloride solution (BaCl2)
sodium carbonate solution (Na2CO3) sodium hydroxide solution (NaOH)
iron(III) chloride solution (FeCl3) potassium sulfate solution (K2SO4)
PROCEDURE
Part 1: Synthesis Reaction
1. Protect the table with a sheet of aluminum foil or a tray. Place the unlit Bunsen burner in
the center of the foil/tray.
2. Observe the color of the steel wool. Record your observations in the observations section.
3. Remember that the steel wool is the source of iron for the reaction. Predict if there will be
any changes in the steel wool if it is heated in a flame (and what they might be). Write
your prediction in the observations section.
4. Light the burner. Be sure to stay clear of the flame.
5. Hold the steel wool with the tongs over the flame. As it burns, record the changes it goes
through. Turn off the flame after you observe the changes.
Part 2: Decomposition Reaction
Read all of the steps in Part 2 before you begin!
6. Place a small scoop of baking soda (containing sodium bicarbonate, NaHCO3) in a test
tube.
7. In the data section, write your prediction of what will happen to the baking soda as it is
heated. Also write your observations of the baking soda before it is heated.
8. Make sure the Bunsen burner is still on the foil/tray. Light the burner. Be ready to do steps
9 and 10 before you continue.
9. Use the test-tube holder to heat the test tube in the flame, as shown by your instructor. The
bottom of the test tube should be in the flame. Angle the test tube slightly so that your
hand is not directly above the flame. Do not point the mouth of the test tube at anyone.
10. After the test tube has been heated for a few moments, test for the presence of CO2. Light
a match or wooden splint. Hold the flaming splint in the mouth of the test tube. If the
flame of the splint goes out, CO2 is present. Record your observations of the test.
11. Record a description of the product formed inside the test tube.
Part 3: Single Displacement Reaction
12. Predict what change will occur when a nail sits in copper(II) sulfate solution.
13. Gently place a nail in a clean, dry beaker. Record its initial color.
14. Pour just enough copper(II) sulfate solution in the beaker so that the nail is submerged.
Note the initial color of the solution. Caution: The CuSO4 solution is toxic. Handle with
care.

91
15. Allow the mixture to sit for a few minutes. Once you see some changes, record the color
on the nail and of the solution.
Part 4: Double Displacement Reactions
16. Put a paper towel under the test tube rack. Place 5 test tubes in the test tube rack. Label 5
test tubes A through E. Place 10 drops of the solutions in the test tubes as outlined below.
Test Tube A: BaCl2 + Na2CO3
Test Tube B: Na2CO3 + K2SO4
Test Tube C: CuSO4 + NaOH
Test Tube D: FeCl3 + NaOH
Test Tube E: NaOH + K2SO4
17. For each test tube, record whether or not you see a precipitate. (The presence of a
precipitate indicates that a chemical reaction has occurred.) If you do, record observations
of the precipitate.
OBSERVATIONS
Table 1: Synthesis Reaction
Prediction of changes in heated steel wool
Color of steel wool before burning
Color of steel wool after burning
Table 2: Decomposition Reaction
Prediction of changes in heated baking soda
Description of baking soda before heating
Description of deposits inside heated test tube
Observations of flaming splint in test tube
Part 3: Prediction of changes in nail and CuSO4 solution ________________________________

92
Table 3: Single Displacement Reaction
Observation Time Color of nail Color of CuSO4 solution
before reaction
after reaction
Table 4: Double Displacement Reactions
Test Tube Reactants Precipitate? If yes, observations of
it
A BaCl2 + Na2CO3
B Na2CO3 + K2SO4
C CuSO4 + NaOH
D FeCl3 + NaOH
E NaOH + K2SO4
QUESTIONS
1. In Part 1, when you burn the steel wool, what metallic element is reacting? With what
molecule in the air is it reacting?
2. What chemical is decomposing in Part 2 (give the formula)? With respect to chemistry,
what does it mean to decompose?
3. In Part 2, offer an explanation for the observation you made about the flaming splint.
4. Explain how Part 3 is a single displacement reaction and not a double displacement
reaction. Here is the reaction:
CuSO4 (aq) + Fe (s) FeSO4 (aq) + Cu (s)
5. Look at the reaction above in Question #4. Using what you know about the products,
explain the colors that you observed in Part 3. (What colors correspond to what product?)
6. In the pre-lab, you listed all of the cations and anions used in Part 4. For each reaction in
which you observed a precipitate, predict the products. (Remember, for a double
displacement reaction, the cations switch places.) Important: The products must be
neutral! Pay attention to the charges on each ion. Simply switching the letters will not
necessarily work.
7. In the reaction below, identify which product is the precipitate.
BaCl2(aq) + K2SO4(aq) → BaSO4(s) + 2KCl(aq)

93
PRE-LAB QUESTIONS
1. What is a chemical equation?
2. Label the reactants and products in this reaction.
2H2O(l) + 2Na(s) 2NaOH(aq) + H2(g)
3. What metallic element is in steel wool?
4. What is the chemical formula for baking soda?
5. What will CO2 do to a flame?
6. What is a precipitate?
7. What does aqueous mean? (abbreviated aq)
8. For Part 4, list the six compounds being used. Then, for each compound, separately list
the cation and anion with their charges. Here is an example for aluminum chloride, AlCl3,
which is not in Part 4.
Compound: AlCl3
Cation: Al+3
Anion: Cl -

94
EXPERIMENT 19
Striking it Rich!
In this experiment you will explore the meaning of the word alloy. In class, you have learned
that it is a type of mixture. Recall that, in general, a mixture consists of multiple elements or
compounds combined physically but not chemically. Experiment 16 was about separating a
mixture. Separation as well as creation of a mixture involves physical changes. In the
laboratory, you will be creating an alloy.
OBJECTIVES
In this experiment, you will
investigate the meaning of the word alloy.
observe changes in the color of a penny
conjecture what is happening at the atomic level.
MATERIALS
3 pennies beaker (250 mL)
graduated cylinder (25 mL) balance
ring stand wire gauze
tongs Bunsen burner
watch glass zinc/zinc chloride mixture
iron ring spatula
Caution: Zinc chloride is toxic. If you get any on your skin, wash it off. Do not put your
face directly over the heated beaker. Do not touch hot glassware!
PROCEDURE
The following has already been done for you:
Weight 2.0 g of zinc powder and place it in a 250 mL beaker. Measure 25 mL of zinc
chloride (ZnCl2) solution in a graduated cylinder and add it to the beaker.
Begin here:
1. Obtain 3 pennies per group. Use steel wool to clean each penny until it is shiny.
2. Set aside one penny to serve as the control (an untreated sample). Record the appearance
of the control in the first part of the table.

95
3. Place two pennies on the bottom of the beaker containing the zinc/zinc chloride mixture.
4. Place a watch glass over the beaker as instructed by your teacher. Place the beaker on top
of the wire gauze on the ring stand. Heat the solution over a Bunsen burner until it boils.
5. Once boiling, turn off the burner. Wait 5 minutes.
6. Take the beaker off the gauze and use a spatula to flip the coins over.
7. Put the beaker back over the burner, light the flame and turn it off again once the solution
is boiling. Wait 5 minutes.
8. Carefully put the beaker on the table. Remove the pennies with a spatula/tongs and rinse
them in cold water. Make and record observations of the pennies in the second part of
the table. For the rest of the experiment, you only need 1 of these 2 pennies.
9. Light the Bunsen burner again. Hold 1 of the pennies from Step 8 with the tongs by the
edge. Waft the penny back and forth in the flame for about 20 seconds. DO NOT
OVERHEAT! Observe closely. Something should happen.
10. Quickly rinse the penny in cold water. Make and record observations of the penny in the
last part of the table.
11. During cleanup, do not discard the zinc/zinc chloride mixture. Leave it for the next
group. Be sure to wash your hands.
OBSERVATIONS
Table: Observations of Three Pennies
Condition Observations
Untreated penny
Penny heated in Zn/ZnCl2 mixture
Penny heated in Zn/ZnCl2 mixture and then in
Bunsen burner flame

96
QUESTIONS
1. Do the treated pennies appear to be made from a metal other than copper? Explain why
(or why not). Base your answer solely on the appearance of the pennies.
2. If someone claimed that a precious metal was created in this experiment, would you
agree? Why (or why not)? Base your answer on your knowledge of chemical principles
and reactions.
3. Explain two practical uses for the techniques demonstrated in this experiment.
4. In your pre-lab, you defined the term alloy. Restate its meaning. How does it apply to
this lab? Did you successfully make an alloy? If so, which one do you think you made
(name)?
5. At an atomic level (meaning on the very small scale of atoms), what do you think
happened in this experiment? Re-read the introduction and think about what was made in
lab.
PRE-LAB QUESTIONS
1. What is the difference between a mixture and a compound? 2. What do you think the purpose of having a control penny is?
3. What is an alloy?

97
EXPERIMENT 20
Analysis of the Reaction between AgNO3 and NaCl
In this experiment, you will use laboratory and mathematical techniques you have been
mastering in order to design, conduct, and evaluate your own experiment. You will be
answering the following question: how do the amounts of reactants we use affect how much
product is made?
OBJECTIVES
In this experiment, your goals will be
to predict products for a reaction between silver nitrate and sodium chloride.
to predict which product is the precipitate, given that all compounds containing nitrate
are soluble in water.
to determine the limiting reagent.
to predict how much solid product will be produced.
to analyze whether or not your predictions were accurate.
MATERIALS
beakers
filtration equipment
balance
spatula
AgNO3(s)
NaCl(s)
PROCEDURE
1. Write out the equation for the double displacement reaction between silver nitrate and
sodium chloride.
2. Discuss with your partner how much of each reactant you should use.
3. How should you start the reaction? (Hint: When we mix two reactants together, what
state are they often in?)

98
4. Get your plan approved by your teacher. Record the actual masses used and notes about
what procedure you chose to follow.
5. Start the reaction and record observations of it.
6. Filter the result.
7. Set aside the solid product to dry.
DATA/OBSERVATIONS:
Mass of silver nitrate:
Mass of sodium chloride:
Description of procedure & reaction:
Mass of dry product:

99
CALCULATIONS (ANALYSIS)
While your product is drying, complete each of the following:
1. Determine which product is the precipitate.
2. Calculate how much product could have been made from each of the reactants, determining
the limiting reagent.
3. How much solid product should you have made?
When your product is dry, get its mass by zeroing a second piece of filter paper and
scraping the solid onto it. Put the mass of the dry product in the data section your report.
4. Calculate the percent yield using the formula below.
% yield = 𝑎𝑐𝑡𝑢𝑎𝑙 𝑦𝑖𝑒𝑙𝑑
𝑡ℎ𝑒𝑜𝑟𝑒𝑡𝑖𝑐𝑎𝑙 𝑦𝑖𝑒𝑙𝑑∗ 100%

100
QUESTIONS/CONCLUSION In your lab report, discuss the accuracy of your predictions, accounting for any discrepancies.
Describe how the techniques of this lab may be applicable in other situations.
PRE-LAB QUESTIONS 1. Define limiting reagent.
2. Hypothesize why it is necessary to let the solid product dry before weighing it.

101
EXPERIMENT 21
pH
Acids and bases are classes of chemical compounds and each class has certain properties in
common. Acids have characteristic properties of reacting with active metals to release hydrogen
gas, neutralizing bases to form a salt, and changing the color of certain substances such as litmus.
Bases, on the other hand, have characteristic properties of converting plant and animal tissues to
soluble substances, neutralizing acids to form a salt, and reversing the color changes that were
caused by acids.
Some chemical compounds are acidic, such as vinegar, and other compounds are basic, such as
lye; but the terms acidic and basic are very general and inexact. The pH scale is a concise and
quantitative way of expressing the acidity or basicity of a solution. pH depends on both the
strength of an acid/a base (strong vs. weak) as well as the concentration of that acid/base. On
this scale a neutral solution (neither acidic nor basic properties) has a pH of 7.0. Acidic solutions
have pH values below 7; a smaller number means greater acidic properties. Basic solutions have
pH values above 7; a greater number means greater basic properties. The pH scale is logarithmic
(not linear) so a pH of 2 is 10 times more acidic than a pH of 3. Likewise, a pH of 8 is 10 times
10, or 100 times more basic than a pH of 6.
Many plant extracts and synthetic dyes change colors when mixed with acids or bases. Such
substances that change color in the presence of acids or bases can be used as an acid-base
indicator. Litmus, for example, is an acid-base indicator made from a dye extracted from
certain species of lichens. The dye is applied to paper strips, which turn red in acidic solutions
and blue in basic solutions. This is only a “ball park” indicator, however, since it only indicates
on which side of the pH scale a solution lies. Other indicators are available that can be used to
estimate the pH to about half a pH unit – for example, a pH of 3.5. There are also electrical
instruments that measure pH by measuring the conductivity of a solution.
OBJECTIVES
In this experiment, you will
determine the characteristics of several commercial indicators.
summarize how each indicator behaves in an acidic vs. basic solution.
test an unknown to determine its acidic or basic properties.

102
MATERIALS
watch glass glass stirring rod
test tubes
Solutions
0.1 M hydrochloric acid, HCl 0.1 M acetic acid, HC2H3O2
0.1 M sodium hydroxide, NaOH diluted ammonia
unknown
Indicators
red litmus paper blue litmus paper
bromthymol blue methyl orange
methyl red phenolphthalein
pH Ranges and Color Changes for Selected Indicators
NOTE: This figure is not drawn perfectly to scale. The letters stand for colors. For example,
between a pH of 8.3 and 10, a solution containing phenolphthalein turns from clear to red.

103
PROCEDURE
1. Start with hydrochloric acid. Record the color of the solution in the observations section.
2. Pour hydrochloric acid into five clean test tubes so that each is about 1/3 full. From left
to right, these are Test Tubes 1-5.
3. Place half of one strip of red litmus paper and half of one strip of blue litmus paper on
the watch glass. Describe the color of each strip in the observations section. Save the
other halves for future trials.
4. Dip the clean glass stirring rod in Test Tube 1 so that a drop of the solution is on the end.
Touch the end of the stirring rod to the red litmus paper. Record your observations of the
paper.
5. Dip the stirring rod in Test Tube 1 again and touch it to the blue litmus paper. Record
your observations of the paper.
6. Take the dropper out of the bromthymol blue indicator to examine the color. Record
your description of its color. Put two drops of the indicator into Test Tube 2. Record
your observations of the mixture.
7. Do the same actions as Step 6 for
a. methyl orange in Test Tube 3
b. methyl red in Test Tube 4
c. phenolphthalein in Test Tube 5
8. Clean out all of your test tubes. Repeat Steps 1-7 for
a. acetic acid
b. sodium hydroxide
c. ammonia
d. the unknown solution
OBSERVATIONS
Table 1: Results of Indicator Tests for Acid Solutions
Indicator Hydrochloric Acid
Color: _____________ Acetic Acid
Color: _____________
red litmus
Color: _____________
blue litmus
Color: _____________
bromthymol blue
Color: _____________
methyl orange
Color: _____________
methyl red
Color: _____________
phenolphthalein
Color: _____________

104
Table 2: Results of Indicator Tests for Base Solutions
Indicator Sodium Hydroxide
Color: _____________ Ammonia
Color: _____________
red litmus
Color: _____________
blue litmus
Color: _____________
bromthymol blue
Color: _____________
methyl orange
Color: _____________
methyl red
Color: _____________
phenolphthalein
Color: _____________
Table 3: Results of Indicator Tests for Unknown Solution
Indicator Unknown
Color: _____________
red litmus
Color: _____________
blue litmus
Color: _____________
bromthymol blue
Color: _____________
methyl orange
Color: _____________
methyl red
Color: _____________
phenolphthalein
Color: _____________

105
QUESTIONS
1. Based on your observations, summarize what an acid solution and what a base solution
will do to each indicator:
a. red litmus
b. blue litmus
c. bromthymol blue
d. methyl orange
e. methyl red
f. phenolphthalein
2. A popular noncarbonated beverage turns thymol blue to yellow and methyl orange to red.
Use the figure in the introduction to predict the approximate pH of this soft drink. Is it
acidic or basic?
3. What is the approximate pH of an acidic beverage that turns methyl orange to a yellow
color?
4. Does phenolphthalein change colors in an acidic or basic pH range? Would it be helpful
in identifying how acidic a substance is (very acidic vs. a little acidic)? Explain why or
why not.
5. In lab, you analyzed an unknown solution. Do you think it was an acid or a base? Why?
Your test results should provide support in your answer.
PRE-LAB QUESTIONS
1. Acetic acid is CH3COOH. Where can you find this acid in your kitchen?
2. There are two solutions of sodium hydroxide in front of you. One has a pH of 8 and the
other has a pH of 10. Which is more basic? Which do you think has a higher
concentration of hydroxide? Explain your answers. (Remember, concentration is how
much base there is per unit volume.)
3. Would litmus paper help you differentiate between the two solutions mentioned in #2?
Explain.

106
EXPERIMENT 22
Titration
A neutralization reaction occurs between an acid (low pH) and a base (high pH) to produce a salt
and water. This reaction type can be used to figure out the concentration of either the acid or the
base if one of them is unknown. To find the unknown concentration of the acid, we will perform
a procedure called a titration. During a titration, the neutralization point is when the moles of
acid equal the moles of base. In this experiment, that means all of the acid will have been
neutralized by the base. Since we will know how much base has been added, we can figure out
the moles of acid at this point. At the end, we will calculate the concentration of the acid.
We will first make a standard solution of a base, sodium hydroxide, or NaOH (known
concentration). We will add the NaOH solution one milliliter at a time to a measured volume of
the acid and monitor the pH with a computer probe. We will construct a graph of our data and
use the graph to find the neutralization point.
OBJECTIVES
In this experiment, you will
monitor the pH during a neutralization reaction.
construct a neutralization curve.
calculate the concentration of a sample of hydrochloric acid.
MATERIALS
evaporating dish sodium hydroxide, NaOH
balance hydrochloric acid, HCl
beakers/Erlenmeyer flask phenolphthalein
stirring rod pH probe
computer graduated cylinder

107
PROCEDURE
Creating a standard solution of NaOH
1. You will be given NaOH solid pellets by your instructor. Get the mass of the evaporating
dish before you ask your instructor for the chemical. Caution: Do not touch the sodium
hydroxide with your hands. Do not allow the NaOH to sit too long in the evaporating
dish.
2. Measure and record the mass of the NaOH in the data section
3. Transfer the NaOH to a clean, dry beaker.
4. Measure out 50 mL of water and add it to the beaker. Stir the solution with a clean, dry
stirring rod until all of the solid is dissolved. Get a piece of paper, label it, and place the
beaker on top of it.
5. Clean the graduated cylinder.
Setting Up and Performing the Titration
CAUTION: You must be very careful not to cross-contaminate your solutions by
using equipment, such as a stirring rod, in both of them.
6. Measure 20 mL of the hydrochloric acid solution (provided) and pour it into a beaker or
an Erlenmeyer flask (whichever is at your station).
7. Log into the computer and open the Logger Pro program.
8. Put the pH probe into the HCl solution in the beaker/flask.
9. Wait until it becomes steady, and then note the reading in Data Table 1.
10. Add 4 drops of phenolphthalein to the HCl solution.
11. Use a clean dropper to add 1 mL of the NaOH solution to the HCl solution and stir. (To
stir, you may use a clean stirring rod.) Do not allow the dropper to touch the HCl
solution. Record the pH in Data Table 1.
12. Continue adding NaOH solution, 1 mL at a time. Stir and record the pH after each
addition. Also record any observations you make of the solution (pH is not an
observation) in Data Table 2.

108
DATA Mass of NaOH (solid): _________________________
Data Table 1: Changes in pH during titration of HCl (aq) with NaOH (aq)
Volume of NaOH (aq) added (mL) pH
0

109
Data Table 2: Qualitative Observations of the Titration
Observations of changes in the solution Volume of base added (mL)
Note: You may need more or fewer spaces than are provided, depending on your observations.
Feel free to edit the table as necessary. The column for volume is so that you know how far
along you were in the titration when you made a given observation.
CALCULATIONS & GRAPH
1. Construct a graph of pH vs. volume of NaOH (aq) added. Label the axes with units, if
appropriate. These graphs are called titration curves. Give your graph a title.
2. Calculate the concentration of your standard solution of sodium hydroxide using the
following formulas. Make sure that you use the correct volume and convert it to liters
first. 𝑚𝑎𝑠𝑠
𝑚𝑜𝑙𝑎𝑟 𝑚𝑎𝑠𝑠 = moles
𝑚𝑜𝑙𝑒𝑠
𝑣𝑜𝑙𝑢𝑚𝑒 = molarity
3. Use your graph to locate the neutralization point of the titration. What volume of the
NaOH solution was needed to neutralize the 20 mL of HCl solution?
4. Calculating the concentration of the acid solution:
a. Rearrange the equation below to solve for Ma
VaMana = VbMbnb
a and b stand for acid and base, respectively. V is volume, M is molarity, and n is moles.
b. Using the equation above, your result from Calculations #2 and #3, and your
knowledge of the neutralization point, calculate the concentration of the acid.
110
5. Calculating concentration another way:
a. Using your result from Calculation #2 & 3, calculate the moles of base added at
the neutralization point. Make sure that you use the correct volume and it is in
liters. The formula is below.
moles = molarity * volume
b. How many moles of HCl were in the 20 mL of HCl solution? (Hint: No additional
calculation is necessary. Think about what is true of moles at the neutralization
point.)
c. Since you know the volume of the acid initially used and the moles of acid, you
can calculate the concentration of the acid using the molarity equation. Use the
equation below to find the molarity of the acid. Make sure the volume is in liters.
molarity = 𝑚𝑜𝑙𝑒𝑠
𝑣𝑜𝑙𝑢𝑚𝑒
QUESTIONS
1. Compare the two results you got for the calculation of the acid’s concentration
(Calculations #4b and #5c).
2. Summarize your observations made in Data Table 2. Why do you think it happened?
Remember that you added phenolphthalein before the titration began.
3. If the concentration of your standard NaOH solution was much higher…
a. Do you think you would need more or less of it to neutralize all of the acid?
Explain.
b. What would happen to your graph? (Describe how it would change.)
PRE-LAB QUESTIONS
1. In this experiment, what acid is used? What base?
2. What is a neutralization point?
3. Write the chemical equation for this neutralization reaction, predicting the products.
4. What do you think the purpose of the phenolphthalein will be? Your answer should be
specific to a titration experiment.

111
Appendix 1: Percent Error
Percent error tells you how far your experimentally obtained value is from the accepted value.
The experimental value could be a measurement or a calculation. It is obtained either directly
(via measurement) or indirectly (calculated as a result of values obtained during the experiment).
The accepted value is what “everyone” (the scientific community) agrees is the actual, accurate
value for the topic at hand. For example, the accepted value for the speed of light is 3.0∙108 m/s.
Since it is considered the “true” value, it is good to compare the result from your experiment to
it.
𝑝𝑒𝑟𝑐𝑒𝑛𝑡 𝑒𝑟𝑟𝑜𝑟 = 𝑒𝑥𝑝𝑒𝑟𝑖𝑚𝑒𝑛𝑡𝑎𝑙 𝑣𝑎𝑙𝑢𝑒 − 𝑎𝑐𝑐𝑒𝑝𝑡𝑒𝑑 𝑣𝑎𝑙𝑢𝑒
𝑎𝑐𝑐𝑒𝑝𝑡𝑒𝑑 𝑣𝑎𝑙𝑢𝑒· 100%
Sometimes the numerator of this fraction can be considered as an absolute value (making the
difference positive, no matter what). If not, a positive vs. negative result for percent error simply
indicates whether your experimental value was above or below the accepted value. For the form
of the equation shown, if the experimental value is greater than the accepted value, the percent
error will be positive. If it is less, the percent error will be negative.

112
Appendix 2: Graphing in Microsoft Excel
PC Instructions
1. Type your headers into cells A1 and B1 with units
in parentheses. Whatever you type in Column A will
become your x coordinates and Column B your y.
2. Fill in your numbers (no units) in the cells below
each header (just like a data table).
3. Click and drag to highlight just the numbers. (Click on Cell A2 and drag down to the bottom
right of your data.) Both the x and y values should be highlighted.
4. Go to the Insert
tab and click on
the Scatter drop
down. Select
the first option
(the one with
just dots).
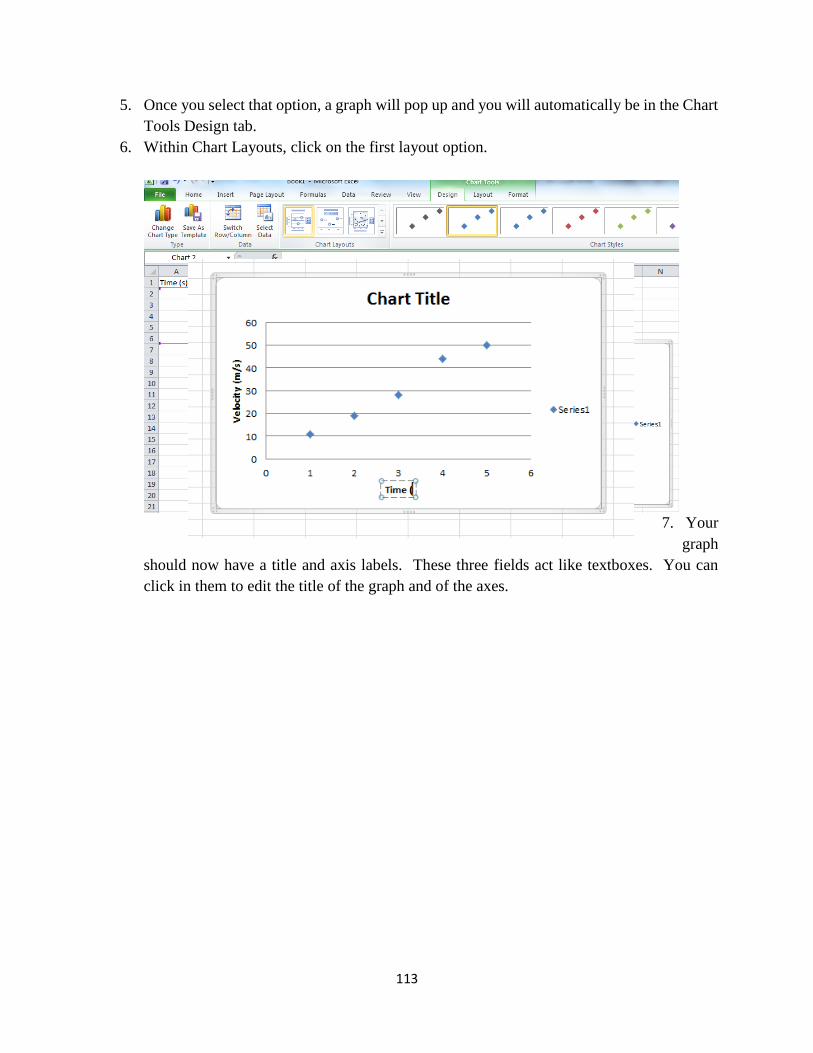
113
5. Once you select that option, a graph will pop up and you will automatically be in the Chart
Tools Design tab.
6. Within Chart Layouts, click on the first layout option.
7. Your
graph
should now have a title and axis labels. These three fields act like textboxes. You can
click in them to edit the title of the graph and of the axes.

114
8. If instructed by your teacher to create a best fit line, right click on one of your data points.
Select “Add Trendline.”
9. In the window that pops up, make sure linear fit is selected and then click the box to display
the equation on the “chart” (graph).

115
10. Click “Close.” You can move around the equation of the best fit line to make it more easily
visible. Notice that the line may not go through any/all of your data points. The equation
displaced is in “y=mx+b” format and is the equation of the best-fit line.
11. To print, click on the white space in the corner of the graph window. Then go to FilePrint
and it will print a full-page version of your graph. Alternatively, you could copy and paste
the graph into a Word document, as you would a picture, for use in your lab report.
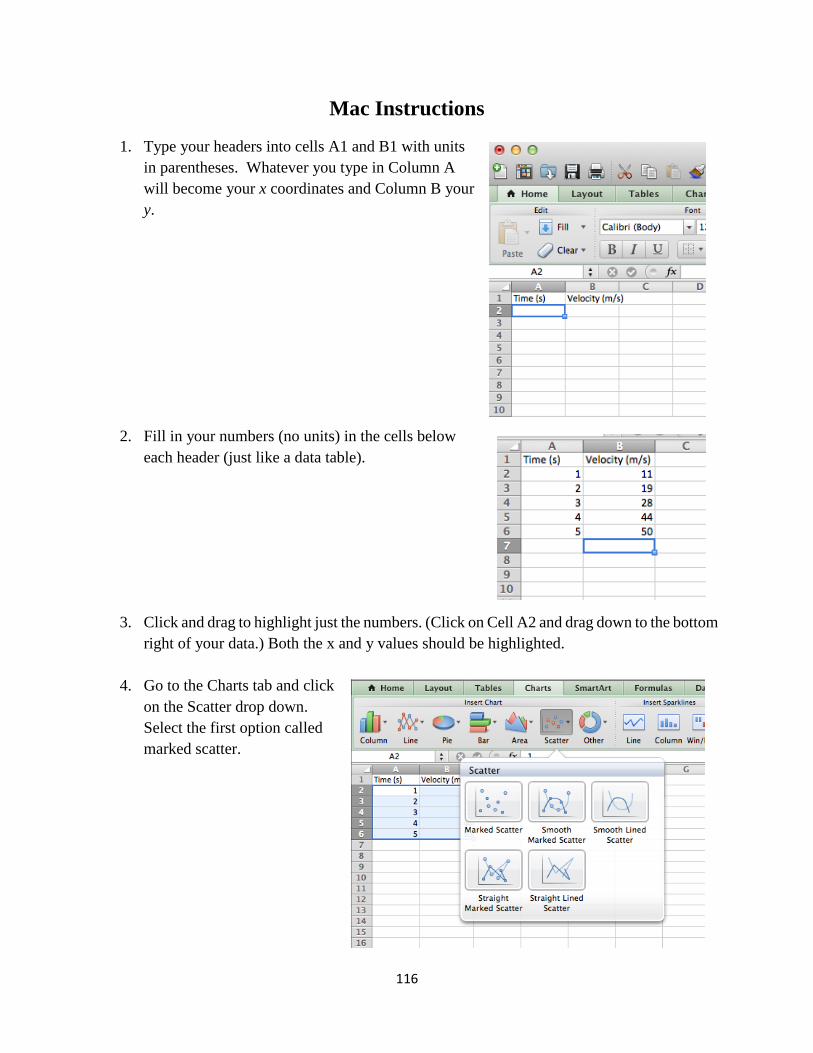
116
Mac Instructions
1. Type your headers into cells A1 and B1 with units
in parentheses. Whatever you type in Column A
will become your x coordinates and Column B your
y.
2. Fill in your numbers (no units) in the cells below
each header (just like a data table).
3. Click and drag to highlight just the numbers. (Click on Cell A2 and drag down to the bottom
right of your data.) Both the x and y values should be highlighted.
4. Go to the Charts tab and click
on the Scatter drop down.
Select the first option called
marked scatter.

117
5. Once you select that option, a graph will pop up and you will automatically be in the
Chart Layout/Format tabs.
6. Within Chart Quick Layouts, click on the first layout option.

118
7. Your graph should now have a title and axis labels. These three fields act like textboxes.
You can click in them to edit the title of the graph and of the axes.
8. If instructed by your teacher to create a best fit line, right click on one of your data points.
Select “Add Trendline.”
9. In the window that pops up, make sure linear fit is selected. Then, in the same window,
go to Options. Click the box that says “Display equation on chart” (graph).

119
10. Click “OK.” You can move around the equation of the best fit line to make it more easily
visible. Notice that the line may not go through any/all of your data points. The equation
displaced is in “y=mx+b” format and is the equation of the best-fit line.

120
11. To print just the graph, click on the white space in the corner of the graph window. Then
follow normal printing procedures. Alternatively, you could copy and paste the graph into
a Word document, as you would a picture, for use in your lab report.

121
Appendix 3: Some Basic Tools in Microsoft Word
PC Instructions
Tables:
Go to the Insert Tab and click on Table. You can select
how many columns and rows you want by moving the
mouse around.
Superscripts and Subscripts:
On the Home tab, in the Font section, you will see little icons like these:
If you want to make some text into a superscripts or subscript, highlight those letters/numbers and
then click on the appropriate icon. Here is the difference:
Expressing “x squared”
Wrong: x2 Right: x2
Expressing the chemical formula for water
Wrong: H2O Right: H2O

122
Mac Instructions
Tables:
Go to the Tables Tab and
click on New. You can
select how many columns
and rows you want by
moving the mouse
around.
Subscripts & Superscripts:
On the Home tab, in the Font section, you will see little icons like these:
If you want to make some text into a superscripts or subscript, highlight those letters/numbers and
then click on the appropriate icon. Here is the difference:
Expressing “x squared”
Wrong: x2 Right: x2
Expressing the chemical formula for water
Wrong: H2O Right: H2O