PHYSICAL REVIEW RESEARCH2, 042016(R) (2020)
6
PHYSICAL REVIEW RESEARCH 2, 042016(R) (2020) Rapid Communications Similarity of internal and external friction: Soft matter frictional instabilities obey mean field dissipation through slip avalanches S. Zheng, 1 J. M. Urueña, 2 A. C. Dunn, 3 J. T. Uhl, 4 , * and K. A. Dahmen 1 , † 1 Department of Physics, University of Illinois at Urbana-Champaign, 1110 W. Green Street, Urbana, Illinois 61801, USA 2 Department of Mechanical and Aerospace Engineering, University of Florida, Gainesville, Florida 32611, USA 3 Department of Mechanical Science and Engineering, University of Illinois at Urbana-Champaign, Urbana, Illinois 61801, USA 4 Los Angeles, California, USA (Received 6 June 2018; accepted 13 July 2020; published 20 October 2020) Resistance to slip across hydrogel surfaces is typically minimal, and sliding is smooth. However, recent surface friction experiments under high applied pressures caused stick-slip behavior between a glass probe and polyacrylamide hydrogel. In this paper we analyze the surface-based interface and its behavior similar to the more internal slip avalanches that occur in plastic deformations of metallic glasses and crystals using statistical descriptions. We find that the stick-slip surface friction satisfies universal power laws and scaling functions predicted by a simple mean field theory (MFT). We provide the rescaled average avalanche slip rate profiles, or average avalanche “shapes,” defined as the average slip rate versus time, averaged over all avalanches with similar durations or sizes. We show that the avalanche shapes obtained in this friction experiment are consistent with MFT. This suggests the similar character of force buildup and release events in internal slip and surface friction for this unique data set, and the suitability of surface microfriction experiments to explore this space. DOI: 10.1103/PhysRevResearch.2.042016 I. INTRODUCTION Friction between two solid materials that are slowly being moved past each other can proceed in an intermittent fashion, with sudden slips or slip avalanches, separated by quiet times without any slipping activity. Here we compare the statistics and the dynamics of these slip events with the predictions of a simple mean field model that describes slips inside solid materials. The agreement between experiments and theory links surface friction to internal friction and thereby leads to a predictive understanding that can be used to guide the design of better materials. In general, slip avalanches locally dissipate the energy at an interface between larger bodies; this can occur on large scales such as earthquakes [1] down to nanoscale dislocation motion in crystalline solids [2]. In nanocrystals, for example, the slips typically occur exceedingly quickly, making it challenging to measure them experimentally. If they occur inside the solid, the buried interface often forces the measurement to be located far from the active regions and the resolution of time and force are not easily captured [3]. In contrast, surface friction studies can provide more ac- cess to slip behavior and specifically stick-slip motions be- * Retired. † [email protected] Published by the American Physical Society under the terms of the Creative Commons Attribution 4.0 International license. Further distribution of this work must maintain attribution to the author(s) and the published article’s title, journal citation, and DOI. cause the samples are often larger, they are sometimes trans- parent, and the slips proceed more slowly. The experiments can then elicit the behavior based on the surface composition and topography, applied normal force, and driving translation speed or displacement [4]. The friction experiments also pro- vide information about material changes. For example, plastic deformation manifests in the stick-slip behavior via shear weakening, shear strengthening, or approximately zero weak- ening [5–7]. Rate-dependent surface deformation is a well- established field, but still the durations of individual slips, caused by elastic (depinning) deformation or plastic deforma- tion, can be small, on the order of nanoseconds to microsec- onds [8]. We discuss a simple statistical mean field model that can accurately describe these effects and compare the predictions with sufficient experimental data for validation. According to rubber elasticity, the material recoil of soft materials such as elastomers, during slip, is slower than for hard materials [9]. This slowed-down dynamics of soft mate- rials provides us with dramatically increased temporal reso- lution of the individual slip events. Recently, a material even softer than an elastomer, a hydrogel of E ∼ 10 s kPa, expe- rienced stick-slip motion in a microtribological measurement while sliding under a smooth glass probe. This extends the slip timescale up to milliseconds. In addition, the compliant surface provides a conformal contact and the area of contact can spread to the entire interface. In contrast, in hard materials the interfaces touch only at the asperity peaks. The dramatically slowed-down dynamics in soft materials overcomes the experimental challenges of time resolution and isolated nanoscopic contact areas. Also, in soft materials such as hydrogels we can safely exclude roughness, electronic properties, or crystallographic properties as the origins of the 2643-1564/2020/2(4)/042016(6) 042016-1 Published by the American Physical Society
Transcript of PHYSICAL REVIEW RESEARCH2, 042016(R) (2020)

PHYSICAL REVIEW RESEARCH 2, 042016(R) (2020)Rapid Communications
Similarity of internal and external friction: Soft matter frictional instabilitiesobey mean field dissipation through slip avalanches
S. Zheng,1 J. M. Urueña,2 A. C. Dunn,3 J. T. Uhl,4,* and K. A. Dahmen1,†
1Department of Physics, University of Illinois at Urbana-Champaign, 1110 W. Green Street, Urbana, Illinois 61801, USA2Department of Mechanical and Aerospace Engineering, University of Florida, Gainesville, Florida 32611, USA
3Department of Mechanical Science and Engineering, University of Illinois at Urbana-Champaign, Urbana, Illinois 61801, USA4Los Angeles, California, USA
(Received 6 June 2018; accepted 13 July 2020; published 20 October 2020)
Resistance to slip across hydrogel surfaces is typically minimal, and sliding is smooth. However, recentsurface friction experiments under high applied pressures caused stick-slip behavior between a glass probeand polyacrylamide hydrogel. In this paper we analyze the surface-based interface and its behavior similarto the more internal slip avalanches that occur in plastic deformations of metallic glasses and crystals usingstatistical descriptions. We find that the stick-slip surface friction satisfies universal power laws and scalingfunctions predicted by a simple mean field theory (MFT). We provide the rescaled average avalanche slip rateprofiles, or average avalanche “shapes,” defined as the average slip rate versus time, averaged over all avalancheswith similar durations or sizes. We show that the avalanche shapes obtained in this friction experiment areconsistent with MFT. This suggests the similar character of force buildup and release events in internal slip andsurface friction for this unique data set, and the suitability of surface microfriction experiments to explore thisspace.
DOI: 10.1103/PhysRevResearch.2.042016
I. INTRODUCTION
Friction between two solid materials that are slowly beingmoved past each other can proceed in an intermittent fashion,with sudden slips or slip avalanches, separated by quiet timeswithout any slipping activity. Here we compare the statisticsand the dynamics of these slip events with the predictions ofa simple mean field model that describes slips inside solidmaterials. The agreement between experiments and theorylinks surface friction to internal friction and thereby leads to apredictive understanding that can be used to guide the designof better materials.
In general, slip avalanches locally dissipate the energy at aninterface between larger bodies; this can occur on large scalessuch as earthquakes [1] down to nanoscale dislocation motionin crystalline solids [2]. In nanocrystals, for example, the slipstypically occur exceedingly quickly, making it challengingto measure them experimentally. If they occur inside thesolid, the buried interface often forces the measurement to belocated far from the active regions and the resolution of timeand force are not easily captured [3].
In contrast, surface friction studies can provide more ac-cess to slip behavior and specifically stick-slip motions be-
*Retired.†[email protected]
Published by the American Physical Society under the terms of theCreative Commons Attribution 4.0 International license. Furtherdistribution of this work must maintain attribution to the author(s)and the published article’s title, journal citation, and DOI.
cause the samples are often larger, they are sometimes trans-parent, and the slips proceed more slowly. The experimentscan then elicit the behavior based on the surface compositionand topography, applied normal force, and driving translationspeed or displacement [4]. The friction experiments also pro-vide information about material changes. For example, plasticdeformation manifests in the stick-slip behavior via shearweakening, shear strengthening, or approximately zero weak-ening [5–7]. Rate-dependent surface deformation is a well-established field, but still the durations of individual slips,caused by elastic (depinning) deformation or plastic deforma-tion, can be small, on the order of nanoseconds to microsec-onds [8]. We discuss a simple statistical mean field modelthat can accurately describe these effects and compare thepredictions with sufficient experimental data for validation.
According to rubber elasticity, the material recoil of softmaterials such as elastomers, during slip, is slower than forhard materials [9]. This slowed-down dynamics of soft mate-rials provides us with dramatically increased temporal reso-lution of the individual slip events. Recently, a material evensofter than an elastomer, a hydrogel of E ′ ∼ 10 s kPa, expe-rienced stick-slip motion in a microtribological measurementwhile sliding under a smooth glass probe. This extends theslip timescale up to milliseconds. In addition, the compliantsurface provides a conformal contact and the area of contactcan spread to the entire interface. In contrast, in hard materialsthe interfaces touch only at the asperity peaks.
The dramatically slowed-down dynamics in soft materialsovercomes the experimental challenges of time resolution andisolated nanoscopic contact areas. Also, in soft materials suchas hydrogels we can safely exclude roughness, electronicproperties, or crystallographic properties as the origins of the
2643-1564/2020/2(4)/042016(6) 042016-1 Published by the American Physical Society

ZHENG, URUEÑA, DUNN, UHL, AND DAHMEN PHYSICAL REVIEW RESEARCH 2, 042016(R) (2020)
stick-slip behavior, thereby drastically simplifying the dataanalysis.
Hydrogels are typically known for smooth sliding, orexcellent lubricity, and as such are used for low-frictionsurfaces in biomedicine (catheter coatings, contact lenses,and drug delivery [10]) and industrial applications (drillingmuds [11]). However, when a surface hydrogel layer withhigh water content (greater than 80% water by mass) iscompressed under pressures approaching its elastic modulusand then subjected to prescribed shear, the collapsed layerresults in frictional instability and gross stick-slip events [12].In this work we induce stick-slip behavior under a variety ofpressures, analyze the behavior, and compare the results to asimple model to understand the behavior.
Specifically, we analyze the friction force avalanches re-sulting from shear of a glass-hydrogel interface under sevendifferent normal loads. We characterize the force drop am-plitudes in the force versus time data sets. We show thatthe stick-slip behaviors of the friction between a hydrogelsurface and a glass probe satisfy universal power laws andscaling functions predicted by a simple mean field theory forslip avalanches inside solid materials [6]. The statistics anddynamics of the slip events during surface friction agree withthose of the slips occurring during internal friction inside thebulk of many solid materials, as was predicted by the samemean field model [5–7].
II. METHODS
The simple mean field theory (MFT) [6] provides a unifiedunderstanding of plasticity for many materials, such as crys-tals, metallic glasses, and densely packed granular solids [7].The model assumes that the vast majority of solid materialshave weak spots. It assumes that the weak spots slip when-ever the local force exceeds some threshold. For our frictionexperiments this implies that weak spots at the frictionalinterface slip whenever the applied force from the cantileverlateral deflection exceeds the static friction coefficient in thecontact. The weak spot undergoes a local slip until the stressin the contact is reduced to some local (random) arrest stress.A slipping weak spot can trigger other elastically coupledweak spots to slip by increasing the stress at these points.This process creates an avalanche of slip instabilities. Forbrittle materials, the model assumes that the threshold toslipping can be weakened after a slip similar to static versusdynamic friction. In that case it predicts two types of slipavalanches: (1) small slip avalanches that have self-similardynamics and (2) large slip avalanches that have cracklikescaling behaviors and recur almost periodically at constantimposed average displacement rate. The simple MFT predictsboth the power-law exponents and scaling function of theslip-size distributions. The mean field approximation has beenproven mathematically to apply when the slip is localized toa plane, as is the case in friction experiments on a plane (likehere) and in materials with shear planes such as bulk metallicglasses and earthquakes [6,13].
To elicit systematic and detailed stick-slip behaviorand to test the model predictions, we measure the frictionforces between a thin hydrogel layer and a hemisphericalbroad-radius borosilicate glass probe under different appliednormal forces. The thin hydrogel layer in this study is
input velocity
spring force
applied load
frictionforcemass
position
surface hydrogel layer
FN = 1876.49 μN
Fric
tion
forc
e (μ
N)
Time (s)
(a)
(b)1500
1000
500
0
-5000.0 0.5 1.0 1.5 2.0
1.00-200
0200400600
1.05 1.10 1.15
FIG. 1. (a) Schematic of the experimental setup including asmooth glass frictional probe, surface hydrogel, and force measure-ment mechanism through static flexure deflection. (b) Example forcedrops versus time for the total sliding motion. The normal force FN
in this example is 1876.49 μN. The inset shows a close-up version,which allows us to resolve small force drops.
approximately 5 µm thick with an effective elastic modulusof 25 kPa as measured by contacting, colloidal probe atomicforce microscopy. The surface mechanics of the materialunder low pressure were characterized in prior work [12]. Ina custom microtribometer, a glass probe of radius 3 mm isloaded against the thin surface hydrogel layer up to a normalload of FN = 2000 μN, all submerged in a buffered salinesolution. Then the hydrogel is translated at an input velocity ofV = 200 μm/s by a high-resolution linear piezoelectric stage(PI USA, Auburn, MA) to a stroke length of s = 600 μm[Fig. 1(a)]. The stage slides back and forth for multiple cyclesand the normal force is decreased to incrementally lowercycle-averaged values ranging from FN = 1876 μN down toFN = 127 μN. Based on a bed-of-springs thin-film elasticitymodel [14,15], those applied forces are anticipated to result inexceedingly high pressures of P = 25 kPa down to P = 8 kPa,which means the surface is completely compressed(one-dimensional strain through the surface layer thicknessεV → 1) at the higher pressures and still experiencesεV ∼ 0.3 at the lowest pressure. During the translation, lateralforces (or friction forces) are recorded at 544 Hz throughanalog voltages using a data acquisition board and customsoftware (National Instruments, Austin, TX). The force is
042016-2
SIMILARITY OF INTERNAL AND EXTERNAL … PHYSICAL REVIEW RESEARCH 2, 042016(R) (2020)
time (s)
time (s)
0500
10001500
-4-2024
0300600900
-4-202
0200400600
-2-1012
0200400600
-2-101
0100200300400
-1.5-1.0-0.50.00.51.0
050
100150200
-1.0-0.50.00.5
050
100150200
-1.0-0.50.00.5
0 0.1 0.2 0.3 0.4 0.5 0.6 0.7 0.8 0.9 1
0 0.1 0.2 0.3 0.4 0.5 0.6 0.7 0.8 0.9 1
x105
x105
x105
x105
x105
x105
x105
dFF/d
t (N
s-1)
F F (
N)
dFF/d
t (N
s-1)
F F (
N)
dFF/d
t (N
s-1)
F F (
N)
dFF/d
t (N
s-1)
F F (
N)
FN = 1876 N FN = 482 N
FN = 1876 N FN = 482 N
FN = 1265 N FN = 283 N
FN = 1265 N FN = 283 N
FN = 875 N FN = 127 N
FN = 875 N FN = 127 N
FN = 676 N
FN = 676 N
(a)
(b)
(c)
(d)
(e)
(f)
(g)
(h)
(n)
(m)
(l)
(k)
(j)
(i)
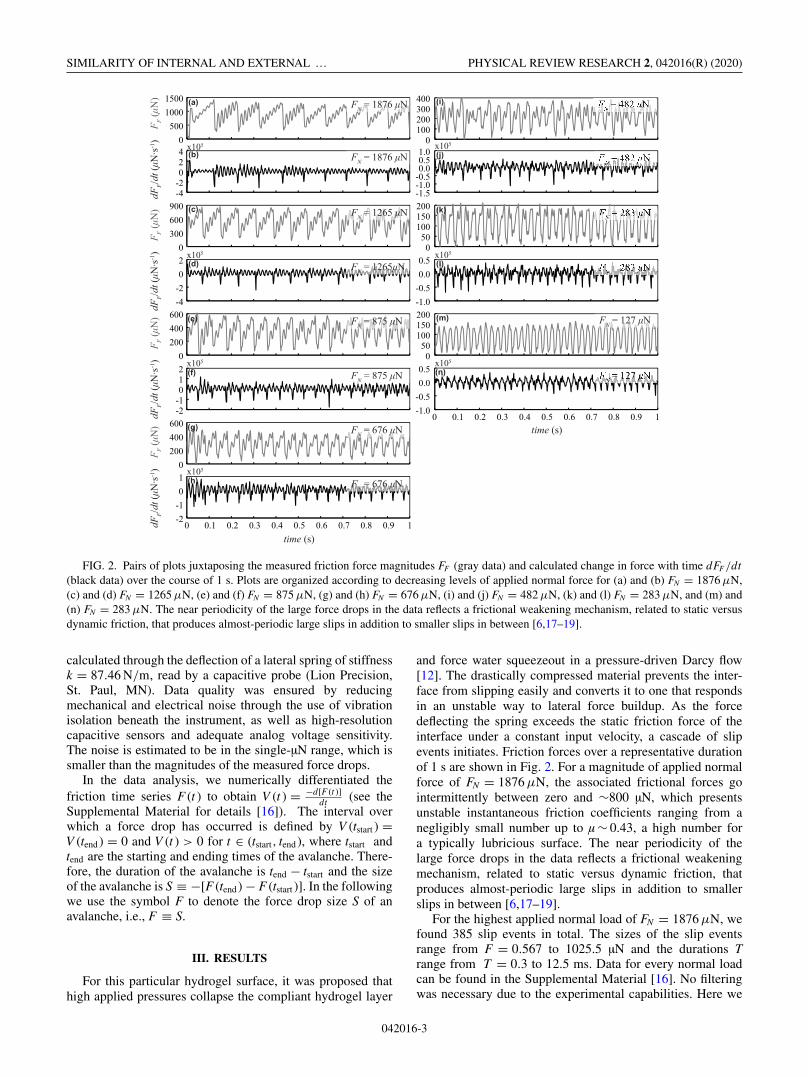
FIG. 2. Pairs of plots juxtaposing the measured friction force magnitudes FF (gray data) and calculated change in force with time dFF /dt(black data) over the course of 1 s. Plots are organized according to decreasing levels of applied normal force for (a) and (b) FN = 1876 μN,(c) and (d) FN = 1265 μN, (e) and (f) FN = 875 μN, (g) and (h) FN = 676 μN, (i) and (j) FN = 482 μN, (k) and (l) FN = 283 μN, and (m) and(n) FN = 283 μN. The near periodicity of the large force drops in the data reflects a frictional weakening mechanism, related to static versusdynamic friction, that produces almost-periodic large slips in addition to smaller slips in between [6,17–19].
calculated through the deflection of a lateral spring of stiffnessk = 87.46 N/m, read by a capacitive probe (Lion Precision,St. Paul, MN). Data quality was ensured by reducingmechanical and electrical noise through the use of vibrationisolation beneath the instrument, as well as high-resolutioncapacitive sensors and adequate analog voltage sensitivity.The noise is estimated to be in the single-µN range, which issmaller than the magnitudes of the measured force drops.
In the data analysis, we numerically differentiated thefriction time series F (t ) to obtain V (t ) = −d[F (t )]
dt (see theSupplemental Material for details [16]). The interval overwhich a force drop has occurred is defined by V (tstart ) =V (tend ) = 0 and V (t ) > 0 for t ∈ (tstart, tend ), where tstart andtend are the starting and ending times of the avalanche. There-fore, the duration of the avalanche is tend − tstart and the sizeof the avalanche is S ≡ −[F (tend ) − F (tstart )]. In the followingwe use the symbol F to denote the force drop size S of anavalanche, i.e., F ≡ S.
III. RESULTS
For this particular hydrogel surface, it was proposed thathigh applied pressures collapse the compliant hydrogel layer
and force water squeezeout in a pressure-driven Darcy flow[12]. The drastically compressed material prevents the inter-face from slipping easily and converts it to one that respondsin an unstable way to lateral force buildup. As the forcedeflecting the spring exceeds the static friction force of theinterface under a constant input velocity, a cascade of slipevents initiates. Friction forces over a representative durationof 1 s are shown in Fig. 2. For a magnitude of applied normalforce of FN = 1876 μN, the associated frictional forces gointermittently between zero and ∼800 µN, which presentsunstable instantaneous friction coefficients ranging from anegligibly small number up to µ ∼ 0.43, a high number fora typically lubricious surface. The near periodicity of thelarge force drops in the data reflects a frictional weakeningmechanism, related to static versus dynamic friction, thatproduces almost-periodic large slips in addition to smallerslips in between [6,17–19].
For the highest applied normal load of FN = 1876 μN, wefound 385 slip events in total. The sizes of the slip eventsrange from F = 0.567 to 1025.5 µN and the durations Trange from T = 0.3 to 12.5 ms. Data for every normal loadcan be found in the Supplemental Material [16]. No filteringwas necessary due to the experimental capabilities. Here we
042016-3

ZHENG, URUEÑA, DUNN, UHL, AND DAHMEN PHYSICAL REVIEW RESEARCH 2, 042016(R) (2020)
FIG. 3. (a) Cumulative distribution of friction force drops duringslip events at interfaces nominally loaded to normal forces betweenFN = 127.11 and 1876.49 μN. The red dashed line has a slope of –1/2, which is predicted by a simple mean field model. Measurementsare expected to be valid for force drops F > 1 μN based on thesensitivity of the data acquisition system. (b) Maximum force droprate versus force drop size and (c) force drop duration versus forcedrop size. In both figures, there are 3022 data points in total and thenormal forces range from FN = 127.11 to 1876.49 μN. The slopesof the red dashed lines again indicate the corresponding scalingexponents predicted by the same mean field model. The slopes of thered lines are 1/2. Data points are split into ten bins, each of whichhas the same number of data points. Red dots are average values ofeach bin. At the largest force drop sizes F > 120 μN, the force dropduration no longer depends on force drop size (i.e., no durations areabove T > 0.02s).
briefly summarize some of the model predictions for the forcedrop statistics between a hydrogel surface and a glass probe:The complementary cumulative size distribution C(F ) scalesas C(F ) ∼ F−1/2 for force drops in the power-law scalingregime [Fig. 3(a)] for most of the normal forces that wereemployed (except for the highest normal forces, where thescaling regime has shrunk too much to be visible in the figure).The large events seen especially for the highest forces arereflecting a weakening effect, such as static versus dynamicfriction which is predicted to create large slips of similar sizein addition to the smaller ones [5–7,17–19], consistent withthe experiments shown here. Moreover, for the events in thescaling regime the maximum force drop rate vm and forcedrop duration T at size F , scale as vm|F ∼ (F )σρ ∼ (F )1/2
and T |F ∼ F σνz ∼ F 1/2, respectively, which are in goodagreement with the model predictions [Figs. 3(b) and 3(c)].Here σρ and συz are critical exponents that are predicted bythe model to be universal, i.e., determined by basic propertiessuch as symmetries, dimensions, and range of interactions.They are independent of the microscopic details of the system[5,6]. The names of these exponents are complicated for his-torical reasons. The mean field model predicts σρ = 1/2 andσυz = 1/2 [5,6,20]. The scaling for the largest events againis slightly different from that of the small ones, consistentwith the weakening prediction of the model that predicts
FIG. 4. Average force drop rate versus time for different forcedrop sizes F (scaling both axes by a factor of F−1/2). Profiles areaveraged over force drops that have similar force drop sizes. Theinset shows the unscaled average force drop rate versus time. Thepredicted collapse function represented by the red dashed line hasthe form Axe−Bx2
, where A and B are nonuniversal constants A =2.82 × 10⁷ and B = 1.54 × 10⁷. The collapse shows that the modelpredictions for the scaling exponents and the scaling function areconsistent with the experimental data.
that weakening correspondingly changes the dynamics for thelargest events [5–7,17–19].
Figure 4 shows the average temporal profiles of forcedrops of given size in the scaling regime of C(F ). Here theaverage temporal profile is defined as the force drop rate as afunction of time averaged over all force drops of similar sizeF . After scaling both axes by F−1/2, profiles collapse ontothe predicted collapse function, represented by the red dashedline. Similarly, the temporal profiles averaged over force dropsof similar durations T also agrees with the model predictionswhen both axes are rescaled by their maxima (Fig. 5). Theresult shows that the average shape is an inverted parabola.Similar results for a smaller normal load are shown in theSupplemental Material [16].
The collapses shown in Figs. 4 and 5 and in [16] areconsistent with the predictions of the simple mean field model[5,6]. The model predicts that the small avalanches withinthe power-law scaling regime should have average tempo-ral profiles that are simply rescaled versions of the largeravalanches in the scaling regime, reflecting the self-similarity
FIG. 5. Rescaled force drop rate versus rescaled time (bothaxes are scaled by their maxima). Profiles are averaged over forcedrops that have similar durations. The red dashed line shows themodel prediction of a parabolic average avalanche shape, whichis very similar to the experimental data. The slight asymmetryto the left may reflect frictional delay effects, similar to those inearthquakes [21].
042016-4

SIMILARITY OF INTERNAL AND EXTERNAL … PHYSICAL REVIEW RESEARCH 2, 042016(R) (2020)
in the dynamics that is expected near a critical point. Themodel predicts not just the rescaling exponents but also thescaling functions of these average profiles. The predictedscaling functions agree with the data as shown in Figs. 4 and5 and in [16].
Specifically, the model predicts that the force droprate 〈dF/dt (t |T )〉 averaged over all avalanches of givenduration T in the scaling regime should scale as aparabola: 〈dF/dt (t |T )〉/T ∼ [1 − (t/T )](t/T ). Similarly,the force drop rate 〈dF/dt (t |F )〉 averaged over all forcedrops of size F should scale as 〈dF/dt (t |F )〉/F 1/2 ∼(t/F 1/2)exp[−B(t/F 1/2)2], where B is the only fitting con-stant. Both of these predicted profiles [5,6] are consistent withthe experimental data in Figs. 4 and 5.
IV. DISCUSSION
The described mean field model appears to accuratelydescribe the stick-slip motion observed for a glass-hydrogelinterface under high pressures from 40% to 100% of theYoung’s modulus of the surface hydrogel layer. The periodiclarge slips interleaved with irregular small slips indicate thatthe interface can be described as shear weakening; similarto static versus kinetic Coulomb friction, regions that haveslipped once during an avalanche will slip again at much lowerforces than was originally needed to start the first slip in a slipavalanche.
Thorough investigations of soft surface stick-slip mecha-nisms have determined that they arise from synergistic coop-eration of mechanisms such as viscoelastic deformation, ad-hesion, and even surface damage [22–28]. While some hydro-gels can exhibit viscoelastic behavior, the parabolic symmetryof the normalized average force drop rate for slips of giventotal duration T (Fig. 5) indicates that inertial effects such asviscoelastic recoil can be neglected, at least for the smallerslips within the avalanche [5,7]. Further, surface deformationwas expected to remain in the plane of contact due to thehigh rotational stiffness of the probe flexure [22], preventingout-of-plane surface displacements, which would complicatethe stresses in the interface (observed in elastomeric stick-slip motion [29]). In addition, no surface damage was ob-served, and surface energies in a buffered saline solution arenegligible.
Since those mechanics are not expected to contribute sig-nificantly, other characteristics specific to the hydrogel surfacelayer, such as the porous nature of the surface, may contributeto the observed stick-slip behavior. Prior work postulates thathigh applied pressures collapse the surface hydrogel layer[12] and recent poroelastic modeling of hydrogel lubricationshows that fluid squeezeout alters the surface properties underslip [30]. The low modulus of elasticity of this material(∼25 kPa) would make it highly susceptible to fluid squeeze-out under the pressures of these measurements, estimated to
be between 8 and 25 kPa. The alterations to the hydrogelsurface under high pressures, perhaps such as compaction,manifest as unstable friction behavior that is well describedby the shear-weakening slip avalanche mean field model.
The experiments described in this work load two verydissimilar surfaces (a smooth glass against a very complianthydrogel surface) and prescribe a driving speed in the farfield, eliciting observable stick-slip events in the form of forcedrops along the slip direction. The statistical similarity ofthe slip statistics and dynamics to those of internal interfacesobserved in the deformation of bulk metallic glasses [2]supports the model prediction that surface friction and internalfriction share similar energy-dissipation characteristics [31].This similarity is also reminiscent of the scalability of brittlefracture mechanics between hard materials and soft materials[32]. Future work is needed to define the limits of similarityand the subtleties of material properties. Instrumented surfacefriction measurements in the form of microtribometry showpromise as a technique for systematically varying the surfacesused to compose the interface (material properties and surfaceenergies), along with the prescribed loading conditions anddriving speeds. Connections to models and friction measure-ments varying other experimental tuning parameters such asdriving speeds are left for future work [22,29,33].
V. CONCLUSION
This study has three main results. (1) Microfriction ex-periments at high pressures were performed on hydrogelsurface layers to induce stick-slip behaviors. The force dropevents were observed when applied pressures approached theeffective elastic modulus of the surface hydrogel layer. (2)The scaling behavior of the maximum force drop rate as afunction of force drop size and the force drop duration asa function of force drop size follow power laws that agreewith predictions of a simple mean field model. (3) The forcedrop size distributions and temporal shapes of avalanches areconsistent with the predictions from MFT, suggesting that thedynamics at interfaces created by the surfaces of dissimilarmaterials and within shear bands or interfaces internal toa material have the same statistical scaling behavior [17].In addition, instrumented surface friction experiments showpromise as a way to systematically explore these similarities.
ACKNOWLEDGMENTS
We thank the University of Florida Soft Matter Engineer-ing group for instrument use. We thank Will McFaul, AlanLong, and Mohammed Sheikh for helpful conversations. Wethank the National Science Foundation for support throughGrant No. NSF CBET 1336634 (K.A.D.) and CMMI 1751945(A.C.D.).
[1] P. Bak and C. Tang, J. Geophys. Res. 94, 15635 (1989).[2] R. Maass, M. Wraith, J. T. Uhl, J. R. Greer, and K. A. Dahmen,
Phys. Rev. E 91, 042403 (2015) .[3] W. G. Sawyer and K. J. Wahl, MRS Bull. 33, 1145 (2008).
[4] I. Hutchings, Tribology, Friction and Wear of EngineeringMaterials, 1st ed. (Butterworth-Heinemann, Oxford, 1992).
[5] K. A. Dahmen, Y. Ben-Zion, and J. T. Uhl, Nat. Phys. 7, 554(2011).
042016-5

ZHENG, URUEÑA, DUNN, UHL, AND DAHMEN PHYSICAL REVIEW RESEARCH 2, 042016(R) (2020)
[6] K. A. Dahmen, Y. Ben-Zion, and J. T. Uhl, Phys. Rev. Lett. 102,175501 (2009) .
[7] J. T. Uhl, S. Pathak, D. Schorlemmer, X. Liu, R. Swindeman,B. A. W. Brinkman, M. LeBlanc, G. Tsekenis, N. Friedman,R. Behringer, D. Denisov, P. Schall, X. Gu, W. J. Wright, T.Hufnagel, A. Jennings, J. R. Greer, P. K. Liaw, T. Becker, G.Dresen, and K. A. Dahmen, Sci. Rep. 5, 16493 (2015).
[8] F. F. Abraham, R. Walkup, H. Gao, M. Duchaineau, T. Diaz DeLa Rubia, and M. Seager, Proc. Natl. Acad. Sci. USA 99, 5783(2002).
[9] K. Viswanathan, N. K. Sundaram, and S. Chandrasekar, SoftMatter 12, 5265 (2016).
[10] C. M. Kirschner and K. S. Anseth, Acta Mater. 61, 931 (2013).[11] R. Zolfaghari, A. A. Katbab, J. Nabavizadeh, R. Y. Tabasi, and
M. H. Nejad, J. Appl. Polym. Sci. 100, 2096 (2006).[12] A. C. Dunn, J. M. Urueña, Y. Huo, S. S. Perry, T. E. Angelini,
and W. G. Sawyer, Tribol. Lett. 49, 371 (2013).[13] D. S. Fisher, K. A. Dahmen, S. Ramanathan, and Y. Ben-Zion,
Phys. Rev. Lett. 78, 4885 (1997).[14] A. C. Rennie, P. L. Dickrell, and W. G. Sawyer, Tribol. Lett. 18,
499 (2005).[15] P. Põdra and S. Andersson, Wear 207, 79 (1997).[16] See Supplemental Material at http://link.aps.org/supplemental/
10.1103/PhysRevResearch.2.042016 for details.[17] J. Antonaglia, W. J. Wright, X. Gu, R. R. Byer, T. C. Hufnagel,
M. LeBlanc, J. T. Uhl, and K. A. Dahmen, Phys. Rev. Lett. 112,155501 (2014).
[18] A. A. Long, D. V. Denisov, P. Schall, T. C. Hufnagel, X. Gu, W.J. Wright, and K. A. Dahmen, Granul. Matter 21, 99 (2019).
[19] D. V. Denisov, K. A. Lorincz, J. T. Uhl, K. A. Dahmen, and P.Schall, Nat. Commun. 7, 10641 (2016).
[20] M. LeBlanc, A. Nawano, W. J. Wright, X. Gu, J. T. Uhl, andK. A. Dahmen, Phys. Rev. E 94, 052135 (2016).
[21] A. P. Mehta, K. A. Dahmen, and Y. Ben-Zion, Phys. Rev. E 73,056104 (2006).
[22] T. Baumberger and C. Caroli, Adv. Phys. 55, 279 (2006).[23] J. H. Dieterich, Pure Appl. Geophys. 116, 790 (1978).[24] F. Heslot, T. Baumberger, B. Perrin, B. Caroli, and C. Caroli,
Phys. Rev. E 49, 4973 (1994).[25] S. Maegawa, F. Itoigawa, and T. Nakamura, Tribol. Int. 96, 23
(2016).[26] C. J. Rand and A. J. Crosby, Appl. Phys. Lett. 89, 261907
(2006).[27] Y. Kligerman and M. Varenberg, Tribol. Lett. 53, 395 (2014).[28] S. Maegawa and K. Nakano, Wear 268, 924 (2010).[29] M. K. Chaudhury and K. H. Kim, Eur. Phys. J. E 23, 175
(2007).[30] E. R. Reale and A. C. Dunn, Soft Matter 13, 428 (2017).[31] M. Paczuski and S. Boettcher, Phys. Rev. Lett. 77, 111
(1996).[32] T. Goldman Boué, R. Harpaz, J. Fineberg, and E. Bouchbinder,
Soft Matter 11, 3812 (2015).[33] T. Yamaguchi, M. Morishita, M. Doi, T. Hori, H. Sakaguchi,
and J. P. Ampuero, J. Geophys. Res. 116, B12306 (2011).
042016-6