PHYSICAL REVIEW RESEARCH2, 033503 (2020)
8
PHYSICAL REVIEW RESEARCH 2, 033503 (2020) Collapse of the simple localized 3d 1 orbital picture in Mott insulator Shunsuke Kitou , 1, 2 , * Taishun Manjo, 1 Naoyuki Katayama, 1 Tatsuya Shishidou, 3 Taka-hisa Arima, 4, 5 Yasujiro Taguchi , 5 Yoshinori Tokura , 5, 6 Toshikazu Nakamura , 2 Toshihiko Yokoyama, 2 Kunihisa Sugimoto , 7 and Hiroshi Sawa 1 , † 1 Department of Applied Physics, Nagoya University, Nagoya 464-8603, Japan 2 Department of Materials Molecular Science, Institute for Molecular Science, Myodaiji, Okazaki 444-8585, Japan 3 Department of Physics, University of Wisconsin-Milwaukee, Wisconsin 53201, USA 4 Department of Advanced Materials Science, University of Tokyo, Kashiwa 277-8561, Japan 5 RIKEN Center for Emergent Matter Science, Wako 351-0198, Japan 6 Department of Applied Physics, University of Tokyo, Bunkyo-ku, Tokyo 113-8656, Japan 7 Japan Synchrotron Radiation Research Institute (JASRI), SPring-8, Hyogo 679-5198, Japan (Received 22 April 2020; accepted 8 September 2020; published 28 September 2020) The orbital degree of freedom of electrons greatly influences the physical properties of materials such as magnetic order and unconventional superconductivity. An orbital is a minimal unit of “shape,” and the orbital state can be unraveled by observing the spatial anisotropic distribution of electrons. However, it is difficult to experimentally extract the orbital information in a crystal because of various technical problems. Here, the Ti-3d orbital state in perovskite-type oxides RTiO 3 (R = Y, Sm, and La) is directly determined by a core differential Fourier synthesis (CDFS) method using synchrotron x-ray diffraction. The valence electron-density distribution, including information on the anisotropy and the hybridization between atomic orbitals, can be extracted from the CDFS analysis. Our study not only demonstrates the relationship between the magnetic- and orbital-ordered states called the Kugel-Khomskii model, but also provides a nontrivial picture of the orbital state reconstructed by the orbital hybridization. DOI: 10.1103/PhysRevResearch.2.033503 I. INTRODUCTION The degree of freedom (DOF) of an electronic orbital, which responds to the crystal electric field, is the minimal unit of “shape” by localized valence electrons in a crystal, and an important parameter determined using Neumann’s princi- ple [1], which describes the relationship between anisotropic physical properties and crystallographic point groups. For example, the magnetic and orbital ground states are coupled by the Kugel-Khomskii model [2]. However, some series of systems show quantum phase transitions between different ground states despite the same point group. In this case, deter- mining the quantum parameters of electronic orbitals at local magnetic sites is crucial. In a crystalline material, among three DOFs of electrons (charge, spin, orbital), the charge and spin can readily react to external electric and/or magnetic fields. However, directly observing the orbital is difficult, although it greatly influences material anisotropic physical properties [3], such as uncon- ventional superconductivity [4–7] and giant magnetoelectric * Corresponding author: [email protected] † Corresponding author: [email protected] Published by the American Physical Society under the terms of the Creative Commons Attribution 4.0 International license. Further distribution of this work must maintain attribution to the author(s) and the published article’s title, journal citation, and DOI. effect [8–10]. If the electron orbital can be directly observed, for example, it will provide an experimental research guide- line for an electron nematic phase [11], where it is difficult to extract the nematicity from the structural information. The orbital state in materials has been studied by several ex- perimental methods including polarized neutron diffraction [12], resonant x-ray scattering [13,14], and multipole analy- sis using x-ray diffraction (XRD) [15]. Most recently, a Co orbital-ordered state at the surface in CeCoIn 5 was observed by scanning tunneling microscope [16], and orbital imag- ing in Ni ions was achieved by nonresonant inelastic x-ray scattering [17]. However, in these methods, the measurable substances are limited and/or the results may depend on the model constructed by the analysts. Therefore, an experimental measurement or calculation tool is required that can easily determine the orbital state without the assumed model. Here, we focus on determining the orbital-ordered state of an RTiO 3 series, where R is a rare-earth element. The Ti 3+ -3d 1 orbital-ordered state in a TiO 6 octahedron is char- acterized by an electron localized in the t 2g orbitals as a Mott insulator by strong electron correlations. Although the space group in this system is common (Pnma), the ground state systematically changes from antiferromagnetic (AFM) to ferromagnetic (FM) as the ion size of R decreases, as summa- rized in phase diagrams [18,19]. In the RTiO 3 series, various theoretical studies on the orbital and magnetic ground states have been performed by assuming a localized Ti 3+ -3d 1 orbital [20–23]. This series is a typical material for verifying (i) the spatial resolution required for direct observation of the orbital 2643-1564/2020/2(3)/033503(8) 033503-1 Published by the American Physical Society
Transcript of PHYSICAL REVIEW RESEARCH2, 033503 (2020)

PHYSICAL REVIEW RESEARCH 2, 033503 (2020)
Collapse of the simple localized 3d1 orbital picture in Mott insulator
Shunsuke Kitou ,1,2,* Taishun Manjo,1 Naoyuki Katayama,1 Tatsuya Shishidou,3 Taka-hisa Arima,4,5 Yasujiro Taguchi ,5
Yoshinori Tokura ,5,6 Toshikazu Nakamura ,2 Toshihiko Yokoyama,2 Kunihisa Sugimoto ,7 and Hiroshi Sawa 1,†
1Department of Applied Physics, Nagoya University, Nagoya 464-8603, Japan2Department of Materials Molecular Science, Institute for Molecular Science, Myodaiji, Okazaki 444-8585, Japan
3Department of Physics, University of Wisconsin-Milwaukee, Wisconsin 53201, USA4Department of Advanced Materials Science, University of Tokyo, Kashiwa 277-8561, Japan
5RIKEN Center for Emergent Matter Science, Wako 351-0198, Japan6Department of Applied Physics, University of Tokyo, Bunkyo-ku, Tokyo 113-8656, Japan
7Japan Synchrotron Radiation Research Institute (JASRI), SPring-8, Hyogo 679-5198, Japan
(Received 22 April 2020; accepted 8 September 2020; published 28 September 2020)
The orbital degree of freedom of electrons greatly influences the physical properties of materials such asmagnetic order and unconventional superconductivity. An orbital is a minimal unit of “shape,” and the orbitalstate can be unraveled by observing the spatial anisotropic distribution of electrons. However, it is difficult toexperimentally extract the orbital information in a crystal because of various technical problems. Here, the Ti-3dorbital state in perovskite-type oxides RTiO3 (R = Y, Sm, and La) is directly determined by a core differentialFourier synthesis (CDFS) method using synchrotron x-ray diffraction. The valence electron-density distribution,including information on the anisotropy and the hybridization between atomic orbitals, can be extracted fromthe CDFS analysis. Our study not only demonstrates the relationship between the magnetic- and orbital-orderedstates called the Kugel-Khomskii model, but also provides a nontrivial picture of the orbital state reconstructedby the orbital hybridization.
DOI: 10.1103/PhysRevResearch.2.033503
I. INTRODUCTION
The degree of freedom (DOF) of an electronic orbital,which responds to the crystal electric field, is the minimalunit of “shape” by localized valence electrons in a crystal, andan important parameter determined using Neumann’s princi-ple [1], which describes the relationship between anisotropicphysical properties and crystallographic point groups. Forexample, the magnetic and orbital ground states are coupledby the Kugel-Khomskii model [2]. However, some series ofsystems show quantum phase transitions between differentground states despite the same point group. In this case, deter-mining the quantum parameters of electronic orbitals at localmagnetic sites is crucial.
In a crystalline material, among three DOFs of electrons(charge, spin, orbital), the charge and spin can readily reactto external electric and/or magnetic fields. However, directlyobserving the orbital is difficult, although it greatly influencesmaterial anisotropic physical properties [3], such as uncon-ventional superconductivity [4–7] and giant magnetoelectric
*Corresponding author: [email protected]†Corresponding author: [email protected]
Published by the American Physical Society under the terms of theCreative Commons Attribution 4.0 International license. Furtherdistribution of this work must maintain attribution to the author(s)and the published article’s title, journal citation, and DOI.
effect [8–10]. If the electron orbital can be directly observed,for example, it will provide an experimental research guide-line for an electron nematic phase [11], where it is difficultto extract the nematicity from the structural information. Theorbital state in materials has been studied by several ex-perimental methods including polarized neutron diffraction[12], resonant x-ray scattering [13,14], and multipole analy-sis using x-ray diffraction (XRD) [15]. Most recently, a Coorbital-ordered state at the surface in CeCoIn5 was observedby scanning tunneling microscope [16], and orbital imag-ing in Ni ions was achieved by nonresonant inelastic x-rayscattering [17]. However, in these methods, the measurablesubstances are limited and/or the results may depend on themodel constructed by the analysts. Therefore, an experimentalmeasurement or calculation tool is required that can easilydetermine the orbital state without the assumed model.
Here, we focus on determining the orbital-ordered stateof an RTiO3 series, where R is a rare-earth element. TheTi3+-3d1 orbital-ordered state in a TiO6 octahedron is char-acterized by an electron localized in the t2g orbitals as aMott insulator by strong electron correlations. Although thespace group in this system is common (Pnma), the groundstate systematically changes from antiferromagnetic (AFM) toferromagnetic (FM) as the ion size of R decreases, as summa-rized in phase diagrams [18,19]. In the RTiO3 series, varioustheoretical studies on the orbital and magnetic ground stateshave been performed by assuming a localized Ti3+-3d1 orbital[20–23]. This series is a typical material for verifying (i) thespatial resolution required for direct observation of the orbital
2643-1564/2020/2(3)/033503(8) 033503-1 Published by the American Physical Society

SHUNSUKE KITOU et al. PHYSICAL REVIEW RESEARCH 2, 033503 (2020)
state, and (ii) the dynamic range for extracting information ofone electron from all in the unit cell. However, despite variousexperiments on the orbital state of RTiO3 [12–15,24,25], fewquantum parameters have been reported for substances otherthan YTiO3.
For RTiO3 system, the crystal electric field around Ti3+changes because the combined Jahn-Teller-type and GdFeO3-type distortions change with the ion radius of R [20,22,26].The Ti-3d orbital-ordered state is greatly affected by the dis-tortions. Also, the significance of the Ti-O hybridization inthis system is pointed out [23,27]. However, all experimentalresults were analyzed based on only a localized 3d orbitalmodel [12–15,24,25], in which the bonding/covalent electronsbetween the Ti and O orbitals were not considered.
To fully understand the physical properties in this sys-tem, information on the spatial distribution of the valenceelectron density (VED) is indispensable. Recently, we pro-posed an electron-density (ED) analysis method called coredifferential Fourier synthesis (CDFS) [28] using synchrotronXRD. Using this method in an organic charge-transfer salt, wesucceeded in the direct observation of the VED distributionformed by molecular orbitals as well as the determinationof the charge-ordering state [28]. The CDFS based on thehigh-resolution data obtained from short-wavelength syn-chrotron x ray is extremely effective for observing not onlyspatially extended molecular orbitals but also atomic or-bitals localized in one atom. In this paper, we revealed theTi-3d orbital-ordered state in RTiO3 (R = Y, Sm, and La)from the localized VED distribution with a spatial resolu-tion of ∼0.1 Å. Furthermore, through point-charge-model anddensity-functional-theory (DFT) calculations, it is verifiedthat the CDFS method indeed extracts essential orbital infor-mation.
II. METHODS
A. XRD experiments
The XRD experiments were performed on the BL02B1beamline at the synchrotron facility SPring-8 in Japan [29]. Ahelium-gas-blowing device was employed to cool the sampleto 25 K. A two-dimensional imaging plate, which had a dy-namic range of ∼106, was used as the detector. The incidentenergy of synchrotron x rays was E = 35 keV. For the crystalstructural analysis, we used original software for extractingthe diffraction intensity [30]. Diffraction intensity averagingwas performed using SORTAV [31]. Crystal structural and EDanalysis were performed using JANA2006 [32]. Crystal struc-ture and ED distribution figures were visualized by usingVESTA [33].
B. CDFS method
The diffraction intensity I (K ) obtained from the XRD ex-periment can be described as a Fourier transform of the EDρ(r) using the scattering vector K [Eq. (1)],
I (K ) = S
∣∣∣∣∫
allρ(r)e−iK·rdr
∣∣∣∣2
. (1)
Here, S is a scaling factor. The integration range [∫all inEq. (1)] corresponds to the range in which x rays can interfere
in the crystal. In the case of a crystal, it can be describedas Eq. (2) using Laue functions L(s), L(t ), L(u), where K =sa∗ + tb∗ + uc∗,
I (K ) = S L(s)L(t )L(u)
∣∣∣∣∫
unit cellρ(r)e−iK·rdr
∣∣∣∣2
∝ |Fobs(K )|2.(2)
Here, |Fobs(K )| is the absolute value of the experimentallyobserved crystal structure factor. As is well known, if thenumber of unit cells N in a crystal is sufficiently large, theLaue function becomes N2 only when s, t, u are integers, andwhen K = (s, t, u) �= (h, k, l ) (h, k, l are integers), I (K ) = 0.In principle, the ED distribution can be reproduced by theinverse Fourier transform of diffraction intensity according to
ρ(r) = 1
V
∞∑K
Fobs(K )eiK·r, (3)
if the infinite diffraction data was observed. However, thereare generally three problems when calculating the ED. (i) Toextract the VED with anisotropic information, a sufficientlywide dynamic range of intensity is required. (ii) |Fobs(K )| isobtained from the experimental diffraction intensity becauseof the relationship of I (K ) ∝ |Fobs(K )|2. In this case, |Fobs(K )|does not include information of the phase term P = eiφ(K )
as Fobs(K ) = |Fobs(K )|P = |Fobs(K )|eiφ(K ), which is necessaryfor the calculation of ρ(r). This phase retrieval problem hasbeen studied in various fields such as x-ray imaging [34,35],surface x-ray diffraction [36], and x-ray holography [37].(iii) Because the number of the Fobs(K ) data is finite, themathematical truncation effect appears prominently in the EDdistribution.
Concerning (i), the number of electrons of Ti-3d1 respon-sible for the orbital-ordered state is one per formula unit. Onthe other hand, the number of electrons of YTiO3 is 85 performula unit. If I (K ) is simplified to be proportional to thesquare of the number of electrons, it is necessary to have adynamic range that can accurately extract the 1/852 = 1/7225to 10−4 of the measured maximum intensity. The importantpoint is that 10−4 signal information should be observed withsufficient signal-to-noise S/N ratio. This requirement is suf-ficiently fulfilled by using the current synchrotron radiationfacility, in which the dynamic range of 106 is guaranteed.
Concerning (ii), since the phase term can be assigned fromthe calculated crystal structure factor
Fcal(K ) =∑
j
f jTje−iK·r j (4)
using P = Fcal(K )/|Fcal(K )|, Eq. (3) can be rewritten as
ρ(r) = 1
V
∞∑K
|Fobs(K )|PeiK·r. (5)
Here, r j is the jth atomic position, Tj is the jth atomicdisplacement parameter, and f j is the jth atomic scatteringfactor, which is described as
f j (K ) =∫
atomρ j (r)e−iK·rdr. (6)
For example, Fig. 1 shows the atomic scattering factor ofTi as a function of sin θ/λ [38]. Here, λ is the wavelength
033503-2

COLLAPSE OF THE SIMPLE LOCALIZED 3d1 … PHYSICAL REVIEW RESEARCH 2, 033503 (2020)
FIG. 1. Atomic scattering factor of Ti [38]. Black, blue, andorange lines indicate the contribution of the total, core, and valenceelectrons, respectively.
of the incident x ray, and θ is the XRD angle. While thecontribution of the core electrons extends to the high-angleregion, the contribution of the valence electrons exists only inthe low-angle region (sin θ/λ � 0.5 Å−1). When calculatingthe ED, it is necessary to determine Fcal(K ) with high accuracyto obtain the correct phase term P. For this purpose, the struc-tural refinement is performed using only the high-angle I (K )(the so-called high-angle analysis), where the contribution ofthe spatially spread valence electron is very small. In thisstudy, the high-order terms of anharmonic atomic displace-ment parameters were not considered, because we measuredthe crystal at an extremely low temperature.
Concerning (iii), the truncation effect of the Fourier syn-thesis can be suppressed by using the CDFS method. Theequation of the inverse Fourier transform by the CDFS methodis described as
ρv (r) = 1
V
∑K
{[|Fobs(K )|P
−∣∣∣∣∣∑
j
f corej Tje
−iK·r j
∣∣∣∣∣Pcore
]eiK·r
}+ nv
V. (7)
Here, f corej is the jth atomic scattering factor with only the
core electrons contribution, which corresponds to the blue linein Fig. 1. Pcore is the phase term with only the core electronscontribution calculated as P = F core
cal (K )/|F corecal (K )|. nv is the
total number of valence electrons contained in the unit cell.It is noted here that the 000 Bragg reflection intensity cannotbe observed experimentally. When ignoring the second termnv/V in Eq. (7), the total number of electrons in the unitcell becomes zero. Therefore, the VED distribution data arecorrected by adding the nv/V term.
In general, (sin θ/λ)max measured experimentally is∼2.5 Å−1 (dmin ∼ 0.2 Å) even when using the short-wavelength x ray obtained at the synchrotron radiation facility.In Fig. 1, a nonzero value remains in fTi(= f core
Ti ) at sin θ/λ =
2.5 Å−1. Therefore, even if the short-wavelength x ray is used,the mathematical truncation effect cannot be avoided from thecalculation using Eq. (5). On the other hand, in Eq. (7), theinverse Fourier transform is performed on the term obtainedby subtracting the core electron contribution from |Fobs(K )|,which contains the contribution of all electrons. Because mostof the contribution of the remaining f valence
Ti exists only insin θ/λ � 0.5 Å−1, it is possible to extract the VED withlittle truncation effect of the Fourier synthesis by the CDFSanalysis. It is noted that, in this study, the structural modelFcal(K ) [Eq. (4)] used to calculate the phase term does notconsider the anisotropic VED. Therefore, in the peculiar casesuch that the orbital state that breaks the site symmetry in theunit cell is realized, the phase recovery using a measurementmethod which is different from the diffraction experiment isnecessary. At present, this problem is an open question, andwe think it is an issue for the future.
XRD data must satisfy the following three conditions toperform the CDFS analysis. Condition 1: a dynamic range ofat least six digits or more, and statistical accuracy to guaranteethis range, to obtain the spatial distribution of one electronthat dominates the orbitals with respect to the total number ofelectrons in the asymmetric unit; condition 2: measurementsof the high-angle diffraction intensity corresponding to thehigh real-space resolution, for reconstructing an ED that canrepresent the spatial spread of the orbitals by the inverseFourier transform; and condition 3: 100% completeness of themeasured reciprocal-lattice space. An experiment satisfyingthe above conditions was performed on the BL02B1 beamlineat SPring-8 [29]. In the present experiment, the resolutionlimit was dmin = 0.25 Å [(sin θ/λ)max = 2.0 Å−1] and thecompleteness (the ratio of measured regions in the indepen-dent reciprocal-lattice space regions) was almost 100% thatallowed the CDFS analysis.
C. DFT calculation
The DFT calculations for ferromagnetic YTiO3 werecarried out using the full-potential linearized augmentedplane-wave method [39] as implemented in the HiLAPWcode and using the structural parameters determined inthe present XRD experiment (see Tables S1 and S2 inSupplemental Material Sec. 1 [40]). The muffin-tin sphereradii were set to 1.2 Å for Ti, Y and 0.8 Å for O. The Bril-louin zone was sampled with 10 × 10 × 10 k-point mesh.The local-density approximation plus Hubbard U (LDA + U)method [41] was employed to account for the on-site 3d-3dCoulomb interaction. The spin-orbit interaction is neglectedin our calculations because Ti is a light 3d transition metal.The Slater integrals used were F0 = 4 eV, F2 = 7.719 eV,and F4 = 4.383 eV [20] that corresponded to U = 4 eV andJ = 0.864 eV.
III. RESULTS
A. Structural analysis
First, we focus on YTiO3 (FM transition temperature isTc = 30 K), which is the most experimentally investigated forthe orbital state in this series [12,13,15,24,25]. The structuralanalysis results using a single crystal of YTiO3 at 25 K (FM
033503-3
SHUNSUKE KITOU et al. PHYSICAL REVIEW RESEARCH 2, 033503 (2020)
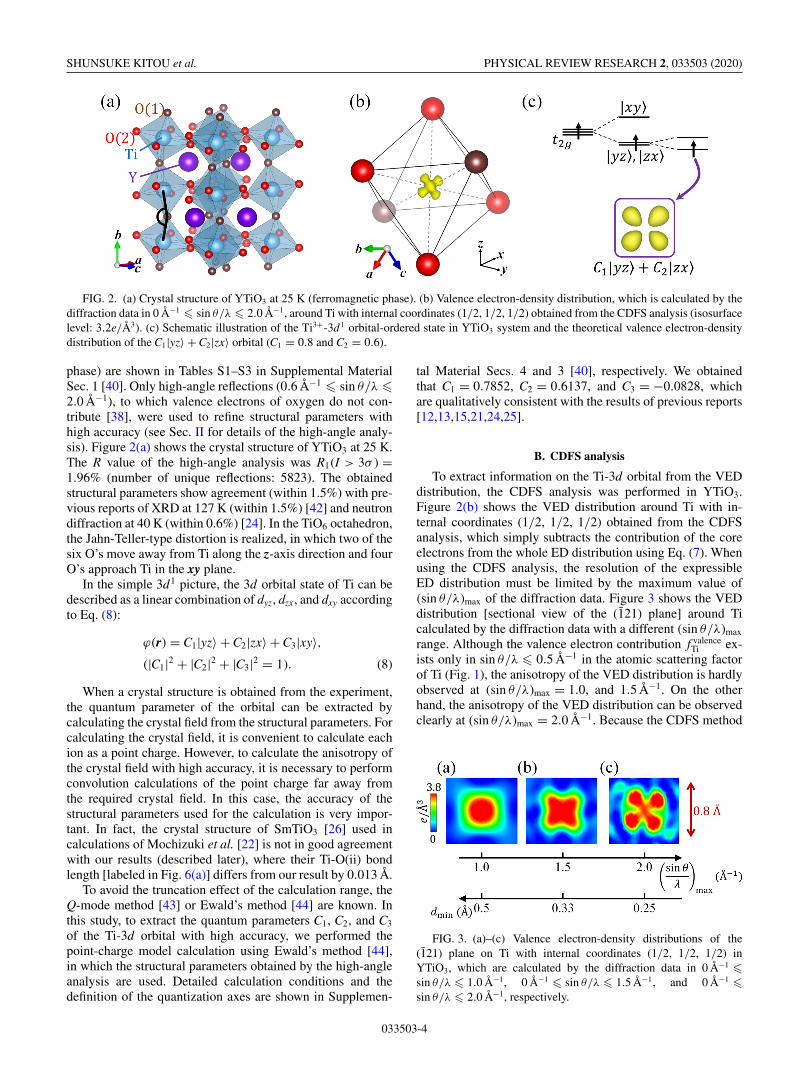
FIG. 2. (a) Crystal structure of YTiO3 at 25 K (ferromagnetic phase). (b) Valence electron-density distribution, which is calculated by thediffraction data in 0 Å−1 � sin θ/λ � 2.0 Å−1, around Ti with internal coordinates (1/2, 1/2, 1/2) obtained from the CDFS analysis (isosurfacelevel: 3.2e/Å3). (c) Schematic illustration of the Ti3+-3d1 orbital-ordered state in YTiO3 system and the theoretical valence electron-densitydistribution of the C1|yz〉 + C2|zx〉 orbital (C1 = 0.8 and C2 = 0.6).
phase) are shown in Tables S1–S3 in Supplemental MaterialSec. 1 [40]. Only high-angle reflections (0.6 Å−1 � sin θ/λ �2.0 Å−1), to which valence electrons of oxygen do not con-tribute [38], were used to refine structural parameters withhigh accuracy (see Sec. II for details of the high-angle analy-sis). Figure 2(a) shows the crystal structure of YTiO3 at 25 K.The R value of the high-angle analysis was R1(I > 3σ ) =1.96% (number of unique reflections: 5823). The obtainedstructural parameters show agreement (within 1.5%) with pre-vious reports of XRD at 127 K (within 1.5%) [42] and neutrondiffraction at 40 K (within 0.6%) [24]. In the TiO6 octahedron,the Jahn-Teller-type distortion is realized, in which two of thesix O’s move away from Ti along the z-axis direction and fourO’s approach Ti in the xy plane.
In the simple 3d1 picture, the 3d orbital state of Ti can bedescribed as a linear combination of dyz, dzx, and dxy accordingto Eq. (8):
ϕ(r) = C1|yz〉 + C2|zx〉 + C3|xy〉,(|C1|2 + |C2|2 + |C3|2 = 1). (8)
When a crystal structure is obtained from the experiment,the quantum parameter of the orbital can be extracted bycalculating the crystal field from the structural parameters. Forcalculating the crystal field, it is convenient to calculate eachion as a point charge. However, to calculate the anisotropy ofthe crystal field with high accuracy, it is necessary to performconvolution calculations of the point charge far away fromthe required crystal field. In this case, the accuracy of thestructural parameters used for the calculation is very impor-tant. In fact, the crystal structure of SmTiO3 [26] used incalculations of Mochizuki et al. [22] is not in good agreementwith our results (described later), where their Ti-O(ii) bondlength [labeled in Fig. 6(a)] differs from our result by 0.013 Å.
To avoid the truncation effect of the calculation range, theQ-mode method [43] or Ewald’s method [44] are known. Inthis study, to extract the quantum parameters C1, C2, and C3
of the Ti-3d orbital with high accuracy, we performed thepoint-charge model calculation using Ewald’s method [44],in which the structural parameters obtained by the high-angleanalysis are used. Detailed calculation conditions and thedefinition of the quantization axes are shown in Supplemen-
tal Material Secs. 4 and 3 [40], respectively. We obtainedthat C1 = 0.7852, C2 = 0.6137, and C3 = −0.0828, whichare qualitatively consistent with the results of previous reports[12,13,15,21,24,25].
B. CDFS analysis
To extract information on the Ti-3d orbital from the VEDdistribution, the CDFS analysis was performed in YTiO3.Figure 2(b) shows the VED distribution around Ti with in-ternal coordinates (1/2, 1/2, 1/2) obtained from the CDFSanalysis, which simply subtracts the contribution of the coreelectrons from the whole ED distribution using Eq. (7). Whenusing the CDFS analysis, the resolution of the expressibleED distribution must be limited by the maximum value of(sin θ/λ)max of the diffraction data. Figure 3 shows the VEDdistribution [sectional view of the (121) plane] around Ticalculated by the diffraction data with a different (sin θ/λ)max
range. Although the valence electron contribution f valenceTi ex-
ists only in sin θ/λ � 0.5 Å−1 in the atomic scattering factorof Ti (Fig. 1), the anisotropy of the VED distribution is hardlyobserved at (sin θ/λ)max = 1.0, and 1.5 Å−1. On the otherhand, the anisotropy of the VED distribution can be observedclearly at (sin θ/λ)max = 2.0 Å−1. Because the CDFS method
FIG. 3. (a)–(c) Valence electron-density distributions of the(121) plane on Ti with internal coordinates (1/2, 1/2, 1/2) inYTiO3, which are calculated by the diffraction data in 0 Å−1 �sin θ/λ � 1.0 Å−1, 0 Å−1 � sin θ/λ � 1.5 Å−1, and 0 Å−1 �sin θ/λ � 2.0 Å−1, respectively.
033503-4
COLLAPSE OF THE SIMPLE LOCALIZED 3d1 … PHYSICAL REVIEW RESEARCH 2, 033503 (2020)
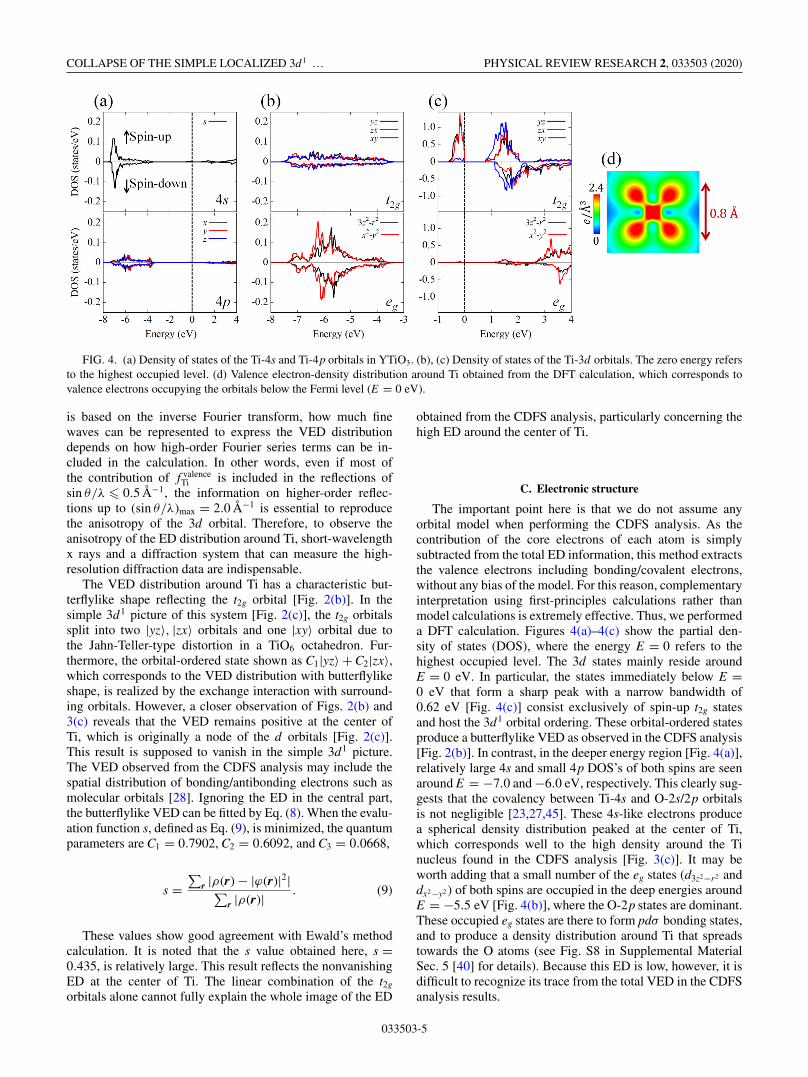
FIG. 4. (a) Density of states of the Ti-4s and Ti-4p orbitals in YTiO3. (b), (c) Density of states of the Ti-3d orbitals. The zero energy refersto the highest occupied level. (d) Valence electron-density distribution around Ti obtained from the DFT calculation, which corresponds tovalence electrons occupying the orbitals below the Fermi level (E = 0 eV).
is based on the inverse Fourier transform, how much finewaves can be represented to express the VED distributiondepends on how high-order Fourier series terms can be in-cluded in the calculation. In other words, even if most ofthe contribution of f valence
Ti is included in the reflections ofsin θ/λ � 0.5 Å−1, the information on higher-order reflec-tions up to (sin θ/λ)max = 2.0 Å−1 is essential to reproducethe anisotropy of the 3d orbital. Therefore, to observe theanisotropy of the ED distribution around Ti, short-wavelengthx rays and a diffraction system that can measure the high-resolution diffraction data are indispensable.
The VED distribution around Ti has a characteristic but-terflylike shape reflecting the t2g orbital [Fig. 2(b)]. In thesimple 3d1 picture of this system [Fig. 2(c)], the t2g orbitalssplit into two |yz〉, |zx〉 orbitals and one |xy〉 orbital due tothe Jahn-Teller-type distortion in a TiO6 octahedron. Fur-thermore, the orbital-ordered state shown as C1|yz〉 + C2|zx〉,which corresponds to the VED distribution with butterflylikeshape, is realized by the exchange interaction with surround-ing orbitals. However, a closer observation of Figs. 2(b) and3(c) reveals that the VED remains positive at the center ofTi, which is originally a node of the d orbitals [Fig. 2(c)].This result is supposed to vanish in the simple 3d1 picture.The VED observed from the CDFS analysis may include thespatial distribution of bonding/antibonding electrons such asmolecular orbitals [28]. Ignoring the ED in the central part,the butterflylike VED can be fitted by Eq. (8). When the evalu-ation function s, defined as Eq. (9), is minimized, the quantumparameters are C1 = 0.7902, C2 = 0.6092, and C3 = 0.0668,
s =∑
r |ρ(r) − |ϕ(r)|2|∑r |ρ(r)| . (9)
These values show good agreement with Ewald’s methodcalculation. It is noted that the s value obtained here, s =0.435, is relatively large. This result reflects the nonvanishingED at the center of Ti. The linear combination of the t2g
orbitals alone cannot fully explain the whole image of the ED
obtained from the CDFS analysis, particularly concerning thehigh ED around the center of Ti.
C. Electronic structure
The important point here is that we do not assume anyorbital model when performing the CDFS analysis. As thecontribution of the core electrons of each atom is simplysubtracted from the total ED information, this method extractsthe valence electrons including bonding/covalent electrons,without any bias of the model. For this reason, complementaryinterpretation using first-principles calculations rather thanmodel calculations is extremely effective. Thus, we performeda DFT calculation. Figures 4(a)–4(c) show the partial den-sity of states (DOS), where the energy E = 0 refers to thehighest occupied level. The 3d states mainly reside aroundE = 0 eV. In particular, the states immediately below E =0 eV that form a sharp peak with a narrow bandwidth of0.62 eV [Fig. 4(c)] consist exclusively of spin-up t2g statesand host the 3d1 orbital ordering. These orbital-ordered statesproduce a butterflylike VED as observed in the CDFS analysis[Fig. 2(b)]. In contrast, in the deeper energy region [Fig. 4(a)],relatively large 4s and small 4p DOS’s of both spins are seenaround E = −7.0 and −6.0 eV, respectively. This clearly sug-gests that the covalency between Ti-4s and O-2s/2p orbitalsis not negligible [23,27,45]. These 4s-like electrons producea spherical density distribution peaked at the center of Ti,which corresponds well to the high density around the Tinucleus found in the CDFS analysis [Fig. 3(c)]. It may beworth adding that a small number of the eg states (d3z2−r2 anddx2−y2 ) of both spins are occupied in the deep energies aroundE = −5.5 eV [Fig. 4(b)], where the O-2p states are dominant.These occupied eg states are there to form pdσ bonding states,and to produce a density distribution around Ti that spreadstowards the O atoms (see Fig. S8 in Supplemental MaterialSec. 5 [40] for details). Because this ED is low, however, it isdifficult to recognize its trace from the total VED in the CDFSanalysis results.
033503-5

SHUNSUKE KITOU et al. PHYSICAL REVIEW RESEARCH 2, 033503 (2020)
FIG. 5. (a) Crystal structure of RTiO3 in the ac plane of y = 0. (b)–(d) Difference of the orbital arrangements in YTiO3 at 25 K(ferromagnetic phase) (isosurface level: 3.2e/Å3), SmTiO3 at 30 K (antiferromagnetic phase) (isosurface level: 2.5e/Å3), and LaTiO3 at30 K (antiferromagnetic phase) (isosurface level: 3.5e/Å3), respectively. Valence electron-density distributions around Ti obtained from theCDFS analysis in the y = 0 plane are shown. The size of the valence electron-density distribution obtained by the CDFS analysis is representedtwice as large. The pink dot lines show the a-glide plane.
Figure 4(d) shows the VED distribution around Ti obtainedfrom the DFT calculations. The ED corresponding to the 4sstates exists at the center of Ti, which is surprisingly similarto the result of the CDFS analysis [Fig. 3(c)]. As the bare 4sorbital is more spatially spread than the 3d orbital, the VEDlocalized at the center of Ti corresponds to the rich-densityarea of electrons in the bonding orbital formed by the hy-bridization between the Ti-4s and O-2s/2p orbitals. From theperspective of ligand field theory [46], which is well appliedto transition-metal complex compounds, it is natural to antic-ipate that the Ti orbitals are covalently bonded to surroundingligand orbitals and some of the electrons occupy the bond-ing orbitals. However, in real space it is not obvious wherethe electrons occupying the bonding orbitals exist. Further-more, the orbital-ordered state in this system is realized notonly by the hybridization but also by the complex combinedJahn-Teller-type and GdFeO3-type distortions [20,22,26]. TheCDFS analysis clearly shows this nontrivial picture.
D. Orbital arrangements
Figures 5(b)–5(d) show the orbital arrangements of Tiin YTiO3 at 25 K (FM phase), in SmTiO3 at 30 K (AFMphase), and in LaTiO3 at 30 K (AFM phase), respectively,obtained from the CDFS analysis. Although the space groupis common (Pnma) in RTiO3 (R = Y, Sm, and La), eachshape and arrangement of the VED distributions is differentdepending on the orbital-ordered states. The directions inwhich the ED distribution extends differ between neighborsites in YTiO3 (FM phase), whereas the directions are uni-form in SmTiO3 and LaTiO3 (AFM phase). The former lookslike the antiferro-orbital-ordered state, and the latter lookslike the ferro-orbital-ordered state. These orbital arrangementsdepend not only on the quantum parameters but also on therelationship between their parameters and the direction ofthe symmetry operation (a-glide plane). Our results are ingood agreement with the Kugel-Khomskii model [2], whichpredicts the ferromagnetic and antiferromagnetic interactionsworking on the antiferroic and ferroic orbital orders, respec-tively.
IV. DISCUSSION
From the results of our structural analysis, the quantumparameters of SmTiO3 are calculated as C1 = 0.7665, C2 =0.5635, and C3 = 0.3081 by the point-charge model calcula-tion using Ewald’s method [44]. These values are not in goodagreement with the previous report [22], where C1 = 0.73,C2 = 0.64, and C3 = 0.24, due to the different precision ofthe crystal structure used in the calculations, as describedabove. On the other hand, we determined the quantum param-eters C1 = 0.9300, C2 = −0.0403, and C3 = 0.3653 of Ti inSmTiO3 from the VED distribution [Fig. 5(c)] using Eq. (9),where s = 0.49. Furthermore, as the VED distribution of Tiin LaTiO3 can no longer be represented by the linear combi-nation of the 3d orbitals [Fig. 5(d)], the quantum parameterscould not be extracted from the VED. These complex VEDdistributions of R = Sm and La may be related to the fact thatthere are few experimental reports on the quantum parameterin the RTiO3 system, except in the case of R = Y.
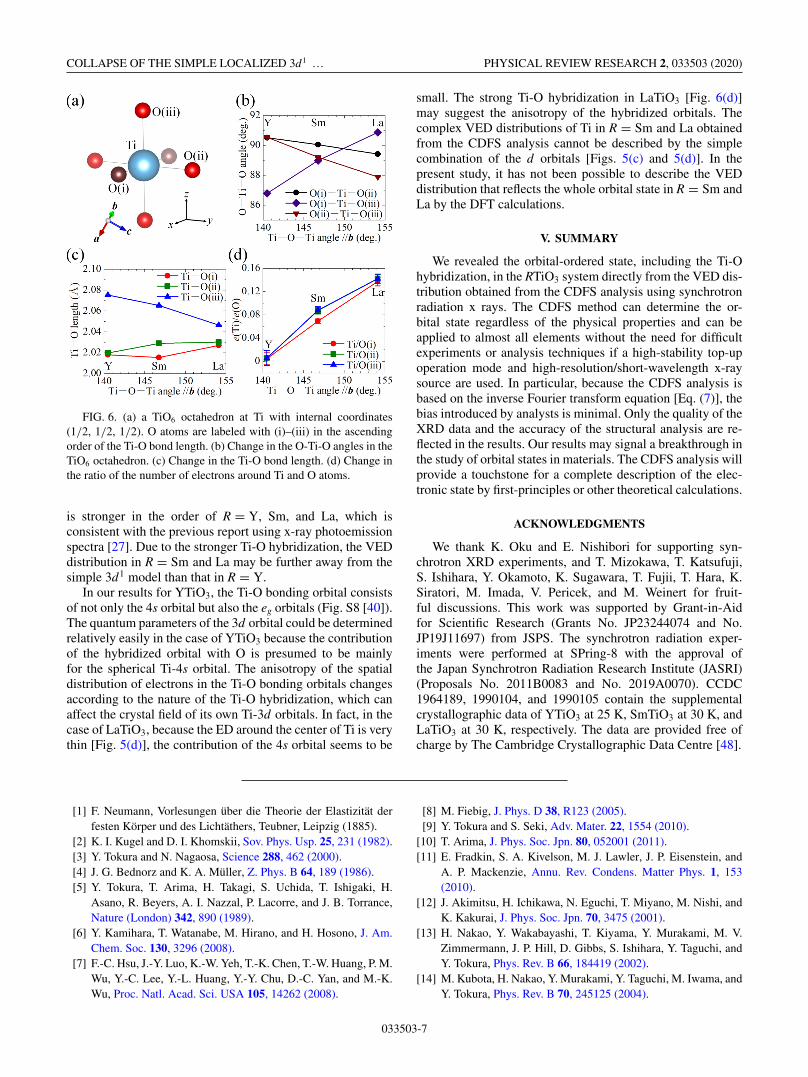
To investigate the origin of the complex orbital-orderedstates, the crystal structures in the TiO6 octahedron in R = Y,Sm, and La were investigated. The change in volume of theTiO6 octahedron is less than 0.3%, regardless of the type ofR, indicating that there are almost no changes in the valenceof Ti ions. The O-Ti-O angles in the TiO6 octahedron changesignificantly with the changes in R [Fig. 6(b)]. Of the threeTi-O bonds in the TiO6 octahedron, the Ti-O(iii) bond lengthchanges the most (∼1.4%) with changes in R [Fig. 6(c)].These structural changes correspond to the changes in thecrystal field around Ti. It is necessary to confirm whether theTi-O covalency depends on R in the RTiO3 system. Unfortu-nately, as the CDFS analysis is based on the inverse Fouriertransform of finite data [Eq. (7)], it is difficult to discuss theabsolute value of the obtained ED. Therefore, the ratios of thenumber of electrons within the ionic radius of each of Ti and O(Ti3+ : 0.67 Å; O2− : 1.35 Å) [47] were compared in R = Y,Sm, and La [Fig. 6(d)]. These ratios increase in the order ofR = Y, Sm, and La. This result corresponds to the fact thatmore electrons move from O to Ti, that is, the hybridization
033503-6
COLLAPSE OF THE SIMPLE LOCALIZED 3d1 … PHYSICAL REVIEW RESEARCH 2, 033503 (2020)
FIG. 6. (a) a TiO6 octahedron at Ti with internal coordinates(1/2, 1/2, 1/2). O atoms are labeled with (i)–(iii) in the ascendingorder of the Ti-O bond length. (b) Change in the O-Ti-O angles in theTiO6 octahedron. (c) Change in the Ti-O bond length. (d) Change inthe ratio of the number of electrons around Ti and O atoms.
is stronger in the order of R = Y, Sm, and La, which isconsistent with the previous report using x-ray photoemissionspectra [27]. Due to the stronger Ti-O hybridization, the VEDdistribution in R = Sm and La may be further away from thesimple 3d1 model than that in R = Y.
In our results for YTiO3, the Ti-O bonding orbital consistsof not only the 4s orbital but also the eg orbitals (Fig. S8 [40]).The quantum parameters of the 3d orbital could be determinedrelatively easily in the case of YTiO3 because the contributionof the hybridized orbital with O is presumed to be mainlyfor the spherical Ti-4s orbital. The anisotropy of the spatialdistribution of electrons in the Ti-O bonding orbitals changesaccording to the nature of the Ti-O hybridization, which canaffect the crystal field of its own Ti-3d orbitals. In fact, in thecase of LaTiO3, because the ED around the center of Ti is verythin [Fig. 5(d)], the contribution of the 4s orbital seems to be
small. The strong Ti-O hybridization in LaTiO3 [Fig. 6(d)]may suggest the anisotropy of the hybridized orbitals. Thecomplex VED distributions of Ti in R = Sm and La obtainedfrom the CDFS analysis cannot be described by the simplecombination of the d orbitals [Figs. 5(c) and 5(d)]. In thepresent study, it has not been possible to describe the VEDdistribution that reflects the whole orbital state in R = Sm andLa by the DFT calculations.
V. SUMMARY
We revealed the orbital-ordered state, including the Ti-Ohybridization, in the RTiO3 system directly from the VED dis-tribution obtained from the CDFS analysis using synchrotronradiation x rays. The CDFS method can determine the or-bital state regardless of the physical properties and can beapplied to almost all elements without the need for difficultexperiments or analysis techniques if a high-stability top-upoperation mode and high-resolution/short-wavelength x-raysource are used. In particular, because the CDFS analysis isbased on the inverse Fourier transform equation [Eq. (7)], thebias introduced by analysts is minimal. Only the quality of theXRD data and the accuracy of the structural analysis are re-flected in the results. Our results may signal a breakthrough inthe study of orbital states in materials. The CDFS analysis willprovide a touchstone for a complete description of the elec-tronic state by first-principles or other theoretical calculations.
ACKNOWLEDGMENTS
We thank K. Oku and E. Nishibori for supporting syn-chrotron XRD experiments, and T. Mizokawa, T. Katsufuji,S. Ishihara, Y. Okamoto, K. Sugawara, T. Fujii, T. Hara, K.Siratori, M. Imada, V. Pericek, and M. Weinert for fruit-ful discussions. This work was supported by Grant-in-Aidfor Scientific Research (Grants No. JP23244074 and No.JP19J11697) from JSPS. The synchrotron radiation exper-iments were performed at SPring-8 with the approval ofthe Japan Synchrotron Radiation Research Institute (JASRI)(Proposals No. 2011B0083 and No. 2019A0070). CCDC1964189, 1990104, and 1990105 contain the supplementalcrystallographic data of YTiO3 at 25 K, SmTiO3 at 30 K, andLaTiO3 at 30 K, respectively. The data are provided free ofcharge by The Cambridge Crystallographic Data Centre [48].
[1] F. Neumann, Vorlesungen über die Theorie der Elastizität derfesten Körper und des Lichtäthers, Teubner, Leipzig (1885).
[2] K. I. Kugel and D. I. Khomskii, Sov. Phys. Usp. 25, 231 (1982).[3] Y. Tokura and N. Nagaosa, Science 288, 462 (2000).[4] J. G. Bednorz and K. A. Müller, Z. Phys. B 64, 189 (1986).[5] Y. Tokura, T. Arima, H. Takagi, S. Uchida, T. Ishigaki, H.
Asano, R. Beyers, A. I. Nazzal, P. Lacorre, and J. B. Torrance,Nature (London) 342, 890 (1989).
[6] Y. Kamihara, T. Watanabe, M. Hirano, and H. Hosono, J. Am.Chem. Soc. 130, 3296 (2008).
[7] F.-C. Hsu, J.-Y. Luo, K.-W. Yeh, T.-K. Chen, T.-W. Huang, P. M.Wu, Y.-C. Lee, Y.-L. Huang, Y.-Y. Chu, D.-C. Yan, and M.-K.Wu, Proc. Natl. Acad. Sci. USA 105, 14262 (2008).
[8] M. Fiebig, J. Phys. D 38, R123 (2005).[9] Y. Tokura and S. Seki, Adv. Mater. 22, 1554 (2010).
[10] T. Arima, J. Phys. Soc. Jpn. 80, 052001 (2011).[11] E. Fradkin, S. A. Kivelson, M. J. Lawler, J. P. Eisenstein, and
A. P. Mackenzie, Annu. Rev. Condens. Matter Phys. 1, 153(2010).
[12] J. Akimitsu, H. Ichikawa, N. Eguchi, T. Miyano, M. Nishi, andK. Kakurai, J. Phys. Soc. Jpn. 70, 3475 (2001).
[13] H. Nakao, Y. Wakabayashi, T. Kiyama, Y. Murakami, M. V.Zimmermann, J. P. Hill, D. Gibbs, S. Ishihara, Y. Taguchi, andY. Tokura, Phys. Rev. B 66, 184419 (2002).
[14] M. Kubota, H. Nakao, Y. Murakami, Y. Taguchi, M. Iwama, andY. Tokura, Phys. Rev. B 70, 245125 (2004).
033503-7

SHUNSUKE KITOU et al. PHYSICAL REVIEW RESEARCH 2, 033503 (2020)
[15] A. B. Voufack, I. Kibalin, Z. Yan, N. Claiser, S. Gueddida, B.Gillon, F. Porcher, A. Gukasov, K. Sugimoto, C. Lecomte, S.Dahaoui, J.-M. Gillet, and M. Souhassou, IUCrJ 6, 884 (2019).
[16] H. Kim, Y. Yoshida, C.-C. Lee, T.-R. Chang, H.-T. Jeng, H.Lin, Y. Haga, Z. Fisk, and Y. Hasegawa, Sci. Adv. 3, eaao0362(2017).
[17] H. Yavas, M. Sundermann, K. Chen, A. Amorese, A. Severing,H. Gretarsson, M. W. Haverkort, and L. H. Tjeng, Nat. Phys.15, 559 (2019).
[18] J. E. Greedan, J. Less-Common Met. 111, 335 (1985).[19] T. Katsufuji, Y. Taguchi, and Y. Tokura, Phys. Rev. B 56, 10145
(1997).[20] T. Mizokawa and A. Fujimori, Phys. Rev. B 54, 5368 (1996).[21] H. Sawada, N. Hamada, and K. Terakura, Phys. B (Amsterdam,
Neth.) 237–238, 46 (1997).[22] M. Mochizuki and M. Imada, New J. Phys. 6, 154 (2004).[23] E. Pavarini, A. Yamasaki, J. Nuss, and O. K. Anderson, New J.
Phys. 7, 188 (2005).[24] I. A. Kibalin, Z. Yan, A. B. Voufack, S. Gueddida, B. Gillon,
A. Gukasov, F. Porcher, A. M. Bataille, F. Morini, N. Claiser,M. Souhassou, C. Lecomte, J.-M. Gillet, M. Ito, K. Suzuki, H.Sakurai, Y. Sakurai, C. M. Hoffmann, and X. P. Wang, Phys.Rev. B 96, 054426 (2017).
[25] M. Itoh, M. Tsuchiya, H. Tanaka, and K. Motoya, J. Phys. Soc.Jpn. 68, 2783 (1999).
[26] D. A. MacLean, H.-N. Ng, and J. E. Greedan, J. Solid StateChem. 30, 35 (1979).
[27] A. E. Bocquet, T. Mizokawa, K. Morikawa, A. Fujimori, S. R.Barman, K. Maiti, D. D. Sarma, Y. Tokura, and M. Onoda, Phys.Rev. B 53, 1161 (1996).
[28] S. Kitou, T. Fujii, T. Kawamoto, N. Katayama, S. Maki, E.Nishibori, K. Sugimoto, M. Takata, T. Nakamura, and H. Sawa,Phys. Rev. Lett. 119, 065701 (2017).
[29] K. Sugimoto, H. Ohsumi, S. Aoyagi, E. Nishibori, C.Moriyoshi, Y. Kuroiwa, H. Sawa, and M. Takata, in SRI 2009,10th International Conference on Radiation Instrumentation,AIP Conf. Proc. No. 1234, edited by R. Garrett, I. Gentle, K.Nugent, and S. Wilkins (AIP, Melville, NY, 2010), p. 887.
[30] K. Sugawara, K. Sugimoto, T. Fujii, T. Higuchi, N. Katayama,Y. Okamoto, and H. Sawa, J. Phys. Soc. Jpn. 87, 024601 (2018).
[31] R. H. Blessing, Crystallogr. Rev. 1, 3 (1987).[32] V. Petrícek, M. Dušek, and L. Palatinus, Z. Kristallogr. - Cryst.
Mater. 229, 345 (2014).[33] K. Momma and F. Izumi, J. Appl. Crystallogr. 44, 1272 (2011).[34] J. Miao, D. Sayre, and H. N. Chapman, J. Opt. Soc. Am. 15,
1662 (1998).[35] J. Miao, P. Charalambous, J. Kirz, and D. Sayre, Nature
(London) 400, 342 (1999).[36] D. K. Saldin, H. Harder, H. Vogler, W. Moritz, and I. K.
Robinson, Comput. Phys. Commun. 137, 12 (2001).[37] S. Eisebitt, J. Lüning, W. F. Schlotter, M. Lörgen, O. Hellwing,
W. Eberhardt, and J. Stöhr, Nature (London) 432, 885 (2004).[38] The Slater-type orbital wave-function library in Jana2006
[32] was supplied from http://harker.chem.buffalo.edu/group/wavtable.html, whose references are Z. Su, and P. Coppens,Acta Crystallogr. A53, 749 (1997); P. Macchi, and P. Coppens,ibid. A57, 656 (2001).
[39] M. Weinert, G. Schneider, R. Podloucky, and J. Redinger, J.Phys.: Condens. Matter 21, 084201 (2009).
[40] See Supplemental Material at http://link.aps.org/supplemental/10.1103/PhysRevResearch.2.033503 for XRD data, results ofthe structural analysis and the CDFS analysis, definition ofquantization axes, Ewald’s method, and results of the DFTcalculation.
[41] A. B. Shick, A. I. Liechtenstein, and W. E. Pickett, Phys. Rev.B 60, 10763 (1999).
[42] J. R. Hester, K. Tomimoto, H. Noma, F. P. Okamura, and J.Akimitsu, Acta Crystallogr. B53, 739 (1997).
[43] K. Siratori and K. Kohn, J. Phys. Soc. Jpn. 79, 114720 (2010).[44] P. P. Ewald, Ann. Phys. 369, 253 (1921).[45] F. M. F. de Groot, M. Grioni, J. C. Fuggle, J. Ghijsen, G. A.
Sawatzky, and H. Petersen, Phys. Rev. B 40, 5715 (1989).[46] J. S. Griffith and L. E. Orgel, Q. Rev., Chem. Soc. 11, 381
(1957).[47] R. D. Shannon, Acta Crystallogr. 32, 751 (1976).[48] https://www.ccdc.cam.ac.uk/structures/.
033503-8