Physical and Environmental Properties of Asphalt-Amended ...
9
10 TRANSPORTATION RESEARCH RECORD 1345 Physical and Environmental Properties of Asphalt-Amended Bottom Ash DAVID GRESS, XISHUN ZHANG, SCOTT TARR, INGRID PAZIENZA, AND TAYLOR EIGHMY A 2-year study is under way to evaluate the phy ical and chemical properties of the bottom ash process stream from the 500 roa st day waste-to-energy facility in Concord, New Hampshire. The use of bottom ash as an aggregate ubsliiute product in asphaltic ba e course is envisioned. Research is under way to characterize the time-dependent properties of the bottom ash for product acceptance , to develop asphalt concrete mixe with varied per- centages of bottom ash , and to evaluate rhe leacllate release rate characteristics from var. ious asphalt blends using a variety of batch and lysimeter leach te ts. Re ults to date suggest that the bottom ash product stream is relatively constant, hoc mix fonnulations meet New Hampshire Department of Transportation pecifica- tion , and bitumen is effective in encapsulating bottom a h and reducing salt leacbability. In the United States consideration is being given to the use of bottom ash from municipal solid waste combustion as an aggregate substitute in construction materials (J). The antic- ipated hierarchy for use in the United States reflects regu- latory concerns that certain waste products be encapsulated or stabilized before use. Consequently, the use of bottom ash is likely to be in bituminous base course, bituminous wearing course, bituminous stabilized aggregate base, and concrete construction materials before it is used in granular subbase, structural fill, or embankment applications. This hierarchy differs somewhat from typical uses of bottom ash in Europe as a granular, soillike material (2-4). Earlier work in the United States by Walter (5,6) presented hot mix formulations using 50 percent bottom ash with asphalt cement contents of 5.5 to 6.5 percent by weight. Other re- searchers developed similar formulations, which led to a num- ber of demonstrations in the 1970s and early 1980s using bot- tom ash in base course and wearing courses (7-11). General observations from these studies (J) suggest that conventional asphalt mixing and paving equipment can be used, the ash loss-on-ignition should be less than 10 percent, fly ash should not be incorporated into the blends, vibrators on feed bins are necessary, and plant temperature control is important with regard to the high moisture content of the bottom ash. These studies suggest that optimum mixes for hot mix work can contain 50 to 75 percent bottom ash substituted for conven- tional aggregate. Recent work by Chesner et al. (12) showed bottom ash from the Southwest Brooklyn, New York, combustor is a Environmental Research Group, Department of Civil Engineering, University of New Hampshire, Kingsbury Hall, Room 236, Durham, N.H. 03824. viable aggregate substitute. Performance was as good as the control at the 30 percent substitution level. Chesner (13) examined economic, regulatory, and environ- mental concerns surrounding the use of bottom ash and has suggested that institutional issues may be the largest imped- iment to active utilization in the United States despite the fact that its use is technically and economically feasible. OBJECTIVES OF RESEARCH The objectives of the project are threefold: to characterize the phy ical properties of the bottom ash over time, to obtain an optimum tructural blend of bottom ash/a pbalt for hot mix formulations, and to examine the environmental prop- ertie of bottom ash and bottom a h/aspbalt blends under laboratory and field conditions. Bottom ash collected during the first 7 months of a 2-year study ba been evaluated for its physical and cbemicaJ prop- erties. Hot mix designs were developed for a control mix and 25 50 , 75, and 100 percent bottom ash blend . Leaching properties of the bottom ash and bottom ash/asphalt blends were evaluated using batch and lysimeter leaching tests. MATERIALS AND METHODS The bottom ash evaluated is produced in a 500 tons/day mass burn combustor located in Concord, New Bampsbire. The facili y is owned by Wheelabrator ConcordL.P. and operated for the Concord Regional Solid Waste/Resource Recovery Cooperative. 1l1e facility has two process trains consisting of von Roll reciprocating stoker grates, Babcock and Wilcox boilers, and Wheelabrator Technology dry lime scrubber/ fabric filters. The bottom ash from each train is quenched in its own quench tank. A daily composite wa collected on each of the 10 sampling days during the 7-month period. Economizer and fly ash streams were diverted from the bottom ash drag chain conveyor during sampling. Bottom ash grab samples were obtained randomly every 10 min by sampling from the drag chain to create 250-l b hourly composites. Four hourly composites were col- lected e.acb test day. Combustor performance was also mon- itoretl to relate bottom a h quality to combustor operation. The tests indicated in Table 1 were conducted at varying frequencies for the evaluation of the time-dependent physical and chemical properties of the bottom ash.
Transcript of Physical and Environmental Properties of Asphalt-Amended ...

10 TRANSPORTATION RESEARCH RECORD 1345
Physical and Environmental Properties of Asphalt-Amended Bottom Ash
DAVID GRESS, XISHUN ZHANG, SCOTT TARR, INGRID PAZIENZA,
AND TAYLOR EIGHMY
A 2-year study is under way to evaluate the phy ical and chemical properties of the bottom ash process stream from the 500 roast day waste-to-energy facility in Concord, New Hampshire. The use of bottom ash as an aggregate ubsliiute product in asphaltic ba e course is envisioned. Research is under way to characterize the time-dependent properties of the bottom ash for product acceptance , to develop asphalt concrete mixe with varied percentages of bottom ash , and to evaluate rhe leacllate release rate characteristics from var.ious asphalt blends using a variety of batch and lysimeter leach te ts. Re ults to date suggest that the bottom ash product stream is relatively constant, hoc mix fonnulations meet New Hampshire Department of Transportation pecification , and bitumen is effective in encapsulating bottom a h and reducing salt leacbability.
In the United States consideration is being given to the use of bottom ash from municipal solid waste combustion as an aggregate substitute in construction materials (J). The anticipated hierarchy for use in the United States reflects regulatory concerns that certain waste products be encapsulated or stabilized before use. Consequently, the use of bottom ash is likely to be in bituminous base course, bituminous wearing course, bituminous stabilized aggregate base, and concrete construction materials before it is used in granular subbase, structural fill, or embankment applications. This hierarchy differs somewhat from typical uses of bottom ash in Europe as a granular, soillike material (2-4).
Earlier work in the United States by Walter (5,6) presented hot mix formulations using 50 percent bottom ash with asphalt cement contents of 5.5 to 6.5 percent by weight. Other researchers developed similar formulations, which led to a number of demonstrations in the 1970s and early 1980s using bottom ash in base course and wearing courses (7-11). General observations from these studies (J) suggest that conventional asphalt mixing and paving equipment can be used, the ash loss-on-ignition should be less than 10 percent, fly ash should not be incorporated into the blends, vibrators on feed bins are necessary, and plant temperature control is important with regard to the high moisture content of the bottom ash. These studies suggest that optimum mixes for hot mix work can contain 50 to 75 percent bottom ash substituted for conventional aggregate.
Recent work by Chesner et al. (12) showed bottom ash from the Southwest Brooklyn, New York, combustor is a
Environmental Research Group, Department of Civil Engineering, University of New Hampshire, Kingsbury Hall, Room 236, Durham, N.H. 03824.
viable aggregate substitute. Performance was as good as the control at the 30 percent substitution level.
Chesner (13) examined economic, regulatory, and environmental concerns surrounding the use of bottom ash and has suggested that institutional issues may be the largest impediment to active utilization in the United States despite the fact that its use is technically and economically feasible.
OBJECTIVES OF RESEARCH
The objectives of the project are threefold: to characterize the phy ical properties of the bottom ash over time, to obtain an optimum tructural blend of bottom ash/a pbalt for hot mix formulations , and to examine the environmental propertie of bottom ash and bottom a h/aspbalt blends under laboratory and field conditions.
Bottom ash collected during the first 7 months of a 2-year study ba been evaluated for its physical and cbemicaJ properties. Hot mix designs were developed for a control mix and 25 50, 75, and 100 percent bottom ash blend . Leaching properties of the bottom ash and bottom ash/asphalt blends were evaluated using batch and lysimeter leaching tests.
MATERIALS AND METHODS
The bottom ash evaluated is produced in a 500 tons/day mass burn combustor located in Concord, New Bampsbire. The facili y is owned by Wheelabrator ConcordL.P. and operated for the Concord Regional Solid Waste/Resource Recovery Cooperative. 1l1e facility has two process trains consisting of von Roll reciprocating stoker grates, Babcock and Wilcox boilers, and Wheelabrator Technology dry lime scrubber/ fabric filters. The bottom ash from each train is quenched in its own quench tank.
A daily composite wa collected on each of the 10 sampling days during the 7-month period. Economizer and fly ash streams were diverted from the bottom ash drag chain conveyor during sampling. Bottom ash grab samples were obtained randomly every 10 min by sampling from the drag chain to create 250-lb hourly composites. Four hourly composites were collected e.acb test day. Combustor performance was also monitoretl to relate bottom a h quality to combustor operation.
The tests indicated in Table 1 were conducted at varying frequencies for the evaluation of the time-dependent physical and chemical properties of the bottom ash.

Gress et al.
TABLE 1 TESTS USED FOR BOTTOM ASH USE IN GRANULAR AND ASPHALTIC MATERIALS Ash Tests
Chemical
- Elemental Composition - Acid Neutralizing
Capacity (ANC) - Tocal Availability Leach Test - pH Dependent Leach Test - Monolith Leach Test - Toxicity Characteristics
Leaching Procedure - Lysimeter Leach Test
RESULTS AND DISCUSSION
Time Dependence
Physical
· Moisture Content (ASTM 02216) · Percent Rejected (>3/4") • Organic Content/LOI (24) • Ferrous Content · Size Distribution (ASTM) • Absorption and Specific
Gravity (ASTM C127 and C!28) · Unit Weight and Voids (ASTM C29) · Moisture Density Test (ASTM DIS57) · CBR (ASTM 01863) · Sodium Sulfate Soundness of
Aggregates (ASTM C-88) ·Los Angeles Abrasion (ASTM Cl31) · Unconfined Compressive Strength
(ASTM 02166) ·Marshall Stability (ASTM DISS9)
The physical and chemical properties of bottom ash are of great importance in evaluating its potential use as a substitute for conventional aggregate in bituminous mixtures. The sampling program was designed to examine the hourly, daily, weekly, and monthly variability in physical and chemical characteristics of the bottom ash. Table 2 presents the statistical data of the ash physical testing accomplished over the first 7 months of the project. All average and standard deviation values were calculated on the basis of 40 hourly composite
TABLE 2 ASH CHARACTERISTICS AND ST A TISTICAL VARIATION
~ma' SLIO~aal llt~illi~D
Mass <3/4" (%) 67.1 6.6
Moisture Content(%) 36.7 6.4
Specific Gravities:
Bulk fine 1.90 0.15
Bulk Coarse 2.25 0.11
Bulk SSD fine 2.15 0.11
Bulk SSD coarse 2.35 0.09
Apparent fine 2.51 0.16
Apparent coarse 2.51 0.08
Absorption fine ( 9li) 12.6 2.9
Absorption coarse ( 9li) 4.7 1.4
Loss on Ignition(%) 7.1 2.2
Ferrous Content ( 9li) 26.7 5.6
Passing 114 sieve ( % ) 48.9 5.3
Passing #200 sieve (%) 4.1 1.1
LA Abrasion Grading B (%)' 47.3 1.3
LA Abrasion Grading C (%)' 43.4 1.1
Soundness <no. 4 (%)' 13.5 1.2
Soundness >no. 4 (%)' 2.6 0.2
Modified Proctor Density (pc0
Maximum 109.4 1.3
Density• 107.8 2.7
• average of two composites. • average of seven composites compacted at 16 9li moisture.
11
samples obtained during the first 10 sampling events except where noted.
The amount of material passing% in. that could potentially be used as an aggregate is 67.1 percent on the average, with a standard deviation of 6.6 percent. Although it was not collected, a significant amount of aggregatelike material ranging from approximately 3 to % in. in size is also potentially available for use as aggregate.
The ash in general consists of equal amounts of glass and ferrous and nonferrous metals. The glass and nonferrous metals commonly melt and create conglomerate particles. The particles are therefore variable in texture and shape and, in the case of lhe gla s, tend to be brittle. A minor amount of degradation of the brittle particles is to be expected during compaction.
The moisture content of the bottom ash is 36. 7 percent on the average, with a standard deviation of 6.4 percent. Moisture contents of bottom ash from other facilities have been reported to range from 20 to 57 percent (14).
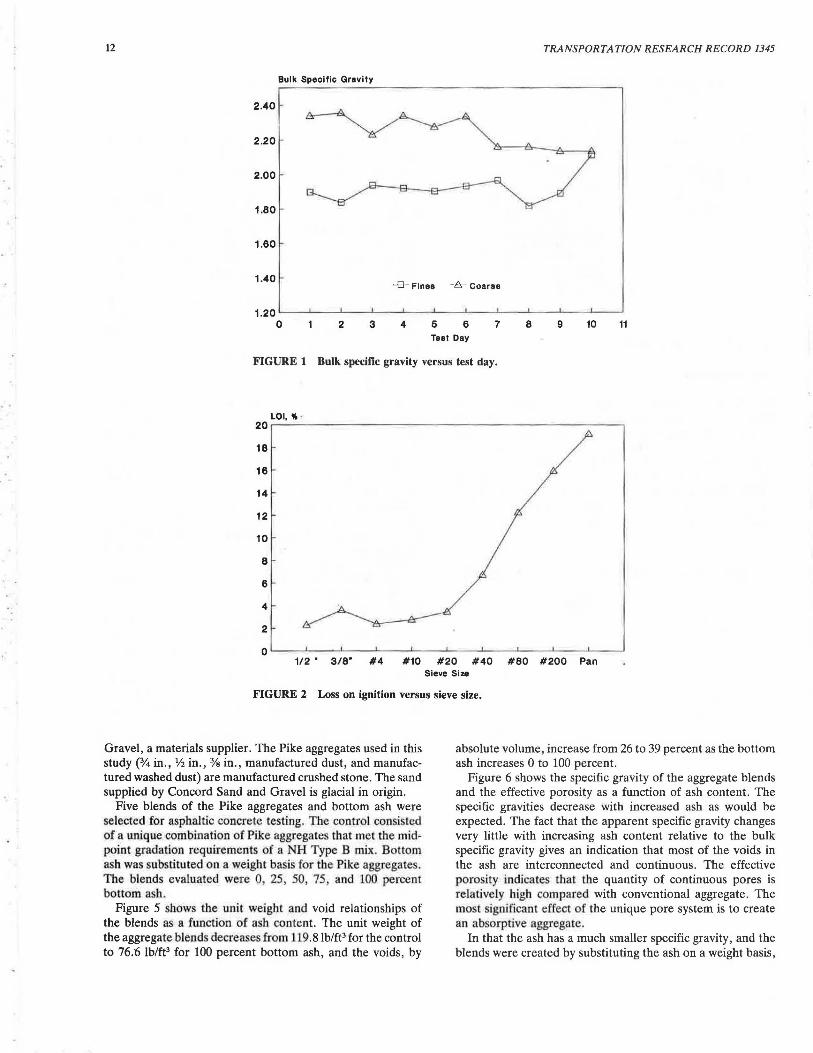
Figure 1 shows the bulk specific gravity as a function of test day. The data for each test day is the average of four hourly samples.
LOI is 7.1 percent on the average, with a standard deviation of 2.2 percent. The test consists of heating ash passing the No. 4 sieve to 600°C. The LOI increases as ash particle size decreases as shown in Figure 2.
Ferrous content, as defined by passing a magnet across a dispersed sample of dried, <%-in. material, is 26.7 percent with a standard deviation of 5.6 percent.
The degradation of bottom a h, a mea ured by the Los Angeles abrasion te t , meets the ASTM D692 maximum 50 percent requirement for use in bituminous paving mixtures. The degradation is high due to the severity of the test and the brittleness of the glass particles.
The sodium sulfate soundness test for coarse fraction of ash (~No. 4) meets the ASTM D692 specification (:S 12 percent). The fine fraction of ash ( < No. 4) is less dense and not as strong. However, since the fine fraction of the ash comprises less than 50 percent of the bottom ash, the natural combination of the coarse and fine fractions passes the ASTM requirement.
The maximum modified proctor dry density is 109.4 lb/ft3
on the average with a standard deviation of' 1.29. Figure 3 shows the density and zero air void relationship for a typical bottom ash.
The gradation of any aggregate to be used in asphaltic concrete is important because of its direct effect on performance. Figure 4 show the average gradation of bottom ash along with the upper and lower limits a required for a Type B NHDOT binder mix. AJI data are calculated on the basis of the 40 hourly samples. The bottom ash is well graded from the coarse to the fine sizes and meets the New Hampshire state gradation specifications. for Type B base course.
Aggregate Blends
The conventional aggregates used in this study were obtained from Pike Industries Inc., a materials supplier, asphaltic concrete producer, and contractor, as well as Concord Sand and
12 TRANSPORTATION RESEARCH RECORD 1345
Bulk Speclllc Gravity
2.40
2.20
2.00
1.80
1.80
1.40 -8-- Fines -A- Coaree
1.20 '--~-'-~-'-~---L.~--'~~-'--~~~-'-~~~~~~-'-~~
0 2 3 4 6 6 7 8 9 10 11 Teet Day
FIGURE 1 Bulk specific gravity versus test day.
LOI, 11. · 20 ~~~~~~~~~~~~~~~~~~~~~~~~--.
18
16
14
12
10
8
6
4
2
O '--~-'-~~'--~-'-~~'--~-'-~~~~-'-~~-'--~-'-~--'
1/2 • 3/8" #4 #10 #20 #40 #80 #200 Pan Sieve Size
FIGURE 2 Loss on ignition versus sieve size.
Gravel, a materials supplier. The Pike aggregates used in this study(% in., Yi in., 3/e in., manufactured dust, and manufactured washed dust) are manufactured crushed stone. The sand supplied by Concord Sand and Gravel is glacial in origin.
Five blends of the Pike aggregates and bottom ash were selected for asphaltic concrete testing. The control con i ted of a unique combination of Pike aggregates that met the midpoint gradation requirements of a NH Type B mix. Bottom ash was substituted on a weight ba is for the Pike aggregates. The blends evaluated were 0, 25, 50, 75 , and 100 percent bottom ash.
Figure 5 shows the unit weight and void relationships of the blends as a function of ash content. The unit weight of the aggregate blends decreases from J 19.8 lb/ft3 for the control to 76.6 lb/ft3 for 100 percent bottom ash, and the voids, by
absolute volume, increase from 26 to 39 percent as the bottom ash increases 0 to 100 percent.
Figure 6 shows the specific gravity of the aggregate blends and the effective porosity as a function of ash content. The specific gravities decrease with increased ash as would be expected. The fact that the apparent specific gravity changes very little with increasing ash content relative to the bulk specific gravity gives an indication that most of the voids in the ash are interconnected and continuous. The effective porosity indicate that the quantity of continuous pores is relatively high compared with conventional aggregate. The most significant effe.ct of the unique pore system is to create an absorptive aggregate.
In that the ash has a much smaller specific gravity, and the blends were created by substituting the ash on a weight basis,

Gress et al.
Dry Density. lb/113
114 -8- Typical Ash
-t- Zero Air Voids
110
106
13
102 ~~~~~~~~~~~~~~~~~~~-'-~~~~~--'
8 12 16 Moisture.%
20 24
FIGURE 3 Density versus moisture content.
Passing, 'II. 100 r-~~~~~~~~~~~~~~~~~~~~~~~--...r--.
~NH min +NH max -8- Ash
80
60
40
20
o '--~----'-~._,~L.L..u...u..~~-'-~---'__,_~LI..J-'-~---'~-L...J...-'-L..LLLJ
0.001 0.01 0.1 Grain Size, Inch
FIGURE 4 Average grain size distribution.
the mix volumes increase on a relative basis with increasing ash. All blends meet the requirements of NHDOT specifications, as shown in Figure 7.
Asphalt Concrete Mixes
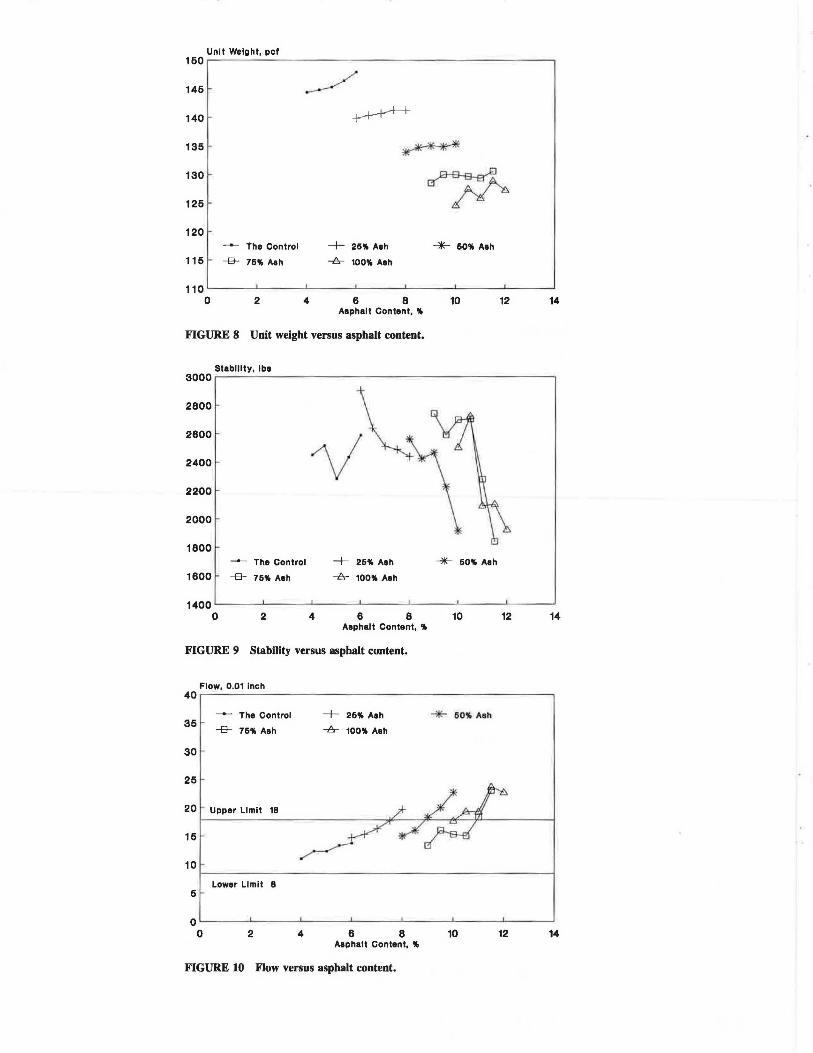
The Marshall mix design method using a 50-blow compactive effort was used to develop the asphalt concrete mixes. AC-20 asphalt cement was employed. The Marshall mix design results are presented in Figures 8 through 13.
The effect of the low specific gravity of the ash is indicated by the lower unit weights, which range from 124.6 to 147.9 lb/ft3
, as shown in Figure 8. This reduced weight to volume relationship for the ash mixes has also been noted by Collins et al. (9).
An average of three rest specimens was used in the Marshall mix design analysi. . Stability as shown in Figure 9 ranges from 1,840 to 2,903 Jb and exceed the New Hampshire specification. Depending on the a phalt content, the presence of the ash is capable of increa ing the stability compared with the control. This cou ld be due to the particle shape of the ash which is a combination of angular and rounded particles.
Figure 10 shows flow as a function of asphalt content. The Asphalt Institute requires the flow to be in the 8 to 18 range for medium traffic. The ash mixes exhibit higher flow values than the control mix due to the increased asphalt contents. Flow varies in an inconsistent manner as asphalt content is varied for 75 and 100 percent ash mixes. Collins et al. (15) have reported that Marshall flow values for mixtures using ash residue are sometimes erratic due to variation of the ash properties.

,-
Unit Wolght. lb/ft3 Vold Content , 'JI. 120rii-~~~~~~~~~~~~~~~~~~~~~~--, 40
110 36
100
30
80
--e-- Unit Weight
10 '--~~~-'-~~~----JL...-~~~-'-~~~--''--~~~~ 20
o 20 40 eo eo 100 'JI. Aah Content
FIGURE 5 Unit weight and void content versu,s aiih content.
Specific Gfavll y Effective Poroalty, !I. .-~~~~~~~~~~~~~~~~~~~~~~~--. 30
2.8 -B- Bulk -8- Bulk SSD "*" Apparent + Effaotlva Porosity
25
2Ei 50 75 100 '!lo Aah Content
FIGURE 6 Specific gravity and effective porosity versus !1$h collttnt.
Paealng, '4 100 ~~~~~~~~~~~~~~~~~~~~~~~~-1ill~
80
60
40
20
NH Min
+ 60'!11 Aah
NH Max --e---8- 76'JO Ash -H- 100'JO Ash
0 '--~-'-----'1"-='=1....l...J'--'--1-'-~----'-~.l--.._,L-L...L.L.'-'-~--'~-'--'--'-'-'-'-'-'
0,001 0.01 0.1 Grain Sl:rs, Inch
FIGURE 7 Master gradation curves of test blends.
Unit Weight, pct 160 r-~~~~~~~~~~~~~~~~~~~~~~~~--..
146
140
135
130
125
120 The Control
115 --&- 7H Aah
+ 60'!1. Aah
110 '--~~-'-'~~~-'-~~~'--~~--'-~~~-'---~~~-'-~~--'
0 2 4 6 8 10 12 14 Aephalt Content, 'Ill
FIGURE 8 Unit weJght versus asphalt content.
Stability, Iba 3000 ~~~~~~~~~~~~~~~~~~~~~~~~~~
2800
2800
2400
2200
2000
1800 The Control
1800 --&- 75'!1. Aeh
-t- 25'!1. Aeh + 50'11. Aah
-A- 100'!1. A1h
1400 ~~~~~~~~~~~~~~~~~~~~~~~~
0 2 4 6 8 10 12 14 Aephal t Content, 'Ill
FIGURE 9 Stability versus asphalt content.
Flow, 0.01 Inch 40 ~~~~~~~~~~~~~~~~~~~~~~~~~~~
35
30
25
The Control
--&- 7611. Aah
20 Upper Limit 18
15
10
L.ower Limit 8 5
-I- 25'11. Aah + 50'!1. Ash
-A- 100'11. Aah
0 '--~~--"~~~-'---~~~-'-~~~.1--~~--'~~~-'-~~~~
0 2 4 8 8 10 12 14 Asphalt Content. 'Iii
FIGURE 10 Flow versus asphalt content.
VMA, .. 1s..--~~~~~~~~~~~~~~~~~~~~~~~~--.
18
The Control
-8- 76'1 A1h
14. Lower Limit 14'1
12
10 0 2
-!- 26 .. Aeh
-8- 100" Aeh
4 8 8 Aephalt Content, "
FIGURE 11 VMA vl!rs11s asphalt contel)t •.
Volde, 'lit 12
~ Tho Control -+- 261' Aah
10 -8- 76" Aeh -A- 100'11t Aeh
Upper Limit e" 8
6
4
Lower Limit 3" 2
0 0 2 4 6 8
Asphalt Content, "
FIGURE 12 Total voids versus asphalt content.
Absorbed Asphalt, " 12
The Control + 26'Jfo Ash
10 -a- 76 .. Aeh -8- 100" Aeh
+ 60 .. Aah
10 12
+ 60'11t Aeh
10 12
--lll- 60'4 Aeh
8
~ 6 ~ 4 ~
+-+-H-+ 2
0 0 2 4 6 8 10 12
A1ph1,lt C9nt1nt, "
FIGuRE 13 AJ>sorbed asphalt versus aspbalt content.
14
14.
14

Gress et al.
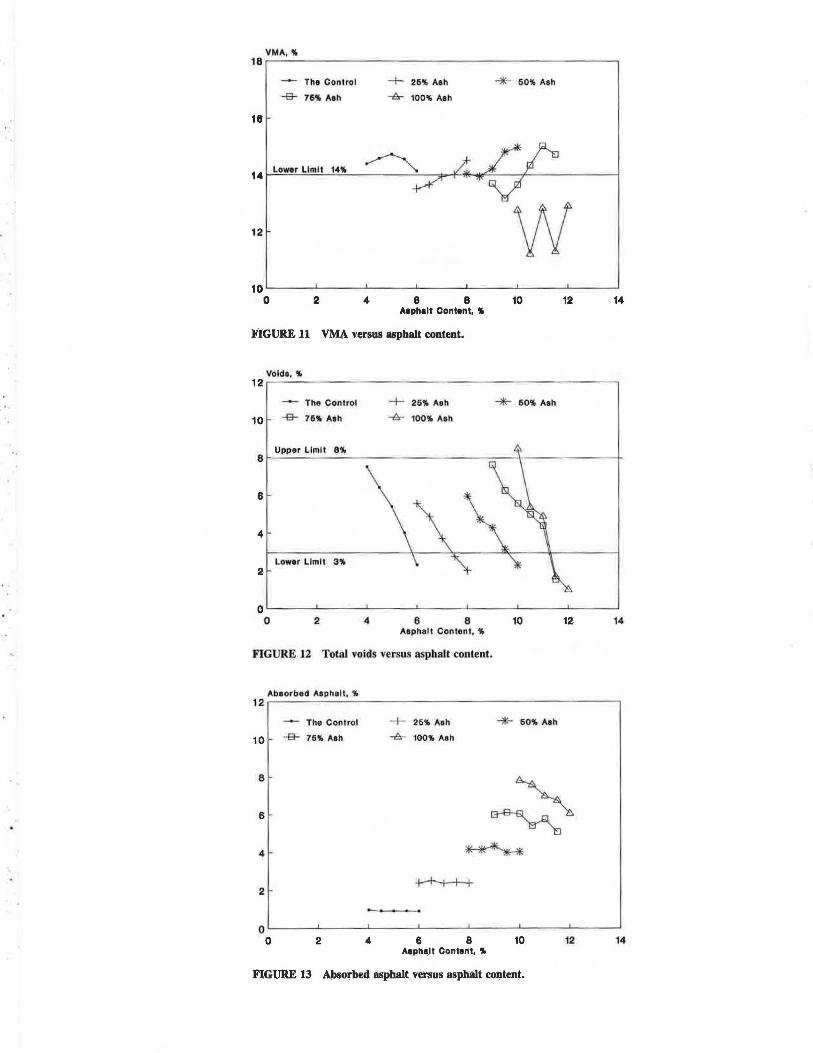
The voids in the mineral aggregate (VMA) relationship of the ash mixes is shown in Figure 11. The VMA significantly affects the performance of a mix because if it is too low, the mix may suffer durability problems, and if it is too high the mix may show stability and bleeding problems. The Asphalt Institute requires a minimum VMA of 14 percent for a nominal maximum particle size of % in. All mixes containing up to 75 percent ash pass the VMA requirement of a minimum of 14 percent.
Figure 12 shows the void-asphalt content relationship of the Marshall mixes . The void content is based on the maximum theoretical specific gravity of the paving mix as determined by the Rice method. The void content criteria suggested by the Asphalt Institute for a base subject to medium traffic is between 3 and 8 percent. The asphalt content needed to meet the specification increases as the ash content increases. The reason that the ash mixes demand more asphalt is that the ab orption of the ash is higher than the conventional aggregate . Some asphalt is absorbed into the ash particles, particularly lhe finer particles, increa ing the amount of asphalt needed to attain complete coating of the aggregate particles in the mix.
Satisfying the Asphalt Institute design criteria as shown in the figures requires 5, 7.4, 8.6and10.5 percent asphalt cement for the 0, 25, 50 and 75 percent ash mixes. The 100 percent ash mixes do not satisfy the design criteria at any asphalt content.
The asphalt absorbed into the aggregate pores is shown in Figure 13. In concept, the amount of asphalt absorbed into the aggregate is not a function of asphalt content, as shown by the blends up to 50 percent ash. For reasons unknown at this time, the higher ash blends show a decrease in absorbed asphalt with increasing asphalt cement content. The effective asphalt , defined a the total asphalt content minus the absorbed portion , increase with increased a phalt content for both the ash mixes a.nd the aggregate control. An extensive field test is planned to evaluate the long-term performance of the bottom ash mixes.
ENVIRONMENTAL TESTING
A number of methods were employed to evaluate the environmental properties of the bituminous blends. Lysimeters were used to evaluate leachate characteristics of a bottom ash pavement mix that was excavated and landfilled. A control lysimeter with bottom ash was used for comparative purposes. Batch laboratory leach tests were used to evaluate the effects of percent asphalt cement and percent bottom ash substitution on the encapsulating properties of bitumen, and a standard Environmental Protection Agency Toxicity Characteristic Leaching Procedure (EPA TCLP) test was run on the bottom ash.
Lysimeter Test Procedures
Approximately 30 yd3 of bottom ash was collected at the waste-to-energy facility and processed to pass the %-in. sieve. Approximately 4 tons of this material was placed directly in a 20-yd3 double-lined roll-off container. The remaining processed bottom ash was batched at a local hot mix plant (Pike
17
Industries) to produce 12 tons of %-in. binder with 25 percent bottom ash (75 percent natural aggregate) at an asphalt cement content of 9 percent. The mix was paved compacted , and broken up after a 7-day period with a backhoe into large pieces typical of what might be expected to be dumped into a landfill a. construction debris. The broken up pavement ranging in size from small palm size to large 2- by 3-ft plates, was put in a second double-lined roll-off container. These lysimeters generate time-dependent data on the leachate properties of the control bottom ash and the 25 percent ash asphalt pavement mix. The leachate, originating from natural precipitation, was collected and analyzed for analytes.
Regulatory Test Procedure
TCLP regulatory leach test was performed on composite bottom ash samples from material used in the control lysimeter. A number of additional inorganic analytes besides the specified regulatory analytes were analyzed to help develop a bottom ash leaching data base.
Results
The results of the lysimeter data for the first two collection events are given in Table 3. The cumulative liquid/solid ratio for the first event was 0.069 and 0.073 and for the second event was 0.174 and 0.184 for the ash and ash pavement lysimeters, respectively. Bottom ash releases significantly lower concentrations of contaminants compared with combined ashes because it does not contain the highly soluble Ca(OHh added
TABLE 3 LYSIMETER LEACHATE DATA
Bottom A<b Bot!l!ID A$ Aspba)t Fiat Eycnt Second Eyenl Fja& Bw;nt Second Ey@t
us• 0.069 0.174 0.073 0.184
pH 6.41 6.75 7. 15 7.32
coo• 310 400 22 IS NO,--N <0.50' <0.25 <0.050 <0.050
NOi-N <0.50 <0.50 <0.050 <0.25
NH,•-N s.o 16 0.20 0.44
so;· 1,700 1,600 31 68 Br· 30 28 <1.0 2.1
PO,'- <0.01 0.041 <0.01 <0.010 c1· 1,700 1,800 24 30
Al 0.20 0.16 <0. IO <0.IO
Ba <0.10 <0.10 <0.10 <0.10
Be <0.0050 <0.50 <0.0050 <0.50 Cd <0.0050 0.0007 <0.0050 0.0014
Ca 590 870 22 45
Cr <0.010 <0.010 <0.010 <0.010
Cu 0.59 0.15 <0.020 0.024
Fe 0.050 7.3 <0.030 0.038
Pb 0.0053 0,028 <0.0050 <0.005
Mg 6.5 6.9 1.3 2.8
Mn 0.32 2.3 0.020 0.063
Hg 0.0006 0.0005 <0.0003 <0.0003
Mo 0.34 0.27 <0.10 <0.10
K 220 190 3.9 4.5
Si 2.2 l.4 l.2 2.7
Sr 4.4 4.3 0.15 0.21
Zn 0.068 0.031 <0.020 0.031
'US liquid to solid ratio weight of leachate to wet weight of .. h 'Concentrations m expressed in mg/L 'Less than sign shows that the concentration was below the indicaltd detection
limit.

18
TABLE 4 BOTTOM ASH TCLP DATA
Composile 2 3 Regulated Concentration, mg/L Average Limit
Al 3.9 1.7 I.I 2.2 ·' As <0.2 <0.2 <0.2 <0.2 5.0
Ba 0.38 0.38 0.35 0.37 100.0
B 0.53 0.52 0.55 0.53
Cd 0.028 0.032 0.031 0.030 1.0
Ca 760 850 830 813
Cr <0.01 <0.01 <0.01 <0.01 5.0
Cu 0.9 1.4 1.5 1.3
Fe 12 0.94 0.21 4.38
Pb 1.7 1.9 1.3 1.6 5.0
Mg 29 32 31 31
Mn 3.1 2.9 2.4 2.8
Hg <0.0003 <0.0003 <0.0003 <0.0003 0.2
Mo <0.10 <0.10 0.11 0.04
K 18 20 18 19
Se <0.02 <0.02 <0.02 <0.02 1.0
Si 17 16 19 17
Ag <0.02 <0.02 <0.02 <0.02 5.0
Sr 1.6 1.8 1.6 1.7
Zn 21 29 23 24
' - Not regulated
for air pollution control. The leachate from bottom ash contains relatively low concentrations of sulfate and chloride, and heavy metal release is nonproblematic. The encapsulating properties of bitumen in the ash pavement are readily apparent. Generally there i more than a 10- to 20-fold decrea e in salt leachability from bitumen encapsulated material as compared with unamended bottom ash.
The EPA TCLP test data are given in Table 4. These data indicate that the bottom ash easily passes the standard regulated limits. Results from these as well as other leach tests are being compiled to create an extensive leaching data base.
CONCLUSIONS
The following conclusions can be drawn from the work completed on this research project to date.
1. The variation of the physical properties of the ash produced during the 7-month test period is reasonably insignificant.
2. The physical properties of the ash are consistent with its use as a substitute for conventional aggregate in asphaltic concrete.
3. The properties of ash are typical of a lightweight aggregate.
4. Bottom ash mixes can be designed to meet NHDOT specifications with up to 75 percent ash substitution. The mixes have lower unit weights (increased volume with constant weight) and require more asphalt cement than conventional mixes.
5. Bitumen effectively encapsulates the bottom ash and significantly mitigates the release of low concentrations of soluble salts from the bottom ash.
TRANSPORTATION RESEARCH RECORD 1345
A field pavement demonstration is planned after ongoing laboratory physical and field lysimeter work is completed.
ACKNOWLEDGMENTS
Support from the Concord Regional Solid Waste/Resource Recovery Cooperative and Wheelabrator Environmental Systems is highly appreciated.
REFERENCES
l. W. C. Ormsby. In Proc., First /111erru11io11al 011fere11ce 011 Municipal olid Waste Combttstor Ash Utilizatio11 , T. T. Eighrny and W. H. Chesner, eds. UNH Printing, OUiham, N.H., 19 8, pp. 49- 62.
2. J . Hartlen. In Proc., First /111ernatio11al Co11fere11ce 011 Mu11icipal Solid Waste Combustor Ash Utilization, T. T. Eighmy a11d W. H. Chesner, eds., UNH Printing, Durham, N.Jf. 1988, pp. 33-48.
3. 0 . Hjelmar. In Proc., Third Jmernarional Conference 011 M1111icipal Solid Wa.tte Comb11stor Ash U1ilizatio11 , W. H. Chesner and T. T . Eigllmy, eds ., UNH Printing, Durham, N. H., 1991, pp. 59- 70.
4. J . Yeh low. In Proc., Third /mernmional Conference on Municipal Solid Waste Comb11S1or Ash Utilization W. l·L Che ner and T . T . Eighmy, eds., UNH Printfog Durham, N.H., 1991. pp. 85-96.
5. C. E. Walter. Asphalt Road Composi1io11 and Process of Making Sand. U.S. Patent 3,907,582. U .. Patent Office, 1973.
6. C. E. Walter. Practkal Refll ·e Recycling. Journal of E11viro11-me11tal Engineering Division, A CE, Feb. 1976, pp. 139- 148.
7. D. J . Teag11e and W. B. Ledbcrter. Three Year Resulis on 1he Per/ ormance of Inci11ermio11 Residues in Biwminous Bt1 e. Report FHWAIRD-78/144. FHWA, U.S. Department of Transportation , 1978.
8. J . Ederly and W. B. Ledbclter. Field Performance of Liuercrete (I11ci11erator Residue) it1 a Bi111mi11011s Base. ReportFHWA/RD-88/022. FHWA, U.S. Deparcmen1 of Transportation, 198 1.
9. R. J. Collins, R.H . Miller, S. K. Ciesiel ki, E. M. Wal.lo , M. J. Boyle, D . Pindzola, and J. Tropea . Tech11ology for Use of fucinerator Residue as High way Co11.ftr11ction Material . Report FHWA/RD-771151. FHWA , U.S. Department of T ran portntion , 1977.
10. R. D. Pavlovich , H. J . Lentz, and W. C. Orm by. Incinerator Residue as Aggregate for H 1-Mix Ba e Course. In Transpor-1atio11 Research Record 734, TRB, National Research Council Washington , D .C. , 1979 pp. °38-44.
11. G. Bastanza. Summary Update of Research Projects with lncinermor Bottom Ash Residue. Report, Department of E nvironmental Management , 1982.
12. W. H . Chesner, R. J. Collin, and T. Fund. Asse smell/ of the Potential S11irability of So111lz111es1 Brook/y11 Incinerator Residue inAsphaltic Concrete Mixes. NYSERDAEncrgy Authority Report 90-15, 1988.
13. W. H. Chesner. E nvironmental C sues Associated with the Use of MSW Combustor Ash in Asphalt Paving Mixes. Proc., Second lmematio11al Municipal Waste Combustion Tampa Fla., Apdl 16-19 1991.
14. W. H. Chesner. Aggregate Related Charactcri tics of Municipal Solid Waste Combustion Residues. Proc. Second /111ematio11al Conference on Municipal Solid Waste Comb1irtor Ash Utilization , Oct. 8- 10, 19 9, Wa h.ington D.C.
15. R . J. Collins R. H . Miller and S. K. Cie ielski. Guidelines for Use of 111cilierator Residue as Highway Construction Material. Report FHWA-RD-77-150. FHWA, U .S, Department of Transportation, 1977.
Publication of this paper spo11Sored by Commillee on Soil and Rock Properties.