Structural Evaluation of Cold Recycling Reclaimed Asphalt Pavement (RAP) Blends

Bleakley, A.M., Cosentino, P.J. 1
TITLE: Improving the Properties of Reclaimed Asphalt Pavement for Roadway Base Applications through Blending and Chemical Stabilization
Corresponding Author: Albert M. Bleakley, Ph.D., P.E, Florida Institute of Technology
150 W. University Blvd Melbourne, FL 32901.
Phone 321 674-8048, FAX 321 674-8251 [email protected].
Paul J. Cosentino, Ph.D., P.E.
Florida Institute of Technology 150 W. University Blvd Melbourne, FL 32901
Phone 321 674-8048, FAX 321 674-7555 [email protected].
Word Count: 5,500 words 1 table x 250 250 7 figures x 250 1,750 Total equivalent 7,500
Submitted To:
Transportation Research Board Transportation Research Record
July 2012
TRB 2013 Annual Meeting Paper revised from original submittal.

Bleakley, A.M., Cosentino, P.J. 2
ABSTRACT Finding innovative ways to incorporate Reclaimed Asphalt Pavement (RAP) into highway base course applications will provide both environmental and economic benefits by allowing in situ recycling of material for projects such as widening or shoulder addition. RAP is a well-drained granular material, however 100% RAP has low bearing strength and creeps under load. The objective of this research was to develop methods to improve RAP’s strength while reducing creep to an acceptable level through blending with high quality crushed limestone aggregate and/or by chemical stabilization with asphalt emulsion or Portland cement. RAP/aggregate blends with and without chemical stabilization were compacted by modified Proctor method, cured, and tested for strength and creep. Strength was tested by the limerock bearing ratio (LBR), a variant of the CBR test. Specimens were tested dry and soaked to evaluate retained strength. One dimensional creep testing was performed using seven day oedometer tests. RAP/aggregate blends have the potential to be used successfully as base course material. Blends of RAP with 50% limerock (LR) base material attained acceptable LBR strength and creep with the addition of 1% of either asphalt emulsion or cement. Blends of RAP with 75% or more limerock attained close to acceptable LBR and low levels of creep without any chemical stabilizer. Significant variability was noted between results with different blends and stabilizing agents. Performance testing should be conducted to establish the suitability of a specific RAP/aggregate blend.
TRB 2013 Annual Meeting Paper revised from original submittal.

Bleakley, A.M., Cosentino, P.J. 3
Improving the Properties of Reclaimed Asphalt Pavement for Roadway Base Applications through Blending and Chemical Stabilization Albert M. Bleakley Paul J. Cosentino
INTRODUCTION A typical road resurfacing project produces thousands of tons of reclaimed asphalt pavement (RAP) which is usually hauled off site for disposal or stockpiled for reuse. If the underlying base course is reworked or the roadway is widened, thousands of tons of new aggregate base course material may have to be hauled to the site. Buying and transporting these large quantities of materials adds cost and environmental impacts to the project. If the RAP could be recycled in situ and substituted for a portion of the aggregate base, it would significantly reduce these impacts.
Two problems limit the reuse of RAP in a roadway base course: relatively low strength and tendency to creep under constant stress. Because of these problems, Florida Department of Transportation (FDOT) specifications currently limit RAP use as a base course material to road shoulders, bike paths, or other non-traffic applications (1). FDOT base specifications only include a limerock bearing ration (LBR) strength requirement. The LBR test is a variant of the California Bearing Ratio (CBR) test. The main difference between the tests is the baseline compressive strength used to determine the CBR or LBR value. A CBR value of 100 corresponds to a 1,000 psi (6,890 kPa) stress required to drive a 3.0 in2 (19.4 cm2) piston 0.1 inches (2.5 mm) into the material. An LBR of 100 corresponds to an 800 psi (5,512 kPa) stress required to obtain the same result. FDOT specifications require a minimum LBR of 100 (CBR of 80) for base course material. Previous research at the Florida Institute of Technology (FIT) (2) found that pure RAP had LBR values ranging from 10 to 30. Another FIT study found that blending A-3 sand with RAP improved its strength and reduced its creep, but not enough to meet FDOT base course specifications (3).
While FDOT base specifications include LBR strength, they do not include a deformation requirement because conventional base course aggregates exhibit practically zero additional deformation after initial compaction. Asphalt cement is a viscoelastic material exhibiting some properties of an elastic solid and some properties of viscous liquid. RAP consists of aggregates coated with asphalt cement. Because of this, RAP exhibits a tendency to creep – to continue to deform over time under a constant load. This makes pure RAP unsuitable for engineering applications where continued deformation is unacceptable (2)(3).
OBJECTIVE AND SCOPE: The objective of this research was to identify ways to improve the strength and reduce the creep of RAP by blending it with high quality aggregate material and/or adding chemical stabilizing agents so that RAP can be used as a component of roadway base courses. Crushed limerock, a common Florida base course material, was chosen as the high quality aggregate. Based on literature review, anionic asphalt emulsion (SS-1H), cationic asphalt emulsion (CSS-1H), and Portland cement were chosen as chemical stabilizing agents.
TRB 2013 Annual Meeting Paper revised from original submittal.

Bleakley, A.M., Cosentino, P.J. 4
LITERATURE REVIEW The literature review focused on six areas: 1) general characteristics of RAP, 2) current use of RAP or RAP blends in base courses in Florida and other jurisdictions, 3) blending of RAP and virgin aggregates, 4) use of chemical stabilizing additives with RAP including Full Depth Reclamation (FDR) pavement restoration, 5) creep behavior of soils and RAP, and 6) mathematical modeling of the rheological response of viscoelastic materials to stress.
The literature contains several studies on the engineering properties of RAP and RAP blends. The majority of the studies included gradation, asphalt content, and moisture density properties. Other properties were evaluated based on the geographical location of the study including permeability, freeze-thaw moisture, and abrasion resistance (4)(5)(6).
At least 12 U.S. states allow the use of RAP/aggregate blends in roadway base courses (7). State specifications were reviewed to evaluate the types of material allowed and the associated specifications and test criteria. Multiple studies have been conducted to specifically evaluate the characteristics and performance of RAP and RAP/aggregate blends in roadway base courses (8)(9)(10). The results from this portion of the review were used to select the materials and tests for the laboratory testing program in this study.
All of the U.S. states that allow the use of RAP in roadway base courses require that it be blended with aggregate materials. The literature contains several studies on the engineering properties of RAP and RAP blends. Several studies have examined the effect of this blending on the resilient modulus of the base course which is a design parameter in designing the thickness of the base course (5)(9)(11)(12).
A wide variety of chemical stabilizing agents are available to improve the performance of soils including polymers (13), fly ash (14)(15), enzymatic stabilizers (16), and Portland cement and lime in Cold In-place Recycling (CIR) blends (17). CIR and Full Depth Reclamation (FDR) (18) in situ recycling methods for RAP typically use Portland cement, asphalt emulsion or foamed asphalt as a stabilizing agent. The results of this portion of the review were used to select the chemical stabilizing agents to evaluate in this study and to select the mechanical performance tests for the evaluation.
FDR most closely approximates blending and chemically stabilizing RAP and virgin aggregates. Typically, FDR milling and blending results in an approximately 50%/50% blend of milled asphalt and underlying aggregate material. This part of the literature review focused on the mix design process to determine the proportions of RAP, aggregate, and stabilizing agent to be used. In addition to the literature review, three commercial laboratories that have recently done FDR projects were surveyed. The commercial labs used either a modified Marshall or a gyratory compaction mix design method to determine the optimum amount of stabilizing agent. The modified Marshall method measures both strength and deformation of test samples; the gyratory method only uses tensile strength testing. Neither method directly evaluates creep.
Most of the studies discussed above focused on strength characteristics of RAP and RAP/aggregate blends. There have been fewer studies on the effect of creep deformation in these materials. Creep theory for soils was developed by Singh and Mitchell (19) through a series of triaxial creep experiments with a variety of soils. Augustesen et al. (20) conducted a series of both triaxial and oedometer creep tests of soils. Viyanant (21) conducted a series of triaxial creep tests on RAP. This part of the literature review focused on the physical testing of creep in RAP and analysis of the results. There are standards for an acceptable level of rutting (creep) in an overall asphalt pavement system, however the review did not find any recommendations for acceptable creep in a base course.
TRB 2013 Annual Meeting Paper revised from original submittal.

Bleakley, A.M., Cosentino, P.J. 5
The final portion of the literature review focused on modeling to predict the amount of creep deformation over the lifespan of a pavement system. It is impractical to physically perform multi-year creep tests, so this objective was met by developing predictive mathematical models. Physical creep tests in the laboratory were used to determine the effect of blending and chemical stabilizing agents on one-dimensional creep over a one week period. This physical data was then used to tune the mathematical models. In addition to the Singh and Mitchell model, a simplified model was developed using strain-log(time) trendlines applied to experimental data. Both models were used to project base course creep deformation over a conservative roadway design life of 30 years.
Development of Creep Theory Singh and Mitchell (19) developed equations describing the creep relationships between
strain and time, and strain rate and time for a variety of soil types. Figure 1 shows the general creep behavior of soils under a constant deviator stress (σ1-σ3). The stress level was normalized as creep stress divided by the failure stress. At low normalized deviator stresses the creep deflections were small and ceased over time. Higher stress levels resulted in prolonged creep but not rupture. Deviator stresses over 90% of failure stress resulted in a secondary creep stage with constant creep rate followed by a tertiary stage of accelerating strain rate leading to rupture.
FIGURE 1 Creep under constant stress from Singh and Mitchell (19). Equation 1 shows Singh and Mitchell’s generalized model for creep in soils.
where: ε̇ = strain rate at any time t; A = the strain rate obtained by plotting log strain rate vs. deviator
and finding the intercept when D = 0.
mD
ttAe
= 1αε Equation 1
TRB 2013 Annual Meeting Paper revised from original submittal.

Bleakley, A.M., Cosentino, P.J. 6
α = slope of the linear portion of the logarithm strain versus deviator-stress plot.
D = deviator stress; t = time;
t1 = unit time baseline m – slope of log (strain) versus log (time) line
The stress intensity, D, was originally taken as the triaxial creep test deviator stress (σ1-σ3) but may be taken as uniaxial stress in an oedometer test (19). The parameters A, α and m, can be determined by performing two or more creep tests on identical specimens at different stress levels. Plotting the log strain rate versus log time defines m. Plotting the log strain rate versus stress for two separate times defines α (slope) and A (intercept).
LABORATORY INVESTIGATION PROGRAM Laboratory tests included strength tests (LBR), and creep tests to determine susceptibility to long-term deformation. Tests were conducted on 100% RAP, blends of RAP/limerock containing 75%, 50%, and 25% RAP, and 100% limerock base material. Specimens were tested with 0%, 1%, 2%, and 3% stabilizing agent by weight.
A single source of RAP and a single limerock base material were used to isolate the effect of the stabilizing agent. Compaction was performed by the modified Proctor procedure in Florida Method FM 5-515 (Limerock Bearing Ratio). Initially LBR tests were conducted after curing and creep testing without soaking which results in higher LBR values than those from soaked tests. These LBR results were used for comparison purposes only to determine which blend/stabilizer combinations had potential to meet the FDOT soaked LBR specification requirements. For detailed test data see Cosentino et al (22).
LBR Strength Tests
Unsoaked LBR of RAP/Limerock Blends without Chemical Stabilization 100% RAP, blends of 75%, 50%, and 25% RAP with limerock, and 100% limerock, were tested. Both dry density and unsoaked LBR increased with increasing amounts of limerock in the blend. There was a pronounced rise in average LBR between the 50% RAP/50% LR and the 25% RAP/75% LR blend, doubling the average unsoaked LBR from 142 to 284.
Unsoaked LBR of RAP/Limerock Blends with Chemical Stabilization Blends of 25%, 50%, and 75% RAP with limerock were all tested with 0%, 1%, 2%, and 3% stabilizer. Emulsion stabilized specimens were left in their molds and placed in a 60°C oven for 24 to 48 hours (until specimen weight stabilized) to accelerate curing. Portland cement stabilized specimens were left in their molds, covered to retain moisture, and cured 7 days at ambient temperature. After curing, specimens were creep tested for 7 days at 12 psi (82.7 kPa) constant pressure. Unsoaked LBR tests were conducted following the creep tests.
Blends with 75% RAP did not reach an unsoaked LBR of 100 (not shown). Blends with 50% RAP and 25% RAP did reach unsoaked LBRs over 100 (Figure 2) The CSS-1H stabilized specimens showed a small LBR increase at approximately 1% emulsion content followed by a gradual decrease in LBR with the addition of 2% and 3% emulsion. Cement stabilized specimens, on the other hand, showed increased LBR in an almost linear relationship with no observed peak or optimum amount. At 1%, emulsion and cement stabilized specimens had
TRB 2013 Annual Meeting Paper revised from original submittal.
Bleakley, A.M., Cosentino, P.J. 7
similar unsoaked LBR strengths. At 2% or 3%, the cement specimens were much stronger. The 50% RAP and 25% RAP blends showed the same trends but, consistent with the unstabilized blend testing, the 25% RAP blends had approximately two times the unsoaked LBR of the 50% RAP blends. At 3% cement content, the 25% RAP/75% limerock specimen exceeded the capacity of the CBR test machine. The projected 3% cement specimen LBR strength is shown as a dashed line. The SS-1H stabilized specimens (not shown) exhibited trends similar to the CSS-1H specimens.
FIGURE 2 Stabilized 50% RAP and 25% RAP/LR blend unsoaked LBR summary.
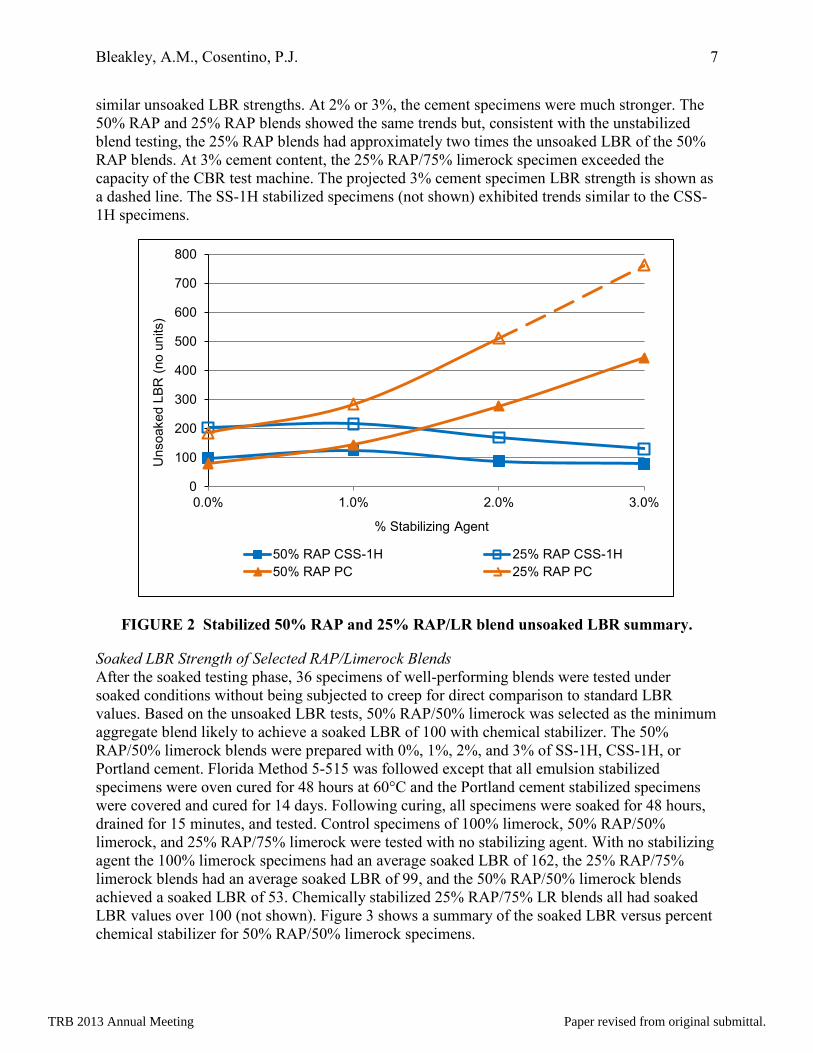
Soaked LBR Strength of Selected RAP/Limerock Blends After the soaked testing phase, 36 specimens of well-performing blends were tested under soaked conditions without being subjected to creep for direct comparison to standard LBR values. Based on the unsoaked LBR tests, 50% RAP/50% limerock was selected as the minimum aggregate blend likely to achieve a soaked LBR of 100 with chemical stabilizer. The 50% RAP/50% limerock blends were prepared with 0%, 1%, 2%, and 3% of SS-1H, CSS-1H, or Portland cement. Florida Method 5-515 was followed except that all emulsion stabilized specimens were oven cured for 48 hours at 60°C and the Portland cement stabilized specimens were covered and cured for 14 days. Following curing, all specimens were soaked for 48 hours, drained for 15 minutes, and tested. Control specimens of 100% limerock, 50% RAP/50% limerock, and 25% RAP/75% limerock were tested with no stabilizing agent. With no stabilizing agent the 100% limerock specimens had an average soaked LBR of 162, the 25% RAP/75% limerock blends had an average soaked LBR of 99, and the 50% RAP/50% limerock blends achieved a soaked LBR of 53. Chemically stabilized 25% RAP/75% LR blends all had soaked LBR values over 100 (not shown). Figure 3 shows a summary of the soaked LBR versus percent chemical stabilizer for 50% RAP/50% limerock specimens.
0
100
200
300
400
500
600
700
800
0.0% 1.0% 2.0% 3.0%
Uns
oake
d LB
R (n
o un
its)
% Stabilizing Agent
50% RAP CSS-1H 25% RAP CSS-1H50% RAP PC 25% RAP PC
TRB 2013 Annual Meeting Paper revised from original submittal.
Bleakley, A.M., Cosentino, P.J. 8
FIGURE 3 Soaked LBR of stabilized 50% RAP/50% limerock blends.
The 50% RAP/50% limerock blends stabilized with CSS-1HF emulsion all exceeded an LBR of 100: 1% (LBR 127), 2% (LBR 105) and 3% (LBR 107). The 50%/50% blends stabilized with 1%, 2%, and 3% SS-1H emulsion achieved LBRs of 106, 103 and 100 respectively. Specimens stabilized with 1% Portland cement produced an LBR of 175, well above the 100 required for base material. Blends with 2% and 3% cement achieved LBRs of 288 and 396 respectively.
Summary of Soaked LBR of Stabilized RAP/Limerock Blends Portland cement was the most predictable of the three chemical stabilizing agents tested. The relationship between percent cement and LBR was approximately linear for the concentrations tested. Interpolating from observed results, blends with 0.5% cement stabilization would still achieve a soaked LBR over 100. These LBR values are based on 14 day strengths, normal hydration of cement would probably increase strength with additional time.
Both SS-1H and CSS-1HF emulsion showed a peak at 1% concentration, then a gradual strength decrease. For an actual mix design, it would be prudent to test concentrations at 0.5% intervals to refine the optimum emulsion content. LBR values are based on strengths measured immediately after curing and soaking. This research did not investigate whether the stabilized strengths would change with additional time.
Creep Tests Creep test specimens were compacted in 6.0 in (152 mm) Proctor molds, cured, and then placed into one-dimensional oedometer devices. The devices consisted of locally manufactured test frames with pneumatic pistons actuated using compressed nitrogen. A load plate was placed on the specimen. Load was transmitted from the piston to the plate through a 1.0 in (25.4 mm) diameter ball bearing. Deflections were measured using a linear variable differential transistor
0
50
100
150
200
250
300
350
400
0.0% 1.0% 2.0% 3.0%
Soak
ed L
BR (n
o un
its)
% Stabilizing Agent
SS-1H CSS-1HF PC 25% MRAP/ 75% LR 100% LR
TRB 2013 Annual Meeting Paper revised from original submittal.
Bleakley, A.M., Cosentino, P.J. 9
(LVDT). Up to 12 tests could be run at a time. Data was collected by a computer running a custom written Labview® program.
The primary settlement has two major and two minor components. Neither of the major components: displacements resulting from surface irregularities/seating, or initial rearrangement of the soil skeleton, are related to creep under constant stress. The two minor components are elastic (recoverable) deformation of the soil skeleton and viscoelastic creep. It was not possible to differentiate between these four primary phase settlement components. It is possible to generalize that creep deformation is a very small portion of the total primary deformation because of the short time frame. During secondary creep settlement the initial seating and soil skeleton deformations have already occurred and add no further deformation. Elastic deformation remains constant under constant stress leaving creep as the major component. Because total settlement is heavily influenced by factors other than creep, the creep strain rate slope during secondary creep was chosen as a better indicator in comparing the creep susceptibility of these blends.
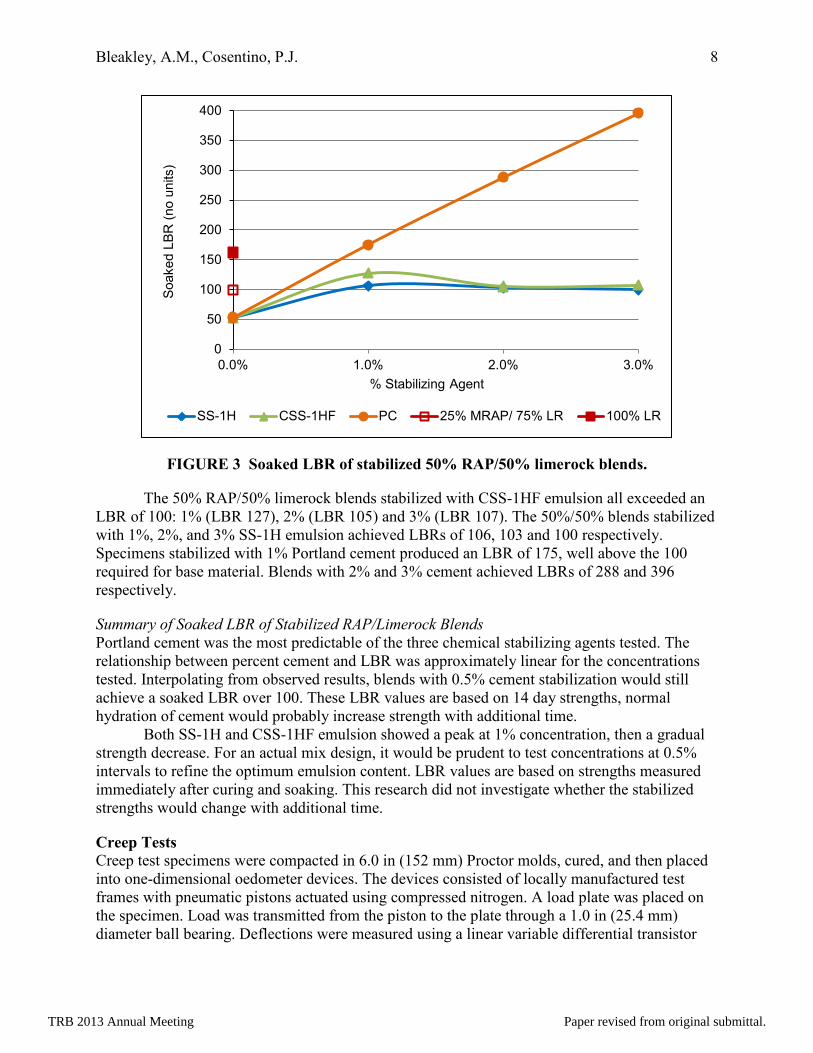
A typical set of strain versus log(time) curves for 100% limerock and 50% RAP/50% LR with 0%, 1%, and 2% CSS-1H stabilizer is shown in Figure 4. There is a large initial strain when the specimen is loaded (primary creep) followed by small additional strain at constant load (secondary creep). In these relatively low stress experiments tertiary creep (failure) was not observed. The strain at the start of the tests was zero. The plots start at 0.01 day (14.4 minutes) because experimental results indicated that the primary stage deformations largely occurred before this time. The vertical axis starts at a strain of 0.004 to make the slopes more visible. Each curve represents a single specimen. The 100% limerock plot is nearly flat (zero slope) while the 50%/50% blend plots have more pronounced slopes. In this case there was more primary phase deformation in the RAP/limerock blends than in the 100% limerock.
Logarithmic trendlines were fitted to the secondary creep portion of the log(time) curves from 0.01 days to the end of the test at 7 days. This produces a line with the equation δ = m log (t) + b. In this paper the slope of the trendline, m, is referred to as the average creep strain rate (CSR). The value b, is the strain that occurs at time = 1 day (when log(t) = 0). The CSR (slope) differences are evident in the strain versus log(time) plot in Figure 4. 100% limerock has the lowest CSR, followed by the unstabilized 50%/50% blend, then the 50%/50% blend with 1% emulsion, and finally the 50%/50% blend with 2% emulsion. Although the 50%/50% blend with no stabilizer had a higher initial strain, the 1% and 2% emulsion stabilized specimens will have more strain over time because of their higher slopes. The asphalt emulsions were approximately 67% asphalt binder and 33% water with a small amount of emulsifier. The net effect of adding emulsion was to increase the asphalt content of the blend. This trend of higher creep deformation with higher asphalt content of blends agrees with results of earlier research with RAP/A-3 sand blends (23).
TRB 2013 Annual Meeting Paper revised from original submittal.

Bleakley, A.M., Cosentino, P.J. 10
FIGURE 4 Typical creep of CSS-1H stabilized blends – log (time).
Creep of Cationic Emulsion (CSS-1H) Stabilized RAP/Limerock Blends Figure 5 shows the creep strain rates observed for 22 specimens of CSS-1H emulsion stabilized RAP/limerock blends, 100% limerock, and 100% RAP. The data point for 100% limerock overlaps the 0% CSS-1H 25% RAP/75% LR blend data point. Blending had a much greater effect on creep than emulsion content. The 50% RAP/50% LR blend with no emulsion had approximately two times the CSR of 100% limerock, but this was approximately 1/4 of the creep rate of 100% RAP and 1/3 the creep rate of 75% RAP/25% LR. Stated another way, blending RAP with at least 50% virgin aggregate reduced the creep rate by over 70% compared to unblended RAP.
Adding 1% CSS-1H produced a slight decrease in CSR for the 50% RAP/50% LR blend while the addition of 2% or 3% emulsion increased the rate of creep above that of the blend without stabilizer. The 25% RAP/75% LR blend without emulsion had approximately the same creep rate as 100% limerock. With 1% emulsion the CSR of the 25% RAP/75% LR blend was slightly lower than the CSR of the 100% limerock. Adding 2% emulsion caused the creep to increase above the original value without stabilizer similar to the 50%/50% blend.
y = 1.49E-03log(t) + 8.63E-03
y = 7.61E-04log(t) + 6.35E-03
y = 6.13E-04log(t) + 7.86E-03
y = 2.51E-04log(t) + 5.29E-03
0.004
0.005
0.006
0.007
0.008
0.009
0.010
0.011
0.01 0.10 1.00 10.00
Stra
in (i
n/in
)
Time (days)
50% MRAP 50% LR 2% CSS-1H 50% MRAP 50% LR 1% CSS-1H 50% MRAP 50% LR no stab 100% LR no stab
TRB 2013 Annual Meeting Paper revised from original submittal.

Bleakley, A.M., Cosentino, P.J. 11
FIGURE 5 Creep strain rate in CSS-1H stabilized RAP/limerock blends.
Creep of Anionic Emulsion (SS-1H) Stabilized RAP/Limerock Blends Thirty four creep tests were conducted with SS-1H stabilized blends. The results were similar to the CSS-1H results. Adding 1% SS-1H decreased the CSR slightly for the 75% RAP/25% LR blend. Adding 2% SS-1H continued to decrease the CSR but at 3% SS-1H the CSR showed a small increase. The addition of SS-1H to blends containing 50% RAP resulted in a slight increase in CSR up to 2% emulsion. At 50% or higher limerock contents the deflections and hence creep rates were so small that they were close to the accuracy limits of the LVDT used for deflection measurements resulting in some fluctuation in the data. As was the case for CSS-1H stabilized blends, the 50% RAP/50% LR and 25% RAP/75% LR blends had CSRs similar to 100% limerock. The 75% RAP/25% LR blend had higher CSRs that were closer to 100% RAP.
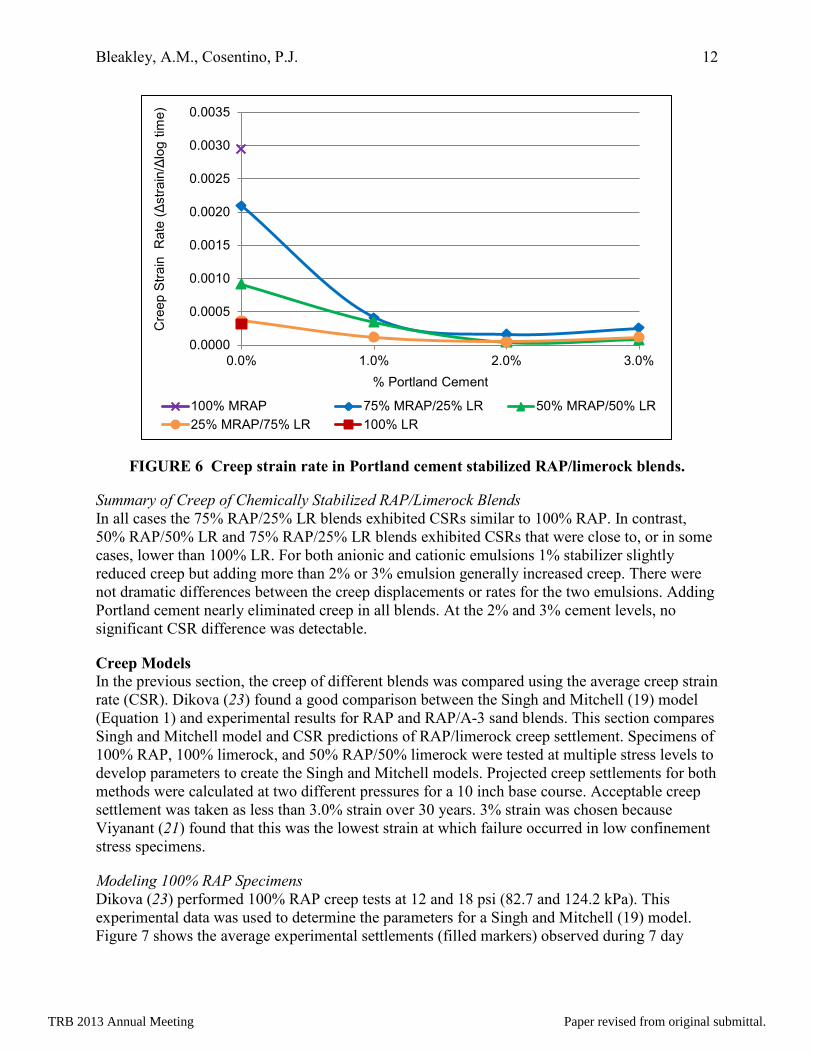
Creep of Portland Cement (PC) Stabilized RAP/Limerock Blends Figure 6 shows the results of twenty six creep tests conducted with Portland cement stabilized RAP/LR blends. Control specimens of 100% RAP and 100% limerock were only tested without stabilizer. The addition of 1% Portland cement drastically reduced creep strain rate in all blends. This effect was especially pronounced in the 75% RAP/25% LR blends, reducing the creep rate by approximately 75%. Unlike the asphalt emulsions which increased creep at higher concentrations, adding more than 1% Portland cement essentially eliminated creep in all of the blended specimens.
0.0000
0.0005
0.0010
0.0015
0.0020
0.0025
0.0030
0.0035
0.0% 1.0% 2.0% 3.0%
Cre
ep S
train
Rat
e (Δ
stra
in/Δ
log
time)
% CSS-1H Emulsion
100% MRAP 75% MRAP/25% LR 50% MRAP/50% LR25% MRAP/75% LR 100% LR
TRB 2013 Annual Meeting Paper revised from original submittal.
Bleakley, A.M., Cosentino, P.J. 12
FIGURE 6 Creep strain rate in Portland cement stabilized RAP/limerock blends.
Summary of Creep of Chemically Stabilized RAP/Limerock Blends In all cases the 75% RAP/25% LR blends exhibited CSRs similar to 100% RAP. In contrast, 50% RAP/50% LR and 75% RAP/25% LR blends exhibited CSRs that were close to, or in some cases, lower than 100% LR. For both anionic and cationic emulsions 1% stabilizer slightly reduced creep but adding more than 2% or 3% emulsion generally increased creep. There were not dramatic differences between the creep displacements or rates for the two emulsions. Adding Portland cement nearly eliminated creep in all blends. At the 2% and 3% cement levels, no significant CSR difference was detectable.
Creep Models In the previous section, the creep of different blends was compared using the average creep strain rate (CSR). Dikova (23) found a good comparison between the Singh and Mitchell (19) model (Equation 1) and experimental results for RAP and RAP/A-3 sand blends. This section compares Singh and Mitchell model and CSR predictions of RAP/limerock creep settlement. Specimens of 100% RAP, 100% limerock, and 50% RAP/50% limerock were tested at multiple stress levels to develop parameters to create the Singh and Mitchell models. Projected creep settlements for both methods were calculated at two different pressures for a 10 inch base course. Acceptable creep settlement was taken as less than 3.0% strain over 30 years. 3% strain was chosen because Viyanant (21) found that this was the lowest strain at which failure occurred in low confinement stress specimens.
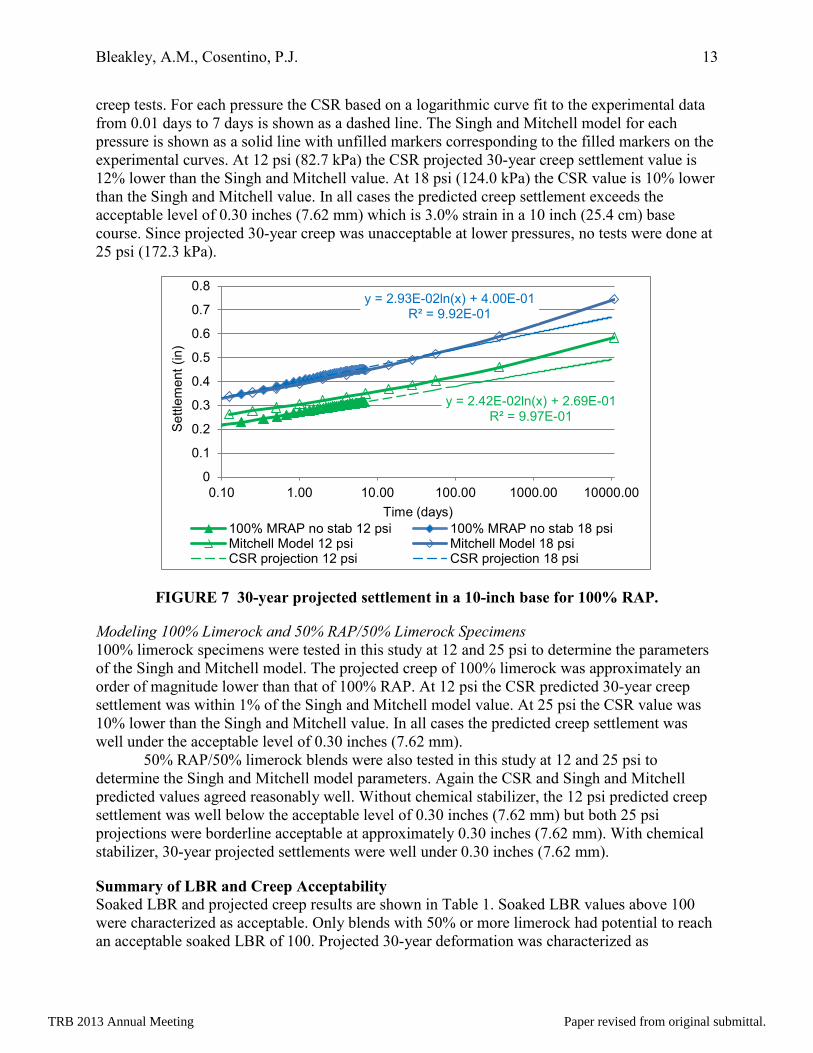
Modeling 100% RAP Specimens Dikova (23) performed 100% RAP creep tests at 12 and 18 psi (82.7 and 124.2 kPa). This experimental data was used to determine the parameters for a Singh and Mitchell (19) model. Figure 7 shows the average experimental settlements (filled markers) observed during 7 day
0.0000
0.0005
0.0010
0.0015
0.0020
0.0025
0.0030
0.0035
0.0% 1.0% 2.0% 3.0%
Cre
ep S
train
Rat
e (Δ
stra
in/Δ
log
time)
% Portland Cement
100% MRAP 75% MRAP/25% LR 50% MRAP/50% LR25% MRAP/75% LR 100% LR
TRB 2013 Annual Meeting Paper revised from original submittal.
Bleakley, A.M., Cosentino, P.J. 13
creep tests. For each pressure the CSR based on a logarithmic curve fit to the experimental data from 0.01 days to 7 days is shown as a dashed line. The Singh and Mitchell model for each pressure is shown as a solid line with unfilled markers corresponding to the filled markers on the experimental curves. At 12 psi (82.7 kPa) the CSR projected 30-year creep settlement value is 12% lower than the Singh and Mitchell value. At 18 psi (124.0 kPa) the CSR value is 10% lower than the Singh and Mitchell value. In all cases the predicted creep settlement exceeds the acceptable level of 0.30 inches (7.62 mm) which is 3.0% strain in a 10 inch (25.4 cm) base course. Since projected 30-year creep was unacceptable at lower pressures, no tests were done at 25 psi (172.3 kPa).
FIGURE 7 30-year projected settlement in a 10-inch base for 100% RAP.
Modeling 100% Limerock and 50% RAP/50% Limerock Specimens 100% limerock specimens were tested in this study at 12 and 25 psi to determine the parameters of the Singh and Mitchell model. The projected creep of 100% limerock was approximately an order of magnitude lower than that of 100% RAP. At 12 psi the CSR predicted 30-year creep settlement was within 1% of the Singh and Mitchell model value. At 25 psi the CSR value was 10% lower than the Singh and Mitchell value. In all cases the predicted creep settlement was well under the acceptable level of 0.30 inches (7.62 mm).
50% RAP/50% limerock blends were also tested in this study at 12 and 25 psi to determine the Singh and Mitchell model parameters. Again the CSR and Singh and Mitchell predicted values agreed reasonably well. Without chemical stabilizer, the 12 psi predicted creep settlement was well below the acceptable level of 0.30 inches (7.62 mm) but both 25 psi projections were borderline acceptable at approximately 0.30 inches (7.62 mm). With chemical stabilizer, 30-year projected settlements were well under 0.30 inches (7.62 mm).
Summary of LBR and Creep Acceptability Soaked LBR and projected creep results are shown in Table 1. Soaked LBR values above 100 were characterized as acceptable. Only blends with 50% or more limerock had potential to reach an acceptable soaked LBR of 100. Projected 30-year deformation was characterized as
y = 2.42E-02ln(x) + 2.69E-01 R² = 9.97E-01
y = 2.93E-02ln(x) + 4.00E-01 R² = 9.92E-01
0
0.1
0.2
0.3
0.4
0.5
0.6
0.7
0.8
0.10 1.00 10.00 100.00 1000.00 10000.00
Settl
emen
t (in
)
Time (days) 100% MRAP no stab 12 psi 100% MRAP no stab 18 psiMitchell Model 12 psi Mitchell Model 18 psiCSR projection 12 psi CSR projection 18 psi
TRB 2013 Annual Meeting Paper revised from original submittal.

Bleakley, A.M., Cosentino, P.J. 14
acceptable if it was below 0.30 inches (7.62 mm). The 30-year deformation for a 10-inch thick base course of each blend was projected for a 25 psi (172 kPa) average stress.
Table 1 Stabilized Blends Soaked LBR and 30-year Deformation Projections for a 10-inch (25.4 cm) Base Course at 25 psi (172 kPa)
Description Stabilizing Agent
Soaked LBR
Accept-able
30-year Deforma-tion (in)
Accept-able
Limerock RAP
100% 0% No Stabilizer 162 Yes 0.08 Yes
75% 25% No Stabilizer 99 No 0.12 Yes
50% 50% No Stabilizer 55 No 0.15 Yes
50% 50% 1% Cement 175 Yes 0.09 Yes
50% 50% 1% SS-1H 106 Yes 0.08 Yes
50% 50% 1% CSS-1H 127 Yes 0.20 Yes
0% 100% No stabilizer 30 No 0.70 No
CONCLUSIONS
Blending RAP and Limerock Aggregate 100% RAP had an LBR strength below the 100 required by FDOT base course specifications or 40 required for stabilized subgrade. Blending limerock with RAP improved both LBR strength and creep performance. Blends of 50% RAP/50% limerock without stabilizing agent achieved soaked LBR values over 40. Blends of 25% RAP/75% limerock without stabilizer achieved soaked LBR values very close to 100 (99). All blends with 50% or more limerock had projected 30-year creep deformations that would be acceptable in a base course.
Stabilization with Anionic (SS-1H) and Cationic (CSS-1H) Asphalt Emulsion Blends of 50% RAP/50% limerock stabilized with asphalt emulsion achieved soaked LBR strengths exceeding 100 and acceptable 30-year creep deformations. Anionic and cationic emulsion gave similar improvements in blend properties. Emulsions from two different suppliers were used in this study. Both types of emulsion showed a peak LBR improvement at 1% concentration with a slight decline as emulsion content increased. Lower concentrations of emulsion improved creep performance of the blends but creep increased with higher emulsion content. Emulsion formulations are proprietary so it is not possible to draw general conclusions about whether an anionic (SS-1H) or cationic (CSS-1H) emulsion will give better results for a given RAP/aggregate blend.
Stabilization with Portland Cement RAP/limerock blends with 50% or more limerock stabilized with Portland cement produced LBR strengths well over 100 and acceptable 30-year creep deformations. Unlike the emulsions, the effect of 1%, 2%, and 3% Portland cement was essentially a linear increase in LBR. Creep was
TRB 2013 Annual Meeting Paper revised from original submittal.

Bleakley, A.M., Cosentino, P.J. 15
significantly reduced with the addition of 1% Portland cement. Addition of 2% or 3% Portland cement nearly eliminated creep deformation in the blends tested.
RECOMMENDATIONS RAP/limerock blends without chemical stabilizing agent can potentially meet strength and creep requirements for base course applications if blended at a maximum of 25% RAP to 75% limerock. Blends with a maximum of 50% RAP can potentially meet strength and creep requirements if a chemical stabilizing agent is used. Performance testing should be performed on the specific RAP and aggregate used. The amount and type of chemical stabilizing agent should be determined by a mix design method which results in a blend that meets performance requirements.
ACKNOWLEDGEMENT This research was funded by the Florida Department of Transportation. Their support is gratefully acknowledged.
REFERENCES
1. Florida Department of Transportation (FDOT). Standard Specifications for Road and Bridge Construction. Florida Department of Transportation, 2010.
2. Cosentino, P. J., E. H. Kalajian, , C. S. Shieh, , W. J .K. Mathurin, F. A. Gomez, E. D. Cleary, A. Treerattakoon. Developing Specifications for Using Recycled Asphalt Pavement as Base, Subbase, or General Fill Materials, Phase II. Final Report. Publication FL/DOT/RMC/06650-7754 BC 819, Florida Department of Transportation, 2003.
3. Cosentino, P. J., E. H. Kalajian, D. Dikova, M. Patel, C. Sandin. Investigating the Statewide Variability and Long Term Strength Deformation Characteristics of RAP and RAP-Soil Mixtures. Publication FL/DOT/RMC/06650-7754 BDB 809, Florida Department of Transportation, 2008.
4. Taha, R., G. Alil, A. Basmal, O. Al-Turkl. Evaluation of Reclaimed Asphalt Pavement Aggregate in Road Bases and Subbases. In Transportation Research Record: Journal of the Transportation Research Board, Volume 1652 , Transportation Research Board of the National Academies, Washington, D.C., 1999, pp. 264-269.
5. Alam, T. B., M. Abdelrahman, and S. Schram. Laboratory Characterization of Recycled Asphalt Pavement as a Base Layer. International Journal of Pavement Engineering, Vol. 11, No. 2, 2010, pp. 123-131.
6. Bennert, T., and A. Maher. The Development of a Performance Specification for Granular Base and Subbase Material, Publication FHWA-NJ-2005-003, New Jersey Department of Transportation, 2005.
TRB 2013 Annual Meeting Paper revised from original submittal.

Bleakley, A.M., Cosentino, P.J. 16
7. McGarrah, E. J., Evaluation of Current Practices of Reclaimed Asphalt Pavement/Virgin Aggregate as Base Course Material. Report No. WA-RD 713.1, Washington State Department of Transportation, 2007.
8. MacGregor, J. A. C., W. H. Highter, and D. J. DeGroot,. Structural Numbers for Reclaimed Asphalt Pavement Base and Subbase Course Mixes. In Transportation Research Record: Journal of the Transportation Research Board, No 1687, Transportation Board of the National Academies, Washington, D.C., 1999, pp. 22-28..
9. Locander, R. Analysis of Using Reclaimed Asphalt Pavement (RAP) as a Base Course Material, Report CDOT-2009-5. Colorado Department of Transportation, 2009.
10. Foye, K. C. Use of Reclaimed Asphalt Pavement in Conjunction with Ground Improvement: A Case History. Advances in Civil Engineering. Vol. 2011, article number 808561, 2011.
11. Kim, W., J. F. Labuz, , and S. Dai. Resilient Modulus of Base Course Containing Recycled Asphalt Pavement. In Transportation Research Record: Journal of the Transportation Research Board, No. 2005, Transportation Research Board of the National Academies, Washington, D.C., 2007, pp. 27-35.
12. Wu, M. Evaluation of High Percentage Recycled Asphalt Pavement as Base Course Materials. Master’s Thesis, Washington State University, 2011
13. Newman, K., and J. Tingle. Emulsion Polymers for Soil Stabilization. FAA Worldwide Airport Technology Transfer Conference, Atlantic City, New Jersey, April 2004.
14. Tao, M., Z. Zhang, and Z. Wu. Simple Procedure to Assess Performance and Cost Benefits of using Recycled Materials in Pavement Construction. ASCE Journal of Materials in Civil Engineering, Vol. 20, Issue 11, 2008, pp. 718-725.
15. Rupnow, T. Subgrade Stabilization Using Recycled Asphalt Pavement And Fly Ash Mixtures. Presented at 2002 Transportation Scholars Conference. Iowa State University, Ames, Iowa, 2002
16. Parsons, R. L., and J. P. Milburn. Engineering Behavior of Stabilized Soils. In Transportation Research Record: Journal of the Transportation Research Board, Vol. 1837/2003, Transportation Research Board of the National Academies, Washington, D.C., 2003, pp. 20-29.
17. Niazi, Y., and M. Jalili. Effect of Portland Cement and Lime Additives on Properties of Cold in Place Recycled Mixtures with Asphalt Emulsion. Construction & Building Materials, Vol 23. Issue 3, 2009, pp. 1338-1343.
18. Apeagyei, A., and Diefenderfer, B., Structural Evaluation of FDR Pavements in Virginia Bearing Capacity of Roads, Railways and Airfields, Two Volume Set. Proceedings of the 8th International Conference (BCR2A'09), University of Illinois, Champaign, Illinois, 2009.
TRB 2013 Annual Meeting Paper revised from original submittal.
Bleakley, A.M., Cosentino, P.J. 17
19. Singh, A., and Mitchell, J. K., General Stress-Strain-Time Function for Soils. ASCE Journal of the Soil Mechanics and Foundation Division, Vol. 94, No. SM1, 1968, pp. 21-47.
20. Augustesen, A., Liingaard, M., and Lade, P. V., Evaluation of Time-Dependent Behavior of Soils, ASCE International Journal of Geomechanics, Vol. 4, no. 3, 2004, pp. 321-338.
21. Viyanant, C., Rathje E. M., and Rauch A. F., Creep of Compacted Recycled Asphalt Pavement. Canadian Geotechnical Journal Vol. 44.No. 6 pp. 687-97. January 2007.
22. Cosentino, P. J., E. H. Kalajian, A. M. Bleakley, B. S. Diouf, T.J. Misilo, A. J. Petersen, R. E. Krajcik, A. M. Saajjadi. Improving the Properties of Reclaimed Asphalt Pavement for Roadway Base Applications. Publication FL/DOT/BDK81 977-02, Florida Department of Transportation, 2012.
23. Dikova, D., Creep Behavior of RAP-Soil Mixtures in Earthwork Applications. Master’s Thesis, Florida Institute of Technology, 2006.
TRB 2013 Annual Meeting Paper revised from original submittal.