phylogentic analysis lab - Home | Barnard College week’s lab) • Lab Worksheet PHYLOGENETIC...
25
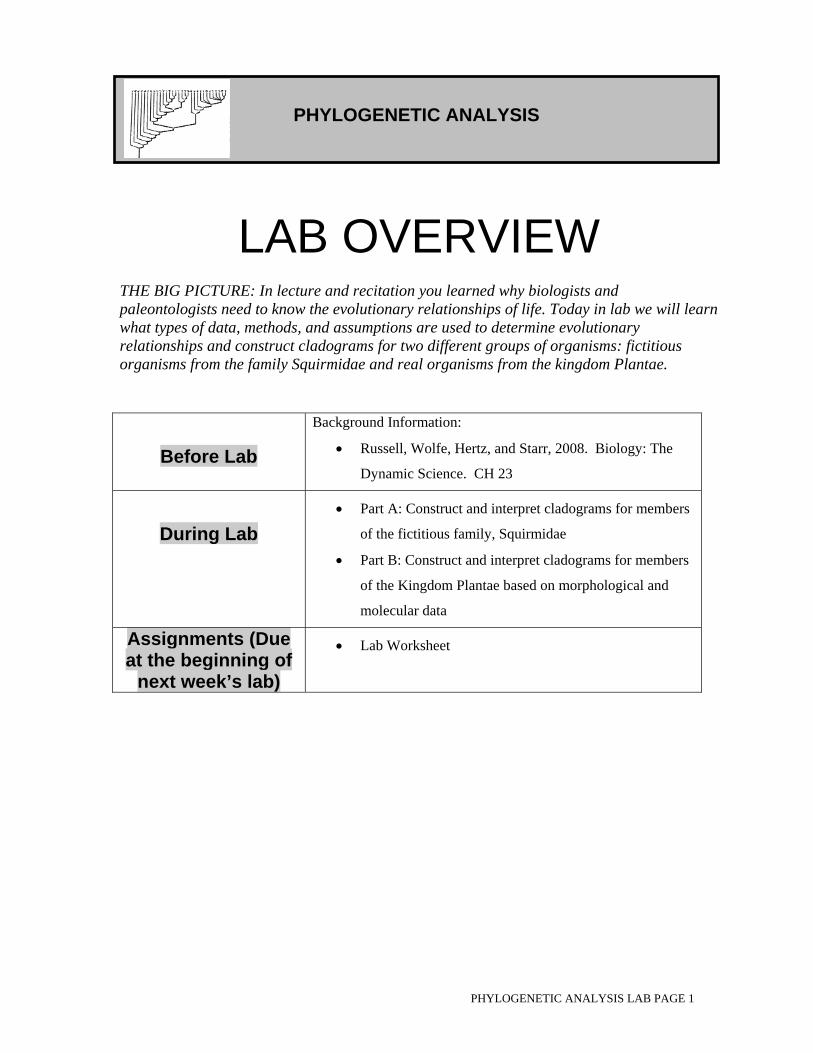
PHYLOGENETIC ANALYSIS LAB PAGE 1 LAB OVERVIEW THE BIG PICTURE: In lecture and recitation you learned why biologists and paleontologists need to know the evolutionary relationships of life. Today in lab we will learn what types of data, methods, and assumptions are used to determine evolutionary relationships and construct cladograms for two different groups of organisms: fictitious organisms from the family Squirmidae and real organisms from the kingdom Plantae. Before Lab Background Information: • Russell, Wolfe, Hertz, and Starr, 2008. Biology: The Dynamic Science. CH 23 During Lab • Part A: Construct and interpret cladograms for members of the fictitious family, Squirmidae • Part B: Construct and interpret cladograms for members of the Kingdom Plantae based on morphological and molecular data Assignments (Due at the beginning of next week’s lab) • Lab Worksheet PHYLOGENETIC ANALYSIS
Transcript of phylogentic analysis lab - Home | Barnard College week’s lab) • Lab Worksheet PHYLOGENETIC...
PHYLOGENETIC ANALYSIS LAB PAGE 1
LAB OVERVIEW THE BIG PICTURE: In lecture and recitation you learned why biologists and paleontologists need to know the evolutionary relationships of life. Today in lab we will learn what types of data, methods, and assumptions are used to determine evolutionary relationships and construct cladograms for two different groups of organisms: fictitious organisms from the family Squirmidae and real organisms from the kingdom Plantae.
Before Lab
Background Information:
• Russell, Wolfe, Hertz, and Starr, 2008. Biology: The
Dynamic Science. CH 23
During Lab
• Part A: Construct and interpret cladograms for members
of the fictitious family, Squirmidae
• Part B: Construct and interpret cladograms for members
of the Kingdom Plantae based on morphological and
molecular data
Assignments (Due at the beginning of
next week’s lab)
• Lab Worksheet
PHYLOGENETIC ANALYSIS

PHYLOGENETIC ANALYSIS LAB PAGE 2
Thought and discussion questions:
• Of what use is it to know the evolutionary relationships of living things?
• Why is cladistic analysis the preferred method for determining evolutionary relationships?
• How can cladistics be used to determine whether a character state is homologous or analogous?
• Is parsimony a methodological assumption that is unique to cladistics?
• Are certain types of data (e.g., morphological or molecular) more reliable than others for determining evolutionary relationships? How do we know this?
Learning objectives:
1. Be able to define a character and character state
2. Be able to construct a data matrix for a given group of species
3. Be able to identify the ingroup and outgroup in a cladogram
4. Be able to distinguish monophyletic, paraphyletic, and polyphyletic groups
5. Be able to calculate the tree length and consistency index of a cladogram
6. Be able to trace several characters on a cladogram using Mesquite
7. Be able to identify homologous and analogous characters on a cladogram
8. Be able to use treelength and CI to identify the most parsimonious cladogram
9. Be able to determine the best-supported phylogenetic hypothesis given a data matrix

PHYLOGENETIC ANALYSIS LAB PAGE 3
BACKGROUND
Biologists group and classify living and extinct organisms for 4 main reasons: (1) to establish a common language or reference point, (2) to develop a system for counting, storing, and organizing living things, (3) to test evolutionary hypotheses, and (4) to understand the origins of biodiversity. To classify organisms, biologists can use many different types of data such as morphological data (size, shape, length, weight, color, chemical composition, etc), developmental data (patterns of organismal growth and development), ethological data (behavioral patterns, such as mating dances in birds), ecological data (the habitats and geographic locations of organisms, such as the New Mexico desert, the Caribbean Sea, or the Ross Ice Shelf in Antarctica), or molecular data (protein differences, DNA base pair differences, regulatory gene differences, etc.). In the mid 19th century, Charles Darwin realized the evolutionary implications of the hierarchical classification system that was developed by Carolus Linnaeus in the 18th century. Although Linneaus’ classification system was based merely on similarities, Darwin realized that this type of similarity-based classification system could be thought of as a genealogy, in which organisms with shared traits also shared common ancestors. As you have seen throughout the semester, patterns of shared characteristics of organisms can be depicted in a branched line diagram. These types of diagrams are called phylogenetic trees or cladograms. Within a tree, a clade is defined as a group of species that includes an ancestral species and all its descendants. The analysis of how species are grouped into clades is referred to as cladistics. The goal of this lab is for you to understand cladistic methods. Here are the major concepts:
(1) Taxa. What biological units do we want to focus on in our study of evolutionary relationships? Species? Genera? Families? We use the word “taxa” (taxon: singular, taxa: plural) to refer to the units (e.g., species) that we are studying. How many taxa do we want to study? Does it make a difference which taxa we choose in our investigation? Ideally, it would be best to study all species. That way, our cladistic analyses would not be biased by sample size. But scientists cannot study all species, so we must choose a subset of all species for our investigations. Today we will be using very few taxa in order to make the task of constructing a phylogeny easier.
(2) Characters. A character is any observable feature (or part) of an organism. Examples include limbs (e.g., arms and legs), wings, joints, a coelom, leaves, cell type, and seeds, to name a few. Gene sequences, protein types and structures, behavioral features, and ecological attributes are also observable features of organisms and are therefore also examples of characters. Clearly, organisms hold a wealth and diversity of attributes that can be used in cladistic analyses. Characters are the data that we will use to perform our analyses.
(3) Character states. “Character state” is a term that describes the variation that we observe in our characters. For example, “Shell” may be our character, whereas “present” and “absent” may be the character states. “Leaf” may be our character, whereas “microphyll” and “megaphyll” could be possible variants of our character. “Segments” may be the character, whereas “5”, “6”, and “7” may be the character states. As you can see, character states are the conditions in which characters occur.
(4) Data matrix. Once we have delineated our characters and character states, we need to note their distribution among the taxa that we are studying. We use a chart, known as a data matrix, to display this information.

PHYLOGENETIC ANALYSIS LAB PAGE 4
(5) Outgroup and ingroup. Ingroup and outgroup are designations that are given to the taxa that we are studying. The ingroup includes the species that we want to know the evolutionary relationships of. You may think of the ingroup as the study group. In contrast, the outgroup includes one or more taxa that are not in our study group but are hypothesized to be closely related to the ingroup. Why do we need an outgroup if we want to know the evolutionary relationships of the ingroup? The outgroup serves as a reference point, or comparison point, that allows us to determine the direction, or polarity, of character evolution. Basically, the outgroup is an evolutionary “starting point.”
(6) Character polarity. Outgroups are central to the issue of character polarity (the direction of evolutionary change). Outgroups inform us of the directionality of character evolution. For example, if we study four species of mollusks (the invertebrate group that includes snails, slugs, clams, and squids) and two of the species we are studying lack a shell, and two species have a shell, we do not know whether evolution proceeded from (1) having a shell losing a shell OR (2) from not having a shell developing a shell (see diagram below). The outgroup will help us determine the directionality or polarity of evolution. If the outgroup lacks a shell (that is, the evolutionary starting point was without a shell), then it is likely that evolution proceeded from not having a shell to having a shell.
(7) Parsimony. Parsimony is a philosophical principle that states that the simplest explanation is the best explanation. This is a central philosophical principle in science; it is not unique to cladistics. In cladistic analysis, parsimony may be used methodologically to find the cladogram that minimizes the number of character-state changes for a given data matrix. Another way to think about parsimony is that it is the method that is used to construct a cladogram that is best supported by as many of the data as possible; that is, it maximizes the congruence between the character data that we have collected (Figure 1).
A
BO A B C D E O AC D E
Figure 1: Cladogram A is the most parsimonious cladogram because the arrangement of species requires only one character state change. Cladogram B is less parsimonious because the arrangement of species requires many character state changes.
Cladogram A Cladogram B
PHYLOGENETIC ANALYSIS LAB PAGE 5
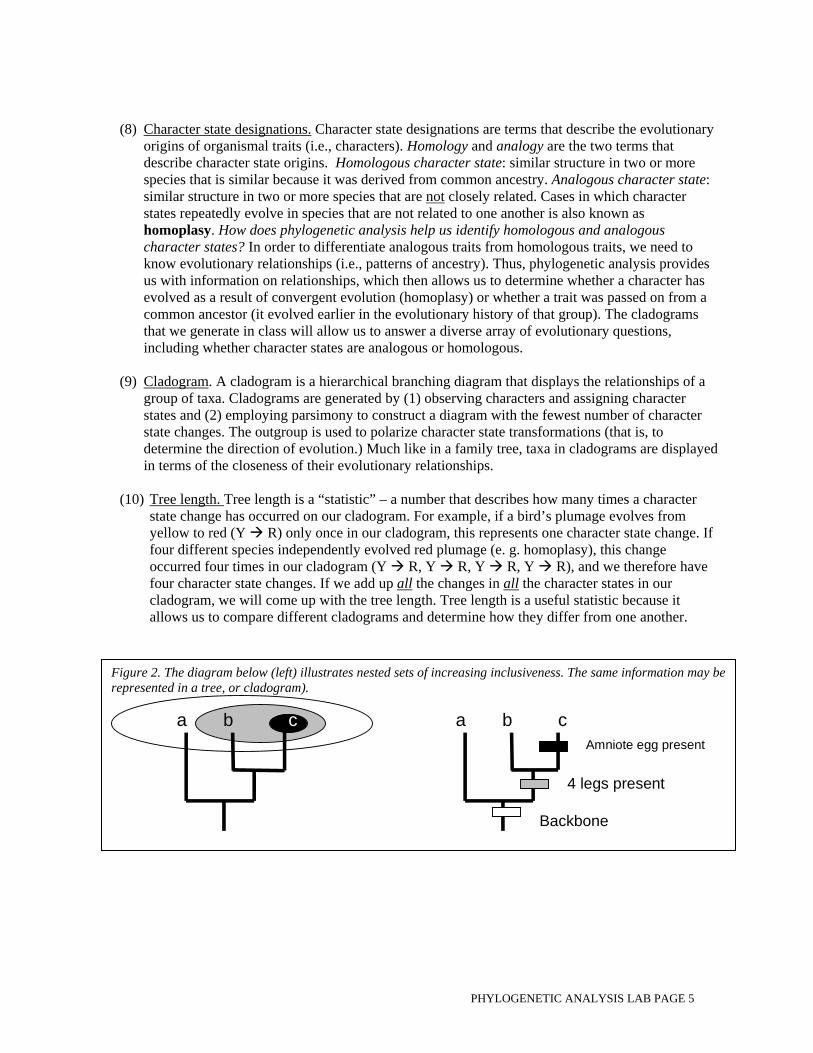
Figure 2. The diagram below (left) illustrates nested sets of increasing inclusiveness. The same information may be represented in a tree, or cladogram).
a b c a b c
Backbone
4 legs present
Amniote egg present
(8) Character state designations. Character state designations are terms that describe the evolutionary origins of organismal traits (i.e., characters). Homology and analogy are the two terms that describe character state origins. Homologous character state: similar structure in two or more species that is similar because it was derived from common ancestry. Analogous character state: similar structure in two or more species that are not closely related. Cases in which character states repeatedly evolve in species that are not related to one another is also known as homoplasy. How does phylogenetic analysis help us identify homologous and analogous character states? In order to differentiate analogous traits from homologous traits, we need to know evolutionary relationships (i.e., patterns of ancestry). Thus, phylogenetic analysis provides us with information on relationships, which then allows us to determine whether a character has evolved as a result of convergent evolution (homoplasy) or whether a trait was passed on from a common ancestor (it evolved earlier in the evolutionary history of that group). The cladograms that we generate in class will allow us to answer a diverse array of evolutionary questions, including whether character states are analogous or homologous.
(9) Cladogram. A cladogram is a hierarchical branching diagram that displays the relationships of a group of taxa. Cladograms are generated by (1) observing characters and assigning character states and (2) employing parsimony to construct a diagram with the fewest number of character state changes. The outgroup is used to polarize character state transformations (that is, to determine the direction of evolution.) Much like in a family tree, taxa in cladograms are displayed in terms of the closeness of their evolutionary relationships.
(10) Tree length. Tree length is a “statistic” – a number that describes how many times a character state change has occurred on our cladogram. For example, if a bird’s plumage evolves from yellow to red (Y R) only once in our cladogram, this represents one character state change. If four different species independently evolved red plumage (e. g. homoplasy), this change occurred four times in our cladogram (Y R, Y R, Y R, Y R), and we therefore have four character state changes. If we add up all the changes in all the character states in our cladogram, we will come up with the tree length. Tree length is a useful statistic because it allows us to compare different cladograms and determine how they differ from one another.

PHYLOGENETIC ANALYSIS LAB PAGE 6
(11) Consistency Index. Consistency Index, or CI, is a cladogram statistic similar to the tree length. The CI informs us about to the magnitude of convergent evolution or parallel evolution occurring in our cladogram. The CI is calculated using the following formula:
A cladogram that has no convergent or parallel evolution would have a CI of 1.0. In contrast, a cladogram that has a trait originating multiple times from different ancestors (i.e., homoplasy) would have a much lower CI (e.g., 0.25). How do we determine the minimum and actual number of character state changes (so that we are able to calculate the CI)? The minimum number of character state changes is (n-1) where n = the number of character states. An example may be helpful. If our character is “calcium carbonate shell” and our character states are “present” and “absent,” then the minimum number of character state changes is one (that is, shells evolved once or were lost only once). In actuality, it is possible that during the course of evolution species lost their shells multiple times. By examining our cladogram, we may discover that shells were lost four separate times in the evolutionary history of our ingroup. For our character, then, the CI is ¼, or 0.25 (1 minimum change/4 actual changes). But remember that in order to determine the CI for our entire cladogram, we need to determine this information for all of our characters and construct an average (see below).
Table 1. Hypothetical data table for a cladogram -- for calculating CI
Character Minimum number of character state changes
Actual number of character state changes on a cladogram
Character 1 1 2
Character 2 1 1
Character 3 1 2
Character 4 2 3
Character 5 1 2
TOTALS 6 10
Cladogram CI = 6/10 =0.60
(12) Types of groups. Cladistic analyses produce diagrams (cladograms) that display the
relationships of groups of taxa. It is possible to group the taxa included in a cladogram in a variety of ways. It is possible to construct three types of groups in cladistic analysis: monophyletic groups, paraphyletic groups, and polyphyletic groups. A monophyletic group (also known as a clade) is a group of taxa containing a common ancestor and all of its descendants. Biologists try to construct monophyletic groups because they want to name groups that represent the actual course of evolution, much like the way humans with the same mother and father are often grouped with the same last name. A paraphyletic group is a group containing an ancestor
CI = Minimum number of possible character state changes ___________________________________________ Actual number of character state changes

PHYLOGENETIC ANALYSIS LAB PAGE 7
and some but not all of its descendants. Basically, some descendents that evolved from a common ancestor were excluded from the group. A polyphyletic group is a group of taxa that descended from different ancestors. That is, the taxa in the group do NOT share a recent most common ancestor, as is the case in monophyletic groups. If birds and bats were grouped together (based on the presence of wings), they would be a polyphyletic group. Why are we concerned with whether our groups reflect the evolutionary history of the species we study? We want to make sure that the groups that biologists name and use (e.g., hominid; feline; vertebrate; chordate; mollusk; angiosperm; monocot; arthropod; tetrapod) are evolutionarily “real” groups. Cladistic analyses have revealed that some of the groupings that biologists have constructed contain an assemblage of species that are not related to one another (and were therefore polyphyletic groups).
TYPES OF GROUPS
O CB DA E
PARAPHYLETIC GROUP (C+D)
O CB DA E
O CB DA E
POLYPHYLETIC GROUP (A+E)
MONOPHYLETIC GROUP (C+D+E)

PHYLOGENETIC ANALYSIS LAB PAGE 8
PROCEDURE: PART A:
Construct a cladogram for the Family Squirmidae:
(1) Examine the five species of the hypothetical group named Squirmidae On the first page of the Lab Worksheet, a representative specimen is illustrated from each of five different species of the genus Squirmidae. These species have a variety of apparent morphological similarities and differences. For example, S. fossilus shares the same head morphology, tail morphology, and number of eyes with S. lustrus. These similarities and differences are data that can be used to test different evolutionary hypotheses. Observe the illustrations of these species and develop a sense of how they are similar and how they are different.
(2) Delineate characters and character states and add them to the data matrix. The distributions of morphological similarities and differences in the five species of Squirmidae are the data for this part of the lab. These data may be organized into a chart known as a data matrix (see chart on The Lab Worksheet). In order to construct a data matrix, we need to determine what features or characters are present in our sample of species. Examples of characters include head shape, body segments, eyes, tail shape, etc. The variants of these characters are known as character states. For example, in the Squirmidae, head shape (the character) may occur in two variants: triangular and polygonal. “Triangular” and “polygonal” are known as character states. The distribution of character states among species may be recorded in a data matrix in a variety of ways. For example, if a given species has a particular character state, such as a triangular tail, we could include a "+” in the data cell for that species. Alternatively, if a species lacks a trait, we could write a “-“ in that species data cell. We will follow the convention that systematists (those scientists who study the evolutionary relationships and group species) use. This system codes the distribution of features as a series of numbers. For example, rather than including “+” for the presence of a certain trait, we will use a single designated number, such as “0” or “1” or “2” etc. On the Data matrix on The Lab Worksheet, designate a number for the different character states of the provided characters.
(3) Record the distribution of character states in the five species of the Squirmidae. Data matrices contain information about which species possess these defined characters and character states. Therefore, a data matrix is a storehouse of information about a group of species. To provide information about the different Squirmidae species, complete the data matrix provided on The Lab Worksheet.
(4) Calculate the number of character state changes (steps) for each of your characters in two different hypotheses of evolutionary relationship for the Squirmidae. Then calculate the Treelength and Consistency Index for each hypothesis. On the next page, you will find an example of how to calculate the number of character state changes (or evolutionary “steps”) that occur in a given evolutionary hypothesis (keep in mind that a cladogram is a hypothesis that can be evaluated for its empirical accuracy). We will evaluate two hypotheses of evolutionary relationships for the Family Squirmidae (see Cladograms 1 and 2 on The Lab Worksheet).

PHYLOGENETIC ANALYSIS LAB PAGE 9
Evolutionary changes (steps) Character Actual Minimum Head 1 1 Tentacles 2 1 Segments 2 2 Eyes 2 1 Tail 1 1 Legs 2 2 Spotting 2 1 Totals: 12 9 Tree length = 12 steps Consistency Index (CI) = 9/12=0.75
S. f
ossi
lus
(2)
S. l
ustru
s (2
)
S. t
riang
ulus
(4)
S. p
enta
mer
us (2
)
S. c
lado
s (4
)
2 eyes
4 eyes
4eyes
ONE CHANGE
ONE CHANGE
How to calculate the number of character state changes (steps) in the character “eyes”
2 eyes
2 eyes
2 eyes
2 eyes
NO CHANGE
NO CHANGE
NO CHANGE
NO CHANGE
Based on the above cladogram, we can conclude: Minimum possible number of eye changes (steps) = 1 Actual number of eye changes (steps) on the above tree = 2

PHYLOGENETIC ANALYSIS LAB PAGE 10
(5) Determine which hypothesized cladogram (1 or 2) is best supported by the data at hand.
A. Calculate the number of evolutionary steps that took place in each character and sum
that information for each hypothesized cladogram in order to determine the Treelength and Consistency Index (CI) for each cladogram.
B. Compare Treelength and CI in our two hypothesized cladograms to determine which
cladogram is best supported by our data. The lowest treelength and the highest CI are indicative of a greater match between our data in the cladogram and its particular evolutionary arrangement of species.
C. Determine if ancillary data (such as geographic distribution or fossil data) are in agreement with the hypothesis that we concluded is best supported by our morphological data. Paleontological data. The fossil remains of living things provide a rich source of evolutionary information that may be used to test whether an evolutionary hypothesis is well supported. For example, the order of appearance of fossils in rocks may be use to infer when species evolved. Species that occur earlier in the fossil record are likely to have originated (evolved) before species that occur later in the fossil record. Therefore, species that are closely related to one another must have originated (evolved) more recently than species that are not closely related. These same general rules apply to the Squirmidae. If S. triangulus and S. lustrus are hypothesized to be the two most closely related species in the Squirmidae, then they must have evolved after the other species of Squirmidae. We can use data from the fossil record to determine if the fossil data corroborate or refute our hypothesis (i.e, cladogram). If the fossil record demonstrates that S. triangulus is the first (oldest) species of the Squirmidae to evolve, then there is an error in one of our sources of data! As you can see, ancillary data can be used to determine if our cladistic hypotheses are strongly or weakly supported. Refer to the diagram on the following page for the fossil record of the Squirmidae.
(6) Use the computer program Mesquite (Maddison and Maddison, 2006) to generate cladograms.
Mesquite is one of the programs used by systematists (those scientists that study the evolutionary relationships of species). It allows us to examine several core components of phylogenetic analysis (cladistics) and learn how scientists determine the evolutionary relationships of life on Earth. Mesquite provides a variety of tools for examining: (1) character distributions among groups of taxa (e.g., phylogenies); (2) cladogram topologies (the ordering of branches); and (3) cladogram statistics (such as treelength). For specific information on how to use Mesquite, refer to directions in lab.

PHYLOGENETIC ANALYSIS LAB PAGE 11
FOSSIL RECORD S. fossilus S. pentamerus S. triangulus S. lustrus S. clados
First appearance in fossil record
PA
LEO
ZOIC
M
ES
OZO
IC
CE
NO
ZOIC
RECENT (LIVING)
Duration in geologic tim
e

PHYLOGENETIC ANALYSIS LAB PAGE 12
PROCEDURE: PART B1: MORPHOLOGICAL CHARACTERISTICS OF MEMBERS OF THE KINDGDOM PLANTAE Now that we have learned how to construct cladograms for hypothetical organisms, the Squirmidae, we will apply our knowledge to construct a cladogram for real organisms. Today we will examine a number of organisms that are members of the Kingdom Plantae. We will observe certain morphological characteristics (characters) and use this data to make conclusions about the evolutionary relationships among these organisms. 1. Examine live samples members of the Kingdom Plantae.
Today, seven live plant specimens are available in lab for you to observe: Marchantia, Selaginella, Psilotum, Adiantum, Zea, Medicago, and Schlumbergera. Familiarize yourself with the following characters: height, arrangement of vascular tissue, presence of leaves, presence of seeds, and dominant phase of the life cycle (see The Lab Worksheet).
2. Delineate and record characters and character states and add them to the data matrix. To simplify the construction of this data matrix, we have provided you with some guidelines about how to describe each possible character state for each of the characters you will observe today in lab. Using guidelines outlined on The Lab Worksheet, fill in the data matrix in The Lab Worksheet for these members of the Kingdom Plantae.
3. Determine which hypothesized cladogram (1 or 2) is best supported by the data. For each cladogram, calculate the Treelength and Consistency Index by hand. Record your results on The Lab Worksheet.

PHYLOGENETIC ANALYSIS LAB PAGE 13
PROCEDURE PART B2: MOLECULAR CHARACTERISTICS OF MEMBERS OF THE KINDGOM PLANTAE After having observed morphological characteristics of seven different types of plants, you will now examine protein sequence in the same or related plant species to perform cladistic analysis. You can there compare the results of phylogenetic relationships obtained using protein sequences (molecular data) with the results obtained from using morphological data. The protein that you will be examining today is the ribulose 1,5-bisphosphate carboxylase large subunit, abbreviated as rbcL. The rbcL protein is an essential component of the process of photosynthesis, and thus is found in every plant species, making it an excellent choice for phylogenetic analysis.
1. To examine the similarities among the rbcL protein of different plant species, you will use a bioinformatics program, BioEdit, which can perform multiple alignments (meaning that it can align more than two sequences at the same time) using the common alignment algorithm, ClustalW. To construct an alignment of sequences, this program will determine the relationship among them (based on similarities and differences in amino acid sequence), and will then be able to cluster them on a phylogenetic tree.
2. To use the BioEdit program, double click on the “rbcL” icon located on the lab computer’s desktop. This “rbcL” file contains the rbcL protein sequences from 13 different plant species in a format that is recognizable by the BioEdit software (FAS file). When you double-click on the “rbcL” icon, the BioEdit program should open and you should see a screen like the one below:

PHYLOGENETIC ANALYSIS LAB PAGE 14
3. The species of plants are listed on the left, and the protein sequences are found next to their corresponding species. The proteins sequences in this document are listed according to the International Union of Pure and Applied Chemistry (IUPAC) single-letter amino acid designations. You are not expected to memorize these amino acid codes; however, they are listed in the table below for your information. Table 1: IUPAC single-letter amino acid designations for the 20 standard amino acids
A alanine G glycine M methionine S serine
C cysteine H histidine N asparagine T threonine
D aspartic acid I isoleucine P proline V valine
E glutamic acid K lysine Q glutamine W tryptophan
F phenylalanine L leucine R arginine Y tyrosine
4. Press “Control A” to select all sequences. The species names on the left should become highlighted. From the top pull-down “Accessory Application” menu, select “ClustalW Multiple Alignment”. In the window that appears, deselect “Bootstrap NJ Tree”. Then press “Run ClustalW” and “OK”.
5. Wait for the alignment to be performed. When the alignment is finished, you will see the alignment produced in a new BioEdit window named “Untitled”. This will look very similar to the first window you opened.
6. To determine which amino acids are identical among all species, shade the identical amino acid residues. To do this, click on the “shade identities in alignment window” box (marked with an arrow below).
7. Scroll across the highlighted sequences, observing which proteins seem to be the most similar
and which seem to be the least similar. Record your observations on The Lab Worksheet.
8. Examine the phylogenetic relationships among these 13 plant species by constructing a phylogenetic tree. To build a tree, go to the top pull-down menu and select “Accessory Application”, “Protpars protein parsimony method”. Select “Run application”, then “OK”.
9. A new window will appear with a tree (ignore the numbers that are printed on the tree). Print a copy of the tree by clicking on the “print” icon on the top of the screen. Attach this to The Lab Worksheet and answer the appropriate questions on The Lab Worksheet.

Name _____________________________ Day/Time/Instructor _____________________
PHYLOGENETIC ANALYSIS LAB WORKSHEET
Phylogenetic Analysis Lab Worksheet, page 1 of 11
Character Character state fossilus lustrus pentamerus triangulus clados Head shape
Triangular = 0 Polygonal = 1
Tentacles
Present = 0 Absent = 1
Body segments
Three = 0 Four = 1 Six = 2
Eyes
Two = 0 Four = 1
Tail shape
Legs
Segment spotting
INGROUPOUTGROUP
HEAD
TAIL
S. fossilus S. clados S. pentamerus S. triangulus S. lustrus
DATA MATRIX 1. (1 pt) Complete the data matrix below using the illustrations of species in the Squirmidae above. You will need to delineate character states for “tail shape”, “legs”, and “segment spotting.” Remember that the most ancient (i.e. the outgroup) character state is, by convention, termed “0”.

PHYLOGENETIC ANALYSIS LAB WORKSHEET
Phylogenetic Analysis Lab Worksheet, page 2 of 11
S. f
ossi
lus
S. l
ustru
s
S. p
enta
mer
us
S. t
riang
ulus
S. c
lado
s
2. (1 pt) SQUIRMIDAE CLADOGRAM ONE: Calculate the number of actual character state changes for each of the seven characters from your data matrix. Then calculate the minimum possible number of character state changes (steps). Sum each category and calculate the Consistency Index (minimum/actual)
Character Actual Minimum Head ____ ____ Tentacles ____ ____ Segments ____ ____ Eyes ____ ____ Tail ____ ____ Legs ____ ____ Spotting Totals: ____ ____ Tree length = ___ steps Consistency Index (CI) = ___/___ =

PHYLOGENETIC ANALYSIS LAB WORKSHEET
Phylogenetic Analysis Lab Worksheet, page 3 of 11
S. f
ossi
lus
S. t
riang
ulus
S. l
ustru
s
S. c
lado
s
S. p
enta
mer
us
3. (1 pt) SQUIRMIDAE CLADOGRAM TWO: Calculate the number of actual character state changes (steps) for each of the seven characters from your data matrix. Then calculate the minimum possible number of character state changes (steps). Sum each category and calculate the Consistency Index (minimum/actual).
Character Actual Minimum Head ____ ____ Tentacles ____ ____ Segments ____ ____ Eyes ____ ____ Tail ____ ____ Legs ____ ____ Spotting Totals: ____ ____ Tree length = ___ steps Consistency Index (CI) = ___/___ =

PHYLOGENETIC ANALYSIS LAB WORKSHEET
Phylogenetic Analysis Lab Worksheet, page 4 of 11
Answer the following questions in order to familiarize yourself with the fossil data for the Squirmidae and to determine if this fossil data corroborates or weakens your cladistic hypothesis. 4. (1 pt) List the Squirmidae species in order of appearance in the fossil record. Circle the species
which evolved the most RECENTLY.
MESQUITE: Use the computer program, Mesquite to answer the following questions. 5. (1 pt) Using Mesquite, determine if your hand calculations of treelength are correct. If they are
not correct, re-do your hand calculations.
Mesquite calculation Your hand calculations
Cladogram 1 Treelength _____ _____
Cladogram 2 Treelength _____ _____ 6. (1 pt) In Cladogram 2 above, is the character “spots” homologous or analogous in S. triangulus
and S. pentamerus? Explain.
7. (1 pt) Using Mesquite, adjust the branches in the Cladogram 2 above to make the character “eye” homologous in S. triangulus and S. clados. Did you have to adjust any branches? If so, did the treelength change? Explain why or why not.

PHYLOGENETIC ANALYSIS LAB WORKSHEET
Phylogenetic Analysis Lab Worksheet, page 5 of 11
8. (1 pt) Using Mesquite, construct Cladogram 1 and identify the following groups as monophyletic,
polyphyletic, or paraphyletic.
1. _________________________ S. pentamerus + S. triangulus + S. clados 2. _________________________ S. lustrus + S. pentamerus 3. _________________________ S. fossilus + S. lustrus + S. pentamerus +
S. triangulus + S. clados
9. (1 pt) Which cladogram above (Cladogram 1 or Cladogram 2) is best supported by all available
data? Explain your answer, and describe how you used the following sources of evidence to decide which cladistic hypothesis to accept. Be sure to mention each of the following sources of evidence: Treelength, Consistency Index, Parsimony, and Paleontological Data (fossil record).

PHYLOGENETIC ANALYSIS LAB WORKSHEET
Phylogenetic Analysis Lab Worksheet, page 6 of 11
PLANT CLADOGRAM 10. (1 pt) Fill in the data matrix for the following characters for the seven plants you observed in lab
today. Follow the guidelines below for assigning character states to each character in the table. Height: Use a “0” if the plant is < 1 cm, and a “1” if the plant is > 1 cm. Arrangement of Vascular Tissue. Use a 0 for no vascular tissue, a 1 for tissue arrangement in a protostele (large central bundle) a “2” for a siphonostele (large central U-shaped arrangement), a “3” for a eustele with dispersed vascular bundles and a “4” for a eustele with an outside ring of vascular bundles. There are slides of stem cross sections for each vascular plant available in lab today. Leaves: Use a “0” for no leaves, a “1” for microphylls (small single unbranched strand of vascular tissue) and a “2” for megaphylls (branched vascular systems). Seeds: Use a “0” for no seeds and a “1” for seeds. Life Cycle: Use a “0” if the gametophyte is the dominant life cycle stage and a “1” if the sporophyte is the dominant life cycle stage.
Marchantia (Outgroup)
Selaginella Adiantum Psilotum Zea Medicago Schlumbergera
Height
Vascular Tissue
Leaves
Seeds
Life Cycle
PHYLOGENETIC ANALYSIS LAB WORKSHEET
Phylogenetic Analysis Lab Worksheet, page 7 of 11
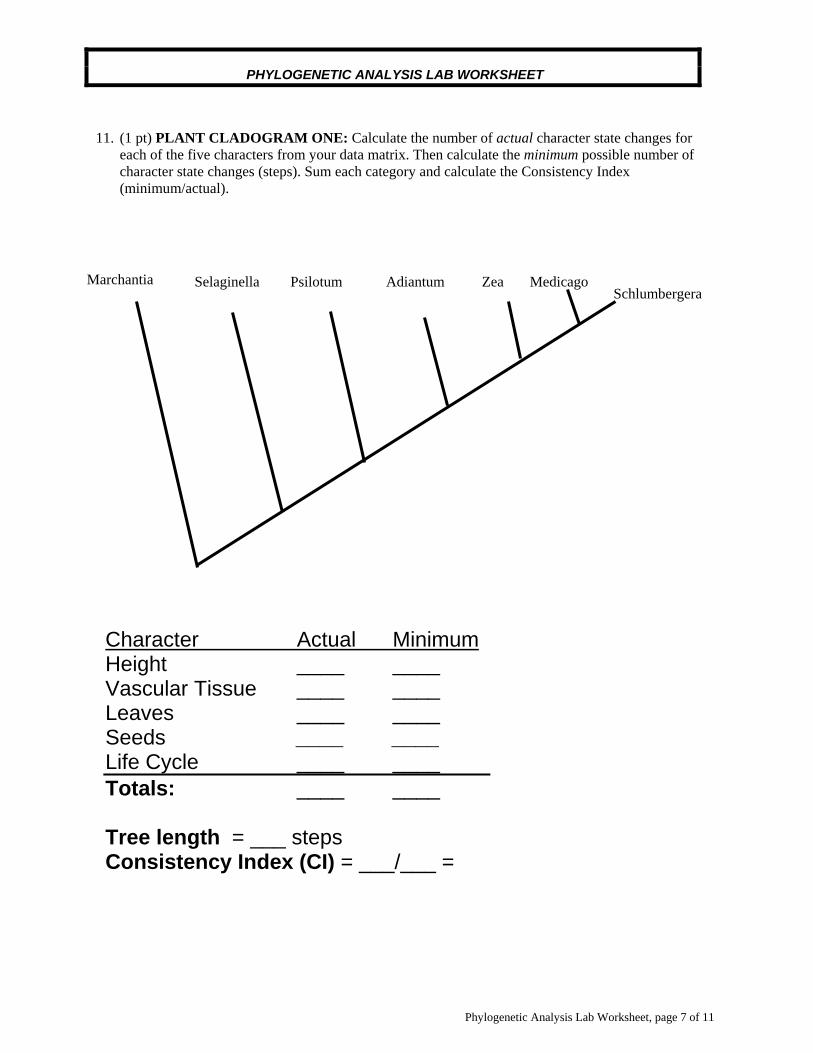
11. (1 pt) PLANT CLADOGRAM ONE: Calculate the number of actual character state changes for
each of the five characters from your data matrix. Then calculate the minimum possible number of character state changes (steps). Sum each category and calculate the Consistency Index (minimum/actual).
Character Actual Minimum Height ____ ____ Vascular Tissue ____ ____ Leaves ____ ____ Seeds ____ ____ Life Cycle ____ ____ Totals: ____ ____ Tree length = ___ steps Consistency Index (CI) = ___/___ =
Marchantia Selaginella Psilotum Adiantum Zea Medicago Schlumbergera

PHYLOGENETIC ANALYSIS LAB WORKSHEET
Phylogenetic Analysis Lab Worksheet, page 8 of 11
12. (1 pt) PLANT CLADOGRAM TWO: Calculate the number of actual character state changes
for each of the five characters from your data matrix. Then calculate the minimum possible number of character state changes (steps). Sum each category and calculate the Consistency Index (minimum/actual).
Character Actual Minimum Height ____ ____ Vascular Tissue ____ ____ Leaves ____ ____ Seeds ____ ____ Life Cycle ____ ____ Totals: ____ ____ Tree length = ___ steps Consistency Index (CI) = ___/___ =
Marchantia Schlumbergera Psilotum Selaginella
Adiantum Zea
Medicago

PHYLOGENETIC ANALYSIS LAB WORKSHEET
Phylogenetic Analysis Lab Worksheet, page 9 of 11
13. (1 pt) The table below lists each plant species that you examined in lab today and indicates its
genus, species, class, and order. For each of the seven plants, fill in the rest of the table by indicating which of the following plant clades it belongs to: (1) Bryophyte, (2) Lycophyte/Pterophyte, (3) Gymnosperm, or (4) Angiosperm.
Genus Species Order Class Clade Morphological (in lab) Analysis
(liverwort)
Marchantia polymorpha
Marchantiales Hepatopsida
(spike-moss)
Selaginella uncinata
Selaginellales Lycopodiopsida
(fern)
Adiantum capillus-veneris
Polypodiales Filicopsida
(fern)
Psilotum nudum
Psilotales Psilopsida
(corn)
Zea mays
Cyperales Liliopsida
(cactus)
Schlumbergera truncata
Caryophyllales Magnoliopsida
(alfalfa)
Medicago sativum
Fabales Magnoliopsida
14. (1 pt) Which cladogram (1 or 2) is best supported by all available data? Explain your answer.
(Hint: use the information from the table above to help you construct your argument).
15. (1 pt) Explain why Marchantia was chosen as the outgroup.
PHYLOGENETIC ANALYSIS LAB WORKSHEET
Phylogenetic Analysis Lab Worksheet, page 10 of 11
16. (1 pt) As you scroll through the different rbcL sequences in the BioEdit program (after they are highlighted to display amino acid similarity), which one species has the most amino acid differences as compared to the others? Is this the same species that “looks” the most different? Explain.
17. (1 pt) Attach the phylogenetic tree that you constructed using BioEdit. Examine the tree that was produced, looking closely at the relationship among the vascular non-seeded plants (Selaginella, Adiantum, and Psilotum). Explain if the relationships among these plants are the same or different as compared to their relationships in the tree presented in your textbook.
18. (1 pt) The cactus and Selaginella appear to have very similar spiky leaf-like structures, however they have very different evolutionary origins. Describe the differences between these two leafy structures. Use your text book for assistance if necessary.

PHYLOGENETIC ANALYSIS LAB WORKSHEET
Phylogenetic Analysis Lab Worksheet, page 11 of 11
19. (1 pt) Note that on the phylogenetic tree constructed using BioEdit, some of the plant species are
the same as those you examined in lab and some are different. One reason that you examined different species for molecular and morphological analysis was that some of the species of plants that we had available to examine during lab do not (yet) have publically-available sequence data for their rbcL protein. Use your knowledge of evolutionary relationships to fill in the table below with the plant clade for these plants: (1) Bryophyte, (2) Lycophyte/Pterophyte, (3) Gymnosperm, or (4) Angiosperm). Also fill in the table to indicate which of the plants you examined during lab is the most similar to the sequenced plant.
Genus Species Order Class Plant Clade Most similar to
which lab plant? Only Molecular (BioEdit) Analysis
(poplar)
Populus alba
Salicales Magnoliopsida
(wheat)
Triticum aestivum
Cyperales Liliopsida
(rice)
Oryza sativum
Cyperales Liliopsida
(legume)
Lotus corniculatus
Fabales Magnoliopsida
(chickweed)
Stellaria media
Caryophyllales Magnoliopsida
(soybean)
Glycine max
Fabales Magnoliopsida
20. (1 pt) Is morphological or molecular data more accurate for classifying organisms? Explain your
answer.