Phylogenetic community structure and phylogenetic turnover...
14
Phylogenetic community structure and phylogenetic turnover across space and edaphic gradients in western Amazonian tree communities Paul V. A. Fine and Steven W. Kembel P. V. A. Fine and S. W. Kembel ([email protected]), Dept of Integrative Biology, Univ. of California, Berkeley, CA 94720, USA. (Present address of SWK: Center for Ecology and Evolutionary Biology, Univ. of Oregon, Eugene, OR 97403, USA.) Ecological and evolutionary processes influence community assembly at both local and regional scales. Adding a phylogenetic dimension to studies of species turnover allows tests of the extent to which environmental gradients, geographic distance and the historical biogeography of lineages have influenced speciation and dispersal of species throughout a region. We compare measures of beta diversity, phylogenetic community structure and phylobetadiversity (phylogenetic distance among communities) in 34 plots of Amazonian trees across white-sand and clay terra firme forests in a 60 000 square kilometer area in Loreto, Peru. Dominant taxa in white-sand forests were phylogenetically clustered, consistent with environmental filtering of conserved traits. Phylobetadiversity measures found significant phylogenetic clustering between terra firme communities separated by geographic distances of B200300 km, consistent within recent local speciation at the watershed scale in the Miocene-aged clay-soil forests near the foothills of the Andes. Although both distance and habitat type yielded statistically significant effects on both species and phylogenetic turnover, the patterns we observed were more consistent with an effect of habitat specialization than dispersal limitation. Our results suggest a role for both broad-scale biogeographic and evolutionary processes, as well as habitat specialization, influencing community structure in Amazonian forests. The turnover in species composition across space results from the interaction between ecological and evolutionary processes. Dispersal limitation, environmental heterogene- ity, interspecific competition, and interactions among trophic levels can influence the spatial distribution of species at multiple spatial scales (Harms et al. 2001, Condit et al. 2002, Fine et al. 2004, Gilbert and Lechowicz 2004). However, the historical biogeography of lineages and the evolution of traits that confer habitat specialization over large time scales also play an important role in determining community composition (Chave et al. 2007, Hardy and Senterre 2007, Chave 2008). Processes such as speciation, extinction, and long-distance dispersal determine which lineages inhabit a particular region, and as such, influence community composition and turnover between commu- nities (Ricklefs and Schluter 1993, Ricklefs 2004, ter Steege et al. 2006, Emerson and Gillespie 2008, Vamosi et al. 2009). At small spatial scales, community composition is often considered to be a result of processes such as environmental filtering and competitive interactions that sort species from a larger pool (Weiher and Keddy 1999, Webb et al. 2002). This approach typically focuses on small spatial and short time scales and assumes that the pool is fixed, ignoring evolutionary processes. However, at larger scales, the diverse biogeographic history of different areas within a region and different lineages may also shape patterns of species diversity and turnover (Raven and Axelrod 1974, Harrison and Grace 2007). In addition, features of the environment may drive speciation itself (Hughes and Eastwood 2006) and may cause completely different origination histories and dynamics within regions (Forest et al. 2007). In order to test the importance of different processes driving patterns of species diversity and turnover within a region, one would ideally transplant each species into every habitat type found within a geographic region and experimentally manipulate all of the abiotic and biotic factors that influence range limits for each species in every community. At the same time, one would also want to know the age of each species, where it speciated, and the dispersal history of its populations. Given the impossibility of gathering all of these data, we can instead take a three- pronged approach to describe patterns of diversity within and among communities. First, by investigating the patterns of phylogenetic relatedness within communities we can gain a richer understanding of the processes that influence community assembly at both local and regional scales (‘‘phylogenetic community structure’’: Webb et al. 2002, Cavender-Bares et al. 2009). However, patterns of community phylogenetic structure have been found to be highly scale-dependent and analyses undertaken at different spatial, taxonomic and Ecography 34: 552565, 2011 doi: 10.1111/j.1600-0587.2010.06548.x # 2011 The Authors. Ecography # 2011 Ecography Subject Editor: Ken Kozak. Accepted 25 August 2010 Both authors contributed equally to this paper 552
Transcript of Phylogenetic community structure and phylogenetic turnover...
Phylogenetic community structure and phylogenetic turnover acrossspace and edaphic gradients in western Amazonian tree communities
Paul V. A. Fine and Steven W. Kembel
P. V. A. Fine and S. W. Kembel ([email protected]), Dept of Integrative Biology, Univ. of California, Berkeley, CA 94720, USA. (Presentaddress of SWK: Center for Ecology and Evolutionary Biology, Univ. of Oregon, Eugene, OR 97403, USA.)
Ecological and evolutionary processes influence community assembly at both local and regional scales. Adding aphylogenetic dimension to studies of species turnover allows tests of the extent to which environmental gradients,geographic distance and the historical biogeography of lineages have influenced speciation and dispersal of speciesthroughout a region. We compare measures of beta diversity, phylogenetic community structure and phylobetadiversity(phylogenetic distance among communities) in 34 plots of Amazonian trees across white-sand and clay terra firme forestsin a 60 000 square kilometer area in Loreto, Peru. Dominant taxa in white-sand forests were phylogenetically clustered,consistent with environmental filtering of conserved traits. Phylobetadiversity measures found significant phylogeneticclustering between terra firme communities separated by geographic distances of B200�300 km, consistent within recentlocal speciation at the watershed scale in the Miocene-aged clay-soil forests near the foothills of the Andes. Although bothdistance and habitat type yielded statistically significant effects on both species and phylogenetic turnover, the patterns weobserved were more consistent with an effect of habitat specialization than dispersal limitation. Our results suggest a rolefor both broad-scale biogeographic and evolutionary processes, as well as habitat specialization, influencing communitystructure in Amazonian forests.
The turnover in species composition across space resultsfrom the interaction between ecological and evolutionaryprocesses. Dispersal limitation, environmental heterogene-ity, interspecific competition, and interactions amongtrophic levels can influence the spatial distribution ofspecies at multiple spatial scales (Harms et al. 2001, Conditet al. 2002, Fine et al. 2004, Gilbert and Lechowicz 2004).However, the historical biogeography of lineages and theevolution of traits that confer habitat specialization overlarge time scales also play an important role in determiningcommunity composition (Chave et al. 2007, Hardy andSenterre 2007, Chave 2008). Processes such as speciation,extinction, and long-distance dispersal determine whichlineages inhabit a particular region, and as such, influencecommunity composition and turnover between commu-nities (Ricklefs and Schluter 1993, Ricklefs 2004, ter Steegeet al. 2006, Emerson and Gillespie 2008, Vamosi et al.2009).
At small spatial scales, community composition is oftenconsidered to be a result of processes such as environmentalfiltering and competitive interactions that sort species froma larger pool (Weiher and Keddy 1999, Webb et al. 2002).This approach typically focuses on small spatial and shorttime scales and assumes that the pool is fixed, ignoringevolutionary processes. However, at larger scales, the diversebiogeographic history of different areas within a region and
different lineages may also shape patterns of speciesdiversity and turnover (Raven and Axelrod 1974, Harrisonand Grace 2007). In addition, features of the environmentmay drive speciation itself (Hughes and Eastwood 2006)and may cause completely different origination historiesand dynamics within regions (Forest et al. 2007).
In order to test the importance of different processesdriving patterns of species diversity and turnover within aregion, one would ideally transplant each species into everyhabitat type found within a geographic region andexperimentally manipulate all of the abiotic and bioticfactors that influence range limits for each species in everycommunity. At the same time, one would also want toknow the age of each species, where it speciated, and thedispersal history of its populations. Given the impossibilityof gathering all of these data, we can instead take a three-pronged approach to describe patterns of diversity withinand among communities.
First, by investigating the patterns of phylogeneticrelatedness within communities we can gain a richerunderstanding of the processes that influence communityassembly at both local and regional scales (‘‘phylogeneticcommunity structure’’: Webb et al. 2002, Cavender-Bareset al. 2009). However, patterns of community phylogeneticstructure have been found to be highly scale-dependent andanalyses undertaken at different spatial, taxonomic and
Ecography 34: 552�565, 2011
doi: 10.1111/j.1600-0587.2010.06548.x
# 2011 The Authors. Ecography # 2011 Ecography
Subject Editor: Ken Kozak. Accepted 25 August 2010
Both authors contributed equally to this paper
552
environmental scales result in conclusions that suggestcompletely different interpretations regarding the relativeimportance of biotic interactions and environmental filter-ing in community assembly (Cavender-Bares et al. 2006,Swenson et al. 2006, Kraft et al. 2007, Vamosi et al. 2009).Second, to address these issues of spatial and environmentalscaling, the turnover in species composition amongand within habitats can be quantified, and the relativeimportance of spatial distance and environmental variablescan be examined within a Mantel test framework usingtaxonomic beta diversity (‘‘beta diversity’’: Tuomisto et al.1995, Phillips et al. 2003). Third, we can study howcommunity phylogenetic signal changes across scales,distances, and environments (‘‘phylobetadiversity’’: Grahamand Fine 2008). By adding this phylogenetic dimension tostudies of species turnover, one can test the extent to whichenvironmental gradients and historical biogeographyof lineages have influenced speciation, extinction, anddispersal of species throughout a region (Graham andFine 2008).
Tree communities associated with different soil types inthe lowland Amazon basin afford an excellent opportunityto explore how phylogenetic relatedness influencescommunity composition and species turnover across space.Amazonian forests contain the most diverse flora in theworld, and understanding the turnover between habitattypes in this biome may yield clues towards a fullerunderstanding of the mechanisms driving the origin andmaintenance of such extraordinary species diversity. In theAmazon, the most distinctive edaphic habitat is nutrient-poor white-sand forests which contain an endemic floraand fauna (Alvarez and Whitney 2003, Fine et al. 2010).The tree communities found in white-sand forests are, byAmazonian standards, of extremely low diversity, with
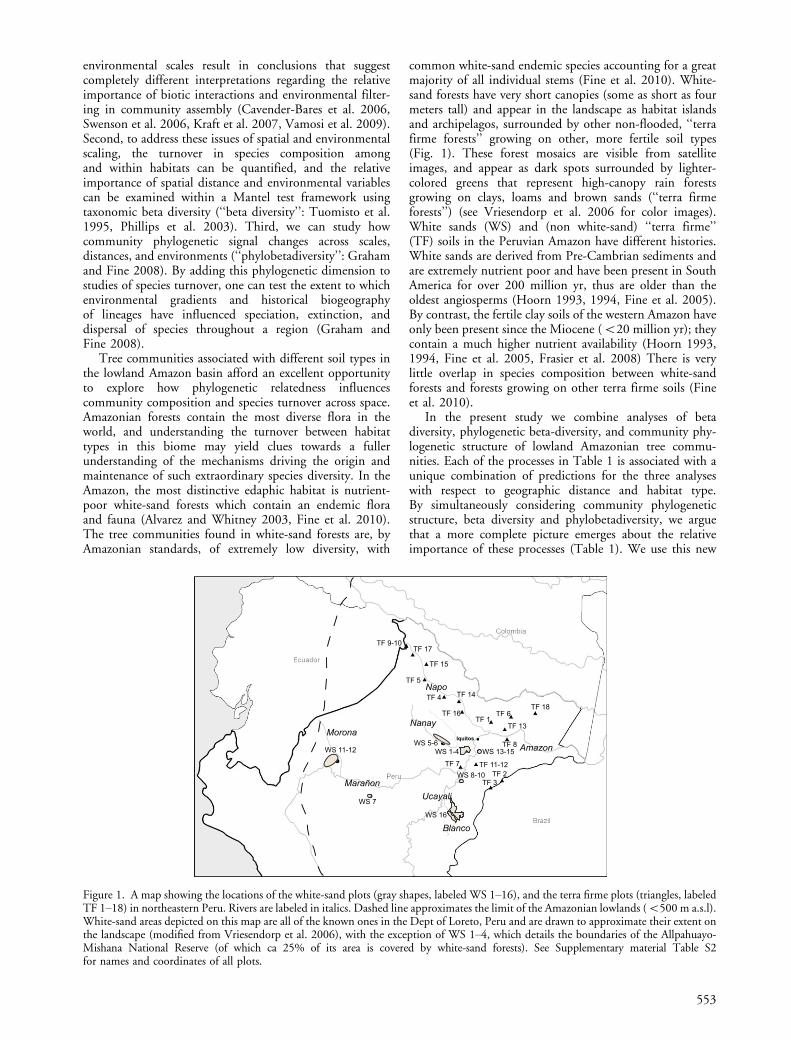
common white-sand endemic species accounting for a greatmajority of all individual stems (Fine et al. 2010). White-sand forests have very short canopies (some as short as fourmeters tall) and appear in the landscape as habitat islandsand archipelagos, surrounded by other non-flooded, ‘‘terrafirme forests’’ growing on other, more fertile soil types(Fig. 1). These forest mosaics are visible from satelliteimages, and appear as dark spots surrounded by lighter-colored greens that represent high-canopy rain forestsgrowing on clays, loams and brown sands (‘‘terra firmeforests’’) (see Vriesendorp et al. 2006 for color images).White sands (WS) and (non white-sand) ‘‘terra firme’’(TF) soils in the Peruvian Amazon have different histories.White sands are derived from Pre-Cambrian sediments andare extremely nutrient poor and have been present in SouthAmerica for over 200 million yr, thus are older than theoldest angiosperms (Hoorn 1993, 1994, Fine et al. 2005).By contrast, the fertile clay soils of the western Amazon haveonly been present since the Miocene (B20 million yr); theycontain a much higher nutrient availability (Hoorn 1993,1994, Fine et al. 2005, Frasier et al. 2008) There is verylittle overlap in species composition between white-sandforests and forests growing on other terra firme soils (Fineet al. 2010).
In the present study we combine analyses of betadiversity, phylogenetic beta-diversity, and community phy-logenetic structure of lowland Amazonian tree commu-nities. Each of the processes in Table 1 is associated with aunique combination of predictions for the three analyseswith respect to geographic distance and habitat type.By simultaneously considering community phylogeneticstructure, beta diversity and phylobetadiversity, we arguethat a more complete picture emerges about the relativeimportance of these processes (Table 1). We use this new
TF 9-10TF 17
TF 15
TF 5
TF 4 TF 14
TF 16TF 1
TF 6TF 18
TF 13
TF 8
TF 11-12TF 7
WS 5-6WS 1-4WS 11-12
WS 7
WS 16
WS 8-10 TF 2TF 3
WS 13-15
Iquitos .
Marañon
Napo
Amazon
Ucayali
NanayMorona
Blanco
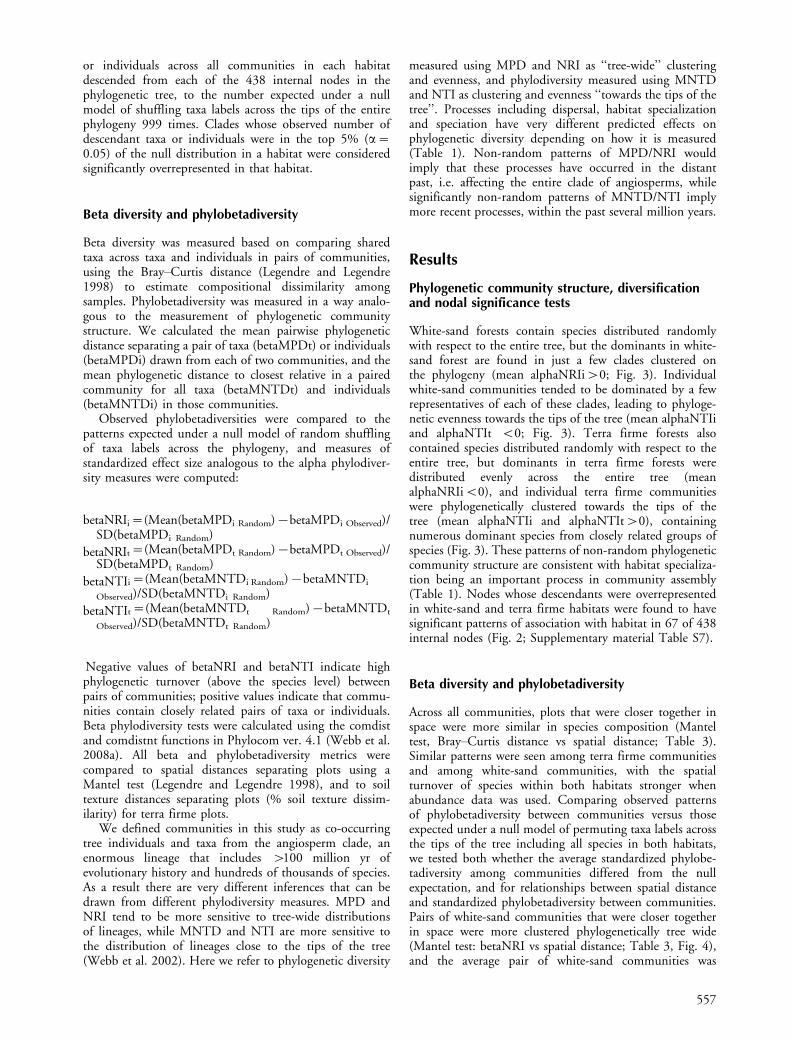
Figure 1. A map showing the locations of the white-sand plots (gray shapes, labeled WS 1�16), and the terra firme plots (triangles, labeledTF 1�18) in northeastern Peru. Rivers are labeled in italics. Dashed line approximates the limit of the Amazonian lowlands (B500 m a.s.l).White-sand areas depicted on this map are all of the known ones in the Dept of Loreto, Peru and are drawn to approximate their extent onthe landscape (modified from Vriesendorp et al. 2006), with the exception of WS 1�4, which details the boundaries of the Allpahuayo-Mishana National Reserve (of which ca 25% of its area is covered by white-sand forests). See Supplementary material Table S2for names and coordinates of all plots.
553
approach to evaluate the relative importance of dispersal,habitat specialization, and speciation in the assembly of treecommunities in white-sand and terra firme forests of thePeruvian Amazon.
Methods
Data sets and morphospecies
White-sand and terra firme forests were sampled through-out the Dept of Loreto, Peru (Fig. 1). The region receives�3000 mm of rain annually, with no distinct dry season(Marengo 1998). Nigel Pitman and colleagues provideddata for terra firme forest plots (Fig. 1; Supplementarymaterial Table S1, S2). These plots are 1 ha tree inventoriesincluding all trees �10 cm diameter at breast height (dbh)of 18 terra firme sites, and none of them sample white-sandforests. Terra firme plots contained 1820 species andmorphospecies, out of 10 867 individuals, and averaged251.7 species per plot. Soil texture analyses (% sand/clay/silt by mass) were performed for the terra firme commu-nities (Pitman et al. 2008).
Because white-sand forests are structurally so muchsmaller than terra firme forests, it was necessary to modifystandard sampling methods developed for terra firme foreststo obtain representative samples of white-sand forests. Mostinventories of terra firme rain forests in the last few decadeshave been conducted at the scale of 1 ha, with a dbh cutoffof 10 cm. This protocol allows researchers to sample allof the trees of the midcanopy and canopy and most of theunderstory tree species. In white-sand forests, trees growvery slowly yet reach reproductive size with trunks smallerthan 10 cm dbh (and in the extremely stunted forests, the
great majority of individuals will never approach 10 cmdbh); thus a smaller cutoff is necessary to sample trees inwhite-sand forests. Another discrepancy is that some white-sand patches are smaller than 1 ha. To overcome theselimitations, we sampled white-sand forests in two differentways, trying to sample comparable numbers of individualsas the terra firme plots. For ‘‘high-canopy’’ white-sandforests (canopies at approximately 10�20 m, (n�13)), 0.1ha plots were used with dbh cutoffs of 5 cm to obtain asample of ca 300 individuals per plot. Three of the white-sand plots (WS 6, 10 and 15 in Fig. 1) consisted of stuntedforest with 99% of the trees B10 m tall, with most around5 m in height. To make a representative sample in theseforests we made plots of 10�25 m (0.025 ha) andinventoried all stems �2.5 cm dbh. In total, 16 white-sand forest plots in seven geographical locations in the stateof Loreto, Peru were inventoried by P. Fine and colleagues,during 2001�2004 (Fig. 1, Supplementary materialTable S2; see also Fine et al. 2010). White-sand plotscontained 221 taxa, out of 3631 individuals, and averaged36.4 species per plot. Representatives of all speciesencountered were collected at each site, and voucherspecimens from both WS and TF plots are deposited inthe Herbario Amazonense (AMAZ) at the Univ. Nacionalde la Amazonıa Peruana in Iquitos, Peru; WS vouchers arealso deposited at the Field Museum of Natural HistoryHerbarium in Chicago, IL (F).
The difference in sampling criteria between white-sandand terra firme forests did not have a large effect on theanalyses of phylogenetic community structure or phylo-betadiversity, because both sampling schemes exhaustivelysampled adult trees in plots of each habitat type, andall samples recorded similar numbers of individuals. Thedifferences in species diversity, and dominance of common
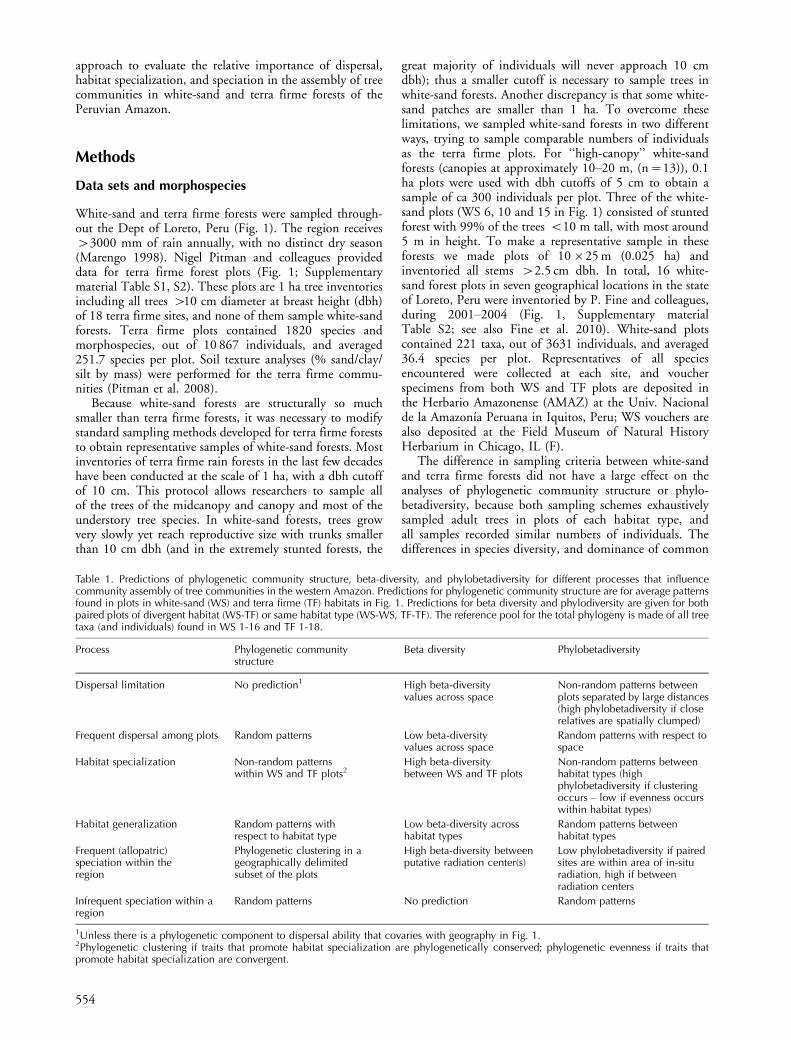
Table 1. Predictions of phylogenetic community structure, beta-diversity, and phylobetadiversity for different processes that influencecommunity assembly of tree communities in the western Amazon. Predictions for phylogenetic community structure are for average patternsfound in plots in white-sand (WS) and terra firme (TF) habitats in Fig. 1. Predictions for beta diversity and phylodiversity are given for bothpaired plots of divergent habitat (WS-TF) or same habitat type (WS-WS, TF-TF). The reference pool for the total phylogeny is made of all treetaxa (and individuals) found in WS 1-16 and TF 1-18.
Process Phylogenetic communitystructure
Beta diversity Phylobetadiversity
Dispersal limitation No prediction1 High beta-diversityvalues across space
Non-random patterns betweenplots separated by large distances(high phylobetadiversity if closerelatives are spatially clumped)
Frequent dispersal among plots Random patterns Low beta-diversityvalues across space
Random patterns with respect tospace
Habitat specialization Non-random patternswithin WS and TF plots2
High beta-diversitybetween WS and TF plots
Non-random patterns betweenhabitat types (highphylobetadiversity if clusteringoccurs � low if evenness occurswithin habitat types)
Habitat generalization Random patterns withrespect to habitat type
Low beta-diversity acrosshabitat types
Random patterns betweenhabitat types
Frequent (allopatric)speciation within theregion
Phylogenetic clustering in ageographically delimitedsubset of the plots
High beta-diversity betweenputative radiation center(s)
Low phylobetadiversity if pairedsites are within area of in-situradiation, high if betweenradiation centers
Infrequent speciation within aregion
Random patterns No prediction Random patterns
1Unless there is a phylogenetic component to dispersal ability that covaries with geography in Fig. 1.2Phylogenetic clustering if traits that promote habitat specialization are phylogenetically conserved; phylogenetic evenness if traits thatpromote habitat specialization are convergent.
554
species is a strong pattern, not an artifact introduced bysampling differences, as illustrated by the higher speciesrichness per number of individuals sampled in terra firmehabitats versus white-sand habitats (Supplementary materialFig. S1). Nevertheless, it is a fact that fewer individuals perplot were sampled in white-sand forests relative to terrafirme forests. To test for an effect of the lower number ofindividuals in white-sand forests on our results, we rarefiedthe numbers of individuals in all plots to 200 andrecalculated phylogenetic alpha and beta diversity. Rarefiedphylodiversity estimates were strongly correlated with non-rarefied estimates (Supplementary material Table S2).
Fine et al. (2010) as well as Pitman et al. (2008)compared dried specimens to mounted vouchers at AMAZ,F, the Missouri Botanical Garden (MO) and the New YorkBotanical Garden (NY). Specimens that were unable to beidentified to species were left as ‘‘morphospecies’’, but thesewere always identified to family, and often to genus(Supplementary material Table S1). These were includedin the data set with their family, genus (if known) andmorphospecies number. Unidentified morphospecies werevisually compared to other unidentified species andstandardized both within and between plots. We haveconfidence that very few (if any) of the white-sandunidentified morphospecies are in fact, named TF speciesor vice versa, because four of the authors from Pitman et al.2008 and Fine et al. (2010) have worked on the identifica-tion of both datasets.
Nevertheless, working with unidentified species doespresent problems. A complication that could artificiallyinflate taxonomic beta diversity change with distance is thefact that in the terra firme dataset, there are hundredsof unidentified morphospecies. These morphospecies aregenerally identified to the level of genus; and we have highconfidence (given the expertise of the many botanistsinvolved in these plots) that at any given site, morphos-pecies diversity very closely matches actual species diversity;yet morphospecies between sites may indeed be the samespecies but count as separate species. A phylogeneticapproach to measuring diversity is not affected by thislarge number of morphospecies that were encountered interra firme habitats because morphospecies can be ascribedto their proper genus or family within the phylogeny.
Phylogenetic hypotheses
We assembled a phylogenetic tree by grafting the 1972 taxapresent in the community dataset onto a backbonephylogenetic hypothesis using Phylomatic (Webb andDonoghue 2005). The backbone of the tree was thePhylomatic backbone tree version R20070607, basedprimarily on the APG II phylogenetic classification ofangiosperms (Angiosperm Phylogeny Group 2003).Within-family phylogenetic relationships were resolved tothe genus level by hand based on information in publishedphylogenetic trees (Supplementary material Table S4), andbranch lengths in the tree were adjusted to match clade ageestimates reported by Wikstrom et al. (2001) using theBLADJ algorithm (Webb et al. 2008a). Genera remainedpolytomies within families, and morphospecies were graftedonto the tree based on the best taxonomic information
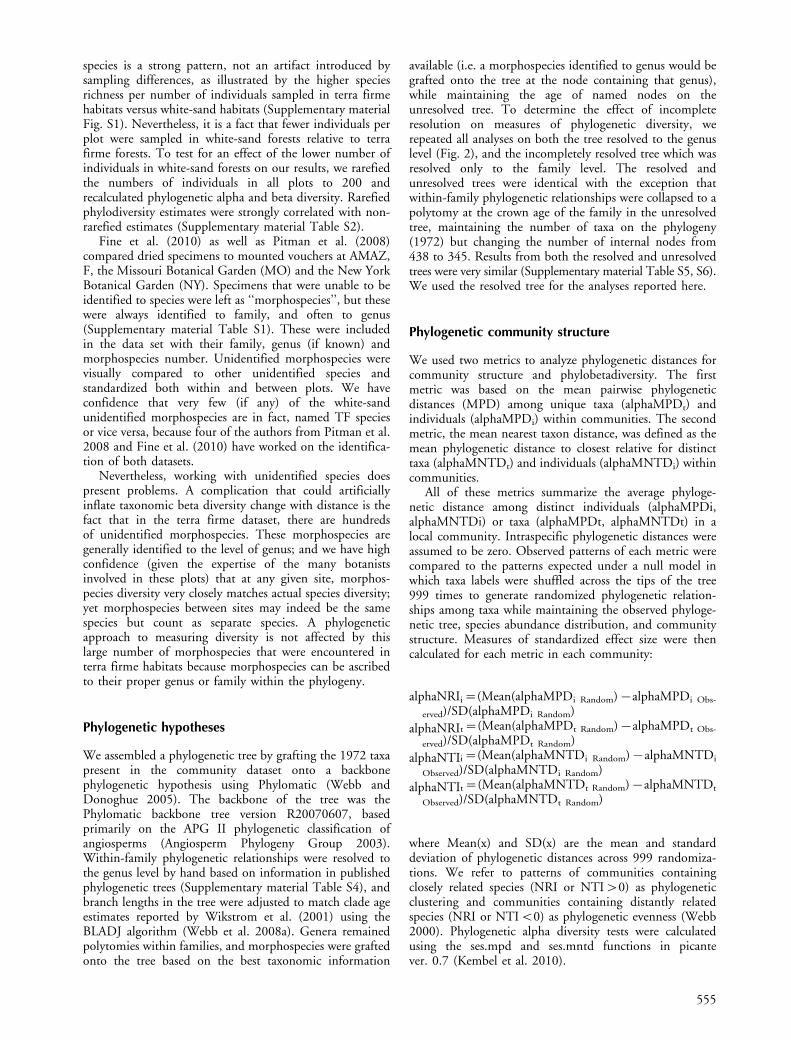
available (i.e. a morphospecies identified to genus would begrafted onto the tree at the node containing that genus),while maintaining the age of named nodes on theunresolved tree. To determine the effect of incompleteresolution on measures of phylogenetic diversity, werepeated all analyses on both the tree resolved to the genuslevel (Fig. 2), and the incompletely resolved tree which wasresolved only to the family level. The resolved andunresolved trees were identical with the exception thatwithin-family phylogenetic relationships were collapsed to apolytomy at the crown age of the family in the unresolvedtree, maintaining the number of taxa on the phylogeny(1972) but changing the number of internal nodes from438 to 345. Results from both the resolved and unresolvedtrees were very similar (Supplementary material Table S5, S6).We used the resolved tree for the analyses reported here.
Phylogenetic community structure
We used two metrics to analyze phylogenetic distances forcommunity structure and phylobetadiversity. The firstmetric was based on the mean pairwise phylogeneticdistances (MPD) among unique taxa (alphaMPDt) andindividuals (alphaMPDi) within communities. The secondmetric, the mean nearest taxon distance, was defined as themean phylogenetic distance to closest relative for distincttaxa (alphaMNTDt) and individuals (alphaMNTDi) withincommunities.
All of these metrics summarize the average phyloge-netic distance among distinct individuals (alphaMPDi,alphaMNTDi) or taxa (alphaMPDt, alphaMNTDt) in alocal community. Intraspecific phylogenetic distances wereassumed to be zero. Observed patterns of each metric werecompared to the patterns expected under a null model inwhich taxa labels were shuffled across the tips of the tree999 times to generate randomized phylogenetic relation-ships among taxa while maintaining the observed phyloge-netic tree, species abundance distribution, and communitystructure. Measures of standardized effect size were thencalculated for each metric in each community:
alphaNRIi�(Mean(alphaMPDi Random)�alphaMPDi Obs-
erved)/SD(alphaMPDi Random)
alphaNRIt�(Mean(alphaMPDt Random)�alphaMPDt Obs-
erved)/SD(alphaMPDt Random)
alphaNTIi�(Mean(alphaMNTDi Random)�alphaMNTDi
Observed)/SD(alphaMNTDi Random)
alphaNTIt�(Mean(alphaMNTDt Random)�alphaMNTDt
Observed)/SD(alphaMNTDt Random)
where Mean(x) and SD(x) are the mean and standarddeviation of phylogenetic distances across 999 randomiza-tions. We refer to patterns of communities containingclosely related species (NRI or NTI�0) as phylogeneticclustering and communities containing distantly relatedspecies (NRI or NTIB0) as phylogenetic evenness (Webb2000). Phylogenetic alpha diversity tests were calculatedusing the ses.mpd and ses.mntd functions in picantever. 0.7 (Kembel et al. 2010).
555
We argue that it is important to analyze communitystructure and phylobetadiversity focusing on phylogeneticdistances both among individuals and among taxa. Calcu-lating phylogenetic distances among individuals and alsoamong taxa in a community allows comparisons ofcommunity structure with the influence of rare species oncommunity-wide measures of diversity becoming effectivelydown-weighted by methods that measure phylogeneticrelatedness among individuals. Previous studies have largelymeasured phylogenetic community structure based on thepresence of taxa, rather than incorporating abundanceor measuring phylogenetic relatedness among individualorganisms (Vamosi et al. 2009). Including both taxon- andindividual-based analyses adds an important dimension tostudies of phylogenetic diversity, as it allows the separationof effects of ecological dominance versus composition per se
on community structure. While extremely common speciesor differences in numbers of individuals or taxa amongcommunities could, in theory, overwhelm patterns ofphylogenetic structure, we accounted for these factors bycomparing observed patterns to a null model that held thenumber of species or individuals in each communityconstant while randomizing phylogenetic relationshipsamong taxa or individuals.
Diversification and nodal significance tests
To allow a comparison of diversification patterns betweenhabitats, we identified clades in the phylogenetic tree whosedescendants were overrepresented within habitats using thenodesig function in the Phylocom software (Webb et al.2008a), which compares the total observed number of taxa
Figure 2. The resolved phylogenetic tree linking 1972 taxa in Amazonian terra firme and white-sand habitats. Edges are shaded toindicate edges descendant from nodes with more descendant taxa in terra firme (green) and white-sand (blue) habitats than expected bychance, versus a null model of 999 randomizations of taxa labels across the tips of the phylogeny including all taxa from both habitats.Shaded edges were in the top 5% of the distribution of numbers of taxa descended from each node obtained from the randomizations. SeeSupplementary material Table S7 for a complete list of the genera that were were found to have significant patterns of association withhabitat.
556
or individuals across all communities in each habitatdescended from each of the 438 internal nodes in thephylogenetic tree, to the number expected under a nullmodel of shuffling taxa labels across the tips of the entirephylogeny 999 times. Clades whose observed number ofdescendant taxa or individuals were in the top 5% (a�0.05) of the null distribution in a habitat were consideredsignificantly overrepresented in that habitat.
Beta diversity and phylobetadiversity
Beta diversity was measured based on comparing sharedtaxa across taxa and individuals in pairs of communities,using the Bray�Curtis distance (Legendre and Legendre1998) to estimate compositional dissimilarity amongsamples. Phylobetadiversity was measured in a way analo-gous to the measurement of phylogenetic communitystructure. We calculated the mean pairwise phylogeneticdistance separating a pair of taxa (betaMPDt) or individuals(betaMPDi) drawn from each of two communities, and themean phylogenetic distance to closest relative in a pairedcommunity for all taxa (betaMNTDt) and individuals(betaMNTDi) in those communities.
Observed phylobetadiversities were compared to thepatterns expected under a null model of random shufflingof taxa labels across the phylogeny, and measures ofstandardized effect size analogous to the alpha phylodiver-sity measures were computed:
betaNRIi�(Mean(betaMPDi Random)�betaMPDi Observed)/SD(betaMPDi Random)
betaNRIt�(Mean(betaMPDt Random)�betaMPDt Observed)/SD(betaMPDt Random)
betaNTIi�(Mean(betaMNTDi Random)�betaMNTDi
Observed)/SD(betaMNTDi Random)
betaNTIt�(Mean(betaMNTDt Random)�betaMNTDt
Observed)/SD(betaMNTDt Random)
Negative values of betaNRI and betaNTI indicate highphylogenetic turnover (above the species level) betweenpairs of communities; positive values indicate that commu-nities contain closely related pairs of taxa or individuals.Beta phylodiversity tests were calculated using the comdistand comdistnt functions in Phylocom ver. 4.1 (Webb et al.2008a). All beta and phylobetadiversity metrics werecompared to spatial distances separating plots using aMantel test (Legendre and Legendre 1998), and to soiltexture distances separating plots (% soil texture dissim-ilarity) for terra firme plots.
We defined communities in this study as co-occurringtree individuals and taxa from the angiosperm clade, anenormous lineage that includes �100 million yr ofevolutionary history and hundreds of thousands of species.As a result there are very different inferences that can bedrawn from different phylodiversity measures. MPD andNRI tend to be more sensitive to tree-wide distributionsof lineages, while MNTD and NTI are more sensitive tothe distribution of lineages close to the tips of the tree(Webb et al. 2002). Here we refer to phylogenetic diversity
measured using MPD and NRI as ‘‘tree-wide’’ clusteringand evenness, and phylodiversity measured using MNTDand NTI as clustering and evenness ‘‘towards the tips of thetree’’. Processes including dispersal, habitat specializationand speciation have very different predicted effects onphylogenetic diversity depending on how it is measured(Table 1). Non-random patterns of MPD/NRI wouldimply that these processes have occurred in the distantpast, i.e. affecting the entire clade of angiosperms, whilesignificantly non-random patterns of MNTD/NTI implymore recent processes, within the past several million years.
Results
Phylogenetic community structure, diversificationand nodal significance tests
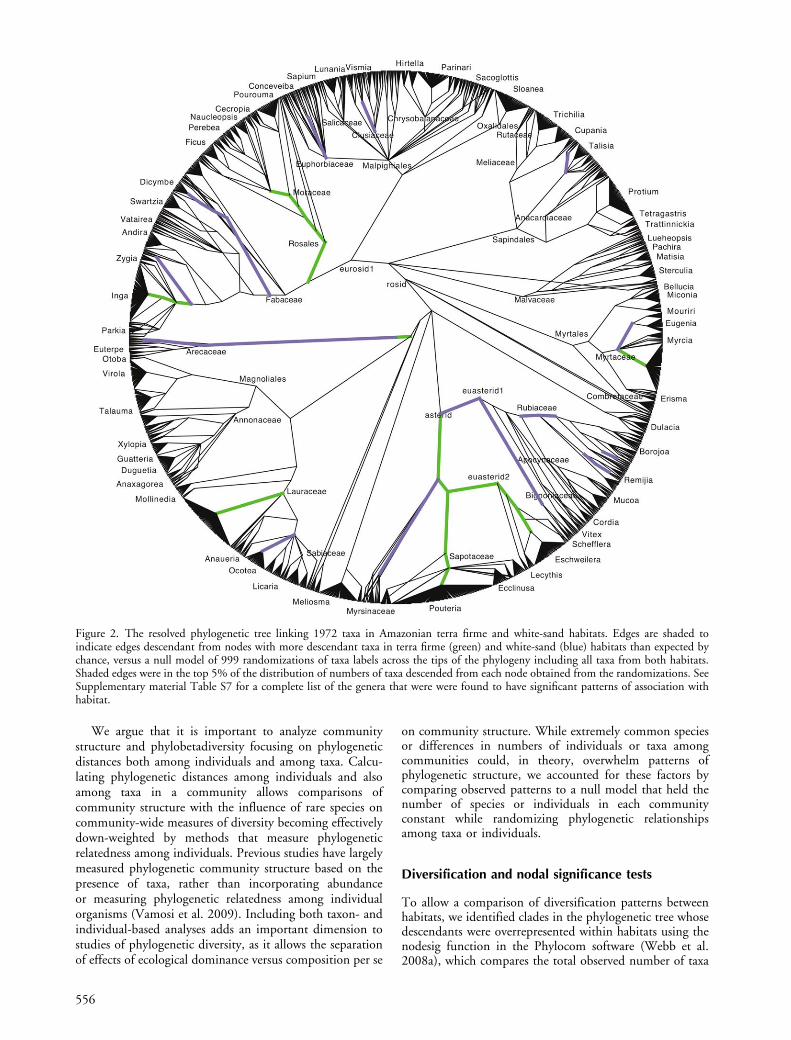
White-sand forests contain species distributed randomlywith respect to the entire tree, but the dominants in white-sand forest are found in just a few clades clustered onthe phylogeny (mean alphaNRIi�0; Fig. 3). Individualwhite-sand communities tended to be dominated by a fewrepresentatives of each of these clades, leading to phyloge-netic evenness towards the tips of the tree (mean alphaNTIiand alphaNTIt B0; Fig. 3). Terra firme forests alsocontained species distributed randomly with respect to theentire tree, but dominants in terra firme forests weredistributed evenly across the entire tree (meanalphaNRIiB0), and individual terra firme communitieswere phylogenetically clustered towards the tips of thetree (mean alphaNTIi and alphaNTIt�0), containingnumerous dominant species from closely related groups ofspecies (Fig. 3). These patterns of non-random phylogeneticcommunity structure are consistent with habitat specializa-tion being an important process in community assembly(Table 1). Nodes whose descendants were overrepresentedin white-sand and terra firme habitats were found to havesignificant patterns of association with habitat in 67 of 438internal nodes (Fig. 2; Supplementary material Table S7).
Beta diversity and phylobetadiversity
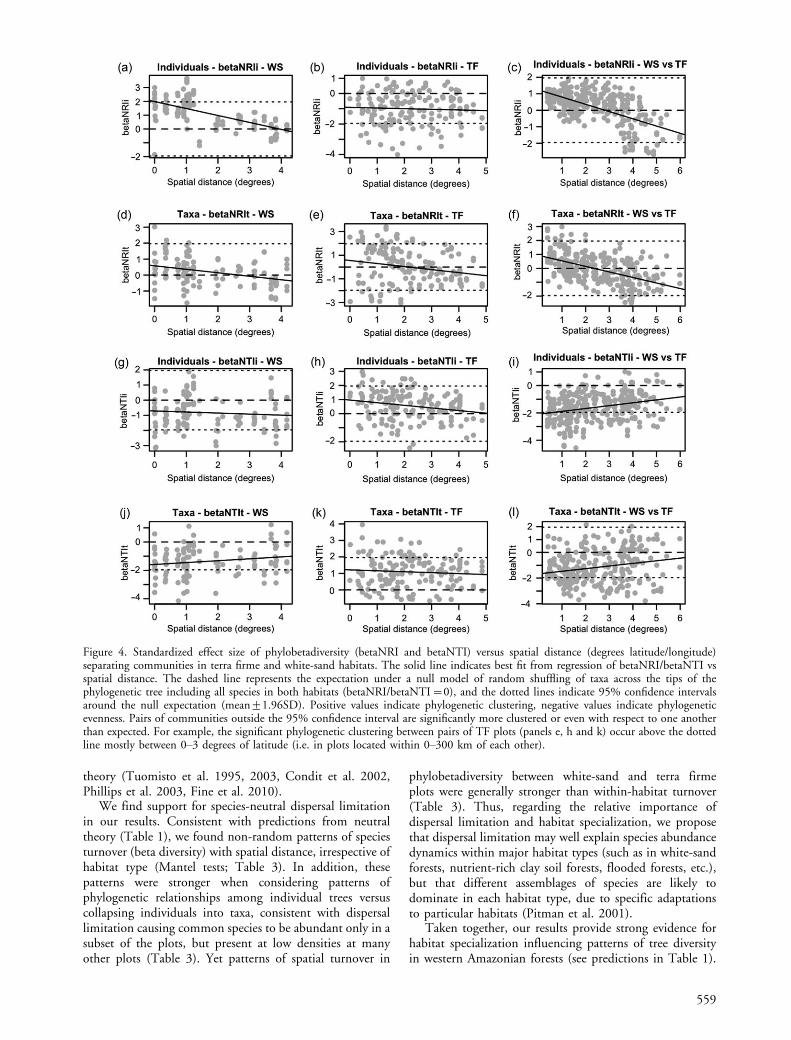
Across all communities, plots that were closer together inspace were more similar in species composition (Manteltest, Bray�Curtis distance vs spatial distance; Table 3).Similar patterns were seen among terra firme communitiesand among white-sand communities, with the spatialturnover of species within both habitats stronger whenabundance data was used. Comparing observed patternsof phylobetadiversity between communities versus thoseexpected under a null model of permuting taxa labels acrossthe tips of the tree including all species in both habitats,we tested both whether the average standardized phylobe-tadiversity among communities differed from the nullexpectation, and for relationships between spatial distanceand standardized phylobetadiversity between communities.Pairs of white-sand communities that were closer togetherin space were more clustered phylogenetically tree wide(Mantel test: betaNRI vs spatial distance; Table 3, Fig. 4),and the average pair of white-sand communities was
557
phylogenetically clustered tree wide and phylogeneticallyeven towards the tips of the tree.
Taxa in pairs of terra firme forests closer together inspace were more phylogenetically clustered tree wide thanexpected (Mantel test; betaNRIt vs spatial distance; Table 3)and dominants were more clustered towards the tips(Mantel test; betaNTIi vs spatial distance; Table 3).The average pair of terra firme communities were phylo-genetically clustered towards the tips (mean betaNTIi andbetaNTIt�0; Table 2) and dominants in the average pairof terra firme communities were phylogenetically even treewide (mean betaNRIiB0; Fig. 4). The significantlyclustered pairs of communities were largely separatedby geographic distances of B200�300 km (Fig. 4), andgenerally on the same side of the Amazon River (Fig. 5).Among terra firme communities (for which soil texture datawere available), soil texture distances among communitieswere correlated with beta diversity and betaMNTD,indicating that terra firme communities with similar soiltexture contained taxa that were phylogenetically clusteredtowards the tips of the tree (Table 3). Pairs of white-sandand terra firme communities that were closer together inspace were phylogenetically clustered tree wide (betaNRI)and phylogenetically even towards the tips (betaNTI)(Fig. 4, 5). Species and individuals in the average pair ofcommunities from contrasting habitats (WS vs TF) werephylogenetically even relative to the null expectation by allmeasures except betaNRIt (Table 2, Fig. 5).
Discussion
What is the relative importance of dispersallimitation and habitat specialization and howdo they interact to influence ecological sortingand community phylogenetic structure?
Dispersal limitation and habitat specialization are twofactors that are thought to most influence species abun-dances and distribution in tropical forests (Phillips et al.2003, Chave 2008). While both are likely to be occurringsimultaneously, these two factors are often presented ascompeting explanations because of the assumptions ofneutral theory. According to neutral theory, species arefunctionally equivalent. Thus habitat specialization to soiltype (as well as to any other habitat type) should notbe occurring and influencing species distributions; instead,the pattern of aggregated groups of conspecifics is thoughtto result simply from dispersal limitation alone, given thatmost seeds of a mother plant will be dispersed to nearbysites (Hubbell 2001). At small scales, such as within 50 ha,this theory has been surprisingly effective in predictingspecies abundances (Harms et al. 2001, Hubbell, 2001,2008). However, it is difficult to gauge the importance ofdispersal limitation at scales� 50 ha, because other theories(including niche theory) predict that variables such as soilheterogeneity also predict aggregation of conspecifics, andmost studies have not disentangled geographic distance andenvironmental heterogeneity to adequately test neutral
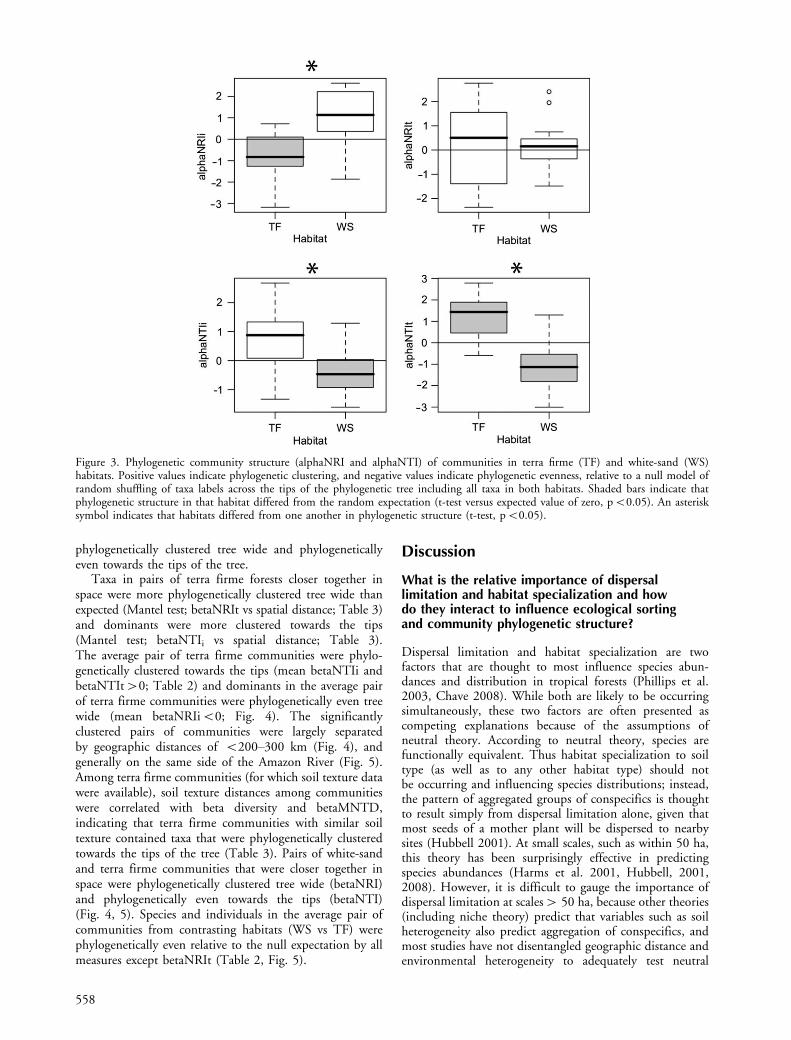
Figure 3. Phylogenetic community structure (alphaNRI and alphaNTI) of communities in terra firme (TF) and white-sand (WS)habitats. Positive values indicate phylogenetic clustering, and negative values indicate phylogenetic evenness, relative to a null model ofrandom shuffling of taxa labels across the tips of the phylogenetic tree including all taxa in both habitats. Shaded bars indicate thatphylogenetic structure in that habitat differed from the random expectation (t-test versus expected value of zero, pB0.05). An asterisksymbol indicates that habitats differed from one another in phylogenetic structure (t-test, pB0.05).
558
theory (Tuomisto et al. 1995, 2003, Condit et al. 2002,Phillips et al. 2003, Fine et al. 2010).
We find support for species-neutral dispersal limitationin our results. Consistent with predictions from neutraltheory (Table 1), we found non-random patterns of speciesturnover (beta diversity) with spatial distance, irrespective ofhabitat type (Mantel tests; Table 3). In addition, thesepatterns were stronger when considering patterns ofphylogenetic relationships among individual trees versuscollapsing individuals into taxa, consistent with dispersallimitation causing common species to be abundant only in asubset of the plots, but present at low densities at manyother plots (Table 3). Yet patterns of spatial turnover in
phylobetadiversity between white-sand and terra firmeplots were generally stronger than within-habitat turnover(Table 3). Thus, regarding the relative importance ofdispersal limitation and habitat specialization, we proposethat dispersal limitation may well explain species abundancedynamics within major habitat types (such as in white-sandforests, nutrient-rich clay soil forests, flooded forests, etc.),but that different assemblages of species are likely todominate in each habitat type, due to specific adaptationsto particular habitats (Pitman et al. 2001).
Taken together, our results provide strong evidence forhabitat specialization influencing patterns of tree diversityin western Amazonian forests (see predictions in Table 1).
Figure 4. Standardized effect size of phylobetadiversity (betaNRI and betaNTI) versus spatial distance (degrees latitude/longitude)separating communities in terra firme and white-sand habitats. The solid line indicates best fit from regression of betaNRI/betaNTI vsspatial distance. The dashed line represents the expectation under a null model of random shuffling of taxa across the tips of thephylogenetic tree including all species in both habitats (betaNRI/betaNTI�0), and the dotted lines indicate 95% confidence intervalsaround the null expectation (mean91.96SD). Positive values indicate phylogenetic clustering, negative values indicate phylogeneticevenness. Pairs of communities outside the 95% confidence interval are significantly more clustered or even with respect to one anotherthan expected. For example, the significant phylogenetic clustering between pairs of TF plots (panels e, h and k) occur above the dottedline mostly between 0�3 degrees of latitude (i.e. in plots located within 0�300 km of each other).
559
Besides the taxonomic and phylogenetic turnover betweenwhite-sand and terra firme plots, we found non-randompatterns of phylogenetic community structure in white-sandand terra firme forests (Fig. 3; Table 2). Habitat specializa-tion and environmental filtering lead to phylogeneticclustering when traits that provide advantages in a particularenvironment are phylogenetically conserved (Table 1).For example, the significant phylogenetic clustering ofindividuals in white-sand forests (alphaNRIi�0; Fig. 3)could result from environmental filtering of lineages thatpossess traits that lead to dominance in white-sand habitatssuch as ectomycorrhizal associations (Singer and Araujo1979, Smith and Read 1997) or other specialized adapta-tions to counter the extreme nitrogen stress of white-sandforests (Medina and Cuevas 1989, Coomes 1997, Coomesand Grubb 1998).
Alternatively, if traits that promote habitat specializationevolve convergently, one would expect environmentalfiltering to cause phylogenetic evenness. For example,white-sand communities exhibited significantly non-random patterns of phylogenetic evenness toward the tips(NTIi and NTIt, Fig. 3). Any number of traits that providean advantage in white-sand forests that are also phylogen-etically convergent could interact with environmentalfiltering to produce these patterns (Table 1). For example,white-sand plants have low foliar N, long-lived leaves, andslow growth rates. Plant species from throughout theangiosperm phylogeny have independently evolved long-lived and short-lived leaves with higher and lower N (Reichet al. 1997, Wright et al. 2004); thus convergent evolutionof leaf traits may be interacting with environmental filteringto produce phylogenetic evenness towards the tips in white-sand communities (Fig. 3). Furthermore, because nutrientsare so limiting in white-sand forests, it is more difficult forplants to replace tissues that are lost to herbivores andpathogens, thus driving selection for greater investment inplant defenses (Janzen 1974, Fine et al. 2006). Species thatare endemic to white-sand forest were found to havesignificantly higher defense allocation than their congenersthat inhabit terra firme forests, providing strong evidence
that total defense investment is a convergent trait for the sixtree genera included in the study (Fine et al. 2006).
The non-random phylogenetic community structurepatterns we find in our data suggest a role for niche-basedcommunity assembly in these forests (Table 1), and webelieve that the white-sand�terra firme mosaic found in thewestern Amazon is an ideal study system to pursueexperimental studies about the ecological processes thatinfluence community assembly. However, trait data are notyet available for the thousands of taxa living in these forests.Processes including competition and attack by naturalenemies are likely to be important in tropical treecommunities, and are best studied by experimental manip-ulation (Fine et al. 2006, Gilbert and Webb 2007) and atscales smaller than the plot network considered here(Cavender-Bares et al. 2009). Thus, many of the patternswe observed will require trait data and experimentalmanipulations in order to distinguish among the differenceprocesses that structure these forests (Table 1), and to fullyunderstand the evolution of traits and habitat associations(Fine et al. 2005, Agrawal and Fishbein 2006) andrelationships between trait, phylogenetic, and taxonomicdiversity along environmental gradients (Kraft et al. 2008,Kraft and Ackerly 2010).
Regional and biogeographic influenceson phylodiversity: speciation, dispersal andecological sorting at large scales
White-sand and terra firme forests of the western Amazonhave very different biogeographic histories. Even though theforests are immediately adjacent to each other today, thenutrient-rich clays are Cretaceous sediments that were laiddown in the Miocene at the earliest (B20 million yr old;Hoorn 1993, 1994). By contrast, there is ample evidencethat similar edaphic environments to current white-sandforests were widespread throughout South America longbefore Andean uplift, including the northwestern cornerwhich is now called the ‘‘western Amazon’’, and probablypredate the angiosperms (Kubitzki 1990, Struwe et al.1997, Frasier et al. 2008). How might the variation in ageof the habitats influence phylogenetic patterns of commu-nity structure in white-sand and clay forests? If there werephylogenetically conserved traits that caused differentialcolonization of habitat types throughout millions of years,we would expect to find non-random patterns in white-sandor terra firme forests tree-wide (Table 1). This was notthe case, as we find little evidence for significant patterns oftree-wide phylogenetic clustering of taxa (NRIt) in eitherwhite-sand or terra firme forests (Fig. 3). Clusteringpatterns tree-wide at large scales are argued to result fromin-situ radiations within regions or continents (Table 1;Hardy and Senterre 2007, Webb et al. 2008b). The absenceof this pattern suggests dispersal and mixing of angiospermlineages throughout time within our study region dueto frequent connections between rainforest areas ondifferent continents in the last 55 million yr (Davis et al.2002, Weeks et al. 2005) and the prevalence of long-distance dispersal (Lavin et al. 2004, Pennington and Dick2004). For rainforests, perhaps the NRI of community
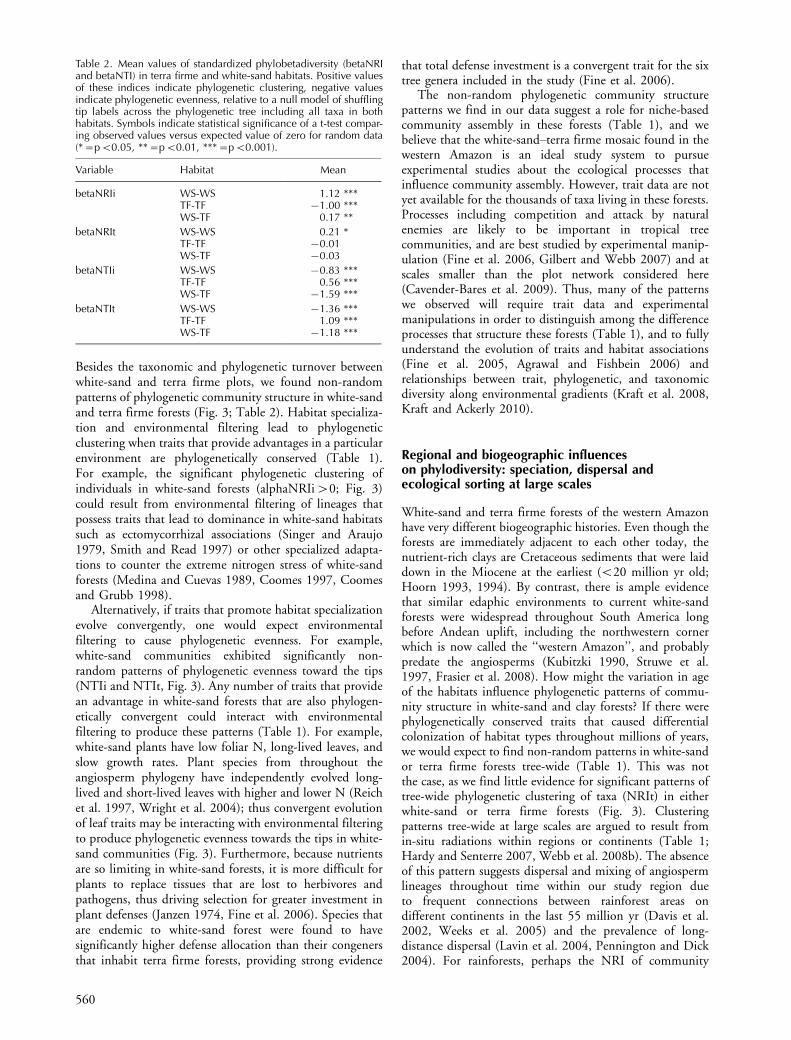
Table 2. Mean values of standardized phylobetadiversity (betaNRIand betaNTI) in terra firme and white-sand habitats. Positive valuesof these indices indicate phylogenetic clustering, negative valuesindicate phylogenetic evenness, relative to a null model of shufflingtip labels across the phylogenetic tree including all taxa in bothhabitats. Symbols indicate statistical significance of a t-test compar-ing observed values versus expected value of zero for random data(*�pB0.05, **�pB0.01, ***�pB0.001).
Variable Habitat Mean
betaNRIi WS-WS 1.12 ***TF-TF �1.00 ***WS-TF 0.17 **
betaNRIt WS-WS 0.21 *TF-TF �0.01WS-TF �0.03
betaNTIi WS-WS �0.83 ***TF-TF 0.56 ***WS-TF �1.59 ***
betaNTIt WS-WS �1.36 ***TF-TF 1.09 ***WS-TF �1.18 ***
560
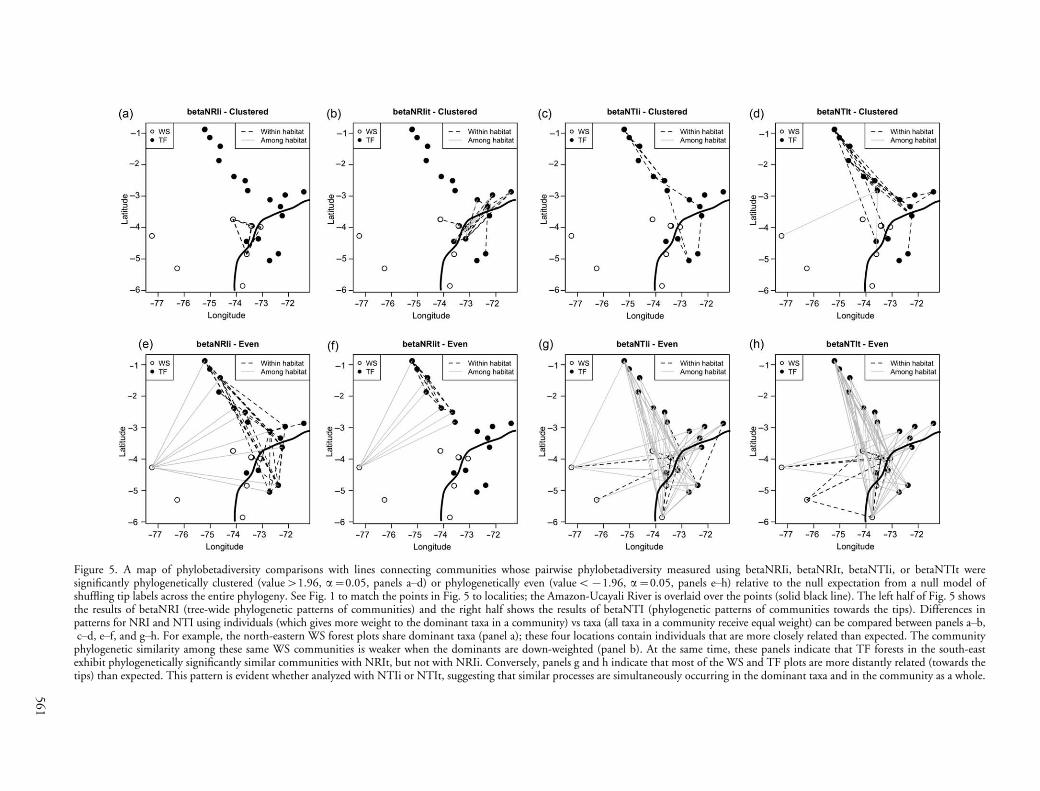
Figure 5. A map of phylobetadiversity comparisons with lines connecting communities whose pairwise phylobetadiversity measured using betaNRIi, betaNRIt, betaNTIi, or betaNTIt weresignificantly phylogenetically clustered (value�1.96, a�0.05, panels a�d) or phylogenetically even (valueB�1.96, a�0.05, panels e�h) relative to the null expectation from a null model ofshuffling tip labels across the entire phylogeny. See Fig. 1 to match the points in Fig. 5 to localities; the Amazon-Ucayali River is overlaid over the points (solid black line). The left half of Fig. 5 showsthe results of betaNRI (tree-wide phylogenetic patterns of communities) and the right half shows the results of betaNTI (phylogenetic patterns of communities towards the tips). Differences inpatterns for NRI and NTI using individuals (which gives more weight to the dominant taxa in a community) vs taxa (all taxa in a community receive equal weight) can be compared between panels a�b,c�d, e�f, and g�h. For example, the north-eastern WS forest plots share dominant taxa (panel a); these four locations contain individuals that are more closely related than expected. The community
phylogenetic similarity among these same WS communities is weaker when the dominants are down-weighted (panel b). At the same time, these panels indicate that TF forests in the south-eastexhibit phylogenetically significantly similar communities with NRIt, but not with NRIi. Conversely, panels g and h indicate that most of the WS and TF plots are more distantly related (towards thetips) than expected. This pattern is evident whether analyzed with NTIi or NTIt, suggesting that similar processes are simultaneously occurring in the dominant taxa and in the community as a whole.
56
1
phylogenetic samples will always yield random patterns atlarge spatial scales (Webb et al. 2008b).
The fact that white-sand and terra firme soils of thenorthwestern Amazon have such different histories suggeststhat patterns towards the tips (NTI) of communityphylogeny samples or phylobetadiversity may tell us moreabout events that have occurred more recently. Differentclades toward the tips of the phylogeny dominate differentgeographic areas within the terra firme forest habitat withinour study region. For terra firme forests, communitiesseparated by B2�3 degrees latitude/longitude (�200�300 km) showed the strongest patterns of phylobetadiversityclustering (Fig. 4, 5). Several processes could explain thispattern.
First, there may be some kind of ecological sorting acrossthe terra firme plots related to edaphic properties. Within-habitat phylobetadiversity in terra firme forests was sig-nificantly correlated with soil texture and the spatialdistance separating communities (Table 3). Phillips et al.(2003) compared tree composition in Holocene andPleistocene soil deposits in southern Peru, and found resultsvery similar to the ones we report: subtle, though consistentrelationships of tree species being associated with one of twosoil types (and similar to the terra firme plots in our study,their plots differed in percent clay and percent sand).Pitman et al. (2008) also report a sharp discontinuity inspecies composition between terra firme plots near thePeru-Ecuador border, corresponding to a shift in soiltexture.
A second possibility is that the forests in this region arestill recovering, or have recently (in tree generations)recovered from some sort of ancient, catastrophic distur-bance. This could include climatological, geological andhuman-influenced events, for example upheaval from riverschanging course, volcanic eruptions, fires, or floodingevents caused by failures of natural dams (Pitman et al.2005, 2008, Frasier et al. 2008). Pitman et al. (2005)documented a low diversity forest north of our study areathat likely was still showing the effects from a catastrophic
flooding event that happened over 500 yr ago. If differentplots have recovered from such disturbances at differentrates, there may be lineages of plants that successfullycompete more strongly in different successional sequences,and that may influence the pattern of phylogeneticclustering towards the tips between different plots.
A third possibility is that the spatial and/or habitatheterogeneity within the terra firme forests in the westernAmazon has promoted recent speciation. Gentry (1986)wrote about ‘‘explosive’’ speciation that may have resultedfrom isolated populations in the Andean cloud-forestsresponding to local selective pressures. Similarly, duringthe Pleistocene and/or Pliocene, climate change may havecaused forests to become fragmented near the foothills ofthe Andes (Haffer 1969, Haffer and Prance 2001), resultingin speciation that could have a distinct spatial signature inmany areas, especially if climate change caused the forestto become fragmented into dozens of small, isolated forestpatches throughout the western Amazon. This refuge theoryremains controversial, and many paleoecologists do notagree that the evidence supports a western Amazonian forestlandscape that was divided up into many small refuges(Colinvaux and De Oliveira 2001; see review in Frasieret al. 2008). Nevertheless, the phylogenetic clustering ofterra firme forests towards the tips of the tree (Table 2) andthe large number of (presumably) recently differentiatedtaxa in those forests both suggest the recent origin of manylineages in the terra firme forests, and an increaseddiversification rate in terra firme forests relative to white-sand forests since the Miocene, ca 10�20 million yr ago(Antonelli et al. 2009). A majority of the phylogeneticallyclustered terra firme communities are spatially closetogether and on the same side of the Amazon River (Fig.5), thought to be an important biogeographic barrier forother Amazonian taxa (i.e. birds, Capparella 1992, Hayesand Sewlal 2004). Thus, riverine barriers and other factorsthat cause dispersal limitation may slow recently evolvedtree species from expanding their ranges to encompass all ofthe sites in our study area, even after substantial time.
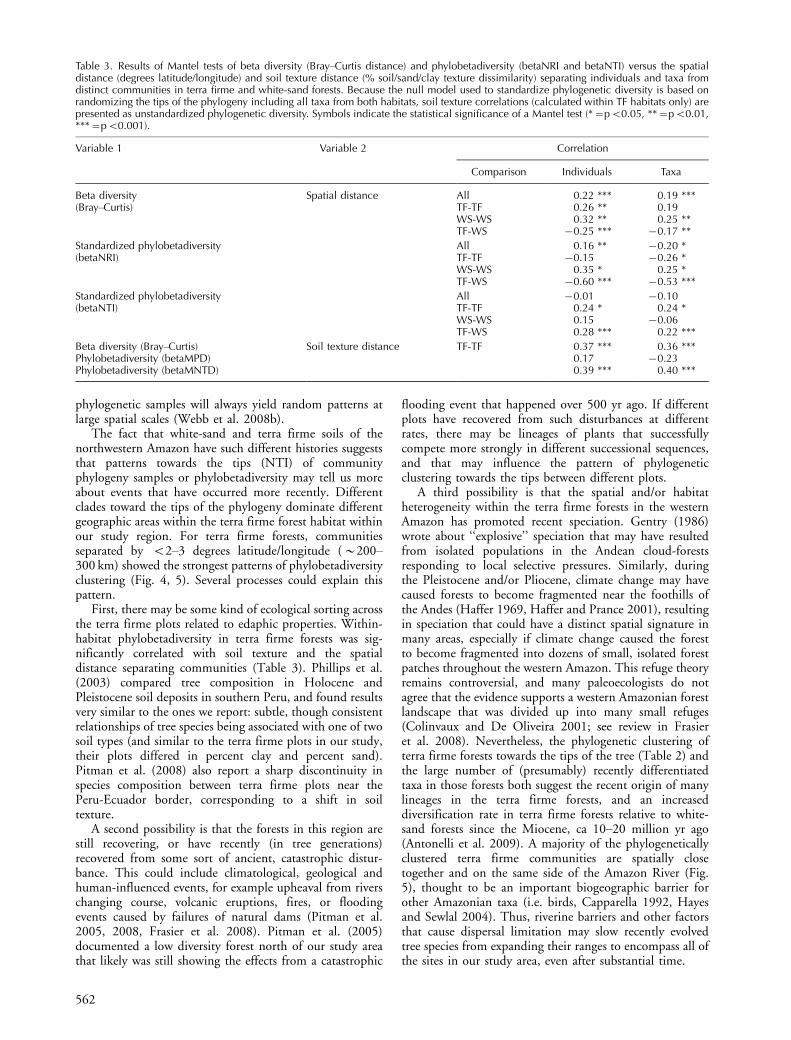
Table 3. Results of Mantel tests of beta diversity (Bray�Curtis distance) and phylobetadiversity (betaNRI and betaNTI) versus the spatialdistance (degrees latitude/longitude) and soil texture distance (% soil/sand/clay texture dissimilarity) separating individuals and taxa fromdistinct communities in terra firme and white-sand forests. Because the null model used to standardize phylogenetic diversity is based onrandomizing the tips of the phylogeny including all taxa from both habitats, soil texture correlations (calculated within TF habitats only) arepresented as unstandardized phylogenetic diversity. Symbols indicate the statistical significance of a Mantel test (*�pB0.05, **�pB0.01,***�pB0.001).
Variable 1 Variable 2 Correlation
Comparison Individuals Taxa
Beta diversity Spatial distance All 0.22 *** 0.19 ***(Bray�Curtis) TF-TF 0.26 ** 0.19
WS-WS 0.32 ** 0.25 **TF-WS �0.25 *** �0.17 **
Standardized phylobetadiversity All 0.16 ** �0.20 *(betaNRI) TF-TF �0.15 �0.26 *
WS-WS 0.35 * 0.25 *TF-WS �0.60 *** �0.53 ***
Standardized phylobetadiversity All �0.01 �0.10(betaNTI) TF-TF 0.24 * 0.24 *
WS-WS 0.15 �0.06TF-WS 0.28 *** 0.22 ***
Beta diversity (Bray�Curtis) Soil texture distance TF-TF 0.37 *** 0.36 ***Phylobetadiversity (betaMPD) 0.17 �0.23Phylobetadiversity (betaMNTD) 0.39 *** 0.40 ***
562
The three possibilities detailed above are not mutuallyexclusive, and together they likely contribute to the patternswe find of high phylobetadiversity turnover between terrafirme sites. Our results here could be extended by increasingthe scale of sampling and bolstering our measurement ofsoil variables, in order to find out exactly where on thelandscape phylogenetic turnover is occurring, and whichsoil variables might be most important. Phylogeographicstudies could be employed to test whether species areundergoing population expansion consistent with eitherrecovery from disturbance or recent speciation combinedwith dispersal limitation. Moreover, regional clusteringwithin the western Amazon consistent with recent specia-tion might be detectable in future studies that have the datato expand our scope by including other regional floras(Central America, the Choco, eastern and central Amazon,the Guianas, southeastern Brazil; even West Africa). Forexample, phylogenetic analyses of various groups of non-volant mammals have found that western Amazonianspecies radiated more recently than taxa from the CentralAmazon, the Guianas, or southeastern Brazil (Patton and daSilva 1998).
We observed phylogenetic clustering of individuals atwhite-sand sites, but phylogenetic evenness at terra firmesites (Fig. 3). These divergent phylogenetic structurepatterns may relate to the timing of origin and colonizationof the white-sand and terra firme habitats in the westernAmazon (ter Steege et al. 2006). If the number of individualconspecifics is positively correlated with the age of a species(Hubbell 2001), perhaps differential age could contributeto an explanation of the extremely strong dominancepatterns in white-sand forests. Consistent with this notion,we note that all of the over-represented nodes in the white-sand community phylogeny (Fig. 2; Supplementary mate-rial Table S7) belong to families present in South Americaprior to Andean uplift in the Miocene (Romero 1993). Yet,are white-sand endemics necessarily old species? Fine et al.(2005) found that the five species of Protium (Burseraceae)found in white-sand forests had independently been derivedfrom older terra firme lineages. However, these five speciesare not extremely dominant in white-sand forests, leavingopen the possibility that dominant species such as Dicymbeuiaparaensis (Fabaceae), Pachira brevipes (Malvaceae), andseveral dominant white-sand endemics from the Clusiaceaeare extremely old and represent basal species within theirrespective lineages (such as Potalia (Gentianaceae), Frasieret al. 2008).
Conclusions
Our results suggest that the biogeographic history ofdifferent habitats along with habitat specialization driveshigh beta diversity and patterns of phylogenetic communitystructure both among and within habitats. At the sametime, a role for dispersal limitation is suggested bythe finding that beta diversity increases with spatialdistance, although it is not as strong as the effect of habitattype. Moreover, our results suggest that the influence ofbiogeographic and evolutionary processes on communityphylodiversity can interact with the effect of local processessuch as habitat specialization and dispersal limitation,
necessitating both phylogenetic community structure andphylobetadiversity measures to understand the relativeimportance of these processes (Table 1). Phylobetadiversityis a necessary extension of studies of community phyloge-netic structure because many of the biogeographic anddispersal-related processes we are interested in studying onlymake testable predictions about the differences amongcommunities or turnover of phylodiversity in space, ratherthan about the pattern of relatedness in any one localcommunity. This approach places traditional communityphylogenetic structure analyses within a framework that canbe simultaneously investigated at multiple scales, for bothspatial distance and environmental variables (Graham andFine 2008). Moreover, significant patterns of phylogeneticturnover can be visualized on a map (Fig. 5), affording newinsights into particular areas within a region that are mostlikely to be driving evolutionary processes (Graham et al.2009). Given the intractability of experimental approachesto resolve these broad-scale biogeographic questions,the approach we have used provides a way to test therelative importance of local and regional processes ingenerating phylogenetic diversity and influencing theassembly of forest communities within regions.
Acknowledgements � We thank the Direccion General de AreasNaturales Protegidas y Fauna Silvestre � INRENA which providednecessary permits for study, collection, and exportation of speci-mens; the Directors and Curators of Herbarium Amazonense(AMAZ) for permission and curatorial help with specimens,D. Del Castillo, L. Campos, E. Rengifo, S. Tello of the Inst. deInvestigaciones de la Amazonıa Peruana (IIAP) for logisticalsupport and permission to work in and around the EstacionAllpahuayo and the Centro de Investigacion Jenaro Herrera; thecommunities of Tierra Blanca, Tamshiyacu, and Jeberos forpermission to work near their villages, I. Mesones, R. Garcıa-Villacorta, J. Alvarez Alonso, S. Irazuzta, Don Meneleo of Jeberos,F. Vacalla for field assistance and logistical assistance; N. Pitman,H. Mogollon, N. Davila, M. Rıos, J. Guevara, M. Ahuite,D. Cardenas, P. Nunez, V. and E. Valderrama for their extensivework establishing plots and identifying plants in the terra firmeplot data used in this paper; C. Bode for help with the figures. Wethank C. Webb, N. Kraft, H. Morlon and D. Ackerly fordiscussions and constructive criticism of the manuscript drafts.This research was supported by grants DEB 0206196 (co-PIP. D. Coley) OISE 0402061 and DEB 0743800 to PVAF by theNational Science Foundation and a postdoctoral fellowship grantfrom the Natural Sciences and Engineering Research Council ofCanada (NSERC) to SWK. The terra firme plot network wassupported by a National Science Foundation InternationalResearch Fellowship INT-0107368 to Nigel Pitman, and theField Museum’s Rapid Biological Inventories program, withsupport from the Gordon and Betty Moore Foundation.
References
Agrawal, A. A. and Fishbein, M. 2006. Plant defense syndromes.� Ecology 87: S132�S149.
Alvarez, J. and Whitney, B. 2003. New distributional records ofbirds from white-sand forests of the northern Peruvianamazon, with implications for biogeography of northernSouth America. � Condor 105: 552�566.
Angiosperm Phylogeny Group 2003. An update of the Angios-perm Phylogeny Group classification for the orders andfamilies of flowering plants. � Bot. J. Linn. Soc. 141: 399�436.
563
Antonelli, A. et al. 2009. Tracing the impact of the Andean uplifton Neotropical plant evolution. � Proc. Natl Acad. Sci. USA106: 9749�9754.
Capparella, A. P. 1992. Neotropical avian diversity and riverinebarriers. � Acta Congr. Int. Ornithol. 20: 307�316.
Cavender-Bares, J. et al. 2006. Phylogenetic structure of Floridianplant communities depends on taxonomic and spatial scale.� Ecology 87: S109�S122.
Cavender-Bares, J. et al. 2009. The merging of commu-nity ecology and phylogenetic biology. � Ecol. Lett. 12:693�715.
Chave, J. 2008. Spatial variation in tree species composition acrosstropical forests: pattern and process. � In: Carson, W. P. andSchnitzer, S. A. (eds), Tropical forest community ecology.Wiley�Blackwell, pp. 11�30.
Chave, J. et al. 2007. The importance of phylogenetic structure inbiodiversity studies. � In: Storch, D. et al. (eds), Scalingbiodiversity. Cambridge Univ. Press, pp. 151�167.
Colinvaux, P. A. and De Oliveira, P. E. 2001. Amazon plantdiversity and climate through the Cenozoic. � Palaeogeogr.Palaeoclimatol. Palaeoecol. 166: 51�63.
Condit, R. et al. 2002. Beta-diversity in tropical forest trees.� Science 295: 666�669.
Coomes, D. A. 1997. Nutrient status of Amazonian caatingaforests in a seasonally dry area: nutrient fluxes, litterfall andanalyses of soils. � Can. J. For. Res. 27: 831�839.
Coomes, D. A. and Grubb, P. J. 1998. Responses of juvenile treesto above and belowground competition in nutrient-starvedAmazonian rain forest. � Ecology 79: 768�782.
Davis, C. C. et al. 2002. Laurasian migration explains Gondwanandisjunctions: evidence from Malpighiaceae. � Proc. Natl Acad.Sci. USA 99: 6833�6837.
Emerson, B. C. and Gillespie, R. G. 2008. Phylogenetic analysis ofcommunity assembly and structure over space and time.� Trends Ecol. Evol. 23: 619�630.
Fine, P. V. A. et al. 2004. Herbivores promote habitat specializa-tion by trees in Amazonian forests. � Science 305: 663�665.
Fine, P. V. A. et al. 2005. The contribution of edaphicheterogeneity to the evolution and diversity of Burseraceaetrees in the western Amazon. � Evolution 59: 1464�1478.
Fine, P. V. A. et al. 2006. The growth-defense trade-off andhabitat specialization by plants in Amazonian forests.� Ecology 87: S150�S162.
Fine, P. V. A. et al. 2010. A floristic study of the white-sand forestsof Peru. � Ann. Miss. Bot. Gard. 97: 283�305.
Forest, F. et al. 2007. Preserving the evolutionary potential offloras in biodiversity hotspots. � Nature 445: 757�760.
Frasier, C. L. et al. 2008. Amazonian lowland, white sand areas asancestral regions for South American biodiversity: biogeo-graphic and phylogenetic patterns in Potalia (Angiospermae:Gentianaceae). � Organ. Divers. Evol. 8: 44�57.
Gentry, A. H. 1986. Endemism in tropical versus temperate plantcommunities. � In: Soule, M. E. (ed.), Conservation biology:the science of scarcity and diversity. Sinauer, pp. 153�181.
Gilbert, B. and Lechowicz, M. J. 2004. Neutrality, niches, anddispersal in a temperate forest understory. � Proc. Natl Acad.Sci. USA 101: 7651�7656.
Gilbert, G. S. and Webb, C. O. 2007. Phylogenetic signal in plantpathogen-host range. � Proc. Natl Acad. Sci. USA 104: 4979�4983.
Graham, C. H. and Fine, P. V. A. 2008. Phylogenetic betadiversity: linking ecological and evolutionary processes acrossspace in time. � Ecol. Lett. 11: 1265�1277.
Graham, C. H. et al. 2009. Phylogenetic community structure intropical hummingbird communities. � Proc. Natl Acad. Sci.USA 106: 19673�19678.
Haffer, J. 1969. Speciation in Amazonian forest birds. � Science165: 131�137.
Haffer, J. and Prance, G. T. 2001. Climatic forcing of evolution inAmazonia during the Cenozoic: on the refuge theory of bioticdifferentiation. � Amazoniana 16: 579�607.
Hardy, O. J. and Senterre, B. 2007. Characterizing the phyloge-netic structure of communities by an additive partitioning ofphylogenetic diversity. � J. Ecol. 95: 493�506.
Harms, K. E. et al. 2001. Habitat associations of trees and shrubsin a 50-ha neotropical forest plot. � J. Ecol. 89: 947�959.
Harrison, S. and Grace, J. B. 2007. Biogeographic affinity helpsexplain productivity-richness relationships at regional and localscales. � Am. Nat. 170: S5�S15.
Hayes, F. E. and Sewlal, J. N. 2004. The Amazon River as adispersal barrier to passerine birds: effects of river width,habitat and taxonomy. � J. Biogeogr. 31: 1809�1818.
Hoorn, C. 1993. Marine incursions and the influence of Andeantectonics on the miocene depositional history of northwesternAmazonia: results of a palynostratigraphic study. � Palaeo-geogr. Palaeoclimatol. Palaeoecol. 105: 267�309.
Hoorn, C. 1994. An environmental reconstruction of the palaeo-Amazon river system (Middle-Late Miocene, NW Amazonia).� Palaeogeogr. Palaeoclimatol. Palaeoecol. 112: 187�238.
Hubbell, S. P. 2001. The unified neutral theory of biodiversityand biogeography. � Princeton Univ. Press.
Hubbell, S. P. 2008. Approaching ecological complexity from theperspective of symmetric neutral theory. � In: Carson, W. P.and Schnitzer, S. A. (eds), Tropical forest community ecology.Wiley�Blackwell, pp. 143�159.
Hughes, C. and Eastwood, R. 2006. Island radiation on acontinental scale: exceptional rates of plant diversification afteruplift of the Andes. � Proc. Natl Acad. Sci. USA 103: 10334�10339.
Janzen, D. H. 1974. Tropical blackwater rivers, animals, and mastfruiting by the Dipterocarpaceae. � Biotropica 6: 69�103.
Kembel, S. W. et al. 2010. Picante: R tools for integratingphylogenies and ecology. � Bioinformatics 26: 1463�1464.
Kraft, N. J. B. and Ackerly, D. D. 2010. Functional trait andphylogenetic tests of community assembly across spatial scalesin an Amazonian forest. � Ecol. Monogr. 80: 401�422.
Kraft, N. J. B. et al. 2007. Trait evolution, community assembly,and the phylogenetic structure of ecological communities.� Am. Nat. 170: 271�283.
Kraft, N. J. B. et al. 2008. Functional traits and niche-based treecommunity assembly in an Amazonian forest. � Science 322:580�582.
Kubitzki, K. 1990. The psammophilous flora of northern SouthAmerica. � Mem. New York Bot. Gard. 64: 248�253.
Lavin, M. et al. 2004. Metacommunity processes rather thancontinental tectonic history better explain geographicallystructured phylogenies in legumes. � Phil. Trans. R. Soc. B359: 1509�1522.
Legendre, P. and Legendre, L. 1998. Numerical ecology, 2ndEnglish ed. � Elsevier.
Marengo, J. 1998. Climatologia de la zona de Iquitos, Peru. � In:Kalliola, R. and Flores Paitan, S. (eds), Geoecologia ydesarrollo Amazonico: estudio integrado en la zona de Iquitos,Peru. Univ. of Turku Press, pp. 35�57.
Medina, E. and Cuevas, E. 1989. Patterns of nutrient accumula-tion and release in Amazonian forests of the upper Rio Negrobasin. � In: Proctor, J. (ed.), Mineral nutrients in tropicalforest and savanna ecosystems. Blackwell, pp. 217�240.
Patton, J. L. and da Silva, M. N. F. 1998. Rivers, refuges, andridges: the geography of speciation of Amazonian mammals.� In: Howard, D. and Berlocher, S. (eds), Endless forms:modes and mechanisms of speciation. Oxford Univ. Press, pp.202�213.
Pennington, R. T. and Dick, C. W. 2004. The role of immigrantsin the assembly of the Amazonian tree flora. � Phil. Trans. R.Soc. B 359: 1611�1622.
564
Phillips, O. L. et al. 2003. Habitat association among Amazoniantree species: a landscape-scale approach. � J. Ecol. 91: 757�775.
Pitman, N. C. A. et al. 2001. Dominance and distribution of treespecies in upper Amazonian terra firme forests. � Ecology 82:2101�2117.
Pitman, N. C. A. et al. 2005. Catastrophic natural origin ofa species-poor tree community in the world’s richest forest.� J. Trop. Ecol. 21: 559�568.
Pitman, N. C. A. et al. 2008. Tree community change across700 km of lowland Amazonian forest from the Andeanfoothills to Brazil. � Biotropica 40: 525�535.
Raven, P. H. and Axelrod, D. I. 1974. Angiosperm biogeographyand past continental movements. � Ann. Miss. Bot. Gard. 61:539�673.
Reich, P. B. et al. 1997. From tropics to tundra: globalconvergence in plant functioning. � Proc. Natl Acad. Sci.USA 94: 13730�13734.
Ricklefs, R. E. 2004. A comprehensive framework for globalpatterns in biodiversity. � Ecol. Lett. 7: 1�15.
Ricklefs, R. E. and Schluter, D. 1993. Species diversity: regionaland historical influences. � In: Ricklefs, R. E. and Schluter, D.(eds), Species diversity in ecological communities: historicaland geographical perspectives. Univ. of Chicago Press,pp. 350�359..
Romero, E. J. 1993. South American paleofloras. � In: Goldblatt, P.(ed.), Biological relationships between Africa and SouthAmerica. Yale Univ. Press, pp. 62�85.
Singer, R. and Araujo, I. 1979. Litter decomposition andectomycorrhiza in Amazonian forest I. A comparison of litterdecomposing and ectomycorrhizal basidiomycetes in latosal-terra-firme forest and white podzol campinarana. � ActaAmazonica 9: 25�41.
Smith, S. E. and Read, D. J. 1997. Mycorrhizal symbiosis.� Academic Press.
Struwe, L. P. et al. 1997. Aripuana cullmaniorum, a new genus andspecies of Gentianaceae from white sands of southeasternAmazonas, Brazil. � Harvard Pap. Bot. 2: 235�253.
Swenson, N. G. et al. 2006. The problem and the promise of scaledependency in community phylogenetics. � Ecology 87:2418�2424.
ter Steege, H. et al. 2006. Continental-scale patterns of canopy treecomposition and function across Amazonia. � Nature 443:444�447.
Tuomisto, H. et al. 1995. Dissecting Amazonian biodiversity.� Science 269: 63�66.
Tuomisto, H. et al. 2003. Dispersal, environment, and floristicvariation of western Amazonian forests. � Science 299: 241�244.
Vamosi, S. M. et al. 2009. Emerging patterns in the comparativeanalysis of phylogenetic community structure. � Mol. Ecol.18: 572�592.
Vriesendorp, C. et al. 2006. Peru: Matses. � Rapid BiologicalInventories Rep. 16, Field Museum.
Webb, C. O. 2000. Exploring the phylogenetic structureof ecological communities: an example for rain forest trees.� Am. Nat. 156: 145�155.
Webb, C. O. and Donoghue, M. J. 2005. Phylomatic: treeassembly for applied phylogenetics. � Mol. Ecol. Not. 5: 181�183.
Webb, C. O. et al. 2002. Phylogenies and community ecology.� Annu. Rev. Ecol. Syst. 33: 475�505.
Webb, C. O. et al. 2008a. Phylocom: software for the analysisof phylogenetic community structure and trait evolution.� Bioinformatics 18: 2098�2100.
Webb, C. O. et al. 2008b. Ecological organization, biogeography,and the phylogenetic structure of tropical forest tree commu-nities. � In: Carson, W. P. and Schnitzer, S. A. (eds), Tropicalforest community ecology. Wiley�Blackwell, pp. 79�98.
Weeks, A. et al. 2005. The phylogenetic history and historicalbiogeography of the frankincense and myrrh family(Burseraceae) based on nuclear and chloroplast sequencedata. � Mol. Phylogenet. and Evol. 35: 85�101.
Weiher, E. and Keddy, P. 1999. Ecological assembly rules:perspectives, advances, retreats. � Cambridge Univ. Press.
Wikstrom, N. et al. 2001. Evolution of angiosperms: calibratingthe family tree. � Proc. R. Soc. B 268: 2211�2220.
Wright, I. J. et al. 2004. The worldwide leaf economics spectrum.� Nature 428: 821�827.
Download the Supplementary material as file E6548 from<www.oikos.ekol.lu.se/appendix>.
565