Phyllostomidae and the evolution of diet
59
Curriculum vitae • Fieldwork • Labwork: The world evolutionary radiation of the cosmopolitan genus Myotis : biogeographic and temporal origins (M 2) Phyllostomidae and the evolution of diet (M 1)
-
Upload
yann-gager -
Category
Science
-
view
12 -
download
3
Transcript of Phyllostomidae and the evolution of diet

Curriculum vitae
• Fieldwork
• Labwork:
The world evolutionary radiation of the
cosmopolitan genus Myotis : biogeographic and
temporal origins (M 2)
Phyllostomidae and the evolution of diet (M 1)

Phyllostomidae and the evolution of diet
Phylogeny & evolution of bats:
evolution of diet
Presented by : Yann Gager
Supervised by : Emmanuel Douzery

Phyllostomidae
Phyllostomidae and the evolution of diet

Phyllostomidae
• Leaf-nosed bats from the New World

Phyllostomidae
• Leaf-nosed bats from the New World
• ~ 160 species described (55 genus) :
More than 10% of Bats =
2nd Order in number of species after Rodents

Phyllostomidae
• Leaf-nosed bats from the New World
• ~ 160 species described (55 genus) :
More than 10% of Bats =
2nd Order in number of species after Rodents
• Great diversity of life-history traits :
Family of Mammals with the biggest number
of diet

Phyllostomidae
Blood

Phyllostomidae
Blood Plants

Phyllostomidae
Blood Plants Arthropods

Phyllostomidae
Blood Plants Arthropods Vertebrates

Goals of the study
Phyllostomidae and the evolution of diet

Goals of the study
• Reliable phylogenetic tree:
important sampling of species
and molecular data

Goals of the study
• Reliable phylogenetic tree:
important sampling of species
and molecular data
• Preliminary to the study of the evolution of
dietdiet

Samplings
Phyllostomidae and the evolution of diet

Samplings
• 120 species + 3 outgroups

Samplings
• 120 species + 3 outgroups
• Compilation & concatenation of genes* :
Supermatrix of 6883 aligned nucleotides
*( GenBank )

Samplings
• 120 species + 3 outgroups
• Compilation & concatenation of genes* :
Supermatrix of 6883 aligned nucleotides
12S 16S CO1 CYB RAG-2
*( GenBank )
12S 16S CO1 CYB RAG-2
Species 1 X ? X ? X
Species 2 X X X X X
Species 3 X X X ? X
Species n X X X X X

Phylogenetic analyses
Phyllostomidae and the evolution of diet

Phylogenetic analyses
• Maximum likelihood (GTR + Γ + INV)

Phylogenetic analyses
• Maximum likelihood (GTR + Γ + INV)
P ,MP ,M

Phylogenetic analyses
• Maximum likelihood (GTR + Γ + INV)
• Node support : Bootstrap (100 replicates)

Phylogenetic analyses
• Maximum likelihood (GTR + Γ + INV)
• Node support : Bootstrap (100 replicates)
• Inference of diet : Trophic levels of the
panTHERIA project*
*( Jones et al. 2009 )
1
Phytophagy
2
Omnivory
3
Animalivory

Evolution of diet
Phyllostomidae and the evolution of diet

Evolution of diet
• Function ACE with APE (R) :
Ancestral Character Estimation
Species 1
Species 2
?
Species 3
?

Evolution of diet
• Function ACE with APE (R) :
Ancestral Character Estimation
• Probabilistic model of estimation of the
speed of change of the diet character state

Evolution of diet
• Function ACE with APE (R) :
Ancestral Character Estimation
• Probabilistic model of estimation of the
speed of change of the diet character state
Species 1
Species 2
Species 3

Evolution of diet
• Function ACE with APE (R) :
Ancestral Character Estimation
• Probabilistic model of estimation of the
speed of change of the diet character state
all changes different

Evolution of diet
• Function ACE with APE (R) :
Ancestral Character Estimation
• Probabilistic model of estimation of the
speed of change of the diet character state
all changes different
Phytophagy Omnivory Animalivory
Phytophagy NA R1 R2
Omnivory R3 NA R4
Animalivory R5 R6 NA

Phytophagy
Animalivory
Omnivory

Phytophagy
Animalivory
Omnivory

Phytophagy
Animalivory
Omnivory

Phytophagy
Animalivory
Omnivory

Phytophagy
Animalivory
Omnivory

Evolution of diet
• Specialisations, but opportunistic omnivory
– Food completion

Evolution of diet
• Specialisations, but opportunistic omnivory
– Food completion
– Survival when the favorite food is rare

Prospects
Phyllostomidae and the evolution of diet

Prospects
• To obtain a fully resolved phylogeny !

Prospects
• To obtain a fully resolved phylogeny !
1) More taxa

Prospects
• To obtain a fully resolved phylogeny !
1) More taxa
2) More genes

Prospects
• To obtain a fully resolved phylogeny !
1) More taxa
2) More genes
3) Both !

Prospects
• Well supported phylogenies:
Working basis for numerous research on bats!

Prospects
• Well supported phylogenies:
Working basis for numerous research on bats!
Life-history
traits
Artibeus sp.

Prospects
• Well supported phylogenies:
Working basis for numerous research on bats!
Systematics
Cistugo sp.

Prospects
• Well supported phylogenies:
Working basis for numerous research on bats!
Biogeography
Myotis spp.
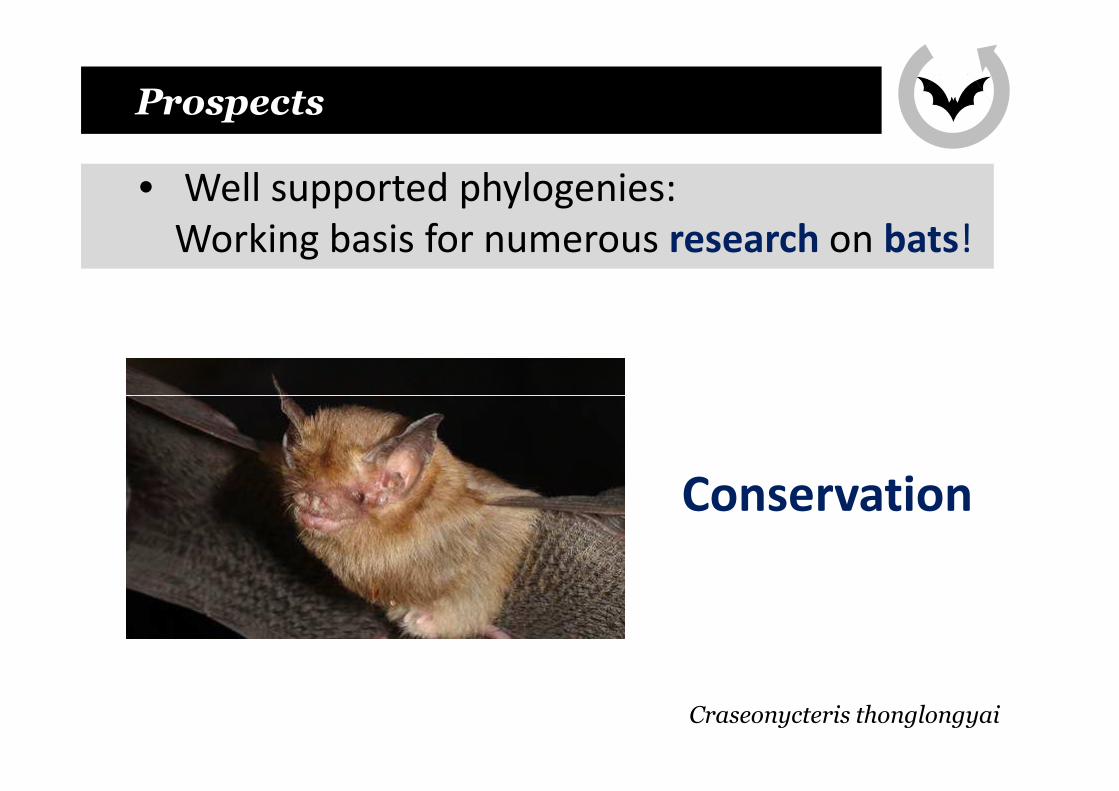
Prospects
• Well supported phylogenies:
Working basis for numerous research on bats!
Conservation
Craseonycteris thonglongyai

Acknowledgments
• Team Molecular phylogeny and Evolution:
E. Douzery, F. Botero, M. Ballenghien, P.
Gayral, C. Delsol
• Funding: ANR Mitosys 2006-2010
• Presentation design: M. David• Presentation design: M. David

Thank you !


Supermatrix
• Drawbacks: Missing data
e.g. artefacts
• Benefits: Contribution for a phylogenetic
signalsignal
e.g ½ of 7kb = 3.5 kb !

Supermatrix
100
75
47
97
10099
100
100
100100
100
100
86
46
29
73
85
7395
67
85
97

General Time Reversible ( GTR )
A C G T
A - a∏C b∏G c∏T
C a∏A - d∏G e∏T
• Base frequencies ∏, substitution rates (from a
to f) and branch lengths
G b∏A d∏C - f∏T
T c∏A e∏C f∏G -

• Nucleotide model of evolution
• General Time Reversible (GTR) with a gamma
distribution of rate variation (Γ) and a
proportion of invariant sites (INV)
General Time Reversible + Γ + INV
proportion of invariant sites (INV)

Evolution of diet
• Matrix of rates of change of trophic level state
Phytophagy Omnivory Animalivory
Phytophagy NA 2,50 0
Omnivory 0,71 NA 0,69
Animalivory 0 0 NA
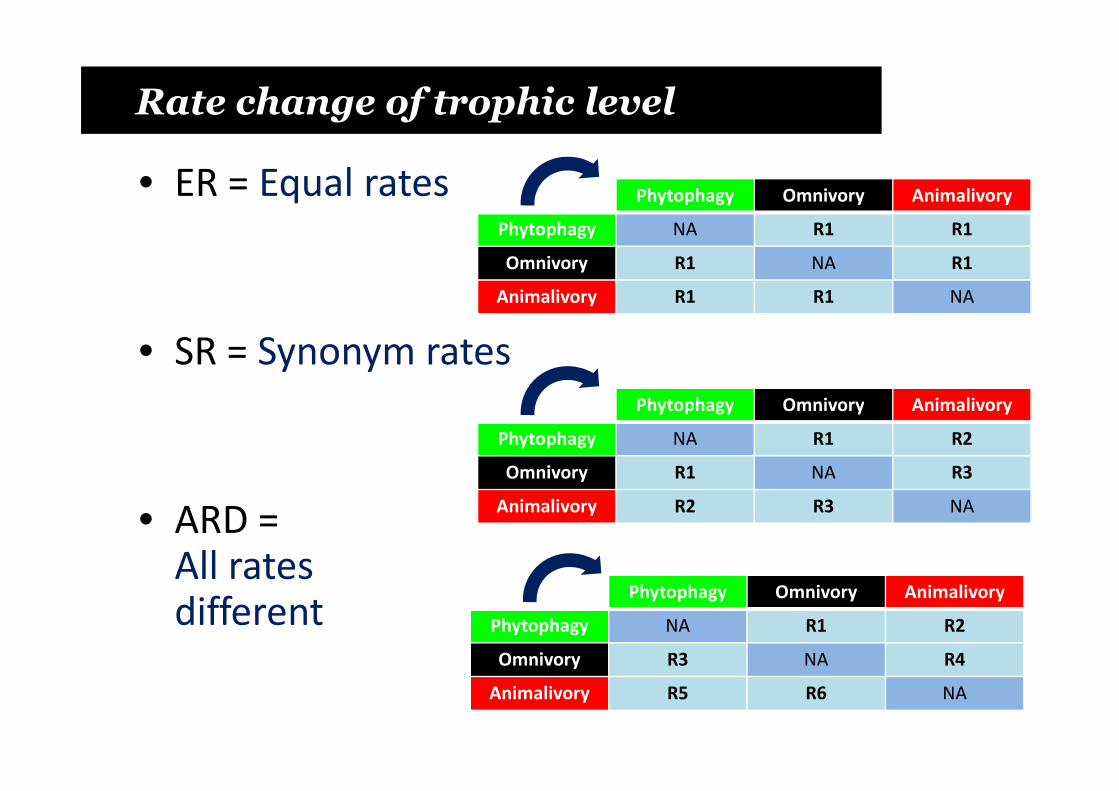
Rate change of trophic level
• ER = Equal rates
• SR = Synonym rates
Phytophagy Omnivory Animalivory
Phytophagy NA R1 R1
Omnivory R1 NA R1
Animalivory R1 R1 NA
Phytophagy Omnivory Animalivory
• ARD = All rates different
Phytophagy Omnivory Animalivory
Phytophagy NA R1 R2
Omnivory R1 NA R3
Animalivory R2 R3 NA
Phytophagy Omnivory Animalivory
Phytophagy NA R1 R2
Omnivory R3 NA R4
Animalivory R5 R6 NA

OrderChiroptera
Jones and Teeling, 2006
Chiroptera

Phyllostomidae
Blood

Phyllostomidae
Blood Plants

Phyllostomidae
Blood Plants Arthropods

Phyllostomidae
Blood Plants Arthropods Vertebrates