Photoemission study of single-layer cuprate...
51
Photoemission study of single-layer cuprate high-T c superconductors Master Thesis Makoto Hashimoto Department of Physics, University of Tokyo January, 2005
-
Upload
doankhuong -
Category
Documents
-
view
225 -
download
0
Transcript of Photoemission study of single-layer cuprate...
Photoemission study of
single-layer cuprate high-Tc
superconductors
Master Thesis
Makoto Hashimoto
Department of Physics, University of Tokyo
January, 2005


Contents
1 Introduction 1
2 Principles of photoemission spectroscopy 3
2.1 Photoemission spectroscopy . . . . . . . . . . . . . . . . . . . . . 3
2.2 Angle-resolved photoemission spectroscopy . . . . . . . . . . . . . 4
2.3 Method of a E−k intensity mapping and a momentum distribution
curve (MDC) . . . . . . . . . . . . . . . . . . . . . . . . . . . . . 6
3 Doping Evolution of the electronic structure in the single-layer
cuprate Bi2Sr2−xLaxCuO6+δ 9
3.1 Introduction . . . . . . . . . . . . . . . . . . . . . . . . . . . . . . 9
3.2 Physical properties of Bi2Sr2−xLaxCuO6+δ . . . . . . . . . . . . . 10
3.3 Experiment . . . . . . . . . . . . . . . . . . . . . . . . . . . . . . 11
3.4 Results and discussion . . . . . . . . . . . . . . . . . . . . . . . . 14
3.5 Summary . . . . . . . . . . . . . . . . . . . . . . . . . . . . . . . 25
4 Temperature-dependent photoemission spectroscopy of La2CuO4.10 29
4.1 Introduction . . . . . . . . . . . . . . . . . . . . . . . . . . . . . . 29
4.2 Physical properties of La2CuO4.10 . . . . . . . . . . . . . . . . . . 30
4.3 Experiment . . . . . . . . . . . . . . . . . . . . . . . . . . . . . . 30
4.4 Results and discussion . . . . . . . . . . . . . . . . . . . . . . . . 32
4.5 Summary . . . . . . . . . . . . . . . . . . . . . . . . . . . . . . . 39
5 Conclusion 41
i


Chapter 1
Introduction
Since the discovery of the high-Tc cuprate superconductors [1], a large number
of studies have been performed to understand the mechanism of the high-Tc
superconductivity. In spite of much effort, however, the mechanism of the high-
Tc superconductivity still remain unclear. Because of being highly correlated
electron systems, the high-Tc cuprate systems show unconventional behaviors
such as the pseudogap. Understanding the origin of these behaviors is a very
important issue in spite of their complexity.
All the high-Tc cuprates have two-dimensional CuO2 planes which play the
main role in the superconductivity. The behaviors of the high-Tc superconductors
dramatically change depending on the carrier density in the CuO2 planes. The Cu
ions in the undoped CuO2 planes have the d9 configuration and the CuO2 planes
have half-filled dx2−y2 orbitals. The strong on-site Coulomb interaction makes
the system an antiferromagnetic Mott insulator. By removing electrons from
the insulating CuO2 planes, i.e. with hole doping, the system changes from the
antiferromagnetic Mott insulator to the high-Tc superconductor. At an optimum
hole concentration of p � 0.15, the systems show the highest superconducting
critical temperature Tc,max in most of the cuprates. With further hole doping,
Tc decreases and disappears, and the cuprates behave like a relatively standard
Fermi liquid.
Therefore, it is necessary to know the electronic structure of the CuO2 plane
to understand the cuprate systems as a function of hole doping. Photoemission
spectroscopy is a powerful tool to directly probe the electronic structure. In fact,
photoemission studies have been performed extensively in many kinds of high-
Tc superconductors such as La2−xSrxCuO4 (LSCO) [2–10], Ca2−xNaxCuO2Cl2
(Na-CCOC) [11–13], and Bi2Sr2−xLaxCaCuO8+y (Bi2212) [14, 15].
Especially, detailed angle-resolved photoemission spectroscopy (ARPES) stud-
1
ies of the doping dependence of the electronic structure have been done in LSCO
and Bi2212. These studies have revealed characteristic features such as the pseu-
dogap behavior with d -wave like gap anisotropy. These studies have revealed a
thorough electronic structure evolution with hole doping in Bi2212 and LSCO.
However, there has remained a problem in comparing LSCO and Bi2212 be-
cause Bi2212 and LSCO are very different systems, that is, LSCO is a La-based
single-layer cuprate and Bi2212 is a Bi-based double-layer cuprate. In order
to connect the ARPES information obtained from Bi2212 and LSCO, we have
studied Bi2Sr2−xLaxCuO6+δ (Bi2201), which is a Bi-based single-layer cuprate
which is expected to have intermediate characters between Bi2212 and LSCO.
We present the results of ARPES study in Bi2201 and compare them with those
of LSCO and Bi2212. The electronic structure of Bi2201 indeed shows interme-
diate behavior with hole doping. We shall also discuss the relationship between
the next-nearest-neighbor hopping parameter t’ and the results of the ARPES.
In optimally doped LSCO, on the other hand, the temperature dependence
of the density of states (DOS) near Fermi energy (EF ) has been investigated
and it showed the (large) pseudogap behavior which did not saturate up to 250
K [6]. In order to see what determines the pseudogap behavior, we have per-
formed a photoemission study of La2CuO4+δ (LCO). We present the results of
a temperature-dependent photoemission study, and discuss the disorder effect of
the intercalated oxygen and the pseudogap behavior in LCO.
2

Chapter 2
Principles of photoemission
spectroscopy
In this chapter, we describe the principles of photoemission spectroscopy (PES)
and angle-resolved photoemission spectroscopy (ARPES).
2.1 Photoemission spectroscopy
Photoemission spectroscopy (PES) is a powerful tool to directly investigate the
electronic structure of materials. Photoemission is a phenomenon that a material
emits electrons when an electron in the solid absorbs a photon of sufficiently high
energy hν. Knowing the kinetic energy Evkin of the emitted electron in the vacuum,
one can deduce how strong the electron was bound to the material. From the
energy conservation law,
Evkin = hν − Φ − EB, (2.1)
where hν is the energy of the incident photons, EB is the binding energy relative
to the Fermi level EF (chemical potential µ)and Φ is a work function of the
material under study. The work function Φ is the energy required for the electron
to escape from the solid through the surface and to reach the vacuum level Evac,
that is, Φ = Evac - EF . In real experiments the kinetic energy (Ekin) measured
from EF rather than Evkin is directly observed. Then we obtain
Ekin = hν − EB. (2.2)
Here, we take the chemical potential µ as a standard of all energies. Since both
the sample and the electron energy analyzer are grounded, the measured kinetic
energy Ekin of the emitted electron is referred to µ (EF ).
3

In the mean-field (Hartree-Fock) approximation, the energy EB is regarded
as the energy ε of the electron inside the solid before it was emitted. There-
fore, the energy distribution of the electrons inside the material can be directly
mapped by the distribution of the kinetic energies of photoelectrons emitted with
monochromatic incident photons. Figure 2.1 illustrates a schematic diagram of
the principles of photoemission spectroscopy.
In real systems, the photoemission spectra are affected by the relaxation of
the whole electron system in the solid, in addition to the one-electron energy ε in
the simple view (frozen-orbital approximation). In response to the hole produced
by the photoemission process, the surrounding electrons tend to screen the hole
to lower the total energy of the system. Therefore, considering the whole electron
system, the binding energy EB is given by the energy difference between the N -
electron initial state ENi and the EN−1
f . In other words, EB is the energy of the
hole produced by the photoemission process, including the relaxation energy of
the total electron system. Hence, much information of the electron correlations
can be derived by analyzing the photoemission spectra.
2.2 Angle-resolved photoemission spectroscopy
Angle-resolved photoemission spectroscopy (ARPES) is the only experimental
technique to determine the band structure of a material. In angle-resolved pho-
toemission spectroscopy (ARPES), not only the energies but also the momentums
of the electrons in the materials are probed. Here, we briefly review the principle
of ARPES. In the photoexcitation process by photons with low energy, the wave
number of the incident photon can be neglected, and the wave number of the elec-
tron is conserved before and after the photoexcitation except for the reciprocal
lattice vector. Therefore, we obtain
Kf = K i + G, (2.3)
where K i and Kf are the crystal momentum of the electron in the initial and
final states, respectively, and G = (2nxπ/a, 2nyπ/b, 2nzπ/c) is an arbitrary re-
ciprocal lattice vector. Next, when the photoelectron escapes from the solid to
the vacuum, part of the momentum perpendicular to the surface is lost due to
the finite work function φ, whereas the momentum parallel to the surface is pre-
served owing to the translational symmetry along the surface. Therefore, when
the momentum of the electron outside the sample is denoted by p
4

Figure 2.1: Schematic energy diagram showing the principle of photoemission spectroscopy(PES). Using the relationship Ekin = hν − EB, the electronic structure of the solid is mappedas an electronic distribution curve (EDC), i.e., a photoemission spectrum.
5

p‖/� = kf‖ + G�‖. (2.4)
In the ARPES experiments, the kinetic energy Ekin and the direction of the
momentum, θ and φ , of photoelectrons are measured using a directional electron
energy analyzer. Therefore, we obtain the momentum of the emitted electron
p‖ = (px, py) as
px =√
2meEvkin cos φ sin θ (2.5)
py =√
2meEvkin sin φ. (2.6)
Summarizing Eqs. (2.1),(2.2),(2.3),(2.4),(2.5),(2.6), we can directly observe both
the energy E ≡ −EB and the parallel momentum kf‖ of the hole produced in
the sample material by the photoemission process as
kx =
√2meEv
kin
�
√Ek cos φ sin θ +
2n′′xπ
a(2.7)
ky =
√2meEv
kin
�
√Ek sin φ +
2n′′xπ
b, (2.8)
where n′′x and n′′
y are arbitrary integers. Figure 2.2 schematically illustrates the
procedure for the band mapping by the ARPES spectra. If the material under
study is a two-dimensional system such as high-Tc cuprates, E and kf‖ are enough
information to map the energy-momentum dispersion of the band structure in
the solids.
2.3 Method of a E − k intensity mapping and a
momentum distribution curve (MDC)
In this thesis, we have used a E−k intensity mapping and a momentum distribu-
tion curve (MDC) in order to investigate the electronic structure. An example of
a E − k intensity mapping is shown in Fig. 2.3(b) where the spectral intensities
are plotted as a function of colors (red is high and blue is low.) in the E − k
plane. An example of momentum distribution curves (MDC’s) are also shown in
Fig. 2.3(c) which is defined by the photoemission intensity versus momentum at
a constant energy.
6

Figure 2.2: Schematic diagram showing the principle of angle-resolved photoemission spec-troscopy (ARPES). The band dispersions in the material are directly mapped by the ARPESspectra.
7

-1.2
-1.0
-0.8
-0.6
-0.4
-0.2
0.0
0.2
Ene
rgy
rela
tive
to E
F (e
V)
-1.2
-1.0
-0.8
-0.6
-0.4
-0.2
0.0
0.2
Ene
rgy
rela
tive
to E
F (e
V)
-0.2 -0.1 0.0 0.1 0.2 k - kF (π/a)
Bi2201 p = 0.12(π/2,π/2)
-0.2 -0.1 0.0 0.1 0.2 k - kF (π/a)
(b) (c)
(a)
Figure 2.3: Method of a momentum distribution curve (MDC) and a E−k intensity mapping.(a) EDC’s where x axis is intensity and y axis is energy. (b) a E − k intensity mapping. (c)MDC’s.
8
Chapter 3
Doping Evolution of the
electronic structure in the
single-layer cuprate
Bi2Sr2−xLaxCuO6+δ
3.1 Introduction
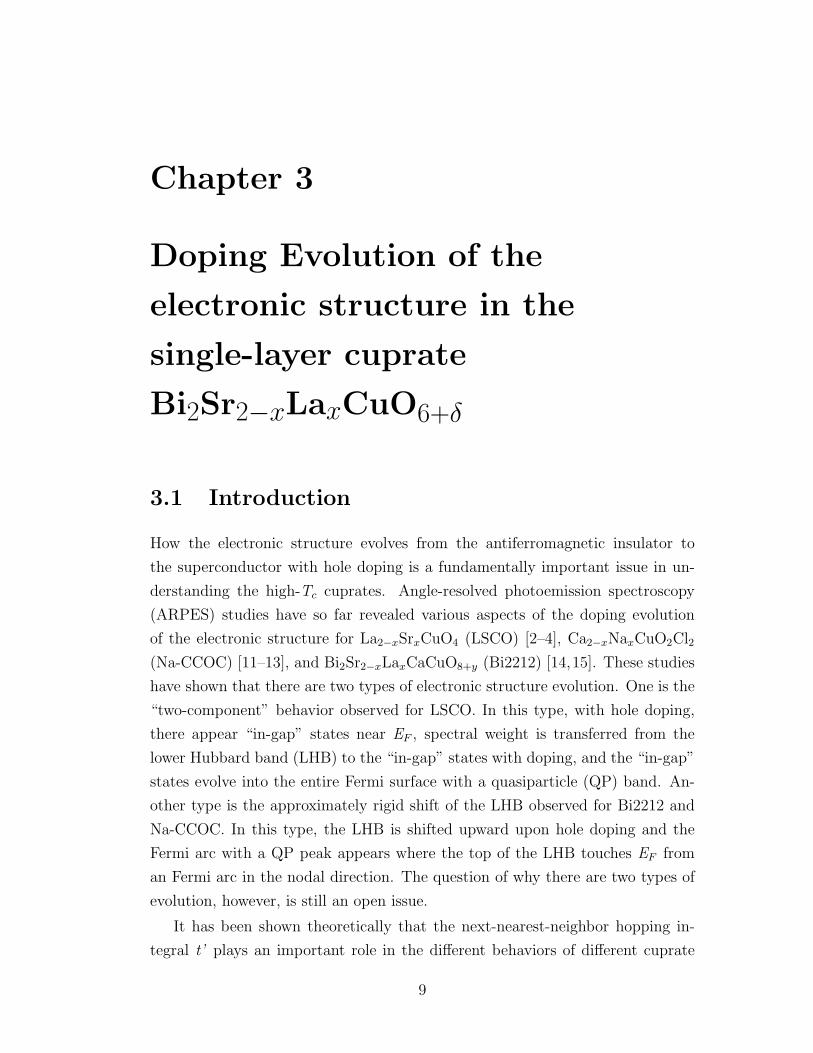
How the electronic structure evolves from the antiferromagnetic insulator to
the superconductor with hole doping is a fundamentally important issue in un-
derstanding the high-Tc cuprates. Angle-resolved photoemission spectroscopy
(ARPES) studies have so far revealed various aspects of the doping evolution
of the electronic structure for La2−xSrxCuO4 (LSCO) [2–4], Ca2−xNaxCuO2Cl2
(Na-CCOC) [11–13], and Bi2Sr2−xLaxCaCuO8+y (Bi2212) [14,15]. These studies
have shown that there are two types of electronic structure evolution. One is the
“two-component” behavior observed for LSCO. In this type, with hole doping,
there appear “in-gap” states near EF , spectral weight is transferred from the
lower Hubbard band (LHB) to the “in-gap” states with doping, and the “in-gap”
states evolve into the entire Fermi surface with a quasiparticle (QP) band. An-
other type is the approximately rigid shift of the LHB observed for Bi2212 and
Na-CCOC. In this type, the LHB is shifted upward upon hole doping and the
Fermi arc with a QP peak appears where the top of the LHB touches EF from
an Fermi arc in the nodal direction. The question of why there are two types of
evolution, however, is still an open issue.
It has been shown theoretically that the next-nearest-neighbor hopping in-
tegral t’ plays an important role in the different behaviors of different cuprate
9

families [16–20]. The t’ is affected primarily by the differences in the position
of the apical oxygen [20]. ARPES measurements of Bi2212 and LSCO support
this calculation [14]. Empirical correlation between t’ and the Tc at optimum
doping Tc,max has also been pointed out [20]. Because there are differences both
in the number of CuO2 planes and the charge reservoir between Bi2212 and
LSCO, there are uncertainty ambiguities in the information obtained from the
comparison between them. Bi2Sr2−xLaxCuO6+δ (La-doped Bi2201) is a Bi-based
single-layer high-Tc cuprate system. Since both Bi2201 and Bi2212 are Bi-based
high-Tc cuprates, and both Bi2201 and LSCO are single-layer high-Tc cuprates,
comparison of Bi2201 with Bi2212 and with LSCO would give useful informa-
tion to understand the systematic changes in the electronic structures among
the different families of high-Tc cuprates. In order to determine which type
the evolution of electronic structure with hole doping of Bi2201 belong to, and to
identify differences from the other cuprates, we have done ARPES measurements
focusing on the lightly-doped region of Bi2201. In this chapter we report on the
results of the ARPES study on Bi2201 and compare them with those of LSCO
and Bi2212. We indeed find that the electronic structure of Bi2201 shows inter-
mediate behavior with hole doping. We discuss the relationship between t’ and
the results of ARPES. Both Bi2201 and LSCO have two apical oxygens per Cu
while the Cu-(apical oxygen) bond length in Bi2201 is longer than that in LSCO.
On the other hand, Bi2212 has only one apical oxygen per Cu. Thus the effect
of the apical oxygen shows a systematic increase from LSCO through Bi2201 to
Bi2212 and the t’ of Bi2201 would show intermediate between those of Bi2212
and LSCO.
3.2 Physical properties of Bi2Sr2−xLaxCuO6+δ
The crystal structure of Bi2201 is shown in Fig. 3.1. Bi2201 is a Bi-based single-
layer cuprate. Bi2201 has single CuO plains similar to LSCO. Therefore there is
no bilayer splitting which makes the interpretations of ARPES spectra compli-
cated, as observed in Bi2212. Bi2201 has Bi-O double plains serving as charge
reservoirs like Bi2212. The Bi-O and the CuO2 plains show incommensurateness
by modulated structures along the b axis due to the structural modulation of the
Bi-O layer. This is similar to Bi2212 and shows the modulated electronic struc-
ture. The hole concentration is controlled by substituting La for Sr. When the La
concentration x increases, the doped hole concentration p decreases. The phase
diagram of Bi2201 is shown in Fig. 3.2 [21]. As in most of the high-Tc cuprates,
10

Figure 3.1: Crystal structure of Bi2201.
for p ∼ 0, Bi2201 behaves as an antiferromagnetic insulator. Upon hole doping,
the antiferromagnetic long-range order disappears, and a transition from the in-
sulator to the superconductor occurs. As in other hole-doped cuprates, Bi2201
shows Tc,max at p ∼ 0.16. With further doping, Tc gradually decreases. However,
the phase diagram of Bi2201 [21] is rather different from the universal behavior
shown in Fig. 3.2 . The transition from the insulator to the superconductor does
not occur until p = 0.10, and Tc disappears faster with hole doping beyond the
optimum hole concentration. The hole concentration of Bi2201 is determined by
the Hall coefficient as shown in Fig. 3.3 [21]. At room temperature, the Hall
coefficient has the same value for the same hole concentration. Figure 3.4 shows
the in-plane electrical resistivity of Bi2201 [22]. At low temperatures, the lightly-
doped Bi2201 (p < 0.04) shows insulating behavior similar to Bi2212 [23], unlike
LSCO [24]. At room temperature, the lightly doped Bi2201 (p < 0.04) shows
metallic behavior similar to the other high-Tc cuprates.
3.3 Experiment
High-quality single crystals of Bi2Sr2−xLaxCuO6+δ (Bi2201), which became avail-
able recently, were grown by the floating zone (FZ) method. Samples in the
lightly-doped to under doped regions were synthesized. These samples were pro-
11
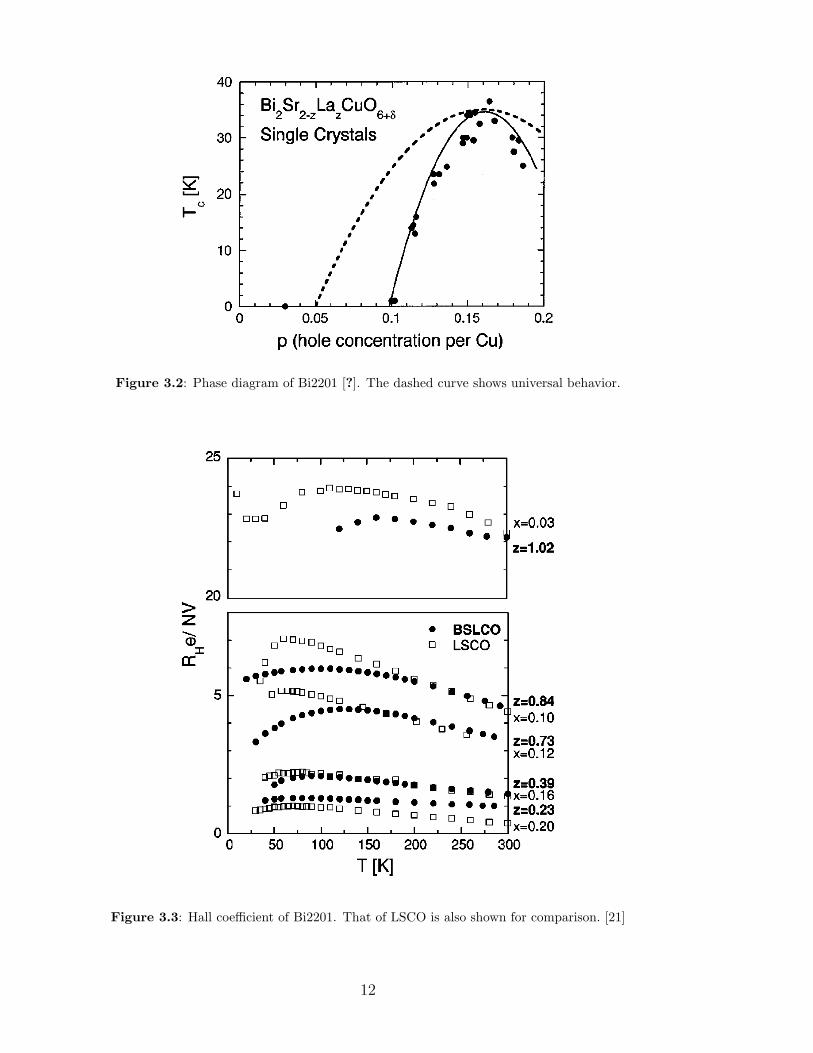
Figure 3.2: Phase diagram of Bi2201 [?]. The dashed curve shows universal behavior.
Figure 3.3: Hall coefficient of Bi2201. That of LSCO is also shown for comparison. [21]
12

Figure 3.4: In plane resistivity of Bi2201 [22].
13

e-
Undulator
Horizontalfocusingmirror
Verticalcondensingmirror
Entrance slitMonochrometer
Exit slit
HorizontalrefocusingmirrorVertical
deflectingmirror
Sample
Figure 3.5: Schematic layout of beamline 5-4 at SSRL.
vided by Dr. S. Ono and Prof. Y. Ando. Details of the sample preparation are
described elsewhere [21, 22]. In our experiments, single crystals with La concen-
trations of x = 0.60, 0.80, 0.92, and 0.96 were prepared corresponding to the hole
concentrations of p = 0.12, 0.10, 0.07, and 0.05, respectively. Only the p = 0.12
sample showed superconductivity with Tc = 17 K.
ARPES measurements were performed at beamline 5-4 of Stanford Syn-
chrotron Radiation Laboratory (SSRL) using a SCIENTA SES-200 analyzer with
the total energy resolution of 15 meV and the angular resolution of 0.3 degree.
The beamline and the end station are shown in Fig. 3.5 and Fig. 3.6. Measure-
ments were performed in the angle mode at 10 K, which is below the Tc of the p
= 0.12 sample. Samples were cleaved in situ under an ultrahigh vacuum of 10−11
Torr to obtain clean surfaces. The Fermi edges of gold were used to determine
the EF position and the instrumental resolution before and after the ARPES
measurements. The spectral intensities have been normalized to the intensity
above EF , which arises from the second order light of the monochromator.
3.4 Results and discussion
Figure 3.7 shows the doping dependence of the spectral weight mapping at EF in
the momentum space showing the evolution of the Fermi surface. The spectral
weight has been integrated within 100 meV of EF . The light polarization was
shown by red arrow in Fig. 3.7. Since the ARPES spectra in the first BZ is
much weaker and more obscured than those in the second BZ due to transition-
matrix-element effects, we consider that the spectral weight distribution in the
14
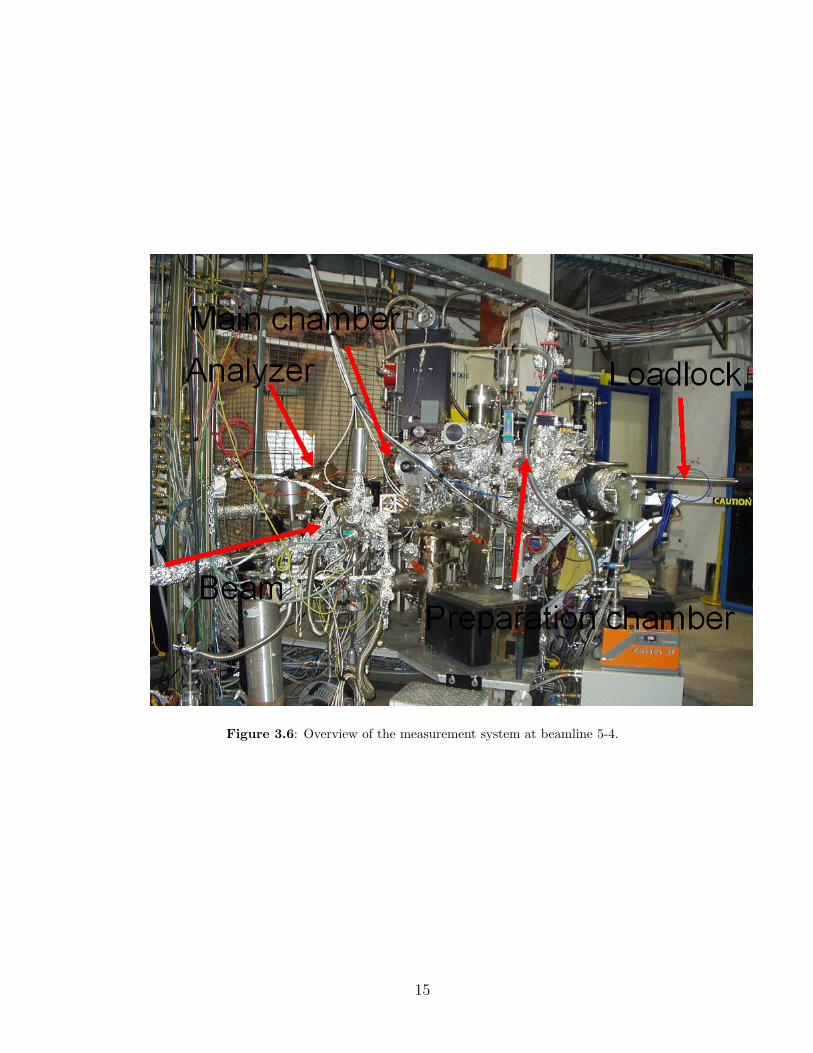
Figure 3.6: Overview of the measurement system at beamline 5-4.
15

-0.5
0.0
0.5
k y(π/a
)
1.51.00.50.0kx(π/a)
(0,0) (π,0)
E
Bi2201 p = 0.05
-0.5
0.0
0.5
k y(π/a
)
1.51.00.50.0kx(π/a)
(0,0) (π,0)
E
Bi2201 p = 0.07
-0.5
0.0
0.5
k y(π/a
)
1.51.00.50.0kx(π/a)
(0,0) (π,0)
E
Bi2201 p = 0.10
-0.5
0.0
0.5
k y(π/a
)
1.51.00.50.0kx(π/a)
(0,0) (π,0)
E
Bi2201 p = 0.12
Figure 3.7: Spectral weight mapping at EF in Bi2201. The squares indicate quarters of thesecond Brilliant zone. The red arrows indicate the light polarization. The black arrows indicatethe nodal directions and the white dots indicate the “underlying” Fermi surfaces.
second BZ is more appropriate to investigate the intrinsic electronic structure.
There are ghost images associated with the superlattice modulation in the Bi-
O layers as indicated in Fig 3.1. White dots represent the maximum intensity
points within 100 meV of EF along “underlying” Fermi surfaces determined from
energy distribution curves (EDC’s) and momentum distribution curves (MDC’s).
In lightly doped p = 0.05, the (π, 0) spectral weight has almost disappeared, and
only the spectral weight around the zone diagonal direction remains at EF . With
increasing hole concentration, the gap size decreases, and the spectral weight
around EF increases.
Figure 3.8(a) shows energy distribution curves (EDC’s) of Bi2201 along the
“underlying Fermi surface” in the second BZ. For the lowest doping p = 0.05,
one can see a single feature dispersing from ∼ -0.4 eV at (π, 0) to -0.2 eV at
16
(π/2, π/2). With increasing hole concentration, the single dispersive feature
moves upwards. This behavior is similar to Bi2212 [15] and is contrasted with
the behavior of LSCO [3], where the LHB stays ∼0.5 eV below EF . Although the
LHB moves toward EF with hole doping and does not show “tow-component”
behavior seen for LSCO, the position of the dispersive feature remains rather
deep compared to Bi2212. Figure 3.8(b) shows the second derivative intensity
plot of the same data to emphasize the dispersion in the E-k plane along the
“underlying” Fermi surface. One can clearly see that the LHB approaches EF
with hole doping. The width of the dispersion is smaller than that of Bi2212.
Figure 3.9 shows the intensity plot of the same data. One can also see the
dispersion along “underlying” Fermi surface. Figure 3.10 shows the dispersion
along the “underlying” Fermi surface as a function of the d wave order parameter
|coskxa - coskya|/2. In p = 0.05, 0.07, and 0.10, the peak dispersions resemble
each other, but for p = 0.12, which is already superconductor the peak dispersion
is weaker.
In Fig. 3.11 we have also plotted the peak dispersions for undoped (x = 0)
LSCO [3] and Na-CCOC [11], and Bi2212 for the most lightly-doped (p = 0.03)
samples [15] with the lowest hole concentration (p = 0.05) samples for Bi2201.
From this comparison, one can see that the slope of Bi2201 is between that of
LSCO and Bi2212. The slope is considered to represent the magnitude of the
next-nearest-neighbor hopping t’ [25]. From Fig. 3.11, one can say that the t’ of
Bi2201 is larger than LSCO and is smaller than Bi2212, indicating a systematic
increase of t’ from LSCO to Bi2201 to Bi2212.
Figure 3.12 shows comparison of spectra near (π, 0) between Bi2201 and
Bi2212. One can see that the evolution of spectra near (π, 0) in Bi2201 is similar
to that in Bi2212. In p = 0.05, the shapes of the spectra for Bi2201 and Bi2212 are
the same. However the evolution is slower in Bi2201 and the shape of spectrum
for Bi2212 with p = 0.12 is somehow similar to Bi2212 with p = 0.07.
Figure 3.13 shows EDC’s along the (0, 0)-(π, π) direction in the second BZ.
In the spectra of p = 0.05, and 0.07, one can hardly see spectral weight at
EF which corresponds to the insulating behavior in the lightly-doped region,
similar to Bi2212 and in contrast to LSCO. Then, as the hole concentration
becomes p = 0.10, where superconductivity starts, the spectral weight at EF
weakly appears. For p = 0.12, where the system becomes superconducting, one
can clearly see quasi particle (QP) peak. In the spectra for p = 0.05, there is a
single dispersive peak around ∼0.4 eV corresponding to the LHB, which becomes
closest to EF near (π/2, π/2). As the hole concentration increases, the dispersive
LHB peak moves toward EF , showing a rigid-band-like shift essentially similar
17

-1.0 -0.5 0
p = 0.07
Inte
nsity
(ar
b. u
nits
)
-1.0 -0.5 0
p = 0.05
-1.0 -0.5 0
p = 0.10
-1.0 -0.5 0
p = 0.12
Energy relative to EF (eV)
-1.2
-1.0
-0.8
-0.6
-0.4
-0.2
0.0
0.2
Ene
rgy
rela
tive
to E
F (e
V)
∼(π, 0)(π/2, π/2)
p = 0.05
∼(π, 0)(π/2, π/2)
p = 0.07
∼(π, 0)(π/2, π/2)
p = 0.10
-1.2
-1.0
-0.8
-0.6
-0.4
-0.2
0.0
0.2
∼(π, 0)(π/2, π/2)
p = 0.12
(a)
(b)
(c)
Figure 3.8: ARPES spectra of lightly-doped Bi2201 along the “underlying Fermi surface” inthe second BZ. (a) Energy distribution curves (EDC’s). (b) Second derivative intensity plotrevealing the peak dispersion in the E-k plane in lightly-doped Bi2201 along the “underlyingFermi surface” in the second BZ.
18

-1.2
-1.0
-0.8
-0.6
-0.4
-0.2
0.0
0.2
Ene
rgy
rela
tive
to E
F (e
V)
∼(π, 0)(π/2, π/2)
Bi2201 p = 0.10
-1.2
-1.0
-0.8
-0.6
-0.4
-0.2
0.0
0.2
Ene
rgy
rela
tive
to E
F (e
V)
∼(π, 0)(π/2, π/2)
Bi2201 p = 0.07
-1.2
-1.0
-0.8
-0.6
-0.4
-0.2
0.0
0.2
Ene
rgy
rela
tive
to E
F (e
V)
∼(π, 0)(π/2, π/2)
Bi2201 p = 0.05
-1.2
-1.0
-0.8
-0.6
-0.4
-0.2
0.0
0.2
Ene
rgy
rela
tive
to E
F (e
V)
∼(π, 0)(π/2, π/2)
Bi2201 p = 0.12
Figure 3.9: Intensity plot revealing the peak dispersion in the E-k plane in lightly-dopedBi2201 along the “underlying Fermi surface” in the second BZ.
-0.2
-0.1
0
Rel
ativ
e E
nerg
y (e
V)
1.00.80.60.40.20|cos(kxa)-cos(kya)|/2
Bi2201 p = 0.05 Bi2201 p = 0.07 Bi2201 p = 0.10 Bi2201 p = 0.12
Figure 3.10: Peak dispersion along the “underlying” Fermi surface as a function of the d -waveorder parameter |coskxa - coskya|/2 for Bi2212.
19

0.3
0.2
0.1
0
Rel
ativ
e B
indi
ng E
nerg
y (e
V)
1.00.80.60.40.20|cos(kxa)-cos(kya)|/2
Bi2201 p = 0.05 Bi2212 p = 0.03 LSCO x = 0 Na-CCOC x = 0
Figure 3.11: Peak dispersion along the “underlying” Fermi surface as a function of the d -waveorder parameter |coskxa - coskxa|/2 for undoped and most lightly-doped cuprates.
to that of Bi2212 [15]. Although the shift with hole doping is as fast as Bi2212,
the position of the dispersive peak is ∼0.1 eV deeper in Bi2201 than in Bi2212
for the same hole concentrations. The same data are plotted in Fig. 3.14 as an
intensity plot revealing the peak dispersion in the E-k plane along the (0, 0)-(π,
π) direction corresponding to Fig. 3.13. One can see that the spectral feature
approaches EF with hole doping and reaches EF for p = 0.12. Figure 3.15 shows
the second derivative plot, where one can clearly see that the LHB moves toward
EF , Figure 3.16 shows the same intensity plot on an expanded scale near EF .
We have also plotted the peaks of the momentum distribution carves (MDC’s)
fitted to a Lorenzian. One can see that the MDC peaks disperses toward EF like
a quasi particle (QP) band. There can be seen a kink structure for p = 0.10 and
0.12.
In Fig. 3.16, the peaks of EDC’s, which represent the dispersion of the LHB,
are also plotted. With hole doping, the LHB gradually moves toward EF . This
shift can also be seen in Bi2212 [15], while there is no shift in LSCO [3]. In order
to estimate the shift of the LHB, the top of the LHB for each doping is aligned in
Fig. 3.17. The position of the chemical potential relative to the LHB for Bi2201,
Bi2212 [15], Na-CCOC [12] are shown in Fig. 3.18. The shift is smaller than
Bi2212 and Na-CCOC. If this shift is related to the chemical potential shift,
20

Inte
nsity
(ar
b. u
nits
)
-0.5 0Energy relative to EF (eV)
Bi2201 Bi2212
p =
0.07
0.12
0.10
0.06
0.05
0.03
0.02
Figure 3.12: The spectra near (π, 0). The spectra for Bi2212 are also shown for comparison.
21

-1.0 -0.5 0
p = 0.07In
tens
ity (
arb.
uni
ts)
-1.0 -0.5 0
p = 0.05
-1.0 -0.5 0
p = 0.10
-1.0 -0.5 0
p = 0.12
Energy relative to EF (eV)
Figure 3.13: Energy distribution curves (EDC’s) of lightly-doped Bi2201 along the (0, 0)-(π, π) direction in the second BZ. A bold line for each doping gives the spectrum where thedispersive feature comes closest to the Fermi level.
k - kF (π/a)
-0.2 0.0 0.2
p = 0.10(π/2,π/2)
-1.2
-1.0
-0.8
-0.6
-0.4
-0.2
0.0
0.2
Energy relative to E
F (eV)
-0.2 0.0 0.2
p = 0.12(π/2,π/2)
-0.2 0.0 0.2
p = 0.07(π/2,π/2)
-1.2
-1.0
-0.8
-0.6
-0.4
-0.2
0.0
0.2
Ene
rgy
rela
tive
to E
F (e
V)
-0.2 0.0 0.2
p = 0.05(π/2,π/2)
Figure 3.14: Intensity plot revealing the peak dispersion in the E-k plane of lightly-dopedBi2201 along the (0, 0)-(π, π) direction in the second BZ.
22

-1.2
-1.0
-0.8
-0.6
-0.4
-0.2
0.0
0.2E
nerg
y re
lativ
e to
EF
(eV
)
-0.2 -0.1 0.0 0.1 0.2 k - kF (π/a)
Bi2201 p = 0.05(π/2,π/2)
-1.2
-1.0
-0.8
-0.6
-0.4
-0.2
0.0
0.2
Ene
rgy
rela
tive
to E
F (e
V)
-0.2 -0.1 0.0 0.1 0.2 k - kF (π/a)
Bi2201 p = 0.10(π/2,π/2)
-1.2
-1.0
-0.8
-0.6
-0.4
-0.2
0.0
0.2
Ene
rgy
rela
tive
to E
F (e
V)
-0.2 -0.1 0.0 0.1 0.2 k - kF (π/a)
Bi2201 p = 0.12(π/2,π/2)
-1.2
-1.0
-0.8
-0.6
-0.4
-0.2
0.0
0.2
Ene
rgy
rela
tive
to E
F (e
V)
-0.2 -0.1 0.0 0.1 0.2 k - kF (π/a)
Bi2201 p = 0.07(π/2,π/2)
Figure 3.15: Second derivative intensity plot revealing the peak dispersion in the E-k planeof lightly-doped Bi2201 along the (0, 0)-(π, π) direction in the second BZ.
Figure 3.16: Intensity plot revealing the peak dispersion in the E-k plane of lightly-dopedBi2201 along the (0, 0)-(π, π) direction in the second BZ on an expanded scale. The redline toward EF indicates the peak plot of MDC’s(momentum distribution curves) fitted byLorentzian. The peaks of EDC’s are shown by white dots.
23

-0.6
-0.4
-0.2
0
Rel
ativ
e E
nerg
y (e
V)
0.50.40.30.2kx(π/a)
p = 0.05 p = 0.07 p = 0.10 p = 0.12
µ0.05µ0.07
µ0.10
µ0.12
Figure 3.17: Peak positions of the EDC’s and MDC’s vertically shifted so that the top of theLHB for each doping is aligned. The horizontal lines show the chemical potential position.
the smaller shift for Bi2201 than Bi2212 and Na-CCOC is consistent with t’
estimated from the energy dispersion along “underlying” Fermi surface.
Comparison of the spectra near (π/2, π/2) between Bi2212 and LSCO are
shown in Fig. 3.19 and Fig. 3.20. Like the spectra near (π, 0), the evolution of
the spectra is similar to Bi2212 but is slower. In the spectra for p = 0.12, which
shows superconductivity, one can see the QP peak is weaker than that for p =
0.07 in Bi2212 and the LHB stays deeper. In LSCO, the LHB stays at ∼ -0.4 eV
and QP peak appears at EF with hole doping in contrast to Bi2201 and Bi2212.
Figure 3.21 shows the doping dependence of the LHB and QP peak positions
around the node and (π, 0). One can see that the LHB at (π, 0) and (π/2, π/2)
in Bi2201 moves in parallel with hole doping similar to Bi2212. On the other
hand, the LHB in LSCO does not show a obvious shift and behaves in a different
way. It should be noted, however, that the LHB at (π, 0) and (π/2, π/2) in
Bi2201 are deeper than Bi2212, and the difference between (π,0) and (π/2,π/2)
is smaller than Bi2212.
The position of the valence-band maximum along the (0, 0)-(π, π) line (kFx,
kFy) for Bi2201 determined from the position of the MDC peak at EF is shown in
Fig. 3.22 with those of other cuprates. The behavior of kFx in Bi2201 is similar to
LSCO, rather than Bi2212. In Bi2201 and LSCO, kFx move toward kFx ∼0.45
although kFx moves toward kFx = 0.5 in Bi2212 and Na-CCOC. The deeper
24

-0.8
-0.6
-0.4
-0.2
0.0
Rel
ativ
e E
nerg
y (e
V)
0.120.080.040.00Hole concentration
Bi2212 Na-CCOC Bi2201
Figure 3.18: Position of the chemical potential relative to LHB for Bi2201, Bi2212, andNa-CCOC. The zero point is the value for the zero hole concentration for each system.
LHB, as in LSCO, is considered to be the cause of the observed kFx behavior.
3.5 Summary
In this chapter we have studied the electronic structure of the single-layer high-
Tc cuprate Bi2201 by ARPES measurements. We have obtained the electronic
structure near EF and compared the results with other high-Tc cuprates mainly
in the lightly-doped region (p = 0.05, 0.07, 0.10, 0.12). Bi2201 shows doping
evolution intermediate between Bi2212 [15] and LSCO [3]. The band dispersion
along “underlying” Fermi surface shows intermediate behavior between LSCO
and Bi2212. The behavior of kF is rather close to LSCO. The spectral line shapes
and rigid shift of the LHB are similar to Bi2212, although the LHB is deeper than
in Bi2212. The shift of the LHB with hole doping is slower than Bi2212 and Na-
CCOC. Those results are consistent with a next-nearest-neighbor hopping which
is smaller than Bi2212 and Na-CCOC but is larger than LSCO. This agrees with
the result of theoretical calculation that t’ increases with decreasing influence of
the apical oxygen.
25

Inte
nsity
(ar
b. u
nits
)
-1.2 -0.8 -0.4 0Energy relative to EF (eV)
0.02
0.03
0.05
0.06
0.07
0.10
0.12p =
Bi2201 Bi2212
Figure 3.19: Spectra near (π/2, π/2). Spectra for Bi2212 are also shown for comparison.
26

Inte
nsity
(ar
b. u
nits
)
-1.2 -0.8 -0.4 0Energy relative to EF (eV)
Bi2201p = 0.05 0.10 0.12
Bi2212p = 0.02 0.05 0.07
LSCOx = 0 0.03 0.07
Figure 3.20: Spectra near (π/2, π/2) for Bi2201, Bi2212, and LSCO.
-0.6
-0.4
-0.2
0.0
Ene
rgy
rela
tive
to E
F (
eV)
0.300.200.100.00Hole concentration
Bi2201 Bi2212 LSCO Na-CCOC
k ∼ (π/2,π/2)
-0.6
-0.4
-0.2
0.0
Ene
rgy
rela
tive
to E
F (
eV)
0.300.200.100.00Hole concentration
Bi2201 Bi2212 LSCO Na-CCOC
k ∼ (π,0)
Figure 3.21: Energy positions of EDC peaks for Bi2201, Bi2212, LSCO, and Na-CCOC.
27

0.50
0.45
0.40
k F x(π/a)
0.300.200.100.00Hole concentration
Bi2201 LSCO B2212 Na-CCOC
Figure 3.22: Position of the MDC peak at EF (kFx, kFy) along the (0, 0)-(π, π) direction forvarious doping levels in Bi2201, Bi2212, LSCO, and Na-CCOC.
28
Chapter 4
Temperature-dependent
photoemission spectroscopy of
La2CuO4.10
4.1 Introduction
The pseudogap behavior universally observed in high-Tc superconductors has
been extensively studied in past years. In particular, many photoemission ex-
periments have been done to characterize the pseudogap behavior [5–10]. An
angle-resolved photoemission spectroscopy (ARPES) study has indicated that the
“low-energy” pseudogap is smoothly connected to the superconducting gap with
the same dx2−y2 symmetry [7]. An angle-integrated photoemission spectroscopy
(AIPES) study of La2−xSrxCuO4 (LSCO) by Ino et. al. [5] has revealed a “high-
energy” pseudogap of 0.1-0.2 eV. The “high-energy” pseudogap of 30-35 meV
was also observed temperature dependent AIPES measurements of optimally-
doped La1.85Sr0.15CuO4 but was not directly connected to the “small-energy”
pseudogap or the superconducting gap [6]. The magnitude of the “high-energy”
pseudogap observed in the AIPES measurements corresponds to the character-
istic temperatures of thermodynamic properties, such as the uniform magnetic
susceptibility [26] and the Hall effect [27]. Although the pseudogap behavior has
been observed in every high-Tc superconductor system, the mechanism of its for-
mation has not been known yet. It is therefore necessary to reveal the origin of
the pseudogap and the factor which determines the magnitude of the pseudogap.
In this work, we have done temperature-dependent angle-integrated photoemis-
sion spectroscopy (AIPES) study of La2CuO4+δ (LCO), where holes are doped
through the excess oxygens.
29

4.2 Physical properties of La2CuO4.10
La2CuO4+δ (LCO) is a La-based single-layer cuprate superconductor system and
has the optimal Tc of Tc,max ∼ 38 K. Figure 4.1 shows the crystal structure of
LCO. The mother compound is La2CuO4 the same as LSCO. Hole concentration
is controlled by excess oxygens intercalated between the LaO layers in contrast to
LSCO where holes are doped by substitution Sr for La. The crystallographic sites
where the excess oxygens intercalated are not random but the oxygen atoms form
a regular array called staging. The phase diagram of LCO is shown in Fig. 4.2.
Similar to other high-Tc cuprates, with hole doping, an antiferromagnetic Mott
insulator evolves to a high-Tc superconductor and shows a maximum Tc,max at
the hole concentration of p ∼ 0.15. The hole concentration can be controlled
from the lightly doped to the optimally doped ranges, but there is a distinctive
feature called phase separation and staging. At room temperature, intercalated
oxygen dispersed over the LaO layers, whereas at lower temperature, the phase
separation and staging occur. The phase separation is a phenomenon that the
hole-rich phase (δ = 0.055) and hole-poor insulating phase (δ = 0) coexist, result-
ing in a miscibility gap between δ = 0 and to 0.055. Where the hole concentration
p is high (p > 0.10, δ > 0.055), staging occurs. The intercalated oxygens enter
the LaO planes periodically along the c-axis. Stage n refers to an induced peri-
odicity of n host CuO2 layers. Figure 4.3 shows an example of staging (stage 6
structure). When LCO is quenched from room temperature to low temperature,
the ideal staging does not occur and the intercalated oxygens remain disordered.
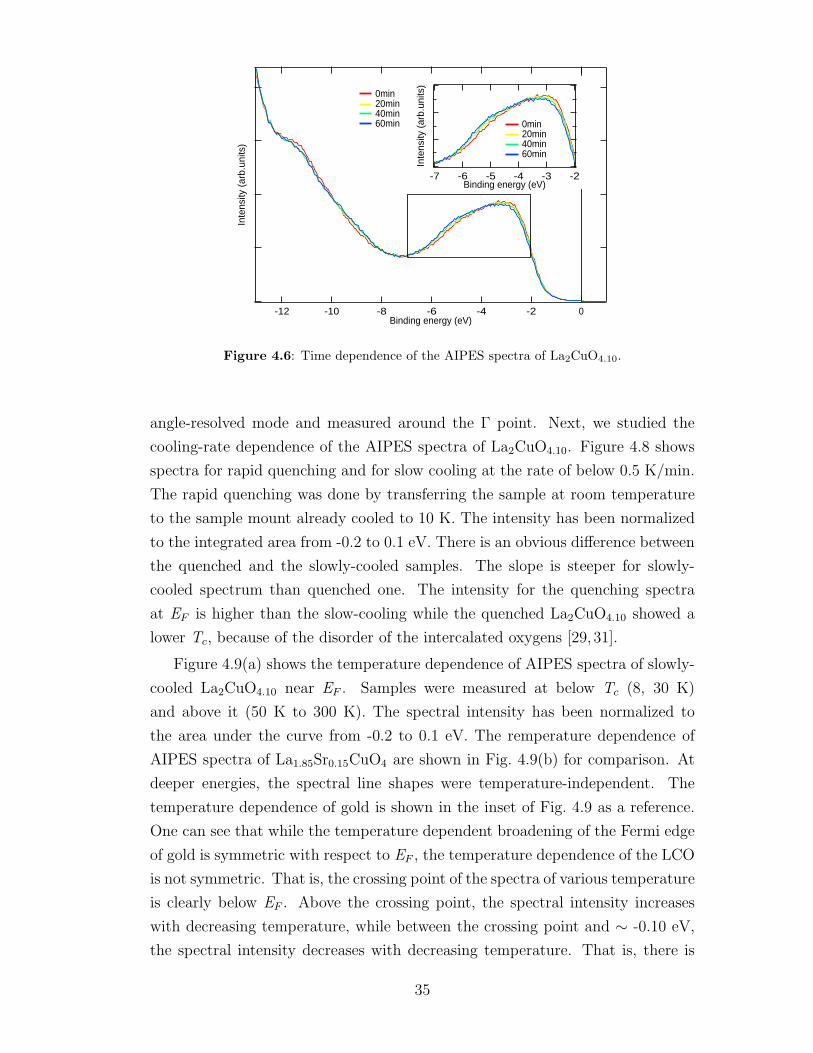
Because of the disorder, the Tc is depressed. When LCO is cooled slowly, there
is less disorder and LCO shows higher Tc (Tc = 35 K for δ = 0.10). Figure 4.4
shows the magnetic susceptibility changes by cooling speed. Recent neutron
scattering results on La2CuO4.12 indicated that LCO has incommensurate spin
fluctuations [28] and that TN ∼ Tc [Fig. 4.5]. That is, antiferromagnetism and
superconductism coexist [29].
4.3 Experiment
We have done temperature-dependent angle-integrated photoemission spectroscopy
(AIPES) study. The measured samples were single crystals of La2CuO4.10, of
which the hole concentration p was ∼ 0.12 and Tc was 35 K. These single crys-
tals were provided by Prof. M. Okusawa and Prof. K. Yamada. Single crystals
of La1.85Sr0.15CuO4 were provided by Dr. T. Kakeshita, Dr. H. Eisaki and Prof.
S. Uchida for comparison. AIPES measurements were performed using a SCI-
30

Figure 4.1: Crystal structure of LCO.
31
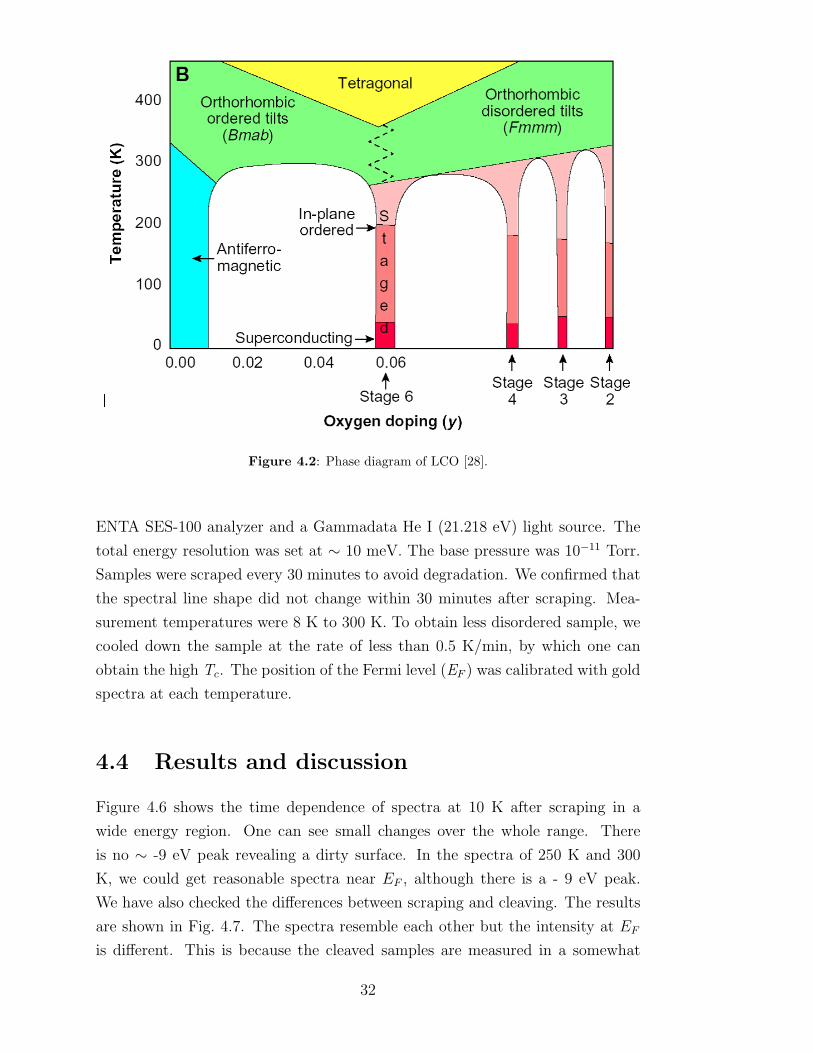
Figure 4.2: Phase diagram of LCO [28].
ENTA SES-100 analyzer and a Gammadata He I (21.218 eV) light source. The
total energy resolution was set at ∼ 10 meV. The base pressure was 10−11 Torr.
Samples were scraped every 30 minutes to avoid degradation. We confirmed that
the spectral line shape did not change within 30 minutes after scraping. Mea-
surement temperatures were 8 K to 300 K. To obtain less disordered sample, we
cooled down the sample at the rate of less than 0.5 K/min, by which one can
obtain the high Tc. The position of the Fermi level (EF ) was calibrated with gold
spectra at each temperature.
4.4 Results and discussion
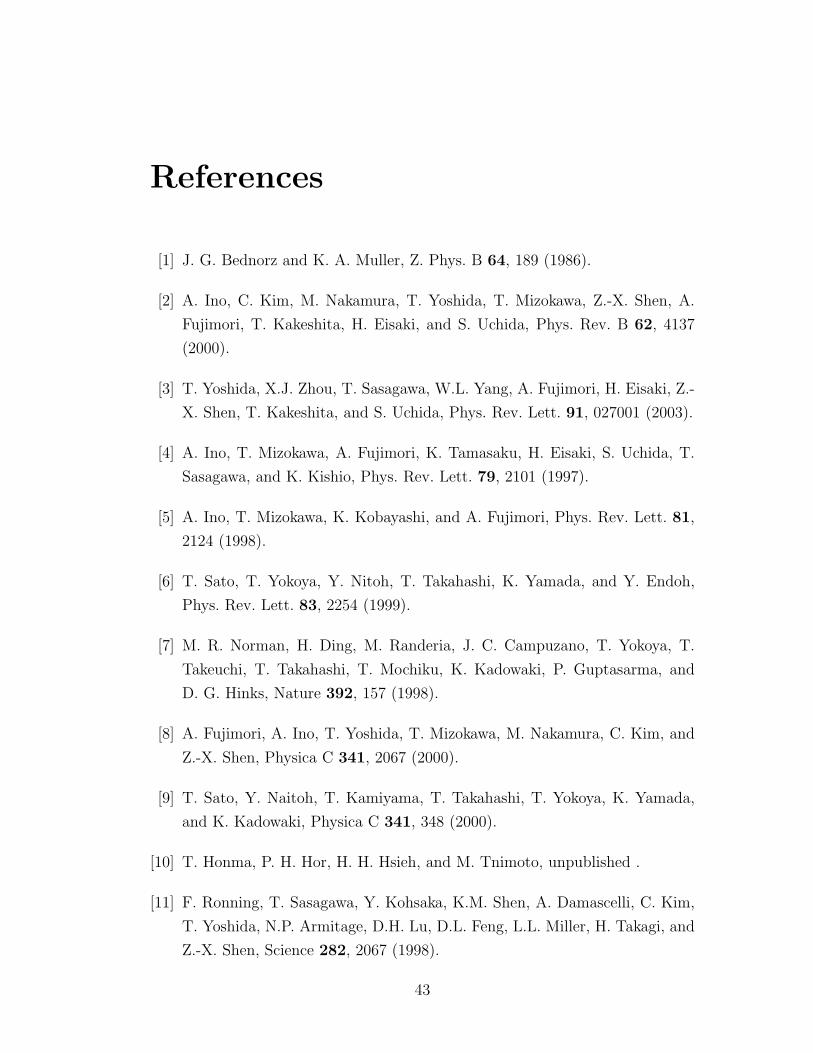
Figure 4.6 shows the time dependence of spectra at 10 K after scraping in a
wide energy region. One can see small changes over the whole range. There
is no ∼ -9 eV peak revealing a dirty surface. In the spectra of 250 K and 300
K, we could get reasonable spectra near EF , although there is a - 9 eV peak.
We have also checked the differences between scraping and cleaving. The results
are shown in Fig. 4.7. The spectra resemble each other but the intensity at EF
is different. This is because the cleaved samples are measured in a somewhat
32
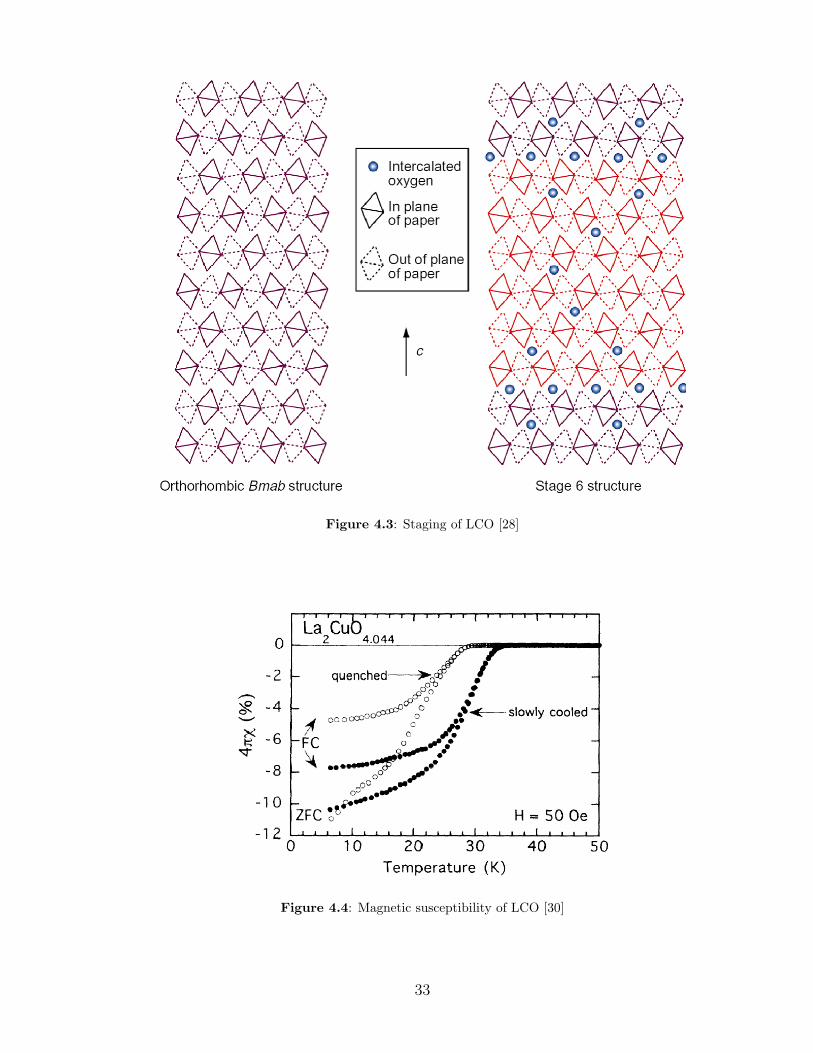
Figure 4.3: Staging of LCO [28]
Figure 4.4: Magnetic susceptibility of LCO [30]
33

Figure 4.5: Magnetic susceptibility (A) and the temperature dependence of the peak intensityof the incommensurate elastic scattering (B). (A) and (B) shows TN ∼ Tc [29].
34
Inte
nsity
(ar
b.un
its)
-12 -10 -8 -6 -4 -2 0Binding energy (eV)
0min 20min 40min 60min
Inte
nsity
(ar
b.un
its)
-7 -6 -5 -4 -3 -2Binding energy (eV)
0min 20min 40min 60min
Figure 4.6: Time dependence of the AIPES spectra of La2CuO4.10.
angle-resolved mode and measured around the Γ point. Next, we studied the
cooling-rate dependence of the AIPES spectra of La2CuO4.10. Figure 4.8 shows
spectra for rapid quenching and for slow cooling at the rate of below 0.5 K/min.
The rapid quenching was done by transferring the sample at room temperature
to the sample mount already cooled to 10 K. The intensity has been normalized
to the integrated area from -0.2 to 0.1 eV. There is an obvious difference between
the quenched and the slowly-cooled samples. The slope is steeper for slowly-
cooled spectrum than quenched one. The intensity for the quenching spectra
at EF is higher than the slow-cooling while the quenched La2CuO4.10 showed a
lower Tc, because of the disorder of the intercalated oxygens [29, 31].
Figure 4.9(a) shows the temperature dependence of AIPES spectra of slowly-
cooled La2CuO4.10 near EF . Samples were measured at below Tc (8, 30 K)
and above it (50 K to 300 K). The spectral intensity has been normalized to
the area under the curve from -0.2 to 0.1 eV. The remperature dependence of
AIPES spectra of La1.85Sr0.15CuO4 are shown in Fig. 4.9(b) for comparison. At
deeper energies, the spectral line shapes were temperature-independent. The
temperature dependence of gold is shown in the inset of Fig. 4.9 as a reference.
One can see that while the temperature dependent broadening of the Fermi edge
of gold is symmetric with respect to EF , the temperature dependence of the LCO
is not symmetric. That is, the crossing point of the spectra of various temperature
is clearly below EF . Above the crossing point, the spectral intensity increases
with decreasing temperature, while between the crossing point and ∼ -0.10 eV,
the spectral intensity decreases with decreasing temperature. That is, there is
35

Inte
nsity
(ar
b.un
its)
-0.20 -0.10 0 0.10Energy relative to EF (eV)
cleaving scraping
slowly cooled
Figure 4.7: AIPES spectra of La2CuO4.10 near EF for a cleaved sample and for a scrapedsample.
Inte
nsity
(ar
b.un
its)
-0.20 -0.15 -0.10 -0.05 0 0.05 0.10
Energy relative to EF (eV)
slowly cooled quenched
-3 -2 -1 0 1
wide
Figure 4.8: AIPES spectra of quenched sample and slowly cooled sample near EF inLa2CuO4.10.
36

Inte
nsity
(ar
b.un
its)
-0.20 -0.10 0 0.10
Energy relative to EF (eV)
8 K 30 K 50 K 100 K 150 K 200 K 250 K 300 K
La24CuO4.10
hν = 21.218 eV
543210
0.15-0.15Energy relative to EF (eV)
Au
(b)Inte
nsity
(ar
b.un
its)
-0.20 -0.10 0 0.10
Energy relative to EF (eV)
10K 30K 50K 100K 150K 200K 250K 300K
La1.85Sr0.15CuO4
hν = 21.218 eV
(a)(b)
Figure 4.9: Temperature dependence of the AIPES spectra near EF . (a)Slowly-cooledLa2CuO4.10. Inset shows the gold spectra. (b)La1.85Sr0.15CuO4.
spectral weight transfer between above and below the crossing point. As for
the spectral intensity at EF , it gradually decreases with decreasing temperature.
This behavior is different from that of a normal metal like gold that the intensity
at EF is temperature independent. The behavior of La2CuO4.10 obtained here is
similar to that of La1.85Sr0.15CuO4 [6]. The spectral intensity at EF is not totally
saturated up to 300 K. These temperature dependent AIPES spectra indicate
the existence of a high energy pseudogap similar to La1.85Sr0.15CuO4.
In order to see the pseudogap behavior more clearly, Fig. 4.10 shows the
temperature dependence of the density of stats (DOS), which has been derived
dividing the spectra by Fermi-Dirac (FD) function at each temperature convo-
luted with a Gaussian corresponding to the total energy resolution (∼ 10 meV).
By this procedure, one can obtain the DOS information excluding the tempera-
ture broadening effect of the FD function. As the DOS of gold obtained by this
procedure shows no temperature dependence as shown in the inset of Fig. 4.10.
On the other hand, the spectral DOS for La2CuO4.10 shows a dramatic change
near EF as shown in Fig. 4.10. One can see that the DOS at EF decreases with
decreasing temperature: The DOS above EF to ∼ -15 meV is depressed at low
temperatures. This behavior clearly indicates that there is a pseudogap open-
ing with decreasing temperature. While the DOS at EF decreases, one can see
the DOS below ∼ -50 meV slightly increases. This means that spectral weight is
transferred from near EF to below ∼ -50 meV with the pseudogap opening. How-
37

Den
sity
of s
tate
s (a
rb.u
nits
)
-0.20 -0.15 -0.10 -0.05 0
Energy relative to EF (eV)
8 K 30 K 50 K 100 K 150 K 200K 250 K 300 K
La2CuO4.10
hν = 21.218 eV
-0.10 0Energy relative to EF (eV)
Au
Den
sity
of s
tate
s (a
rb.u
nits
)
-0.20 -0.15 -0.10 -0.05 0
Energy relative to EF (eV)
10K 30K 50K 100K 150K 200K 250K 300K
La1.85Sr0.15CuO4
hν = 21.218 eV
Figure 4.10: Temperature dependence of the density of states (DOS) near EF . (a)La2CuO4.10. Inset shows the DOS of gold. (b)La1.85Sr0.15CuO4.
ever the increase below ∼ -50 meV is not sufficient to compensate the decrease
around EF . This means that significant amount of spectral weight is transferred
to higher energies. Below Tc, one can see a clear dip structure of ∼ 10 meV width
around EF in addition to the pseudogap structure of ∼ 50 meV wide which can
be seen even above Tc. As in the case of LSCO [6], the pseudogap continues to be
filled with temperature up to 300 K, and one cannot see a complete disappearance
of the pseudogap.
Figure 4.11 shows the difference spectra obtained by subtracting the spectrum
of the lowest temperature (T = 10 K) from the highest temperature (T = 300 K)
to evaluate the width of the pseudogap. The figure also shows comparison of the
magnitude of the pseudogap between LCO and optimally-doped LSCO [6]. The
pseudogap width of La2CuO4.10 is found to be ∼ 50 meV, which is ∼ 20 meV
larger than that of La1.85Sr0.15CuO4, ∼ 30 meV. This can be understood because
hole concentration of La2CuO4.10 (p = 0.12) is smaller than the optimally-doped
La1.85Sr0.15CuO4 (p = 0.15). As reported for many cuprates, the temperature
where the pseudogap begin to open become higher with decreasing hole con-
centration. Therefore, the present result well corresponds to the other previous
studies [10].
The temperature dependence of the DOS at EF is plotted in Fig.4.12. We
have also plotted the result of La1.85Sr0.15CuO4 for comparison [6]. The behaviors
of the two compounds resemble each other. The DOS at EF decreases with
decreasing temperature in a similar way. Below Tc, the slope become larger
38

-2.0
-1.5
-1.0
-0.5
0
0.5
Den
sity
of s
tate
s (a
rb.u
nits
)
-0.15 -0.10 -0.05 0Energy relative to EF (eV)
`50meV
`30meV
La2CuO4.10 La1.85Sr0.15CuO4
Figure 4.11: Comparison of the pseudogap with that of La1.85Sr0.15CuO4.
because the superconducting gap opens in addition to the pseudogap. This effect
is stronger in La1.85Sr0.15CuO4 than in La2CuO4.10.
4.5 Summary
In summary, we have performed temperature-dependent AIPES experiments on
La2CuO4.10, and observed a pseudogap behavior similar to La1.85Sr0.15CuO4. The
width of the pseudogap (∼ 50 meV) is larger than La1.85Sr0.15CuO4 (∼ 30meV),
whereas the superconducting gap estimated from the drop of the temperature-
dependent DOS below Tc is smaller than La1.85Sr0.15CuO4. One can conclude
that the pseudogap and the superconducting behavior seen in the temperature-
dependent AIPES experiment does not depend on how the hole doping is made.
We have also studied the effect of disorder in La2CuO4.10 by changing the rate
of cooling, and have observed a clear spectral change between slow cooling and
quenching. The quenched sample showed a higher intensity at EF . Further
systematic experiments of disorder effect are desirable.
39

Den
sity
of s
tate
s (a
rb.u
nits
)
300250200150100500
Temperature (K)
LCO(p = 0.12) LSCO(x = 0.15)
Figure 4.12: Comparison of the temperature dependence of the DOS at EF with that ofLa1.85Sr0.15CuO4.
40

Chapter 5
Conclusion
In this thesis, we have studied the electronic structure of single-layer high-Tc
cuprates (Bi2201 and LCO) by photoemission spectroscopy.
In Chapter 3, we have investigated Bi-based single-layer high-Tc cuprates
of Bi2Sr2−xLaxCuO6+δ from lightly-doped regions to under-doped regions by
ARPES. We discussed doping evolution of electronic structure by comparing
with LSCO and Bi2212 because the characters of Bi2201 are between those of
LSCO and Bi2212. Bi2201 showed rigid-band like shift with hole doping similar
to Bi2201 and contrast to LSCO. The dispersion along “underlying” Fermi sur-
face and the shift of the LHB in Bi2201 showed intermediate behavior between
those in LSCO and Bi2212. Thus we concluded the t’ of Bi2201 is larger than
LSCO and smaller than Bi2212.
In Chapter 4, we have investigated oxygen-doped single-layer high-Tc cuprates
of La2CuO4.10 by temperature-dependent photoemission spectroscopy. We ob-
served the difference of spectra near EF between a quenched sample and a slowly
cooled sample which was caused by disorder effect. The temperature-dependent
spectra near EF showed similar behavior to La1.85Sr0.15CuO4.10 while the mag-
nitude of pseudogap was ∼ 50 meV which was ∼ 20 meV larger than that of
La1.85Sr0.15CuO4.10. We concluded that the pseudogap and the superconducting
behavior seen in the temperature dependent AIPES experiment does not depend
on how the hole doping is made.
41

References
[1] J. G. Bednorz and K. A. Muller, Z. Phys. B 64, 189 (1986).
[2] A. Ino, C. Kim, M. Nakamura, T. Yoshida, T. Mizokawa, Z.-X. Shen, A.
Fujimori, T. Kakeshita, H. Eisaki, and S. Uchida, Phys. Rev. B 62, 4137
(2000).
[3] T. Yoshida, X.J. Zhou, T. Sasagawa, W.L. Yang, A. Fujimori, H. Eisaki, Z.-
X. Shen, T. Kakeshita, and S. Uchida, Phys. Rev. Lett. 91, 027001 (2003).
[4] A. Ino, T. Mizokawa, A. Fujimori, K. Tamasaku, H. Eisaki, S. Uchida, T.
Sasagawa, and K. Kishio, Phys. Rev. Lett. 79, 2101 (1997).
[5] A. Ino, T. Mizokawa, K. Kobayashi, and A. Fujimori, Phys. Rev. Lett. 81,
2124 (1998).
[6] T. Sato, T. Yokoya, Y. Nitoh, T. Takahashi, K. Yamada, and Y. Endoh,
Phys. Rev. Lett. 83, 2254 (1999).
[7] M. R. Norman, H. Ding, M. Randeria, J. C. Campuzano, T. Yokoya, T.
Takeuchi, T. Takahashi, T. Mochiku, K. Kadowaki, P. Guptasarma, and
D. G. Hinks, Nature 392, 157 (1998).
[8] A. Fujimori, A. Ino, T. Yoshida, T. Mizokawa, M. Nakamura, C. Kim, and
Z.-X. Shen, Physica C 341, 2067 (2000).
[9] T. Sato, Y. Naitoh, T. Kamiyama, T. Takahashi, T. Yokoya, K. Yamada,
and K. Kadowaki, Physica C 341, 348 (2000).
[10] T. Honma, P. H. Hor, H. H. Hsieh, and M. Tnimoto, unpublished .
[11] F. Ronning, T. Sasagawa, Y. Kohsaka, K.M. Shen, A. Damascelli, C. Kim,
T. Yoshida, N.P. Armitage, D.H. Lu, D.L. Feng, L.L. Miller, H. Takagi, and
Z.-X. Shen, Science 282, 2067 (1998).
43
[12] K. M. Shen, F. Ronning, D.H. Lu, W.S. Lee, N.J.C. Ingle, W. Meevasana,
F. Baumberger, A. Damascelli, N.P. Armitage, L.L. Miller, T. Kohsaka, M.
Azuma, M. Takano, H. Takagi, and Z.-X. Shen, unpublished .
[13] Y. Kohosaka, T. Sasagawa, F. Ronning, T. Yoshida, C. Kim, T. Hanaguri,
M. Azuma, M. Takano, Z.-X. Shen, and H. Takagi, J. Phys. Soc. Jpn. 72,
1018 (2003).
[14] K. Tanaka, T. Yoshida, A. Fujimori, D.H. lu, Z.-X. Shen, X.-J. Zhou, H.
Eisaki, Z. Hussain, S. Uchida, Y. Aiura, K. Ono, T. Sugaya, T. Mizuno, and
I. Terasaki, Phys. Rev. B 70, 092503 (2004).
[15] K. Tanaka, T. Yoshida, K.M. Shen, D.H. Lu, W.S. Lee, H. Yagi, A. Fujimori,
Z.-X. Shen, Risdiana, T. fujii, and I. Terasaki, unpublished .
[16] Y. Ohta, T. Tohyama, and S. Maekawa, Phys. Rev. B 43, 2968 (1991).
[17] R. Raimondi, J. H. Jefferson, and L. F. Feiner, Phys. Rev. B 53, 8774 (1996).
[18] E. Dagotto, A. Nazarenko, and A. Moreo, Phys. Rev. Lett. 74, 310 (1995).
[19] M. Fleck, A.I. Lidhtenstein, and A.M. Oles, Phys. Rev. B 64, 134528 (2001).
[20] E. Pavarini, I. Dasgupta, T. Saha-Dasgupta, O. Jepsen, and O. K. Ander-
sen., Phys. Rev. Lett. 87, 047003 (2001).
[21] Y. Ando, Y. Hanaki, S. Ono, T. Murayama, K. Segawa, N. Miyamoto, and
S. Komiya, Phys. Rev. B 61, R14956 (2000).
[22] S. Ono and Y. Ando, Phys. Rev. B 67, 104512 (2003).
[23] T. Fujii and I. Terasaki, Physica C 392-396, 238 (2003).
[24] Y. Ando, A. N. Lavrov, Seiki Komiya, Kouji Segawa, and X. F. Sun, Phys.
Rev. Lett. 87, 017001 (2001).
[25] C. Kim, P.J. White, Z.-X. Shen, T. Tohyama, Y. Shibata, S. Maekawa, B.O.
Wells, Y.J. Kim, R.J. Birgeneau, and M.A. Kanster, Phys. Rev. Lett. 80,
4245 (1998).
[26] T. Nakano, M. Oda, C. Manabe, N. Momono, Y. Miura, and M. Ido, Phys.
Rev. B 49, 16000 (1994).
[27] H. Y. Hwang, B. Batlogg, H. Takagi, H. L. Kao, J. Kwo, R. J. Cava, J. J.
Krajewski, and Jr. W. F. Peck, Phys. Rev. Lett. 72, 2636 (1994).
44
[28] B. O. Wells, Y. S. Lee, M. A. Kastner, R. J. Christianson, R. J. Birgeneau,
K. Yamada, Y. Endoh, and G. shirane, Science 277, 1067 (1997).
[29] Y. S. Lee, R. J. Birgeneau, M. A. Kastner, Y. Endoh, S. Wakimoto, K.
Yamada, R. W. Erwin, S.-H. Lee, and G. Shirane, Phys. Rev. B 60, 3643
(1999).
[30] P. G. Radaelli, J. D. Jorgensen, R. Kleb, B. A. Hunter, F. C. Chou, and
D. C. Johnston, Phys. Rev. B 49, 6239 (1994).
[31] C. Chen and J. F. Ryan, Physica C 364, 587 (2001).
45


Acknowledgments
It is my great pleasure to express my special gratitude to the following people
for their help concerning my master thesis. First of all, I would like to express
my special gratitude to Prof. Atsushi Fujimori, who has suggested me this work
and given me many enlightening discussions. I also thank Dr. Teppei Yoshida
for a lot of useful advice. I am very grateful to Prof. Zhi-Xun Shen and Dr.
Dong-Hui Lu for providing me invaluable opportunities. I would like to thank
Dr. Shinpei Ono and Dr. Yoichi Ando for supplying the samples of Bi2201 and
helpful advice. Prof. Makoto Okusawa and Prof. Kazuyoshi Yamada kindly
offered attractive samples of LCO and taught me about the properties of these
materials. I would also like to thank Dr. Teruhisa Kakeshita, Dr. Hiroshi
Eisaki and Prof. Shinichi Uchida for suppplying teh samples of LSCO. I like to
thank Prof. Takashi Mizokawa for a lot of useful advice and enlightening. I am
grateful to the members of Fujimori Group: Mr. Kiyohisa Tanaka, Mr. Hajime
Yagi, Mr. Yukiaki Ishida, Mr. Hiroki Wadadhi, Mr. Jongil Hwang, Mr. Mr.
Masaki Kobayashi, Mr. Masaru Takizawa, Mr. Kazuaki Ebata, Mr. Masaki
Ikeda, Mr. Yoshitaka Osafune, Ms. Ayako Fukuya and Ms. Yuko Shimazaki
for their support, encouragements fruitful discussions. I would also like to thank
members of the Mizokawa group: Dr. James Quilty, Dr. Jin-Yong Son, Mr.
Daisuke Asakura, Mr. ThangTrung Tran, Mr. Akira Shibata, Mr. Yasuhiro
Fujii and Mr. Kou Takubo.
Tokyo
January 2005
Makoto Hashimoto
47