XPS o ESCA Photoemission Spectroscopies …rocca/Didattica/Laboratorio/pdf...Photoemission...
51
• The physics of photoemission. • How are photoemission spectra recorded: sources and analyzers • Semi-quantitative analysis. • Selected examples and measurements techniques. Photoemission Spectroscopies XPS o ESCA UPS Threshold Spectroscopies (NEXAFS, APS etc…)
Transcript of XPS o ESCA Photoemission Spectroscopies …rocca/Didattica/Laboratorio/pdf...Photoemission...

bull The physics of photoemission
bull How are photoemission spectra recorded sources and analyzers
bull Semi-quantitative analysis
bull Selected examples and measurements techniques
Photoemission Spectroscopies
XPS o ESCA UPS Threshold Spectroscopies (NEXAFS APS etchellip)
Spettroscopic tecniques
Electron out Photon out
Electron in HREELS
AES
Inv photoemission
SXAPS
Photon in XPS
UPS
EXAFS
IRAS
FTIR
SOLID
hn e-
SOLID
hn hn
SOLID
e-
hn
SOLID
e-
e-
The mean free path of electrons undergoing inelastic
scattering due to a material exhibits a minimum at
~100 eV Electron spectroscopies operating around this
energy are thus extremely surface sensitive
Single particle excitation
Plasmonic excitation
Photoemission Spectroscopy the ideal picture
Single Particle Scheme of Energy Levels
Ekin Eb
F
E f (N 1) Ekin Ei (N)
Many Particle Scheme Total Energies
Ekin = Final State Kinetic Energy = Work Function Eb
F(k) = Binding Energy of the k-th Initial State
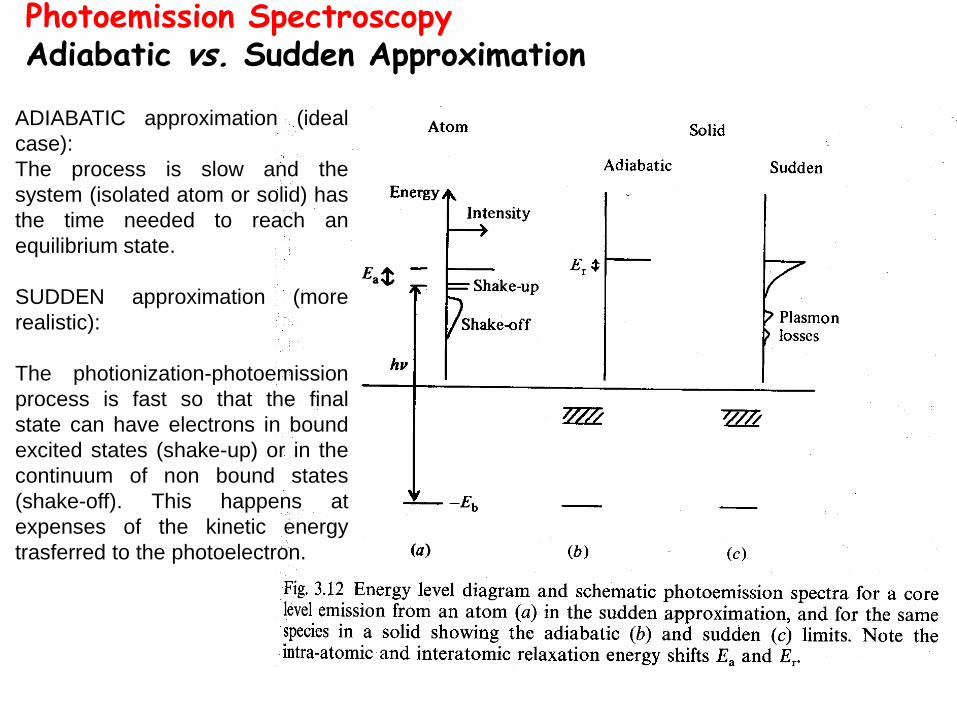
Photoemission Spectroscopy Adiabatic vs Sudden Approximation
ADIABATIC approximation (ideal
case)
The process is slow and the
system (isolated atom or solid) has
the time needed to reach an
equilibrium state
SUDDEN approximation (more
realistic)
The photionization-photoemission
process is fast so that the final
state can have electrons in bound
excited states (shake-up) or in the
continuum of non bound states
(shake-off) This happens at
expenses of the kinetic energy
trasferred to the photoelectron
Photoemission Spectroscopy How real spectra look like Primary and Secondary Electrons
Photoemission Spectroscopy How single-particle and many-particle mechanisms are reflected in a photoemission spectrum
The adsorbed photon can cause
1 Direct excitation of a core electron
2 Direct excitation of a valence
electron
3 Auger process
4 Inelastic processes (plasmon
excitation and production of
secondary electrons)
The set of inelastic processes
determines the asymmetric shape of
XPS peaks (exhibiting a high binding
energy tail)
Photoemission Spectroscopy Photon Sources
Standard X-ray source
Standard monochromator
for X-ray source
Specs model
Ultra-violet photoemission spectroscopy
A Standard UV Discharge Lamp
Typical experimental setup
Hemispherical Analyzer of Electron Kinetic Energy with Entrance Optics Designed for Lateral Resolution
X rays
UV rays
The photoemission process is modelled by the
Three-Step Model of Photoemission in Solids bullPhoton Absorption - Photoionization
bullOptical Absorption Machinery bullSelection Rules
bullElectron Propagation within the Solid bullInelastic Mean Free Path [l(Ekin)]
bullElectron Escape from the Solid bullRefractive Effects at the Surface (for low Ekin electrons) bullCollection of photoemitted electrons
XPS as a core level spectroscopy
Quantitative chemical analysis of surfaces
How sensitive is it
Which is the mimimal detectable concentration of an element
How easily this techinique can be made quantitative
How reliable is it as a quantitative analysis technique
A key argument to answer such questions is provided by the
photoionization cross section of the different energetic levels of
different elements
bull One-particle approach
bull Electromagnetic Field-Matter Interaction
bull Semi-Classical Treatment of the Electromagnetic Field
bull Quantum Treatment of the Solid
H 1
2me
p e
cA
2
e V
p
A
V
H
Electron momentum
Vector potential
Scalar potential
Hamiltonian
Potential energy By appropriate treatment and care quantitative analysis of XPS
spectra can be performed with an accuracy of 5-10
Phoionization Cross Sections for Free Atoms vs Photon Energy
(Yeh and Lindau)
The Cooper mimimum in the
cross section is observed for
states having a node of the
radial wave function
When operating with a tunable X
ray source it can be of help to
measure at energies
corresponding to the Cooper
mimimum to suppress an intense
signal and to detect better the
photoemitted intensity from other
superimposed levels
Once the photon flux f is given the photoelectron current Ii of the (nl) orbital of the i-th atomic species is approximately given by
Ii nl Cil Ekin f( ) nl ( )T Ekin
Where Ci Atomic Concentration of the i-th species l Escape Depth nl Orbital Cross Section T Instrumental Efficiency
Photoemission Spectroscopy semi-quantitative analysis
Once the efficiency of detection of an atomic species is calibrated via the sensitivity factors one gets
Ci
Ii
si
Ii
sii
Where Ci Atomic Concentration of the i-th species si Orbital Sensitivity Factor of the i-th species Ii Spectral Intensity Related to the i-th species
X-RAY Photoemission Spectroscopy
Elemental Sensitivity via Core Level Binding Energies
Chemical Environment Sensitivity via Core Level Chemical Shift
Quantitative Evaluation via Core Level Intensity Analysis amp Cross Section Evaluation
Access to Many Body Realm via Spectral Line Shape Analysis
XPS ndash A few examples Core Levels and Core level shift
Wide XPS spectrum of graphite (C)
The singlet C 1s line is characterized by
1) A finite width reflecting instrumental
resolution lifetime broadening and other
many-body effects
2) A specific binding energy which reflects the
specific atomic species (C) in a specific
chemical environment (core level shift)
C(1s) region
The vacuum level would be a reference to
determine precisely Eb e DEb It is however quite
sensitive to work function changes due to
modification of the surface For the sake of
simplicity the Fermi level is often used because
it is apparent from the XPS spectrum itself
SENSIBILITArsquo CHIMICA
j l sQuantum Numbers
j Total Angular Momentum
l Orbital Angular Momentum
s Spin Angular Momentum p-symmetry state l = 1
s = plusmn12
Degeneracy = |2j+1|
XPS Core Levels and Spin-Orbit Splitting
Si(100) oxidized in O2 The Si 2p line is characterized by the occurrence of 5 chemically distinct components which reflect different chemical states of the Si atoms at the interface
XPS ndash A few examples Core Levels and Core level shifts
XPS ndash A few examples Core Levels and Core level shift
Si 2p32 Core level shift with resect to bulk Si for
a) Films of different thickness grown on Si(100) b) Films ( 5 Aring ) grown on different surfaces
XPS ndash A few examples Core Levels and Core level shift
Photoemission Spectroscopy Surface Core Level Shifts
Surface sensitivity is achieved by exploiting the inelastic mean free path vs hn
Below threshold high chance to penetrate bulk photoelectrons dominate
At the mimimum of the penetration depth the sensitivity to surface photoelectrons is maximised
Background Subtraction in Core Level Photemission Spectra 1) The yellow areas correspond in principle to the primary photoelectrons 2) The case of Shirley base-line corresponds to the integral line of the pristine spectrum
Mechanisms Governing the Line-
width and Line-asymmetry in
Photoemission Spectroscopy
How the Instrumental Resolution can be determined by measuring the Fermi Edge of a Metallic Sample
Ag 4d-related manyfold Ag 5(sp)-related manyfold
Photoemission Spectroscopy Valence Band States
Any valence band spectrum brings altogether contributions related to differing atomic sites and orbital symmetry Thereby one has to properly design ad hoc experiments aiming at disentangling the various spectral components Cooper Minimum Photoemission and Resonant Photoemission are two examples of such ad hoc experiments
Pt 5d bonding
Pt 5d anti bonding
Pt 5d non-bonding
Cooper Minimum Photoemission Possible when one of the valence band orbital shows a Cooper minimum in the photoionization cross section
Cooper minimum in the Pt 5d cross section
The Pt 5d and Si 3p cross sections are comparable
A joint analysis of VB photoemission spectra taken at and off the Cooper minimum enables to disentangle the differing site- and orbital-specific
contributions
Valence band photoemission
Usually excitation sources with less than 150 eV are employed (UV lamp or synchrotron
radiation)
Ultimate resolution ~15 meV with a conventional UV lamp
Small integration in k so that it is possible to measure the photoemision signal from a specific
part of the Brillouin zone
The valence band spectrum is characterised much better than with X-rays
UPS information Measurement of the valence band states of a surface (ARUPS)
Investigation of bands and molecular orbitals of the adsorbates
Angle Resolved UPS
Mapping of the valence band states vs wavevector
The small integration window in
k allows to sample continuously
the entire Brillouin Zone by
measuring the band structure in
the energy allowed range
Volume and surface states can
be identified
a) By comparison with theoretical
predictions
b) By their different behaviour
following gas adsorption (which
obviously affects only the surface
states)
Volume and surface states can be identified a) By comparison with theoretical predictions b) By their different behaviour following gas adsorption (which obviously affects only the surface states)
Chemisorbed C6H6
Condensed C6H6
Gas-phase C6H6
UPS for the study of adsorbed molecules
The comparison of spectra for benzene chemisorbed
on Ni(111) and for benzene condensed on the
same surface (ie for physisorbed benzene not
chemically bound to the surface) shows
1 at least three structures corresponding to the
molecular orbitals
2 A shift of the p orbital toward more negative
energies for the chemisorbed phase indicating
that interaction with the surface involves mainly
this orbital
The assignment of peaks due to adsorbates are
made mainly by comparison with theoretical
predictions or with experimental data available
either for the gas phase or for adsorption on
previously studied surfaces
Threshold Spettroscopies
In XPS the energy of the impinging photons may be much higher than the photoionization
threshold When operating with tunable sources (synchrotron) the energy of the photons is
chosen in such a way to maximise the photionization cross section and the surface sensitivity
Alternatively it is possible to study core levels looking for their photionization threshold by a
source at tunable energy The overcoming of the threshold for photoionization will be detected
either by a decrease of the impining flux or more often by the emission of photons or of Auger
electrons associated with the filling of the vacancies produced by the impinging photon beam
There are several tecniques employing different detection techniques They are collectively
addressed as APS (Appearance Potential Spectroscopy)
The excitation source (50 eV to several KeV) can be provided either by photons or by electrons
In the former case a synchrotron light osurce is needed
NEXAFS (Near Edge X-ray Absorption Fine Structure) opp XANES (X-ray Absorption Near Edge Structure)
In the near edge region the excitation probability
depends on the density of available empty states
which may be strongly modulated below and at the
vacuum level
Biatomic molecule
Keeping in mind the relevant selection rules the
transition of an 1s electron to p and levels is
modulated by the photon energy
Working with tunable X ray sources (Synchrotron Radiation) one may chose the energy at which
surface sensitivity is maximised
Alternatively one may look at the threshold energy and look for the onset of photoemission or
AES signals Such technique is called APS (Appearance Potential Spectroscopies)
Fig 3 Schematic potential (bottom) and corresponding NEXAFS
K-shell spectrum (top) of a diatomic molecular (sub)group In
addition to Rydberg states and a continuum of empty states
similar to those expected for atoms unfilled molecular orbitals
are present which is reflected in the absorption spectrum
NEXAFS (Near Edge X-ray Adsorption Fine Structure) opp XANES (X-ray Adsorption Near Edge Structure)
The threshold energies depend on the material
2p levels in non metals
K-edge (1s2p)= 285 eV for C
400 eV for N
530 eV for O
685 eV for F
3p levels in non metals
K-edge (1s3p)= 1830 eV for Si
2140 eV for P
2470 ev for S
2830 eV for Cl
L-edge (2p4s 3d) in the range 100-270 eV
3d metals LIIIII (2p 3d) lt1000 eV
K-egde (1s 4p) gt4500 eV
4d metals MIIIII (2p4d) lt1000 eV
K-edge (1s4p) gt4500 eV
Fig 1 Schematic molecular potentials (bottom) and K-edge
spectrum (top) of a diatomic molecule XY The K-edge features are
due to transitions from the ls core level of atom X to the following
partially filled or unfilled molecular orbitals p orbitals in the
bound state Rydberg states at energies just below the Fermi level
and resonances in the continuum state (From St6hr [1]
copyright Springer-Verlag)
h= incident photon energy
e m= charge and mass of electrons
(E)= energy density of the final state
Iltff|Ap|figt|=dipole matrix
(h+Ei-Ef)=delta function for the
conservation of energy
)()(14 2
2
2
22
fiifx EEhpAEhhc
e
m
h ff
p
X-ray absorption cross section
The matrix describes the dipolar interaction between the electron
(momentum p) and the electric field (vector potential A) The orientation
of the molecule determines the parity of initial state (generally a
symmetric s level) and final state Photoemission and hence X ray
absorption takes place only when the matrix element is even
Angular momentum conservation implies moreover Dl=plusmn1 between
initial and final state
Information about the molecular orientation
In the case of linearly polarized light the angular dependence of the matrix element of interest
assumes a simple form
For a 1s initial state and a directional final state orbital the matrix element
points in the direction of the final state orbital O and the transition intensity
becomes cos2
(with angle between the electric field vector e and the direction of the final state orbital)
Therefore the intensity of a resonance is largest when e lies along the direction of the final
state molecular orbital and vanishes when e is perpendicular to it
2
if pe ff
if p ff
Schematic representation of the origin of the angular
dependence of NEXAFS resonances for a p-bonded
diatomic molecule adsorbed with its molecular axis
normal to the surface As a result of the different
overlap between the electric field vector and the
direction of the final state orbitals the p -resonance is
maximized at normal incidence (left) while the -
resonance is maximized at grazing incidence (right)
Experimental detection of X-ray absorption
The absorption of a photon
implies the excitation of an
electron from a core level to the
valence state This excited state
will decay either by AES or by
photoluminescence and be
detected
Energy liberated in the de-excitation process
Fluorescence (f) Auger electron (a)
f+ a=1
Fluorescence
- Photon-in Photon-out technique no UHV required
- The penetration depth of photons vs electrons allows to distinguish between
bulk and surface processes
- It is insensitive to charging problems
But hellip measuring thresholds in the soft X-Ray region may be complicated
When the x-ray photon energy resonantly connects a core level with a narrow final state in a solid such as an exciton readily identifiable characteristic peaks will appear in the spectrum These narrow characteristic spectral peaks give the NEXAFS technique A lot of its analytical power is illustrated by the B 1s π exciton shown below
Experimental detection of X-ray absorption
In NEXAFS the final state of the photoelectron may be a bound state such as an exciton Measuring fluorescent photons or Auger electrons allows to tune the sensitivity of the technique The signal corresponds to the sum over all possible final states of the photoelectrons meaning that what NEXAFS measures is the total joint density of states of the initial core level with all final states which are consistent with the conservation rules
The great power of NEXAFS derives from its elemental specificity Because the various elements have different core level energies NEXAFS permits extraction of the signal from a surface monolayer or even a single buried layer in the presence of a huge background signal
Experimental detection of X-ray absorption
K-edge of O in 50 Aring NiO(100)Ni(100)
Comparing fluorecence and electron yield
The peak positions and the relative intensities of the O K-edge features are identical in the two measurements The NEXAFS features labeled A B and C are assigned to the one-electron transition to the 3eg 3a1g and 4t1u orbitals respectively The peaks labeled B and C are related to multielectron configuration interactions
Flourescence
Electron yield
Comparing fluorecence and electron yield the information you can get
NEXAFS The fluorescence yield remains unchanged after annealing to 800 K while the electron yield decreases Oxygen remains near the surface region (mean free path of the O K-edge photons 2000 Aring) The thickness of the O containing region is larger than the electron escape depth (10-15 Aring at 500 eV)
NiONi(100) Preparation at 300 K followed by annealing to T=800 K
NiO clusters + c(2times2) O chemisorbed phase the O signal decreases in AES or XPS
Such decrease can originate either because of the formation of thicker NiO(100) clusters or by diffusion of oxygen deep into the metal bulk Which one of the two
NEXAFS characterization of Molecules
NEXAFS spectra differ significantly even
for rather similar molecular structures so
that they can be used as a fingerprint of
each polymer In many cases enough is
known about how chemical structure and
X-ray absorption spectral features are
related to allow one to identify unknown
species from measured NEXAFS spectra
Individual spectral features particularly the
low energy p features are often sufficient
for qualitative identification in reasonably
well characterized systems and they can
serve as useful energies for selective
chemical contrast in X-ray microscopy
POLYMERS K-edge for C
Photoelectron Diffraction Basic Principles c(2x2)SNi(100)
Photoelectron Diffraction Basic Principles Condition of Constructive Interference
Chemically-Shifted P 2p Components of PFx Fragments Chemisorbed at the Ni (111) Surface
Photoelectron Diffraction Experiment vs Simulation PF3Ni(111)
Theoretical Simulations Best Fit
Experiment
Photoelectron Diffraction Experiment vs Simulation PF2Ni(111)
Theoretical Simulations Best Fit
Experiment
Photoelectron Diffraction Experiment vs Simulation PFNi(111)
Theoretical Simulations Best Fit
Experiment
2 photon photo emission 2PPE
For negative delays only the probe laser is in action Electrons are then promoted from bulk band to the n=1 and 2 image potential states by the 2PPE mechanism and pumped from there by a third photon The electrons in the surface Shockley state are photoemitted by the same 2PPE mechanism ending up at halfway between the n=1 and n=2 photoemission energies At time 0 the pump laser enters in action The n=0 state is then rapidly depleted of electrons (vanishing of the n=0 signal) Such electrons are promoted to the states n=1 and n=2 (increasing photoemission from such states induced by the probe laser) At positive delays the probe laser probes the surviving electron density ins taes n=1 and 2 The Xe layer decouples the image potential states from the Cu surface so that the lifetime of electrons in the image states becomes longer

Spettroscopic tecniques
Electron out Photon out
Electron in HREELS
AES
Inv photoemission
SXAPS
Photon in XPS
UPS
EXAFS
IRAS
FTIR
SOLID
hn e-
SOLID
hn hn
SOLID
e-
hn
SOLID
e-
e-
The mean free path of electrons undergoing inelastic
scattering due to a material exhibits a minimum at
~100 eV Electron spectroscopies operating around this
energy are thus extremely surface sensitive
Single particle excitation
Plasmonic excitation
Photoemission Spectroscopy the ideal picture
Single Particle Scheme of Energy Levels
Ekin Eb
F
E f (N 1) Ekin Ei (N)
Many Particle Scheme Total Energies
Ekin = Final State Kinetic Energy = Work Function Eb
F(k) = Binding Energy of the k-th Initial State
Photoemission Spectroscopy Adiabatic vs Sudden Approximation
ADIABATIC approximation (ideal
case)
The process is slow and the
system (isolated atom or solid) has
the time needed to reach an
equilibrium state
SUDDEN approximation (more
realistic)
The photionization-photoemission
process is fast so that the final
state can have electrons in bound
excited states (shake-up) or in the
continuum of non bound states
(shake-off) This happens at
expenses of the kinetic energy
trasferred to the photoelectron
Photoemission Spectroscopy How real spectra look like Primary and Secondary Electrons
Photoemission Spectroscopy How single-particle and many-particle mechanisms are reflected in a photoemission spectrum
The adsorbed photon can cause
1 Direct excitation of a core electron
2 Direct excitation of a valence
electron
3 Auger process
4 Inelastic processes (plasmon
excitation and production of
secondary electrons)
The set of inelastic processes
determines the asymmetric shape of
XPS peaks (exhibiting a high binding
energy tail)
Photoemission Spectroscopy Photon Sources
Standard X-ray source
Standard monochromator
for X-ray source
Specs model
Ultra-violet photoemission spectroscopy
A Standard UV Discharge Lamp
Typical experimental setup
Hemispherical Analyzer of Electron Kinetic Energy with Entrance Optics Designed for Lateral Resolution
X rays
UV rays
The photoemission process is modelled by the
Three-Step Model of Photoemission in Solids bullPhoton Absorption - Photoionization
bullOptical Absorption Machinery bullSelection Rules
bullElectron Propagation within the Solid bullInelastic Mean Free Path [l(Ekin)]
bullElectron Escape from the Solid bullRefractive Effects at the Surface (for low Ekin electrons) bullCollection of photoemitted electrons
XPS as a core level spectroscopy
Quantitative chemical analysis of surfaces
How sensitive is it
Which is the mimimal detectable concentration of an element
How easily this techinique can be made quantitative
How reliable is it as a quantitative analysis technique
A key argument to answer such questions is provided by the
photoionization cross section of the different energetic levels of
different elements
bull One-particle approach
bull Electromagnetic Field-Matter Interaction
bull Semi-Classical Treatment of the Electromagnetic Field
bull Quantum Treatment of the Solid
H 1
2me
p e
cA
2
e V
p
A
V
H
Electron momentum
Vector potential
Scalar potential
Hamiltonian
Potential energy By appropriate treatment and care quantitative analysis of XPS
spectra can be performed with an accuracy of 5-10
Phoionization Cross Sections for Free Atoms vs Photon Energy
(Yeh and Lindau)
The Cooper mimimum in the
cross section is observed for
states having a node of the
radial wave function
When operating with a tunable X
ray source it can be of help to
measure at energies
corresponding to the Cooper
mimimum to suppress an intense
signal and to detect better the
photoemitted intensity from other
superimposed levels
Once the photon flux f is given the photoelectron current Ii of the (nl) orbital of the i-th atomic species is approximately given by
Ii nl Cil Ekin f( ) nl ( )T Ekin
Where Ci Atomic Concentration of the i-th species l Escape Depth nl Orbital Cross Section T Instrumental Efficiency
Photoemission Spectroscopy semi-quantitative analysis
Once the efficiency of detection of an atomic species is calibrated via the sensitivity factors one gets
Ci
Ii
si
Ii
sii
Where Ci Atomic Concentration of the i-th species si Orbital Sensitivity Factor of the i-th species Ii Spectral Intensity Related to the i-th species
X-RAY Photoemission Spectroscopy
Elemental Sensitivity via Core Level Binding Energies
Chemical Environment Sensitivity via Core Level Chemical Shift
Quantitative Evaluation via Core Level Intensity Analysis amp Cross Section Evaluation
Access to Many Body Realm via Spectral Line Shape Analysis
XPS ndash A few examples Core Levels and Core level shift
Wide XPS spectrum of graphite (C)
The singlet C 1s line is characterized by
1) A finite width reflecting instrumental
resolution lifetime broadening and other
many-body effects
2) A specific binding energy which reflects the
specific atomic species (C) in a specific
chemical environment (core level shift)
C(1s) region
The vacuum level would be a reference to
determine precisely Eb e DEb It is however quite
sensitive to work function changes due to
modification of the surface For the sake of
simplicity the Fermi level is often used because
it is apparent from the XPS spectrum itself
SENSIBILITArsquo CHIMICA
j l sQuantum Numbers
j Total Angular Momentum
l Orbital Angular Momentum
s Spin Angular Momentum p-symmetry state l = 1
s = plusmn12
Degeneracy = |2j+1|
XPS Core Levels and Spin-Orbit Splitting
Si(100) oxidized in O2 The Si 2p line is characterized by the occurrence of 5 chemically distinct components which reflect different chemical states of the Si atoms at the interface
XPS ndash A few examples Core Levels and Core level shifts
XPS ndash A few examples Core Levels and Core level shift
Si 2p32 Core level shift with resect to bulk Si for
a) Films of different thickness grown on Si(100) b) Films ( 5 Aring ) grown on different surfaces
XPS ndash A few examples Core Levels and Core level shift
Photoemission Spectroscopy Surface Core Level Shifts
Surface sensitivity is achieved by exploiting the inelastic mean free path vs hn
Below threshold high chance to penetrate bulk photoelectrons dominate
At the mimimum of the penetration depth the sensitivity to surface photoelectrons is maximised
Background Subtraction in Core Level Photemission Spectra 1) The yellow areas correspond in principle to the primary photoelectrons 2) The case of Shirley base-line corresponds to the integral line of the pristine spectrum
Mechanisms Governing the Line-
width and Line-asymmetry in
Photoemission Spectroscopy
How the Instrumental Resolution can be determined by measuring the Fermi Edge of a Metallic Sample
Ag 4d-related manyfold Ag 5(sp)-related manyfold
Photoemission Spectroscopy Valence Band States
Any valence band spectrum brings altogether contributions related to differing atomic sites and orbital symmetry Thereby one has to properly design ad hoc experiments aiming at disentangling the various spectral components Cooper Minimum Photoemission and Resonant Photoemission are two examples of such ad hoc experiments
Pt 5d bonding
Pt 5d anti bonding
Pt 5d non-bonding
Cooper Minimum Photoemission Possible when one of the valence band orbital shows a Cooper minimum in the photoionization cross section
Cooper minimum in the Pt 5d cross section
The Pt 5d and Si 3p cross sections are comparable
A joint analysis of VB photoemission spectra taken at and off the Cooper minimum enables to disentangle the differing site- and orbital-specific
contributions
Valence band photoemission
Usually excitation sources with less than 150 eV are employed (UV lamp or synchrotron
radiation)
Ultimate resolution ~15 meV with a conventional UV lamp
Small integration in k so that it is possible to measure the photoemision signal from a specific
part of the Brillouin zone
The valence band spectrum is characterised much better than with X-rays
UPS information Measurement of the valence band states of a surface (ARUPS)
Investigation of bands and molecular orbitals of the adsorbates
Angle Resolved UPS
Mapping of the valence band states vs wavevector
The small integration window in
k allows to sample continuously
the entire Brillouin Zone by
measuring the band structure in
the energy allowed range
Volume and surface states can
be identified
a) By comparison with theoretical
predictions
b) By their different behaviour
following gas adsorption (which
obviously affects only the surface
states)
Volume and surface states can be identified a) By comparison with theoretical predictions b) By their different behaviour following gas adsorption (which obviously affects only the surface states)
Chemisorbed C6H6
Condensed C6H6
Gas-phase C6H6
UPS for the study of adsorbed molecules
The comparison of spectra for benzene chemisorbed
on Ni(111) and for benzene condensed on the
same surface (ie for physisorbed benzene not
chemically bound to the surface) shows
1 at least three structures corresponding to the
molecular orbitals
2 A shift of the p orbital toward more negative
energies for the chemisorbed phase indicating
that interaction with the surface involves mainly
this orbital
The assignment of peaks due to adsorbates are
made mainly by comparison with theoretical
predictions or with experimental data available
either for the gas phase or for adsorption on
previously studied surfaces
Threshold Spettroscopies
In XPS the energy of the impinging photons may be much higher than the photoionization
threshold When operating with tunable sources (synchrotron) the energy of the photons is
chosen in such a way to maximise the photionization cross section and the surface sensitivity
Alternatively it is possible to study core levels looking for their photionization threshold by a
source at tunable energy The overcoming of the threshold for photoionization will be detected
either by a decrease of the impining flux or more often by the emission of photons or of Auger
electrons associated with the filling of the vacancies produced by the impinging photon beam
There are several tecniques employing different detection techniques They are collectively
addressed as APS (Appearance Potential Spectroscopy)
The excitation source (50 eV to several KeV) can be provided either by photons or by electrons
In the former case a synchrotron light osurce is needed
NEXAFS (Near Edge X-ray Absorption Fine Structure) opp XANES (X-ray Absorption Near Edge Structure)
In the near edge region the excitation probability
depends on the density of available empty states
which may be strongly modulated below and at the
vacuum level
Biatomic molecule
Keeping in mind the relevant selection rules the
transition of an 1s electron to p and levels is
modulated by the photon energy
Working with tunable X ray sources (Synchrotron Radiation) one may chose the energy at which
surface sensitivity is maximised
Alternatively one may look at the threshold energy and look for the onset of photoemission or
AES signals Such technique is called APS (Appearance Potential Spectroscopies)
Fig 3 Schematic potential (bottom) and corresponding NEXAFS
K-shell spectrum (top) of a diatomic molecular (sub)group In
addition to Rydberg states and a continuum of empty states
similar to those expected for atoms unfilled molecular orbitals
are present which is reflected in the absorption spectrum
NEXAFS (Near Edge X-ray Adsorption Fine Structure) opp XANES (X-ray Adsorption Near Edge Structure)
The threshold energies depend on the material
2p levels in non metals
K-edge (1s2p)= 285 eV for C
400 eV for N
530 eV for O
685 eV for F
3p levels in non metals
K-edge (1s3p)= 1830 eV for Si
2140 eV for P
2470 ev for S
2830 eV for Cl
L-edge (2p4s 3d) in the range 100-270 eV
3d metals LIIIII (2p 3d) lt1000 eV
K-egde (1s 4p) gt4500 eV
4d metals MIIIII (2p4d) lt1000 eV
K-edge (1s4p) gt4500 eV
Fig 1 Schematic molecular potentials (bottom) and K-edge
spectrum (top) of a diatomic molecule XY The K-edge features are
due to transitions from the ls core level of atom X to the following
partially filled or unfilled molecular orbitals p orbitals in the
bound state Rydberg states at energies just below the Fermi level
and resonances in the continuum state (From St6hr [1]
copyright Springer-Verlag)
h= incident photon energy
e m= charge and mass of electrons
(E)= energy density of the final state
Iltff|Ap|figt|=dipole matrix
(h+Ei-Ef)=delta function for the
conservation of energy
)()(14 2
2
2
22
fiifx EEhpAEhhc
e
m
h ff
p
X-ray absorption cross section
The matrix describes the dipolar interaction between the electron
(momentum p) and the electric field (vector potential A) The orientation
of the molecule determines the parity of initial state (generally a
symmetric s level) and final state Photoemission and hence X ray
absorption takes place only when the matrix element is even
Angular momentum conservation implies moreover Dl=plusmn1 between
initial and final state
Information about the molecular orientation
In the case of linearly polarized light the angular dependence of the matrix element of interest
assumes a simple form
For a 1s initial state and a directional final state orbital the matrix element
points in the direction of the final state orbital O and the transition intensity
becomes cos2
(with angle between the electric field vector e and the direction of the final state orbital)
Therefore the intensity of a resonance is largest when e lies along the direction of the final
state molecular orbital and vanishes when e is perpendicular to it
2
if pe ff
if p ff
Schematic representation of the origin of the angular
dependence of NEXAFS resonances for a p-bonded
diatomic molecule adsorbed with its molecular axis
normal to the surface As a result of the different
overlap between the electric field vector and the
direction of the final state orbitals the p -resonance is
maximized at normal incidence (left) while the -
resonance is maximized at grazing incidence (right)
Experimental detection of X-ray absorption
The absorption of a photon
implies the excitation of an
electron from a core level to the
valence state This excited state
will decay either by AES or by
photoluminescence and be
detected
Energy liberated in the de-excitation process
Fluorescence (f) Auger electron (a)
f+ a=1
Fluorescence
- Photon-in Photon-out technique no UHV required
- The penetration depth of photons vs electrons allows to distinguish between
bulk and surface processes
- It is insensitive to charging problems
But hellip measuring thresholds in the soft X-Ray region may be complicated
When the x-ray photon energy resonantly connects a core level with a narrow final state in a solid such as an exciton readily identifiable characteristic peaks will appear in the spectrum These narrow characteristic spectral peaks give the NEXAFS technique A lot of its analytical power is illustrated by the B 1s π exciton shown below
Experimental detection of X-ray absorption
In NEXAFS the final state of the photoelectron may be a bound state such as an exciton Measuring fluorescent photons or Auger electrons allows to tune the sensitivity of the technique The signal corresponds to the sum over all possible final states of the photoelectrons meaning that what NEXAFS measures is the total joint density of states of the initial core level with all final states which are consistent with the conservation rules
The great power of NEXAFS derives from its elemental specificity Because the various elements have different core level energies NEXAFS permits extraction of the signal from a surface monolayer or even a single buried layer in the presence of a huge background signal
Experimental detection of X-ray absorption
K-edge of O in 50 Aring NiO(100)Ni(100)
Comparing fluorecence and electron yield
The peak positions and the relative intensities of the O K-edge features are identical in the two measurements The NEXAFS features labeled A B and C are assigned to the one-electron transition to the 3eg 3a1g and 4t1u orbitals respectively The peaks labeled B and C are related to multielectron configuration interactions
Flourescence
Electron yield
Comparing fluorecence and electron yield the information you can get
NEXAFS The fluorescence yield remains unchanged after annealing to 800 K while the electron yield decreases Oxygen remains near the surface region (mean free path of the O K-edge photons 2000 Aring) The thickness of the O containing region is larger than the electron escape depth (10-15 Aring at 500 eV)
NiONi(100) Preparation at 300 K followed by annealing to T=800 K
NiO clusters + c(2times2) O chemisorbed phase the O signal decreases in AES or XPS
Such decrease can originate either because of the formation of thicker NiO(100) clusters or by diffusion of oxygen deep into the metal bulk Which one of the two
NEXAFS characterization of Molecules
NEXAFS spectra differ significantly even
for rather similar molecular structures so
that they can be used as a fingerprint of
each polymer In many cases enough is
known about how chemical structure and
X-ray absorption spectral features are
related to allow one to identify unknown
species from measured NEXAFS spectra
Individual spectral features particularly the
low energy p features are often sufficient
for qualitative identification in reasonably
well characterized systems and they can
serve as useful energies for selective
chemical contrast in X-ray microscopy
POLYMERS K-edge for C
Photoelectron Diffraction Basic Principles c(2x2)SNi(100)
Photoelectron Diffraction Basic Principles Condition of Constructive Interference
Chemically-Shifted P 2p Components of PFx Fragments Chemisorbed at the Ni (111) Surface
Photoelectron Diffraction Experiment vs Simulation PF3Ni(111)
Theoretical Simulations Best Fit
Experiment
Photoelectron Diffraction Experiment vs Simulation PF2Ni(111)
Theoretical Simulations Best Fit
Experiment
Photoelectron Diffraction Experiment vs Simulation PFNi(111)
Theoretical Simulations Best Fit
Experiment
2 photon photo emission 2PPE
For negative delays only the probe laser is in action Electrons are then promoted from bulk band to the n=1 and 2 image potential states by the 2PPE mechanism and pumped from there by a third photon The electrons in the surface Shockley state are photoemitted by the same 2PPE mechanism ending up at halfway between the n=1 and n=2 photoemission energies At time 0 the pump laser enters in action The n=0 state is then rapidly depleted of electrons (vanishing of the n=0 signal) Such electrons are promoted to the states n=1 and n=2 (increasing photoemission from such states induced by the probe laser) At positive delays the probe laser probes the surviving electron density ins taes n=1 and 2 The Xe layer decouples the image potential states from the Cu surface so that the lifetime of electrons in the image states becomes longer
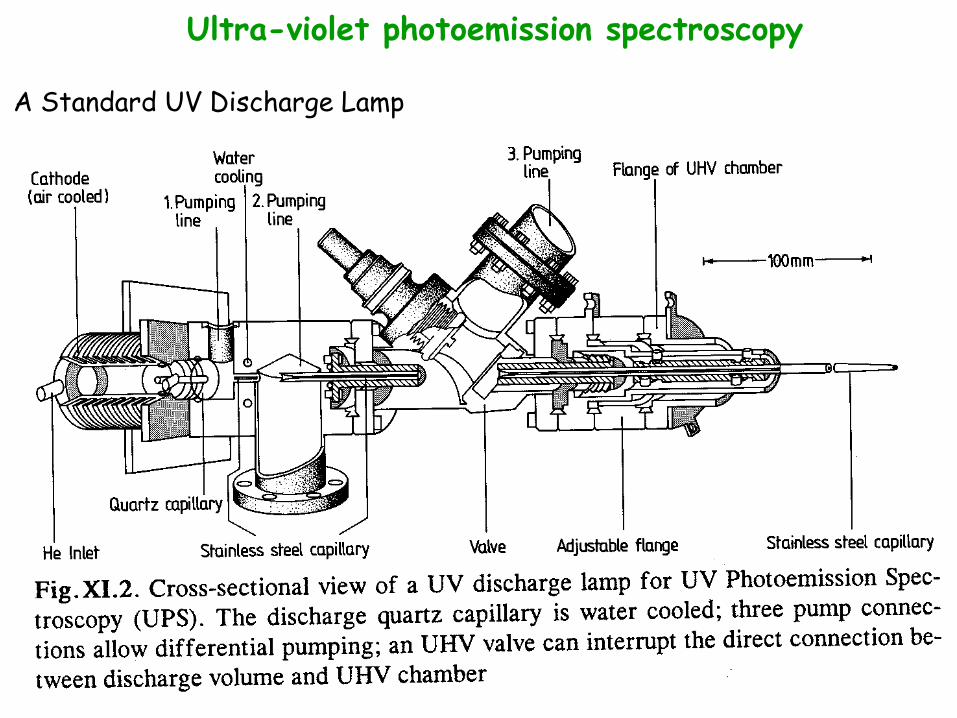
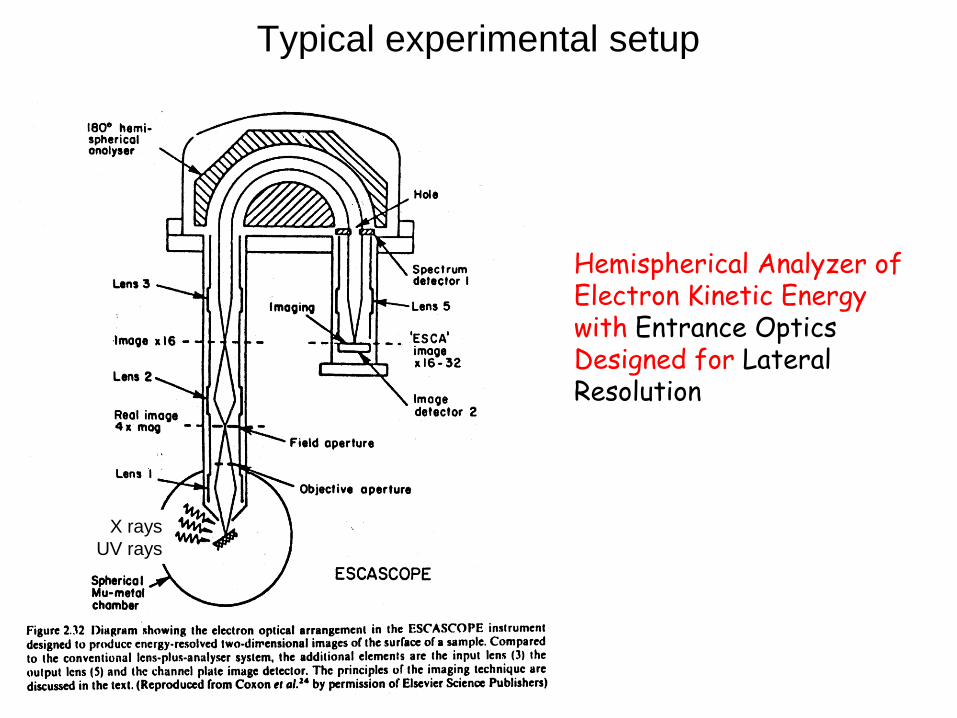
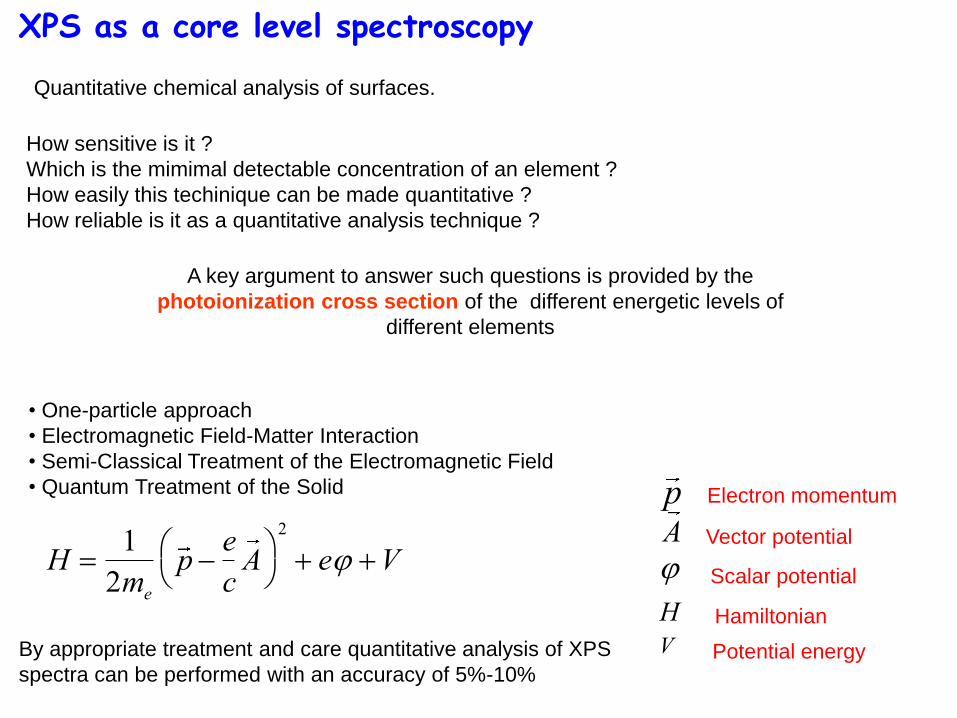

XPS ndash A few examples Core Levels and Core level shift
Wide XPS spectrum of graphite (C)
The singlet C 1s line is characterized by
1) A finite width reflecting instrumental
resolution lifetime broadening and other
many-body effects
2) A specific binding energy which reflects the
specific atomic species (C) in a specific
chemical environment (core level shift)
C(1s) region
The vacuum level would be a reference to
determine precisely Eb e DEb It is however quite
sensitive to work function changes due to
modification of the surface For the sake of
simplicity the Fermi level is often used because
it is apparent from the XPS spectrum itself
SENSIBILITArsquo CHIMICA
j l sQuantum Numbers
j Total Angular Momentum
l Orbital Angular Momentum
s Spin Angular Momentum p-symmetry state l = 1
s = plusmn12
Degeneracy = |2j+1|
XPS Core Levels and Spin-Orbit Splitting
Si(100) oxidized in O2 The Si 2p line is characterized by the occurrence of 5 chemically distinct components which reflect different chemical states of the Si atoms at the interface
XPS ndash A few examples Core Levels and Core level shifts
XPS ndash A few examples Core Levels and Core level shift
Si 2p32 Core level shift with resect to bulk Si for
a) Films of different thickness grown on Si(100) b) Films ( 5 Aring ) grown on different surfaces
XPS ndash A few examples Core Levels and Core level shift
Photoemission Spectroscopy Surface Core Level Shifts
Surface sensitivity is achieved by exploiting the inelastic mean free path vs hn
Below threshold high chance to penetrate bulk photoelectrons dominate
At the mimimum of the penetration depth the sensitivity to surface photoelectrons is maximised
Background Subtraction in Core Level Photemission Spectra 1) The yellow areas correspond in principle to the primary photoelectrons 2) The case of Shirley base-line corresponds to the integral line of the pristine spectrum
Mechanisms Governing the Line-
width and Line-asymmetry in
Photoemission Spectroscopy
How the Instrumental Resolution can be determined by measuring the Fermi Edge of a Metallic Sample
Ag 4d-related manyfold Ag 5(sp)-related manyfold
Photoemission Spectroscopy Valence Band States
Any valence band spectrum brings altogether contributions related to differing atomic sites and orbital symmetry Thereby one has to properly design ad hoc experiments aiming at disentangling the various spectral components Cooper Minimum Photoemission and Resonant Photoemission are two examples of such ad hoc experiments
Pt 5d bonding
Pt 5d anti bonding
Pt 5d non-bonding
Cooper Minimum Photoemission Possible when one of the valence band orbital shows a Cooper minimum in the photoionization cross section
Cooper minimum in the Pt 5d cross section
The Pt 5d and Si 3p cross sections are comparable
A joint analysis of VB photoemission spectra taken at and off the Cooper minimum enables to disentangle the differing site- and orbital-specific
contributions
Valence band photoemission
Usually excitation sources with less than 150 eV are employed (UV lamp or synchrotron
radiation)
Ultimate resolution ~15 meV with a conventional UV lamp
Small integration in k so that it is possible to measure the photoemision signal from a specific
part of the Brillouin zone
The valence band spectrum is characterised much better than with X-rays
UPS information Measurement of the valence band states of a surface (ARUPS)
Investigation of bands and molecular orbitals of the adsorbates
Angle Resolved UPS
Mapping of the valence band states vs wavevector
The small integration window in
k allows to sample continuously
the entire Brillouin Zone by
measuring the band structure in
the energy allowed range
Volume and surface states can
be identified
a) By comparison with theoretical
predictions
b) By their different behaviour
following gas adsorption (which
obviously affects only the surface
states)
Volume and surface states can be identified a) By comparison with theoretical predictions b) By their different behaviour following gas adsorption (which obviously affects only the surface states)
Chemisorbed C6H6
Condensed C6H6
Gas-phase C6H6
UPS for the study of adsorbed molecules
The comparison of spectra for benzene chemisorbed
on Ni(111) and for benzene condensed on the
same surface (ie for physisorbed benzene not
chemically bound to the surface) shows
1 at least three structures corresponding to the
molecular orbitals
2 A shift of the p orbital toward more negative
energies for the chemisorbed phase indicating
that interaction with the surface involves mainly
this orbital
The assignment of peaks due to adsorbates are
made mainly by comparison with theoretical
predictions or with experimental data available
either for the gas phase or for adsorption on
previously studied surfaces
Threshold Spettroscopies
In XPS the energy of the impinging photons may be much higher than the photoionization
threshold When operating with tunable sources (synchrotron) the energy of the photons is
chosen in such a way to maximise the photionization cross section and the surface sensitivity
Alternatively it is possible to study core levels looking for their photionization threshold by a
source at tunable energy The overcoming of the threshold for photoionization will be detected
either by a decrease of the impining flux or more often by the emission of photons or of Auger
electrons associated with the filling of the vacancies produced by the impinging photon beam
There are several tecniques employing different detection techniques They are collectively
addressed as APS (Appearance Potential Spectroscopy)
The excitation source (50 eV to several KeV) can be provided either by photons or by electrons
In the former case a synchrotron light osurce is needed
NEXAFS (Near Edge X-ray Absorption Fine Structure) opp XANES (X-ray Absorption Near Edge Structure)
In the near edge region the excitation probability
depends on the density of available empty states
which may be strongly modulated below and at the
vacuum level
Biatomic molecule
Keeping in mind the relevant selection rules the
transition of an 1s electron to p and levels is
modulated by the photon energy
Working with tunable X ray sources (Synchrotron Radiation) one may chose the energy at which
surface sensitivity is maximised
Alternatively one may look at the threshold energy and look for the onset of photoemission or
AES signals Such technique is called APS (Appearance Potential Spectroscopies)
Fig 3 Schematic potential (bottom) and corresponding NEXAFS
K-shell spectrum (top) of a diatomic molecular (sub)group In
addition to Rydberg states and a continuum of empty states
similar to those expected for atoms unfilled molecular orbitals
are present which is reflected in the absorption spectrum
NEXAFS (Near Edge X-ray Adsorption Fine Structure) opp XANES (X-ray Adsorption Near Edge Structure)
The threshold energies depend on the material
2p levels in non metals
K-edge (1s2p)= 285 eV for C
400 eV for N
530 eV for O
685 eV for F
3p levels in non metals
K-edge (1s3p)= 1830 eV for Si
2140 eV for P
2470 ev for S
2830 eV for Cl
L-edge (2p4s 3d) in the range 100-270 eV
3d metals LIIIII (2p 3d) lt1000 eV
K-egde (1s 4p) gt4500 eV
4d metals MIIIII (2p4d) lt1000 eV
K-edge (1s4p) gt4500 eV
Fig 1 Schematic molecular potentials (bottom) and K-edge
spectrum (top) of a diatomic molecule XY The K-edge features are
due to transitions from the ls core level of atom X to the following
partially filled or unfilled molecular orbitals p orbitals in the
bound state Rydberg states at energies just below the Fermi level
and resonances in the continuum state (From St6hr [1]
copyright Springer-Verlag)
h= incident photon energy
e m= charge and mass of electrons
(E)= energy density of the final state
Iltff|Ap|figt|=dipole matrix
(h+Ei-Ef)=delta function for the
conservation of energy
)()(14 2
2
2
22
fiifx EEhpAEhhc
e
m
h ff
p
X-ray absorption cross section
The matrix describes the dipolar interaction between the electron
(momentum p) and the electric field (vector potential A) The orientation
of the molecule determines the parity of initial state (generally a
symmetric s level) and final state Photoemission and hence X ray
absorption takes place only when the matrix element is even
Angular momentum conservation implies moreover Dl=plusmn1 between
initial and final state
Information about the molecular orientation
In the case of linearly polarized light the angular dependence of the matrix element of interest
assumes a simple form
For a 1s initial state and a directional final state orbital the matrix element
points in the direction of the final state orbital O and the transition intensity
becomes cos2
(with angle between the electric field vector e and the direction of the final state orbital)
Therefore the intensity of a resonance is largest when e lies along the direction of the final
state molecular orbital and vanishes when e is perpendicular to it
2
if pe ff
if p ff
Schematic representation of the origin of the angular
dependence of NEXAFS resonances for a p-bonded
diatomic molecule adsorbed with its molecular axis
normal to the surface As a result of the different
overlap between the electric field vector and the
direction of the final state orbitals the p -resonance is
maximized at normal incidence (left) while the -
resonance is maximized at grazing incidence (right)
Experimental detection of X-ray absorption
The absorption of a photon
implies the excitation of an
electron from a core level to the
valence state This excited state
will decay either by AES or by
photoluminescence and be
detected
Energy liberated in the de-excitation process
Fluorescence (f) Auger electron (a)
f+ a=1
Fluorescence
- Photon-in Photon-out technique no UHV required
- The penetration depth of photons vs electrons allows to distinguish between
bulk and surface processes
- It is insensitive to charging problems
But hellip measuring thresholds in the soft X-Ray region may be complicated
When the x-ray photon energy resonantly connects a core level with a narrow final state in a solid such as an exciton readily identifiable characteristic peaks will appear in the spectrum These narrow characteristic spectral peaks give the NEXAFS technique A lot of its analytical power is illustrated by the B 1s π exciton shown below
Experimental detection of X-ray absorption
In NEXAFS the final state of the photoelectron may be a bound state such as an exciton Measuring fluorescent photons or Auger electrons allows to tune the sensitivity of the technique The signal corresponds to the sum over all possible final states of the photoelectrons meaning that what NEXAFS measures is the total joint density of states of the initial core level with all final states which are consistent with the conservation rules
The great power of NEXAFS derives from its elemental specificity Because the various elements have different core level energies NEXAFS permits extraction of the signal from a surface monolayer or even a single buried layer in the presence of a huge background signal
Experimental detection of X-ray absorption
K-edge of O in 50 Aring NiO(100)Ni(100)
Comparing fluorecence and electron yield
The peak positions and the relative intensities of the O K-edge features are identical in the two measurements The NEXAFS features labeled A B and C are assigned to the one-electron transition to the 3eg 3a1g and 4t1u orbitals respectively The peaks labeled B and C are related to multielectron configuration interactions
Flourescence
Electron yield
Comparing fluorecence and electron yield the information you can get
NEXAFS The fluorescence yield remains unchanged after annealing to 800 K while the electron yield decreases Oxygen remains near the surface region (mean free path of the O K-edge photons 2000 Aring) The thickness of the O containing region is larger than the electron escape depth (10-15 Aring at 500 eV)
NiONi(100) Preparation at 300 K followed by annealing to T=800 K
NiO clusters + c(2times2) O chemisorbed phase the O signal decreases in AES or XPS
Such decrease can originate either because of the formation of thicker NiO(100) clusters or by diffusion of oxygen deep into the metal bulk Which one of the two
NEXAFS characterization of Molecules
NEXAFS spectra differ significantly even
for rather similar molecular structures so
that they can be used as a fingerprint of
each polymer In many cases enough is
known about how chemical structure and
X-ray absorption spectral features are
related to allow one to identify unknown
species from measured NEXAFS spectra
Individual spectral features particularly the
low energy p features are often sufficient
for qualitative identification in reasonably
well characterized systems and they can
serve as useful energies for selective
chemical contrast in X-ray microscopy
POLYMERS K-edge for C
Photoelectron Diffraction Basic Principles c(2x2)SNi(100)
Photoelectron Diffraction Basic Principles Condition of Constructive Interference
Chemically-Shifted P 2p Components of PFx Fragments Chemisorbed at the Ni (111) Surface
Photoelectron Diffraction Experiment vs Simulation PF3Ni(111)
Theoretical Simulations Best Fit
Experiment
Photoelectron Diffraction Experiment vs Simulation PF2Ni(111)
Theoretical Simulations Best Fit
Experiment
Photoelectron Diffraction Experiment vs Simulation PFNi(111)
Theoretical Simulations Best Fit
Experiment
2 photon photo emission 2PPE
For negative delays only the probe laser is in action Electrons are then promoted from bulk band to the n=1 and 2 image potential states by the 2PPE mechanism and pumped from there by a third photon The electrons in the surface Shockley state are photoemitted by the same 2PPE mechanism ending up at halfway between the n=1 and n=2 photoemission energies At time 0 the pump laser enters in action The n=0 state is then rapidly depleted of electrons (vanishing of the n=0 signal) Such electrons are promoted to the states n=1 and n=2 (increasing photoemission from such states induced by the probe laser) At positive delays the probe laser probes the surviving electron density ins taes n=1 and 2 The Xe layer decouples the image potential states from the Cu surface so that the lifetime of electrons in the image states becomes longer

XPS ndash A few examples Core Levels and Core level shift
Photoemission Spectroscopy Surface Core Level Shifts
Surface sensitivity is achieved by exploiting the inelastic mean free path vs hn
Below threshold high chance to penetrate bulk photoelectrons dominate
At the mimimum of the penetration depth the sensitivity to surface photoelectrons is maximised
Background Subtraction in Core Level Photemission Spectra 1) The yellow areas correspond in principle to the primary photoelectrons 2) The case of Shirley base-line corresponds to the integral line of the pristine spectrum
Mechanisms Governing the Line-
width and Line-asymmetry in
Photoemission Spectroscopy
How the Instrumental Resolution can be determined by measuring the Fermi Edge of a Metallic Sample
Ag 4d-related manyfold Ag 5(sp)-related manyfold
Photoemission Spectroscopy Valence Band States
Any valence band spectrum brings altogether contributions related to differing atomic sites and orbital symmetry Thereby one has to properly design ad hoc experiments aiming at disentangling the various spectral components Cooper Minimum Photoemission and Resonant Photoemission are two examples of such ad hoc experiments
Pt 5d bonding
Pt 5d anti bonding
Pt 5d non-bonding
Cooper Minimum Photoemission Possible when one of the valence band orbital shows a Cooper minimum in the photoionization cross section
Cooper minimum in the Pt 5d cross section
The Pt 5d and Si 3p cross sections are comparable
A joint analysis of VB photoemission spectra taken at and off the Cooper minimum enables to disentangle the differing site- and orbital-specific
contributions
Valence band photoemission
Usually excitation sources with less than 150 eV are employed (UV lamp or synchrotron
radiation)
Ultimate resolution ~15 meV with a conventional UV lamp
Small integration in k so that it is possible to measure the photoemision signal from a specific
part of the Brillouin zone
The valence band spectrum is characterised much better than with X-rays
UPS information Measurement of the valence band states of a surface (ARUPS)
Investigation of bands and molecular orbitals of the adsorbates
Angle Resolved UPS
Mapping of the valence band states vs wavevector
The small integration window in
k allows to sample continuously
the entire Brillouin Zone by
measuring the band structure in
the energy allowed range
Volume and surface states can
be identified
a) By comparison with theoretical
predictions
b) By their different behaviour
following gas adsorption (which
obviously affects only the surface
states)
Volume and surface states can be identified a) By comparison with theoretical predictions b) By their different behaviour following gas adsorption (which obviously affects only the surface states)
Chemisorbed C6H6
Condensed C6H6
Gas-phase C6H6
UPS for the study of adsorbed molecules
The comparison of spectra for benzene chemisorbed
on Ni(111) and for benzene condensed on the
same surface (ie for physisorbed benzene not
chemically bound to the surface) shows
1 at least three structures corresponding to the
molecular orbitals
2 A shift of the p orbital toward more negative
energies for the chemisorbed phase indicating
that interaction with the surface involves mainly
this orbital
The assignment of peaks due to adsorbates are
made mainly by comparison with theoretical
predictions or with experimental data available
either for the gas phase or for adsorption on
previously studied surfaces
Threshold Spettroscopies
In XPS the energy of the impinging photons may be much higher than the photoionization
threshold When operating with tunable sources (synchrotron) the energy of the photons is
chosen in such a way to maximise the photionization cross section and the surface sensitivity
Alternatively it is possible to study core levels looking for their photionization threshold by a
source at tunable energy The overcoming of the threshold for photoionization will be detected
either by a decrease of the impining flux or more often by the emission of photons or of Auger
electrons associated with the filling of the vacancies produced by the impinging photon beam
There are several tecniques employing different detection techniques They are collectively
addressed as APS (Appearance Potential Spectroscopy)
The excitation source (50 eV to several KeV) can be provided either by photons or by electrons
In the former case a synchrotron light osurce is needed
NEXAFS (Near Edge X-ray Absorption Fine Structure) opp XANES (X-ray Absorption Near Edge Structure)
In the near edge region the excitation probability
depends on the density of available empty states
which may be strongly modulated below and at the
vacuum level
Biatomic molecule
Keeping in mind the relevant selection rules the
transition of an 1s electron to p and levels is
modulated by the photon energy
Working with tunable X ray sources (Synchrotron Radiation) one may chose the energy at which
surface sensitivity is maximised
Alternatively one may look at the threshold energy and look for the onset of photoemission or
AES signals Such technique is called APS (Appearance Potential Spectroscopies)
Fig 3 Schematic potential (bottom) and corresponding NEXAFS
K-shell spectrum (top) of a diatomic molecular (sub)group In
addition to Rydberg states and a continuum of empty states
similar to those expected for atoms unfilled molecular orbitals
are present which is reflected in the absorption spectrum
NEXAFS (Near Edge X-ray Adsorption Fine Structure) opp XANES (X-ray Adsorption Near Edge Structure)
The threshold energies depend on the material
2p levels in non metals
K-edge (1s2p)= 285 eV for C
400 eV for N
530 eV for O
685 eV for F
3p levels in non metals
K-edge (1s3p)= 1830 eV for Si
2140 eV for P
2470 ev for S
2830 eV for Cl
L-edge (2p4s 3d) in the range 100-270 eV
3d metals LIIIII (2p 3d) lt1000 eV
K-egde (1s 4p) gt4500 eV
4d metals MIIIII (2p4d) lt1000 eV
K-edge (1s4p) gt4500 eV
Fig 1 Schematic molecular potentials (bottom) and K-edge
spectrum (top) of a diatomic molecule XY The K-edge features are
due to transitions from the ls core level of atom X to the following
partially filled or unfilled molecular orbitals p orbitals in the
bound state Rydberg states at energies just below the Fermi level
and resonances in the continuum state (From St6hr [1]
copyright Springer-Verlag)
h= incident photon energy
e m= charge and mass of electrons
(E)= energy density of the final state
Iltff|Ap|figt|=dipole matrix
(h+Ei-Ef)=delta function for the
conservation of energy
)()(14 2
2
2
22
fiifx EEhpAEhhc
e
m
h ff
p
X-ray absorption cross section
The matrix describes the dipolar interaction between the electron
(momentum p) and the electric field (vector potential A) The orientation
of the molecule determines the parity of initial state (generally a
symmetric s level) and final state Photoemission and hence X ray
absorption takes place only when the matrix element is even
Angular momentum conservation implies moreover Dl=plusmn1 between
initial and final state
Information about the molecular orientation
In the case of linearly polarized light the angular dependence of the matrix element of interest
assumes a simple form
For a 1s initial state and a directional final state orbital the matrix element
points in the direction of the final state orbital O and the transition intensity
becomes cos2
(with angle between the electric field vector e and the direction of the final state orbital)
Therefore the intensity of a resonance is largest when e lies along the direction of the final
state molecular orbital and vanishes when e is perpendicular to it
2
if pe ff
if p ff
Schematic representation of the origin of the angular
dependence of NEXAFS resonances for a p-bonded
diatomic molecule adsorbed with its molecular axis
normal to the surface As a result of the different
overlap between the electric field vector and the
direction of the final state orbitals the p -resonance is
maximized at normal incidence (left) while the -
resonance is maximized at grazing incidence (right)
Experimental detection of X-ray absorption
The absorption of a photon
implies the excitation of an
electron from a core level to the
valence state This excited state
will decay either by AES or by
photoluminescence and be
detected
Energy liberated in the de-excitation process
Fluorescence (f) Auger electron (a)
f+ a=1
Fluorescence
- Photon-in Photon-out technique no UHV required
- The penetration depth of photons vs electrons allows to distinguish between
bulk and surface processes
- It is insensitive to charging problems
But hellip measuring thresholds in the soft X-Ray region may be complicated
When the x-ray photon energy resonantly connects a core level with a narrow final state in a solid such as an exciton readily identifiable characteristic peaks will appear in the spectrum These narrow characteristic spectral peaks give the NEXAFS technique A lot of its analytical power is illustrated by the B 1s π exciton shown below
Experimental detection of X-ray absorption
In NEXAFS the final state of the photoelectron may be a bound state such as an exciton Measuring fluorescent photons or Auger electrons allows to tune the sensitivity of the technique The signal corresponds to the sum over all possible final states of the photoelectrons meaning that what NEXAFS measures is the total joint density of states of the initial core level with all final states which are consistent with the conservation rules
The great power of NEXAFS derives from its elemental specificity Because the various elements have different core level energies NEXAFS permits extraction of the signal from a surface monolayer or even a single buried layer in the presence of a huge background signal
Experimental detection of X-ray absorption
K-edge of O in 50 Aring NiO(100)Ni(100)
Comparing fluorecence and electron yield
The peak positions and the relative intensities of the O K-edge features are identical in the two measurements The NEXAFS features labeled A B and C are assigned to the one-electron transition to the 3eg 3a1g and 4t1u orbitals respectively The peaks labeled B and C are related to multielectron configuration interactions
Flourescence
Electron yield
Comparing fluorecence and electron yield the information you can get
NEXAFS The fluorescence yield remains unchanged after annealing to 800 K while the electron yield decreases Oxygen remains near the surface region (mean free path of the O K-edge photons 2000 Aring) The thickness of the O containing region is larger than the electron escape depth (10-15 Aring at 500 eV)
NiONi(100) Preparation at 300 K followed by annealing to T=800 K
NiO clusters + c(2times2) O chemisorbed phase the O signal decreases in AES or XPS
Such decrease can originate either because of the formation of thicker NiO(100) clusters or by diffusion of oxygen deep into the metal bulk Which one of the two
NEXAFS characterization of Molecules
NEXAFS spectra differ significantly even
for rather similar molecular structures so
that they can be used as a fingerprint of
each polymer In many cases enough is
known about how chemical structure and
X-ray absorption spectral features are
related to allow one to identify unknown
species from measured NEXAFS spectra
Individual spectral features particularly the
low energy p features are often sufficient
for qualitative identification in reasonably
well characterized systems and they can
serve as useful energies for selective
chemical contrast in X-ray microscopy
POLYMERS K-edge for C
Photoelectron Diffraction Basic Principles c(2x2)SNi(100)
Photoelectron Diffraction Basic Principles Condition of Constructive Interference
Chemically-Shifted P 2p Components of PFx Fragments Chemisorbed at the Ni (111) Surface
Photoelectron Diffraction Experiment vs Simulation PF3Ni(111)
Theoretical Simulations Best Fit
Experiment
Photoelectron Diffraction Experiment vs Simulation PF2Ni(111)
Theoretical Simulations Best Fit
Experiment
Photoelectron Diffraction Experiment vs Simulation PFNi(111)
Theoretical Simulations Best Fit
Experiment
2 photon photo emission 2PPE
For negative delays only the probe laser is in action Electrons are then promoted from bulk band to the n=1 and 2 image potential states by the 2PPE mechanism and pumped from there by a third photon The electrons in the surface Shockley state are photoemitted by the same 2PPE mechanism ending up at halfway between the n=1 and n=2 photoemission energies At time 0 the pump laser enters in action The n=0 state is then rapidly depleted of electrons (vanishing of the n=0 signal) Such electrons are promoted to the states n=1 and n=2 (increasing photoemission from such states induced by the probe laser) At positive delays the probe laser probes the surviving electron density ins taes n=1 and 2 The Xe layer decouples the image potential states from the Cu surface so that the lifetime of electrons in the image states becomes longer
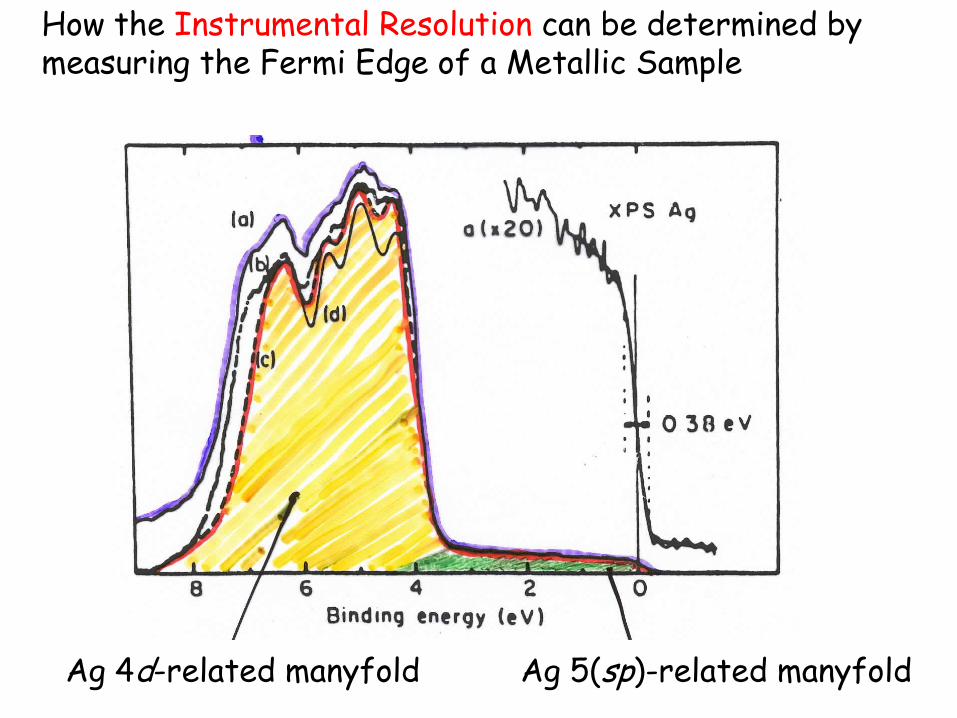
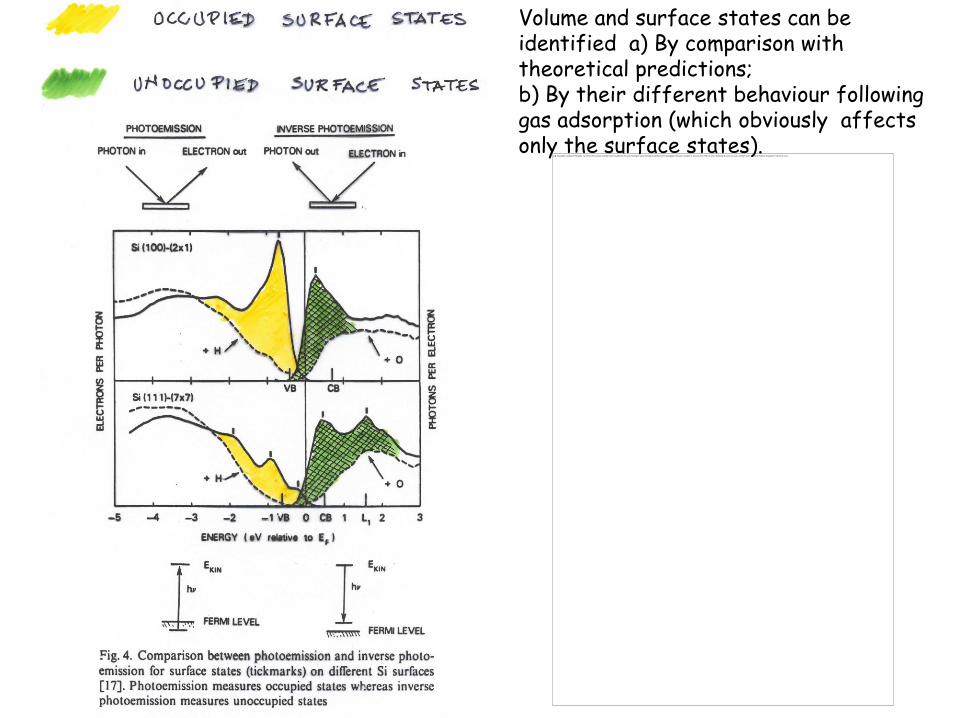

Experimental detection of X-ray absorption
The absorption of a photon
implies the excitation of an
electron from a core level to the
valence state This excited state
will decay either by AES or by
photoluminescence and be
detected
Energy liberated in the de-excitation process
Fluorescence (f) Auger electron (a)
f+ a=1
Fluorescence
- Photon-in Photon-out technique no UHV required
- The penetration depth of photons vs electrons allows to distinguish between
bulk and surface processes
- It is insensitive to charging problems
But hellip measuring thresholds in the soft X-Ray region may be complicated
When the x-ray photon energy resonantly connects a core level with a narrow final state in a solid such as an exciton readily identifiable characteristic peaks will appear in the spectrum These narrow characteristic spectral peaks give the NEXAFS technique A lot of its analytical power is illustrated by the B 1s π exciton shown below
Experimental detection of X-ray absorption
In NEXAFS the final state of the photoelectron may be a bound state such as an exciton Measuring fluorescent photons or Auger electrons allows to tune the sensitivity of the technique The signal corresponds to the sum over all possible final states of the photoelectrons meaning that what NEXAFS measures is the total joint density of states of the initial core level with all final states which are consistent with the conservation rules
The great power of NEXAFS derives from its elemental specificity Because the various elements have different core level energies NEXAFS permits extraction of the signal from a surface monolayer or even a single buried layer in the presence of a huge background signal
Experimental detection of X-ray absorption
K-edge of O in 50 Aring NiO(100)Ni(100)
Comparing fluorecence and electron yield
The peak positions and the relative intensities of the O K-edge features are identical in the two measurements The NEXAFS features labeled A B and C are assigned to the one-electron transition to the 3eg 3a1g and 4t1u orbitals respectively The peaks labeled B and C are related to multielectron configuration interactions
Flourescence
Electron yield
Comparing fluorecence and electron yield the information you can get
NEXAFS The fluorescence yield remains unchanged after annealing to 800 K while the electron yield decreases Oxygen remains near the surface region (mean free path of the O K-edge photons 2000 Aring) The thickness of the O containing region is larger than the electron escape depth (10-15 Aring at 500 eV)
NiONi(100) Preparation at 300 K followed by annealing to T=800 K
NiO clusters + c(2times2) O chemisorbed phase the O signal decreases in AES or XPS
Such decrease can originate either because of the formation of thicker NiO(100) clusters or by diffusion of oxygen deep into the metal bulk Which one of the two
NEXAFS characterization of Molecules
NEXAFS spectra differ significantly even
for rather similar molecular structures so
that they can be used as a fingerprint of
each polymer In many cases enough is
known about how chemical structure and
X-ray absorption spectral features are
related to allow one to identify unknown
species from measured NEXAFS spectra
Individual spectral features particularly the
low energy p features are often sufficient
for qualitative identification in reasonably
well characterized systems and they can
serve as useful energies for selective
chemical contrast in X-ray microscopy
POLYMERS K-edge for C
Photoelectron Diffraction Basic Principles c(2x2)SNi(100)
Photoelectron Diffraction Basic Principles Condition of Constructive Interference
Chemically-Shifted P 2p Components of PFx Fragments Chemisorbed at the Ni (111) Surface
Photoelectron Diffraction Experiment vs Simulation PF3Ni(111)
Theoretical Simulations Best Fit
Experiment
Photoelectron Diffraction Experiment vs Simulation PF2Ni(111)
Theoretical Simulations Best Fit
Experiment
Photoelectron Diffraction Experiment vs Simulation PFNi(111)
Theoretical Simulations Best Fit
Experiment
2 photon photo emission 2PPE
For negative delays only the probe laser is in action Electrons are then promoted from bulk band to the n=1 and 2 image potential states by the 2PPE mechanism and pumped from there by a third photon The electrons in the surface Shockley state are photoemitted by the same 2PPE mechanism ending up at halfway between the n=1 and n=2 photoemission energies At time 0 the pump laser enters in action The n=0 state is then rapidly depleted of electrons (vanishing of the n=0 signal) Such electrons are promoted to the states n=1 and n=2 (increasing photoemission from such states induced by the probe laser) At positive delays the probe laser probes the surviving electron density ins taes n=1 and 2 The Xe layer decouples the image potential states from the Cu surface so that the lifetime of electrons in the image states becomes longer
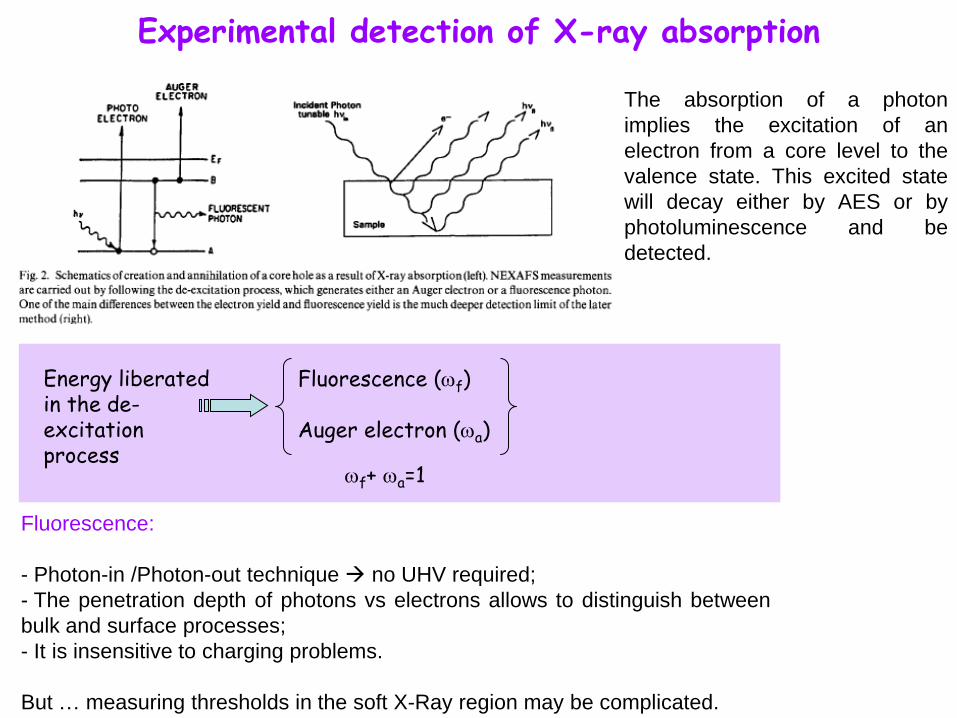
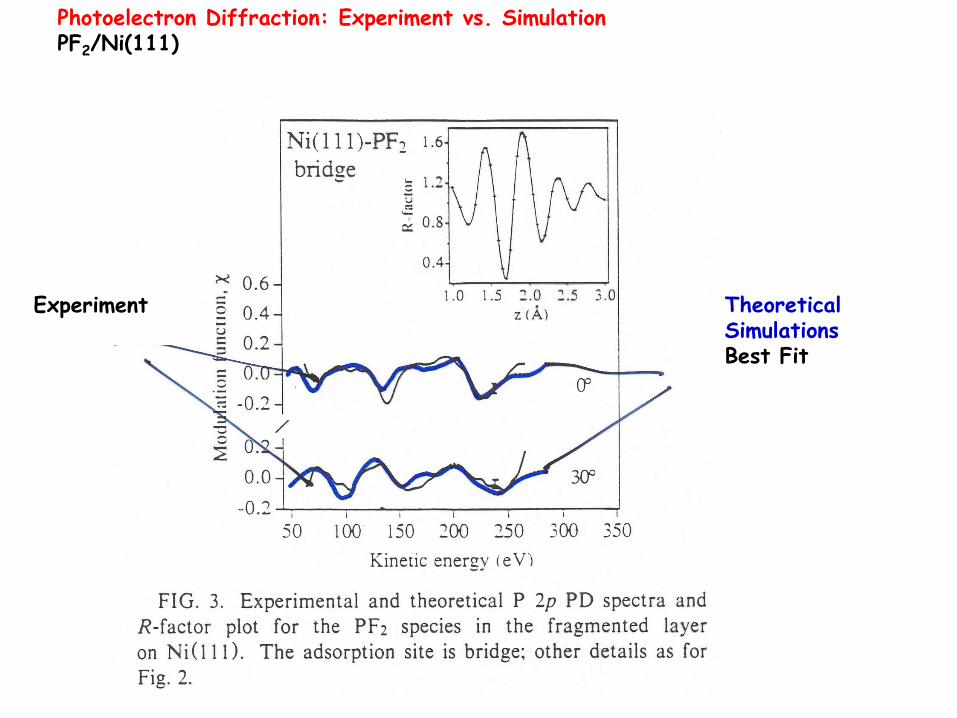

For negative delays only the probe laser is in action Electrons are then promoted from bulk band to the n=1 and 2 image potential states by the 2PPE mechanism and pumped from there by a third photon The electrons in the surface Shockley state are photoemitted by the same 2PPE mechanism ending up at halfway between the n=1 and n=2 photoemission energies At time 0 the pump laser enters in action The n=0 state is then rapidly depleted of electrons (vanishing of the n=0 signal) Such electrons are promoted to the states n=1 and n=2 (increasing photoemission from such states induced by the probe laser) At positive delays the probe laser probes the surviving electron density ins taes n=1 and 2 The Xe layer decouples the image potential states from the Cu surface so that the lifetime of electrons in the image states becomes longer