
PHOSPHATE CRISTALLISATION PROCESS FOR P … · RECOVERY APPLIED AT TREVISO MUNICIPAL WASTEWATER...
64
PHOSPHATE CRISTALLISATION PROCESS FOR P RECOVERY APPLIED AT TREVISO MUNICIPAL WASTEWATER TREATMENT PLANT [ITALY] Franco Cecchi – University of Verona Paolo Battistoni, Raffaella Boccadoro – Marche Polytechnical University
Transcript of PHOSPHATE CRISTALLISATION PROCESS FOR P … · RECOVERY APPLIED AT TREVISO MUNICIPAL WASTEWATER...

PHOSPHATE CRISTALLISATION PROCESS FOR P
RECOVERY APPLIED AT TREVISO MUNICIPAL
WASTEWATER TREATMENT PLANT
[ITALY]
Franco Cecchi – University of Verona
Paolo Battistoni, Raffaella Boccadoro – Marche Polytechnical University
UTILISATEUR
Text Box
2003

INTRODUCTION AND STATE OF THE ART ............................................................ 4
P in sewage works ..........................................................................................................................4 P-recovery experience to date.....................................................................................................6 P-precipitation modelling..............................................................................................................6
OBJECTIVES OF EXPERIMENTAL WORK.............................................................. 8
DESCRIPTION OF EXPERIMENTAL WORK .......................................................... 12
Natural ageing tests............................................................................................................................12 Supersaturation test ............................................................................................................................13 Chemical analysis in wastewater .......................................................................................................13 Chemical analysis on silica ................................................................................................................14 Particle size analysis on silica............................................................................................................14 Bed porosity .......................................................................................................................................15 Test V’10............................................................................................................................................15 DEMONSTRATIVE AREA FOR STRUVITE CRYSTALLIZATION ................................................15 MONITORING AND ON-LINE DATA ACQUISITION............................................................19 SAMPLE COLLECTION...............................................................................................20 DATA SHEET ..........................................................................................................21
RESULTS AND DISCUSSION ................................................................................. 22
START UP..............................................................................................................22 Characteristics of the loaded sand......................................................................................................22 Operational parameters ......................................................................................................................22 Hydraulic tests....................................................................................................................................24 Air stripping test ................................................................................................................................24 PRELIMINARY TESTS ...............................................................................................25 Natural ageing tests............................................................................................................................25 Supersaturation tests ..........................................................................................................................28 METHODOLOGY USED IN THE STUDY OF CRYSTALLISATION TESTS ......................................35 FIRST PERIOD........................................................................................................35 Operational parameters ......................................................................................................................35 Inlet and outlet concentrations ...........................................................................................................36 Control of the fluidised bed ...............................................................................................................38 Model control and process performances ..........................................................................................39 THE SUBSTITUTION OF DORTMUND DEVICE ..................................................................41 SECOND PERIOD.....................................................................................................44 Operational parameters ......................................................................................................................44 Inlet and outlet concentrations ...........................................................................................................45 Control of the fluidised bed ...............................................................................................................45 Used sand analysis .............................................................................................................................46 Process performances and model control...........................................................................................48 SAND BED REPLACEMENT..........................................................................................48

THIRD PERIOD.......................................................................................................49 Operational parameters ......................................................................................................................49 Inlet and outlet concentrations ...........................................................................................................50 Control of bed fluidity .......................................................................................................................51 Used sand analysis .............................................................................................................................52 Parameters for agricultural re-use ......................................................................................................55 Process performances and model control...........................................................................................56 DESIGN OF A DEVICE FOR FOAM CAPTURE ....................................................................60
CONCLUSIONS ....................................................................................................... 61
REFERENCES ......................................................................................................... 63
ACKNOWLEDGEMENTS ........................................................................................ 64

Cecchi, Battistoni, Boccadoro, 2003, page 4
Introduction and state of the art P in sewage works To date, phosphorous recovery from liquors within civil wastewater treatment plants is mainly achieved working on supernatants coming from the sludge anaerobic digestion section: other processes working on sludge incineration ash are not considered here. To reach high contents of soluble phosphates in this liquor stream, biological nutrient removal must be applied in the wastewater treatment line, which has to be planned considering that P release have to be carried out in a controlled way in one single point of the process, in order to have low volume P-rich streams to treat. This situation is typical for Europe, Northern America and South Africa, but not for Italy, mainly because of low phosphorous content in sewage and also of the low content in readily biodegradable carbon (RBCOD) in wastewaters. The Italian situation of the existing wastewater treatment plants working on a nutrient removal basis can be evaluated starting from a national survey carried out in 1996, which took into account 13 regions out of 20 and plants with a capacity >50.000 PE. In particular, over the 157 plants considered, 77% use the primary settling option for nutrient removal, while the other 23% don’t. 52% reach an effective N removal, even if the process schemes consider only nitrification (called shortly N, 27%) or pre denitrification-nitrification (shortly DN, 66%), and 7% works on a BNR process basis. In other words, only 6 plants are actually working as BNR in the whole country, even if the fraction is continuously increasing to comply the EC directive 271/91. The predominant processes among the existing BNR plants are the A2O and Phostrip configurations. The optimisation of a process for P recovery from municipal wastewater is linked to the evaluation of the real problems concerning the management of the biological nutrient removal (BNR) process. In BNR plants, P is released in the anaerobic step when an adequate concentration of VFA or, more generally speaking, RBCOD is present. The rate of P release is linked to:
• the treatment scheme, • the operational conditions of the single unit operations; • the physical-chemical characteristics of the inlet.
P release phenomenon is always massive, and it can equal the P removed in water line. P is mainly present in sludge line, thus an adequate treatment of waste sludge or, at least, of supernatants, before recycling to headworks, is necessary. The planning strategy of the sludge line must pursue the double aim to restrain the release rate and to concentrate it in a single point of the line for the ultimate removal. This can be obtained using a process scheme in which the waste activated sludge (WAS) is thickened separately from the primary one (PS). Then, it can be treated to avoid supernatants release (i.e. composting, landfill, incineration) or to increase it (i.e. anaerobic treatment) in order to concentrate phosphorous in the supernatants and thus leading to a lower flow to treat (Randal et al., 1992). This approach is linked to the fact that primary sludge is a good C source, which can be used for the P release step: thus both settling and gravitational thickening of mixed sludge should be avoided in a BNR process approach. Evidences in this field came from the monitoring of full scale plants in which the gravitational thickening of WAS alone in short times (HRT=10-25 h) led to small P release (2-4%, example A and D in Table 1), while settling and thickening of mixed sludge showed releases in the order of 40% (examples A1, B, C, e D1 e D2 – Table 1). In the anaerobic digestion process P release is mainly due to the high concentration of VFA, which generally is present in this process. Moreover, biologically active ions, such as potassium (K) and magnesium (Mg) are widely

Cecchi, Battistoni, Boccadoro, 2003, page 5
released. This release follows the molar ratios, which range from 0.3 m K/m P to 0.26 m Mg/m P (Popel and Jardin, 1993; Wentzel et al., 1992).
Table 1 - Phosphorus release in primary sedimentation and thickening
WWTP Process Unit operation P released, (%) P, (mg/l) References A BNR WAS thickening 4 20 Randal et al., 1992 A1 BNR WAS thickening 22 12 Randal et al., 1992 B BNR Mixed primary sedimentation 43 Randal et al., 1992 C BNR WAS +PS thickening 42 60-100 Murakami et al., 1987 D BNR WAS thickening 1.9 9.8 Tanaka et al., 1987 D1 BNR WAS + PS thickening (1/1) 37 64-131 Tanaka et al., 1987 D2 BNR WAS + PS thickening (2/1) 34 64-131 Tanaka et al., 1987
The total amount of P released in the digester can be different from the quantity actually recycled to headworks, because re-precipitation processes may occur. Thus, the maximum release observed in conventional plants is up to 20%, while it reaches 43-63 % in BNR plants at medium-high P content in sludge, and can reach 95% in plants in which P content in sludge is 7%TS. The released amount observed in real plants shows values which can differ a lot one from another. This can be ascribed to:
the alkalinity of the inflow water, since this controls the re-precipitation processes of phosphorous inside the digester;
The ratio between supernatant flow rates and inflow flowrate, which can vary significantly if sludge pre-thickening prior to digestion is applied or not.
Re-precipitation can take place mainly as struvite (MAP: MgNH4PO4) or hydroxylapatite (HAP: Ca5OH(PO3)3). Some other forms of minerals are hypothesized, such as vivianite (Fe2(PO4)3∗8H2O) and bruscite (CaHPO4∗2H2O) (Nancollas, 1984). Struvite precipitation, which is thermodynamically more unfavourable than hydroxylapatite precipitation (Kps = 12.6 vs 57.8 respectively), is kinetically promoted by the high pH of the supernatant (7,4 - 7,9) and also by the inhibition of alkalinity on the hydroxylapatite crystallisation (Jenkins et al., 1971). Phosphate removal from supernatants or from the main stream leading to the production of a recyclable material in the form of phosphate pellets should be desirable; in particular, if pellets with a low water content and a relatively high P content are obtained, which can be used either directly as fertiliser or as a raw material for the phosphate industry for production of industrial products (e.g. cleaning products, chemicals, fire retardants, etc.). In this way the costs of phosphorus removal treatment could be offset by the gain of a recyclable phosphate product and the reduction of sludge disposal costs, due to decreased sludge amount and volume. However it is necessary to bring under control the formation of very small recovered phosphate particles, the so called “fines”, as these cannot be recovered and/or could generate a non-manageable sludge instead of a reusable product: in this situation the plant configuration may become more complex. Key issues for reactor design for phosphate precipitation are thus kinetics (ensuring mixing but avoiding abrasion) and flowrates (which define reactor size and consequently costs). The objectives are to obtain a reasonably high level of phosphate removal from solution by precipitation (about 80-90%) and to establish a reactor design characterised by simplicity, robustness and low costs compatible with wastewater treatment plant operation. Moreover it is essential to define how operating parameters can be adapted to specific plant conditions, with particular concern for suspended solids, by varying phosphate concentrations, temperature and other components and to establish the reliable production of a reusable product.

Cecchi, Battistoni, Boccadoro, 2003, page 6
P-recovery experience to date Among the different processes devised to extract phosphorus from wastewater crystallization in a dedicated reactor can be mentioned (Stratful et al., 1999): the DHV CrystalactorTM, the Rim-Nut ion exchange process, the Unitika Phosnix process and the Kurita fixed bed crystallization. The DHV CrystalactorTM system (Eggers et al., 1991) consists of a cascade degasifier using acid addition, a fluidized bed reactor and two pressure filters. The process is based on a fluidized reactor, in which NaOH and calcium are added, then calcium phosphate crystallizes on a seeding grain, typically sand. During the operation the pellets increase in diameter and are removed and replaced by smaller ones once they have reached the desired size. Some amorphous phosphate is lost in a suspended form (carry-over of fines), therefore a dual media filtration is required, along with the acid/alkali dosing this incurs additional capital and operational costs. The RIM-NUT ion exchange precipitation process (Liberti et al., 1986) removes phosphate and ammonia ions from tertiary wastewater producing ammonium phosphate (struvite, NH4MgPO4). The process consists of three stages (two columns of cationic resin, two columns of anionic resin and the nutrient precipitation process). A dual column system is adopted for each resin to allow regeneration simultaneously with nutrient removal. The Phosnix process (Unitika Ltd., 1994) is a side stream process, and treats phosphorus enriched wastewater (effluent from digesters, fermenters, biological nutrient removal systems). Digester effluent is fed into the base of the tower where it is mixed with magnesium chloride. Caustic soda is dosed to ensure a pH in the range 8.5-9, thus the conditions for spontaneous nucleation and growth of struvite crystals are obtained. The Kurita fixed bed crystallization column (Joko, 1984) is based on similar chemistry to the DHV CrystalactorTM. The equipment consists in a fixed bed column reactor, packed with phosphate rock seeding grains. Secondary effluent is fed into the base of the column and travels upwards through the column. The phosphate depleted effluents leave the top of the column. All the above mentioned techniques are worthy, but need the addiction of chemical reagents to adjust pH, in order to allow the precipitation of phosphate salts. This research group has devised a phosphate removal technique by exclusively using the chemical - physical properties of anaerobic supernatants without any addition of chemicals, reaching the operational pH only by aeration, and obtaining a quantitative removal of phosphate through nucleation on sand quartz by CO2 air stripping (Cecchi et al., 1994; Battistoni et al., 1996; Battistoni et al., 1997). The crystallization of phosphorus salts like hydroxylapatite (Ca5(PO4)3OH - HAP) and/or struvite (MgNH4PO4-MAP) has been studied in a fluidized bed reactors (FBR) both on a bench scale (Battistoni et al., 1998a; Battistoni et al., 2000) and on semi scale pilot plant (Battistoni et al., 2001). Furthermore, the efficiency of the process was related to pH and to sand contact time. A double saturational model was able to describe nucleation and conversion processes. P-precipitation modelling Several models are available in the literature to describe phosphorus precipitation process; they include:
models based on primary nucleation mechanism (i.e. nucleation is caused by pure supersaturation)
models based on secondary nucleation mechanisms (i.e. nucleation and growth take place on pre-existent seeds, in meta-stable supersaturation conditions).

Cecchi, Battistoni, Boccadoro, 2003, page 7
The work by Seckler et al. (1996 a,b,c) belongs to the first group, proposing a theoretical model for fine particle aggregation with sand grains. The following equation, deriving from a particle number balance, expresses the decrease in the fines concentration by aggregation with grains in a fluidised bed:
βBJdt
dNii
i −= Eq. 1
where Ni is the initial particle concentration, B is the collision efficiency, Jii is the collision frequency, β is the supersaturation and t is the reaction time, which is expressed by:
supνεxt =
Eq. 2
where ε is the bed porosity, x is the axial position and νsup is the superficial velocity. The supersaturation is defined as:
( ) ( )SP
234
32
KPOCa
51 −+ ⋅
=β ln Eq. 3
where KSP is the solubility product of amorphous calcium phosphate. The collision efficiency B is derived from the following expression, which describes the influence of the energy dissipation rate (E):
α
00 E
EBB ⎟⎟⎠
⎞⎜⎜⎝
⎛=
Eq. 4
where E0 is a reference value and B0 and α are parameters typical for the precipitating system. By integrating Eq.(4) between t=0 to t=tout, the phosphate removal efficiency ηag (due to aggregation only) can be calculated, assuming the particle size of the fines to be constant with time:
ini
outiiniag N
NN
,
,, −=η
Eq. 5
It was found, both theoretically and experimentally, that aggregation can be increased by spreading the supersaturation more evenly throughout the reactor, while the breakage can be reduced by choosing fluidisation conditions where the energy dissipation rate in the bed is minimised. As for the models based on secondary nucleation mechanism, De Rooij et al. (1984) studied the formation of different phases of calcium phosphates on a seed material in well defined experimental conditions, such as a fixed value of temperature (T=37ºC), ionic strength (I=0.10 mol/l), Ca/P ratio (Ca/P=1.333) and for various pH values (5<pH<8). The model obtained is described by the following equation:
p1/νSP
1/ν )Kks(IPdtdm
−= Eq. 6
where m is the number of precipitated moles, k is the rate constant for crystallisation, s a factor proportional to the number of sites available for growth, p the effective order of reaction, ν the number of ions in the formula unit, IP the ionic product of supersaturated solution and KSP the thermodynamic solubility product. The Gibbs free energy related to the transfer from a supersaturated solution to an assumed saturated solution at the surface of the developing solid phase, gives the relationship between IP and Kso (De Rooij et al., 1984).

Cecchi, Battistoni, Boccadoro, 2003, page 8
Kaneko and Nakajima (1988), in order to describe the crystal growth of HAP, starting from a metastable condition of synthetic water solutions in which the dependence of pH is not present, gave an approximation of Eq. (6) expressed as
2ksCdtdC
= Eq. 7
where C is the molar concentration and t is the retention time. Since it was demonstrated that for the crystallisation of MAP and HAP from anaerobic supernatants in fixed bed reactors FBR works in conditions of meta-stability (Battistoni et al., 1998b), the approximation made by Kaneko and Nakajima (1988) is suitable. This kinetic equation can be integrated from 0 to t, leading to the empirical saturational model in the contact time (tc) (Eq. 8) of crystallisation efficiency η(Battistoni et al., 2000):
c
cm tt
tE+
=2/1
η Eq. 8
Moreover, the maximum crystallisation efficiency (Em) and the half time (t1/2) can be introduced:
0
t0m C
CCE
−=
Eq. 9
( ) kCC1t
t01/2 ⋅−
= Eq. 10
where Ct is the ultimate concentration and C0 the initial concentration. Objectives of experimental work The SCP demonstrative area have been realized at the Treviso WWTP. The Treviso WWTP, in the actual status, is the result of extension works to guarantee the observance of the limits fixed by the instruction CEE/91/271 for sensitive areas. The scheme of fig.1 shows the full logic of the plant, in which the RBCOD production (by fermentation of organic fraction of municipal solid waste) and the phosphorus removal from the supernatants (by struvite crystallization) are assigned to two specific demon

Cecchi, Battistoni, Boccadoro, 2003, page 9
Fig.1: Treviso WWTP full logic flow

Cecchi, Battistoni, Boccadoro, 2003, page 10
The Treviso WWTP is structured as follows: • A new 50000 PE line able to remove C, N and P by a BNR process, according to the
Phoredox scheme with three phases and Johannesburg modification; • Adaptation of the existent line to permit the nitrification and the C removal, in order to
extend the potential of the plant up to 70000 PE and to respect the limits fixed by the Veneto PRRA (Regional Water Reclamation Plan);
• Adaptation of the sludge line to the new potential. The SCP demonstrative area has the aim to remove phosphorus of the supernatants coming from the dewatering section fed with sludge coming from the anaerobic digester. The Treviso WWTP digester works with co-digestion of waste activated sludge (WAS) and solids coming from organic fraction of municipal solid wastes fermentation: these are the optimal conditions to have high P release. The idea is to treat, in fluidised bed reactor, the secondary stream coming from the dewatering section, enriched in phosphorus, to remove P by crystallization and to recover it as fertilizer. In particular pH conditions, the phosphorus of the supernatants can crystallize as struvite (MAP, MgNH4PO4) and/or hydroxylapatite (HAP, Ca5OH(PO4)3); this avoid the uncontrolled crystallization of this compounds in the sludge stabilization section pipes. The guide line of the research is to create the conditions in which phosphates can nucleate in a fluid bed composed by silica sand that act as seed material. The fluid bed is made of inert material (silica) located inside an height expanded reactor: the sewage is fed from the bottom and this flow allow the bed fluidification. The optimal pH is reached by an aeration process: the blown air causes the moving of the carbonate-bicarbonate balance with CO2 stripping and increase of the pH value. Without adding reagents, it is possible to have the essential conditions for phosphorus crystallization. The grains formed on the silica, essentially struvite and/or hydroxylapatite, could have the properties to be used as slow release fertilizer in agriculture. The Treviso SCP research starts from previous studies on various pilot plant of different scales. The results obtained have allowed to plan and to carry out, in the Treviso WWTP, a phosphorus crystallization plant of pre industrial scale. The initial experimentation were made on a bench- scale pilot plant. It was tested the FBR performances, the reactor was continuously fed with supernatant of a 100.000 PE plant working with A2O process. These experimentation showed that :
o the supernatant have chemical characteristics in order to reach the right stoichiometric ratios
and do not need any chemical addition;
o no treatment for suspended solids is needed;
o in order to reach optimal pH values is sufficient to strip CO2 with aeration of supernatants.
Moreover the obtained results permitted to assert that the process performance is linked, with a double saturational model, to the pH value and to the contact time spent inside the FBR (Battistoni et al.). The phosphorus was removed both as MAP and as HAP: the total removal percentage was about 80%. The phosphorus crystallisation was also studied feeding the FBR in a batch modality, and the results obtained showed that removal can be obtained without adding chemicals and that the crystallisation around seed materials (silica sand particles) occurs in about 100 minutes (Battistoni et al.; 2000). However the batch modality permits to obtain satisfying results only working with low P-PO4 content in the influent (30-60mg/l), while a conspicuous loss of fine particles was observed with influent with higher P concentration (100-150mg/l). Further experimentation was necessary, but the experience revealed that the FBR cannot be managed in batch modality. After this first experimentation, an half-scale pilot plant was constructed and located in the Ancona Zipa WWTP (100.000 AE) where the plant was fed with no pre-treated centrifugal machine supernatants.

Cecchi, Battistoni, Boccadoro, 2003, page 11
The realization of the Treviso SCP demonstrative plant and the struvite crystallization experimentation have a double aim. Regarding the research it wants to show that the theoretical experimental model derived with the experimentation in the pilot plants is effective also in the pre-industrial scale plant. The model control lead to a clear definition of plan and management guide lines for new SCP plants. The other aim of the SCP is to remove definitively phosphorus from supernatants reducing Phosphorus mass loading in the head plant incoming with supernatants. Otherwise, the crystallisation as MAP or HAP permits to recover the products as fertilizers. Regarding this aspect the research respects the interest of CEEP (Centre Eropeen d’estudes sur les Polyshosphates) which encourages the research of phosphorus removal and recovery for an environmental restoration. As for the experimental work carried out in Treviso, the start up of the plant goes back to March 2001. The following Gantt diagram shows the functioning periods of the plant. The period of running ( March 2001 – October 2002) is characterised by some interruptions due to technical modifications occurred in the plant (Dortmund substitution, maintenance problems..)
According to the operating conditions of the SCP plant, three experimental continuous periods can be individuated. Table 1 bis summarises the operative conditions adopted in each periods. During this period no substantial changing in Treviso WWTP management, linked with the SCP process, were registered (characteristics and flow rate of dewatering supernatants quite constant)
Crystallization tests
Dortmund replacement
Technical problems
Sand bed replacement
Mar01
Apr 01
May 01
Jun 01
Jul01
Ago01
Sep01
Oct01
Nov01
Dic01
Jan02
Feb02
Mar02
Apr 02
May 02
Jun 02
Jul 02
Ago02
Sep02
Oct02
Mar01
Apr 01 01 01 01 01 01 01
Nov01
Dic01 02
Feb02
Mar02
Apr 02 02 02 02 02 02 02

Cecchi, Battistoni, Boccadoro, 2003, page 12
Tab.1 bis: Experimental work in the SCP area
Description of experimental work Natural ageing tests The chemical transformations with time and the behaviour of an anaerobic supernatant with natural CO2 production has been observed during the cooling of digestion sludge in open lagoons (Salutsky et al., 1972). Further studies has been done to analyse P removal (Battistoni et al., 1997; Battistoni et al., 1998b) in order to investigate the behaviour of the system in natural conditions and the way to enhance the P-removal process (i.e. nucleation and/or precipitation). The following simple method was used. 5 litres of supernatant enriched with the appropriate amount of phosphorous are put in an open vessel with a good superficial exposition and left aside in a thermostatic room (25°C). Daily sample are withdrawn and the following parameter are analysed:
- pH - P-PO4 total - P-PO4 soluble - Alkalinity - Ca - Mg - K1
1 Potassium could be measured only at the beginning of the test
Experimental periods Date
P-PO4in (Average)
Qin (Average range)
Problems observed Solution carried out
I March 2001 – May2001
33,66 ppm
1 – 1,5 m3/h
1) Difficulties on performances evaluation because of low concentration of P-PO4 inflow 2) Sand particles loss from the Dortmund device
1) Increase of the P-PO4 inflow 2) Replacement of the Dortmund device
II July 2001 – April 2002
62,93 ppm
0,7 – 1,4 m3/h
High presence of organic material in the fluid bed
Replacement of the used silica bed with clean one
III June 2002 – October 2002
94 ppm
0,86 -1,20 m3/h

Cecchi, Battistoni, Boccadoro, 2003, page 13
The test could be carried out both with natural supernatants and supernatants enriched with NH4 and P-PO4. • The soluble P-PO4 is analysed on 0.45 µm filtered sample then acidified whit sulphuric acid at
pH 5. • The total P-PO4 (soluble + particles) is analysed in acidified sample (pH 5 with sulphuric acid),
then, after one hour, the sample is filtered and analyzed. • The analysis of the concentration of Ca, Mg and K are carried out on the acidified and filtered
sample. All the analyses were carried out in accordance with Standard methods (APHA, 1982) and CNR note-book (1985).
Supersaturation test The supersaturation curves are utilised to highlight the inhibition effect of ions presents in anaerobic liquors on struvite (MAP) and hydroxylapatite (HAP) formation. The curves were first introduced by Joko (1984) and presume phosphate addition (in the form of Na3PO4 or H3PO4) and pH increase by alkali addition and by aeration. The supernatant could be Ca or Mg enriched to investigate their inhibition effect on MAP or HAP formation. The same procedure is applied for NH3 or alkali addition. At each different P concentration, the pH value, in which supersaturation conditions are verified, is obtained. The Joko methodology was modified by monitoring the solution transmittance at 400 nm and the critical supersaturation point is selected when the transmittance value reached 80% of the initial value (equivalent to a turbidity of 100-170 SiO2 mg/l). In this way for each P concentration value it is possible to obtain the pH value at which homogeneous crystallization occurs.
Chemical analysis in wastewater The outlet and inlet samples of Treviso SCP were withdrawn to analyse the following parameters:
- P-PO4 sol - P-PO4 tot - N-NH4 - TSS - Ca - Mg - K - pH - Alkalinity
• The soluble P-PO4 is analysed on 0.45 µm filtered sample acidified with sulphuric acid at pH 5. The analysis is carried out by the use of a high performance liquid chromatography system (HPLC MOD.DX120) using a conductivity detector.
• The total P-PO4 (soluble + particles) is determined on acidified sample (pH 5 with sulphuric acid), then, after one hour, the sample is filtered and analyzed. The analysis is carried out by the use of a high performance liquid chromatography system (HPLC MOD.DX120) using a conductivity detector.
• The analysis of the concentration of Ca, Mg and K were carried out on the acidified and filtered sample by the use of a high performance liquid chromatography system (HPLC MOD.DX120) using conductivity detector.

Cecchi, Battistoni, Boccadoro, 2003, page 14
• The analysis of ammonia concentration was carried out according to the Nesslerizzation methods. The sample absorbance was measured at 410 nm with a spectrophotometer, after a preliminary distillation step.
All the analyses were carried out in accordance with Standard methods (APHA, 1982) and CNR note-book (1985). Chemical analysis on silica For the determination of the main anions (i.e. phosphates) and cations (i.e. potassium, magnesium and calcium) present in the silica, the sample must be soluble. The analysis is carried out by the use of a high performance liquid chromatography system (HPLC MOD.DX120) using a conductivity detector. The sample is pre-treated by acidification of 2 mg of silica with 10 ml of hydrochloric acid. The solution is then warmed up at 80-90°C for about 30 minutes. The cooled and filtered sample is then diluted to 250 ml with distilled water. The samples were further diluted (1:10 for anions and 1:5 for cations determination) and then injected in the HPLC.
Particle size analysis on silica The particle size analysis is carried out in accordance with American Standard Methods (ASTM) . The determination is commonly carried out sieving a representative sample through a set of calibrated sieves (Table 2 reports 6 different mashes sieves used in the specific test). Starting from the top sieve the portions of sand held between adjacent sieves are added in sequence, and the cumulative weights are recorded.
Table 2 - Utilized sieves for the particle size analysis on silica
Sieve name Size of openings, mm 500 0,5 355 0,355 300 0,3 212 0,212 180 0,18 125 0,125 90 0,09 75 0,075 bottom
Calculation:
% partly retained solids i = 100⋅ialtotalmater
insievematerialso
g
g
From the amount of the % of the solids partly retained in the previous sieves (the larger meshed sieve) is possible to estimate the % stored materials in the ith sieve.
% accumulation solid stored i = ∑i
idstoredpartlysoli0
%
Cecchi, Battistoni, Boccadoro, 2003, page 15
By the following equation the percentage of non retained material can be obtained
ii redonsolidstoaccumulatihmaterialspassthroug %100% −=
By the amount of the stored materials in each sieve it may be possible to extract the granulometric distribution curve.
Bed porosity Bed porosity is the volume of empties zones in comparison with the bed total volume. This is a laboratory test. The following equation expresses the bed porosity:
( )EXP
SPEXP
VMVV
ε−
= Eq. 11
where VEXP is the bed total volume, Vsp is the specific volume of loaded silica and M the mass of loaded silica. The unknown and variable term of equation during every single test is the specific volume and it is determined, at the end of each crystallisation test, according to the following methodology. Silica samples withdrawn from the bed are well mixed and 10 g of the mixed sample are placed in a 100 ml glass flask filled up with distilled water. The flask weight is known. The insertion of silica in the flask makes water level to lift up: the overflow is withdrawn using a pipette until the level recovers the initial value. The flask is then weighed and the difference between the weights with and without silica addition is the mass of “displaced” water. Knowing water specific weight (1g/ml) it is possible to derive the displaced volume, which represents the silica volume. For each examined silica bed we made four porosity tests and the average represents the final volume.
Test V’10 The test V’10 is aimed for the check the bed fluidity. The test was carried out withdrawing the effluent from different heights of the fluidised bed reactor and placing 1.0 L of each in a Imhoff cone. The samples were settled for 10 minutes and the volume of settled solids in the cone (mL/L) was recorded. The values obtained at the different heights can give some information about the bed uniformity. Otherwise the volume of fluidised silica can be estimated by the concentration of solids in 1 litre (g/l) and by the total mass of silica in the bed. In this way it might be possible to know if there’s compact silica in the bed bottom and if it is necessary to increase the recycling flowrate. .
Demonstrative area for struvite crystallization The Struvite demonstrative area was planned on the basis of the tests carried out with bench and medium scale pilot plants by the University of Ancona. It can be used as a full scale device, but at the same time it is equipped with all the probes and facilities typically used in a laboratory reactor. This allows the rapid change of the operational conditions as well as the acquisition of all the data needed in a scientific experiment. The plant is mainly composed of three sections:

Cecchi, Battistoni, Boccadoro, 2003, page 16
• pre-treatment, • stripping • FBR
The pre-treatment section is constituted by a mixing tank, a decanter and a stocking tank. Anaerobic supernatants are supplied from the dewatering section (belt press; see Figure 2) to the mixer through two centrifugal pumps placed in the storing tank of the dewatering section. Anaerobic supernatants could be phosphate enriched, dosing P-PO4 in the mixer. The liquor passes from the mixer to the decanter, where settleable solids are excluded; then the liquid passes from the top to the stocking tank through weirs. Two mohno pumps (P2) are used to feed the stripping tank (Qin). In table 3 the volume and the electromechanical characteristics are presented. The supernatant passes from the storing tank to the stripper, through a pump P2 (see figure 3); then the liquid (recycle flowrate, Qr) comes out from the stripper to the fluidized bed reactor (FBR). In the stripper tank an air diffuser is used for a flowrate up to 50 l/min.
Fig. 1: demonstrative area of struvite crystallization in Treviso WWTP
The functions of the different reactors and tanks which make the plant are:
• Mixer: here it is possible to add P-PO4 in the case of supernatant is low in phosphate, this is to guarantee a good precipitation efficiency;
• Decanter: its function is to exclude settleable solids from supernatant because they have a bad influence on the process;
• Holding tank: this tank is necessary in order to guarantee an uninterrupted inflow for the process, this is because the belt press works in non-continuous way;
• Stripping reactor: here it is raised the ph by stripping CO2 with air blown from the bottom of the tank . Three flows comes together in this tank: Qair (by ceramic insufflators), Qrecycle (from the top of FBR) and Qin (from the holding tank);
• Deareation column: its function is to create a quiet zone in order to avoid problem with recycle pumps;
• Nucleation reactor: this is a fluidised bed reactor (FBR) where the bed is made of sand which acts as seed material for the crystallization of phosphate.
Belt press supernatant
Holding tank Stripping
reactor Deareation column Decanter MixerNucleation
reactor
STRUVITE
Qrecycle

Cecchi, Battistoni, Boccadoro, 2003, page 17
StockingtankStockingtankDecanter
MixerDecanter
MixerStripperStripper
FBRP2
Deaeration col.Deaeration col.
P1
Holding TankStockingtankStockingtankDecanter
MixerDecanter
MixerStripperStripper
FBRP2
Deaeration col.Deaeration col.
P1
Holding Tank
Fig. 2: pre-treatment section
to Holding tank
P2
to decanter
from Dewatering
To Stripper
Decanter Mixer
Holding tank
Table 3 - Characteristics of the pre-treatment section

Cecchi, Battistoni, Boccadoro, 2003, page 18
Section Materials and characteristic Volume, geometry and flowrate Mixer Cylindrical steel tank Φ=0.9 m, Vtot=1.3 m3 Decanter Cylindrical steel tank Φ=1.6 m, Vtot=4.7 m3 Stocking tank Reinforced concrete tank Vtot=48 m3 Pumps (P2) Mohno pump 1.5 kW 0.8-4.9m3/h
Fig. 3:stripping column
h1h2
h3
out
in
air
to FBRfrom Pumps P2
from FBRStripper
Deaeration col.
At the bottom of the stripper there is a valve for the tank cleaning; moreover the de-aeration column is connected to the stripper by means of an horizontal pipe. The liquid flows from the de-aeration column to the FBR through pump P1. The column has three outlets at three different heights (h1-h2-h3): depending on the selected height it is possible to set different volumes and, therefore, different operational conditions (i.e. hydraulic retention time). In table 4 the volume and the electromechanical characteristics of the stripper are presented.
Table 4 - Characteristics of the stripping section Section Materials e characteristics Volume, geometry , flowrate
Stripper Cylindrical steel tank Φ=1 m, H1= 1.7 m Vtot=1.33 m3
H1= 2.2 m Vtot=1.73 m3
H1= 2.7 m Vtot=2.12 m3 De-aeration column Cylindrical steel tank Φ=0.5 m,
H1= 1.7 m Vtot=0.33 m3
H1= 2.2 m Vtot=0.43 m3
H1= 2.7 m Vtot=0.53 m3 The supernatant passes through Mohno pump P1 from the de-aeration column to the bottom of the FBR where there is a gravel filter to avoid the return of sand to the pump P1. The FBR reactor is a cylindrical steel tank with a Dortmund at the top to avoid the outlet of sand. The column is filled up with sand to obtain a compressed bed as high as half the reactor. Samples can be withdrawn from sampling ports placed at different heights. The silica pellets enriched of HAP or/et MAP go out through two pipes, one at the column top and one at the bottom. The effluent from the FBR returns to the stripper through an horizontal pipe: this flow is called recycle flowrate (Qr) and is used to

Cecchi, Battistoni, Boccadoro, 2003, page 19
effectively increase residence time in the reactor. The main geometrical characteristics of the FBR reactor are represented in table 5.
Figure 4: FBR reactor
to FBR
to Stripper
pellets
P1
from FBR
to FBR
to Stripper
pellets
P1
to FBR
to Stripper
pellets
P1
from FBR
Table 5 : Main characteristic of FBR reactor
Section Material and characteristics Volume, geometrical and flowrate FBR reactor (expanded bed) Cylindrical steel tank Φ=0.6 m, H= 3 m, Vtot=0.85 m3 FBR reactor (gravel filter) Cylindrical steel tank Φ=0.6 m, H= 1 m, Vtot=0.28 m3 Dortmund Stell dortmund Φ1=0.6 m, Φ2=1.2 m, H= 0.4 m Vtot=0.28 m3
Monitoring and on-line data acquisition
The plant is endowed with different flowrate measure transmitters. In particular: - inlet flowrate: electromagnetic measurer ABB Kent-Taylor 4-20 mA; the flowrate from the
storage tank to the stripper (that is the real volume of treated supernatant) is measured; - air flow meter; - recycle flow meter: electromagnetic meter by ABB Kent-Taylor 4-20 mA; the flowrate from the
de-aeration column to the FBR is measured; - raising flowrate: electromagnetic measurer ABB Kent-Taylor 4-20 mA; the flowrate from the
dewatering section to the mixing tank is measured; The plant is also endowed with temperature measurer transmitters. In particular:
- Air temperature: electronic temperature transmitter; PT 100, 4-20mA; the air measurer in the stripper tank is measured;
- Inlet temperature transmitter: PT 100, 4-20mA measurer
The plant is also endowed with pH and ORP on-line measuring apparatus: - pH transmitter: Endress+Hauser. It has been designed for pH continuous monitoring and
control and it has been placed in the de-aeration column; - ORP transmitter: Endress+Hauser; the ORP value in the de-aeration column is measured.

Cecchi, Battistoni, Boccadoro, 2003, page 20
All the signals are acquired and registered by a memo-graph. Figure 5 shows the location of measurer and transmitters.
Figure 5: location of measurer transmitters
Sample collection The plant is endowed with different sample withdrawal areas. Figure 6 shows the place where automatic samplers C1-C2-C3 have been installed to obtain average values of the monitored parameters.
Figure 6: sampling ports
Qsoll Qalim
Qric
pH-ORP
Qaria
Taria
Talim
QalimQin
Qair
Tair

Cecchi, Battistoni, Boccadoro, 2003, page 21
The first sample (C1) is taken from the mixer; this is the anaerobic liquor supplied from the press belt. Another sample, C2, is taken from the stripper and it represents the real feed (supernatants phosphate enriched). The C3 sample is taken from the de-aeration column bottom, and it represents the plant real effluent. The C4 sample represents the recycle flowrate.
Data sheet All the main parameters daily recorded during the monitoring of the plant are reported data sheets to obtain the database of the plant operational conditions. In Table 6 an example of the data sheet is given.
Table 6: example of a data sheet Day Q from press (Qfeed) Qin Qrecycle Qair pH ORP Tair Tinlet
m3/h m3/h m3/h Nm3/h mV °C °C 01/02/02 4,3 0,1 0,8 11,3 8,90 146,9 10,8 10,7
Usually only the physical-chemical characteristics of feed and effluent are analysed and recorded in data sheet; occasionally, when case fines were suspected to be escaping through the Dortmund, the Dortmund sample was analysed too. Table 6.1 shows the data complete sheet.
Table 6.1: example of the complete data sheet
Concentrations of the the stripper feed Day pH CO3 HCO3 Ptot PO4-P Ca Mg K NH4-N NO2-N NO3-N SO4 TSS TCOD SCOD mg/l mg/l mg/l mg/l mg/l mg/l mg/l mg/l mg/l mg/l mg/l mg/l mg/l mg/l
Concentrations in the Dortmund Day pH HCO3 CO3 Ptot PO4-P Ca Mg K NH4-N NO2-N NO3-N SO4 SCOD TSS mg/l mg/l mg/l mg/l mg/l mg/l mg/l mg/l mg/l mg/l mg/l mg/l mg/l
Concentrations in the FBR effluent Day pH CO3 HCO3 Ptot PO4-P Ca Mg K NH4-N NO2-N NO3-N SO4 SCOD TSS mg/l mg/l mg/l mg/l mg/l mg/l mg/l mg/l mg/l mg/l mg/l mg/l mg/l

Cecchi, Battistoni, Boccadoro, 2003, page 22
Results and discussion
Start up Characteristics of the loaded sand The FBR reactor was filled up with 600 kg of silica sand, the material where struvite grooved up. In figure 7 the particle-size distribution of two different sands is described. The first one refers to the “old” sand used in the pilot plant and the second one refers to the “new “sand the SCP was filled with.
Figure 7: particle-size distribution from sieve analysis of sand particles
0,0
10,0
20,0
30,0
40,0
50,0
60,0
70,0
80,0
90,0
100,0
0,01 0,1 1screen (mm)
% r
esid
uals
and
oldnew
0,0
10,0
20,0
0,0
10,0
20,0
30,0
40,0
50,0
60,0
70,0
80,0
90,0
100,0
0,01 0,1 1screen (mm)
% r
esid
uals
and
oldnew
Operational parameters Q from press This parameter represents the flowrate (<9m3/h) from the belt press. In the dewatering section it is supplied with An holding tank where the anaerobic supernatant is collected. By experience, it could be observed that a high flowrates (>9m3/h), resulted in a risk of encountering high solids concentration. For this reason the pumps are set at flowrates intended to prevent the inlet of undesired solids from the dewatering section.
Q inlet The feed to the FBR is constant (1 or 1.5 m3/h) to guarantee a continuous operation and a retention time compatible with the process.

Cecchi, Battistoni, Boccadoro, 2003, page 23
Q recycle The recycle flow rate remains constant to keep the bed fluidized and to avoid sand loss through the Dortmund. The applied value was calculated considering a particle settling velocity which is a function of the fluid properties and of the solid particles characteristics. The settling final velocity of a discrete particle is represented by Stockes’ law (Eq.12).
µρ−ρφ
=18
)(gv s2
Eq. 12
where g is the gravity acceleration (9.8 m/s2), µ the absolute dynamic viscosity of water (kg/m3), ρ the particle density (kg/m3), ρs is sand density (kg/m3) and φ the spherical particle diameter (m). Starting from the particles diameter, the settling velocity inside the FBR reactor is determined. To fluidize the bed and to keep the sand in suspension, the liquid rising rate must have opposite direction and equal or higher modulus than the particles falling rate. Furthermore, to guarantee a fluidized bed the lowest value of flowrate can be derived from Eq. 13, that defines the surface hydraulic loading .
AQCis = Eq. 13
By this equation the percentage of fluidized bed can be determined. In the first column of table 7 the theoretical flowrate value is reported; in the second column the surface hydraulic loading is determined on the daily flowrate considering a reactor diameter of 0.6 m.. In the third column there is the larger particle diameter that can be fluidized with this Qr value. The last column reports the percentage of the total sand in the really fluidized reactor, determined by the particle-size distribution.
Table 7: Q recycle and percentage of fluidized bed
Qrecycle Cis d max fluid % fluidized bed m3/h m/h mm
4 14,15 0,066 between 0% et 15% 6 21,23 0,081 between 15% et 47% 8 28,31 0,094 between 47% et 56% 10 35,39 0,105 55,6% 12 42,46 0,115 between 56% et 87% 14 49,54 0,124 87% 16 56,62 0,133 between 87% et 99,8%18 63,69 0,141 between 87% et 99,8%20 70,77 0,148 between 87% et 99,8%35 123,85 0,196 between 87% et 99,8%
Q air
The air flowrate in the stripping column is necessary to obtain CO2 stripping and an increase of pH. Thus the selected flowrate depends on pH and on the inlet flowrate: for this purpose a large number of stripping tests were carried out to select the most adequate values of air flowrate.

Cecchi, Battistoni, Boccadoro, 2003, page 24
Hydraulic tests To test the plant hydraulics and the electromechanical apparatus a first run was carried out. In the SCP plant, for each volume and flowrate there exist an equivalent value of HRT, according to the “double saturational model” applied (Battistoni et al.,2002).
i
321T
Q)VV(VHRT ++
=
Eq. 14
i
21stripp
Q)V(VHRT +
=
Eq. 15
RIC
3FBR
QVHRT =
Eq. 16
εQV
HRTRIC
EXPEXP= Eq. 17
HRTHRTn
FBR
T= Eq. 18
QiVtotαε=⋅= EXPc HRTnt Eq. 19
- HRTt is the average retention time of the feed in the SCP (V1 is the stripper volume, V2 the
de-aeration column volume, V3 the FBR total volume including Dortmund, pipes and filter); - HRTstripp is the average retention time of the feed in the stripping reactor; - HRTFBR is the average retention time of the recycle stream in the FBR; - HRTexp is the average retention time of the recycle stream in the fluidized bed (the FBR
zone in which there is the uncompressed sand: then the empty spaces represent the real available volume. Expanded bed porosity = Vexp⋅ε);
- n is the number of liquid runs into the FBR reactor, defined as the ratio of total HRT to FBR HRT.
- tc is the contact time in the sand, defined as the ratio of HRT exp to the run number in FBR.
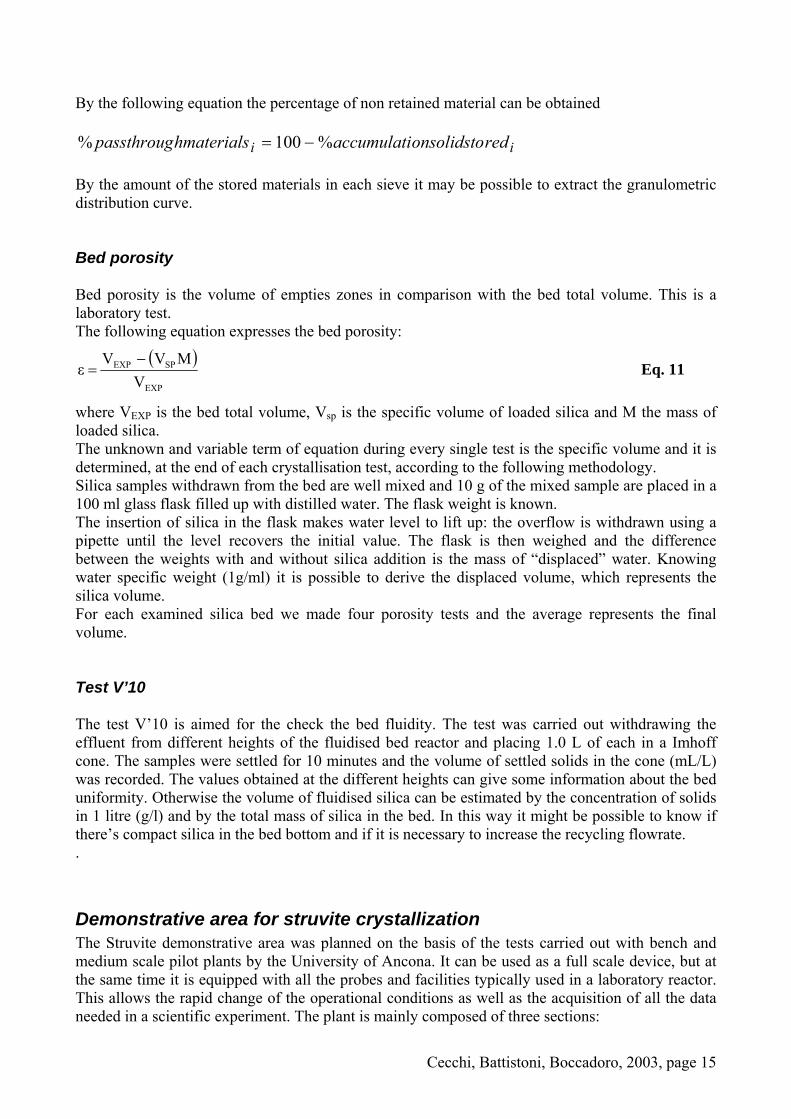
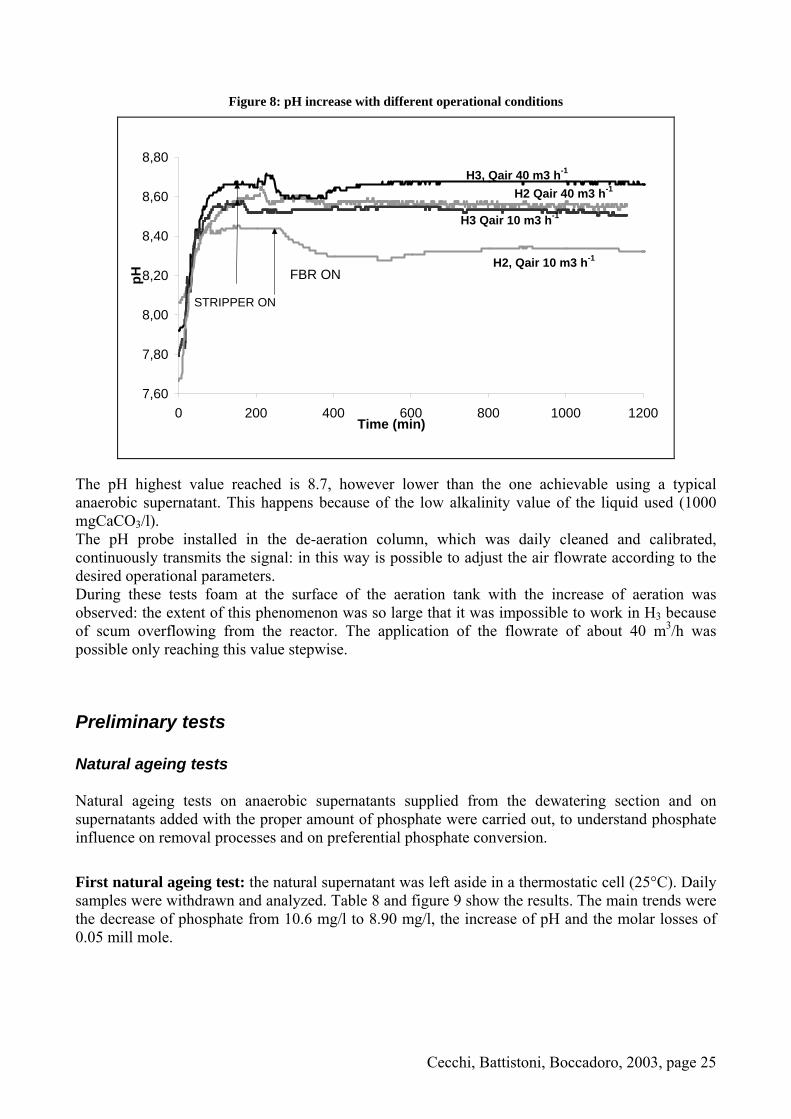
Air stripping test In order to estimate the influence of the hydraulic loading on the de-aeration-stripping system, similar batch tests were carried out with the same inlet flowrate and different air flowrate (Qin= 1m3/h). These tests demonstrated that the pH value reaches 8.5. Moreover the methodology used required continuous feeding to the stripping column, and then feeding of the FBR with the recycle flowrate. Figure 8 shows the results obtained. When the FBR is in operation, the hydraulic retention time changes, becoming HRTt (from HRTstrip to HRTt, see equations 14 and 15). The results demonstrated that to have an operative pH value of 8.3 or higher, the highest hydraulic loading must be used (H3) together with the lowest air flowrate (Qair= 10 m3/h). Working with lower hydraulic loading values (H1 or H2), the air flowrate must be increased (Qair= 40m3/h).
Cecchi, Battistoni, Boccadoro, 2003, page 25
Figure 8: pH increase with different operational conditions
7,60
7,80
8,00
8,20
8,40
8,60
8,80
0 200 400 600 800 1000 1200Time (min)
pH
H3, Qair 40 m3 h-1
H2 Qair 40 m3 h-1
H2, Qair 10 m3 h-1
H3 Qair 10 m3 h-1
FBR ON
STRIPPER ON
The pH highest value reached is 8.7, however lower than the one achievable using a typical anaerobic supernatant. This happens because of the low alkalinity value of the liquid used (1000 mgCaCO3/l). The pH probe installed in the de-aeration column, which was daily cleaned and calibrated, continuously transmits the signal: in this way is possible to adjust the air flowrate according to the desired operational parameters. During these tests foam at the surface of the aeration tank with the increase of aeration was observed: the extent of this phenomenon was so large that it was impossible to work in H3 because of scum overflowing from the reactor. The application of the flowrate of about 40 m3/h was possible only reaching this value stepwise.
Preliminary tests Natural ageing tests
Natural ageing tests on anaerobic supernatants supplied from the dewatering section and on supernatants added with the proper amount of phosphate were carried out, to understand phosphate influence on removal processes and on preferential phosphate conversion.
First natural ageing test: the natural supernatant was left aside in a thermostatic cell (25°C). Daily samples were withdrawn and analyzed. Table 8 and figure 9 show the results. The main trends were the decrease of phosphate from 10.6 mg/l to 8.90 mg/l, the increase of pH and the molar losses of 0.05 mill mole.

Cecchi, Battistoni, Boccadoro, 2003, page 26
Table 8:Chemical-physical characteristics of the anaerobic supernatant during the first natural ageing test.
t h
pH Alk PO4-P Casol Mgsol Ksol Ptot NH4-N mmol mmol mmol Ca/Mg Ca/PO4 Mg/PO4
mg/l mg/l mg/l mg/l mg/l mg/l mg/l Ca Mg P 0 7,34 670 10,6 12.02 163,4 0,34 24 7,93 740 10,2 126,1 38,5 30 3,15 1,58 0,33 1,99 9,55 4,81 48 7,93 905 9,9 90,3 34,4 28 2,25 1,42 0,32 1,59 7,05 4,43 72 7,94 875 9,7 0,31 96 7,96 870 9,7 120,7 39 27,2 3,01 1,60 0,31 1,88 9,62 5,12 144 8,24 815 9,5 0,31 192 8,35 720 8,9 0,29
Figure 9: pH and soluble phosphate concentration trends with time during the first natural ageing test.
0
2
4
6
8
10
12
0 50 100 150 200 250tempo, h
mg/
l P-P
O4
77,27,47,67,888,28,48,68,89
pH
P-PO4 pH
The second ageing test was carried out adding phosphate to the supernatant to reach a concentration of 48 mgP/l, in order to investigate the behaviour at different phosphate concentrations. The results obtained are in accordance with the result of the first test: the decrease of phosphate concentration is more evident in this test, in fact phosphate concentration decreases from 48mg/l to 27.6 mg/l. The pH increases from 7.34 to 8.14. Figure 10 shows the trend of pH and phosphate concentration during this test.
Table 9: Chemical-physical characteristics of the supernatant after the addition of phosphate up to a concentration of 50 mgP/l during the second ageing test.
t (h)
pH Alk mg/l
PO4-P mg/l4
Casol mg/l
Mgsol mg/l
Ksol mg/l
Ptot mg/l4
NH4-Nmg/l4
mmolCa
mmolMg
mmolP
Ca/Mg Ca/PO4 Mg/PO4
0 7,34 725 48 112,9 40,2 31,6 48 177,2 2,82 1,65 1,55 1,70 1,82 1,07 24 7,71 985 47,7 83,88 37,3 30,2 2,09 1,53 1,54 1,36 1,36 1,00 48 7,71 950 46 107,5 36,4 31,3 2,68 1,50 1,49 1,79 1,81 1,01 72 7,8 860 43,3 127,4 40,7 30,2 3,18 1,67 1,40 1,90 2,27 1,20 96 7,9 955 41 107,3 37,9 29,9 2,68 1,56 1,32 1,72 2,02 1,18 144 8,1 845 37,9 1,22 192 8,12 865 32,3 1,04 240 8,14 855 27,6 28,6 0,89

Cecchi, Battistoni, Boccadoro, 2003, page 27
Figure 10: pH and phosphate concentration trends with time during the second natural ageing test (phosphate concentration = 48 mgP/l)).
0
10
20
30
40
50
60
0 50 100 150 200 250tempo, h
mg/
l P-P
O4
77,27,47,67,888,28,48,68,89
pH
P-PO4 pH
The third natural ageing test on the supernatant enriched in phosphate (mgP/l) was carried out adding (NH4)2HPO4 (see table 10).
Table 10: Third natural ageing test, sample phosphate added up to 50 mgP/l: chemical-physical characteristics
t (h)
pH Alk mg/l
PO4-P mg/l
Casol mg/l
Mgsol mg/l
Ksol mg/l
Ptot mg/l
NH4-Nmg/l
mmolC
mmol Mg
mmolP
Ca/Mg Ca/PO4 Mg/PO4
0 7,37 785 51 96,09 35,2 25,8 56,7 229,8 2,40 1,45 1,65 1,66 1,46 0,88 24 7,67 1100 51 149,7 49,4 14,8 3,74 2,03 1,65 1,84 2,27 1,23 48 7,72 940 50 123,6 42,1 29,3 3,08 1,73 1,61 1,78 1,91 1,07 72 7,75 905 47 122,1 38,9 29,6 3,05 1,60 1,52 1,90 2,01 1,05 96 7,8 940 45,5 88,85 28,1 30,8 2,22 1,16 1,47 1,92 1,51 0,79 144 7,9 840 43 1,39 192 8 870 38 1,23 240 8,2 695 33 37,9 1,07 These runs demonstrate that the phosphate initial concentration is an important parameter to establish the importance of phosphate precipitation. Figure 11 shows phosphate concentration decrease, from 51 mgP/l to 33 mgP/l, and pH increase, from 7.37 to 7.98. The percentage of phosphate conversion was defined as the ratio of soluble PO4-P in the effluent and Ptot in the influent. Conversion phenomena during each natural ageing tests were analysed considering also the Ca/Mg, Ca/PO4 and Mg/PO4 molar ratios since their evolution allows to understand the type of salt formed (struvite or hydroxyapatite). Highest phosphate removals were obtained when the supernatant was phosphate enriched. The P conversion went from 8.7% (natural supernatant) to 35-36%. Ca and Mg molar ratios determined the kind of phosphate salt formation; furthermore the tests confirmed the slow evolution of the system towards supersaturation conditions.

Cecchi, Battistoni, Boccadoro, 2003, page 28
Figure 11: Third natural ageing test (sample enriched with 50 mgP/l): pH and phosphate concentration trends with time.
0
10
20
30
40
50
60
0 50 100 150 200 250tempo, h
mg/
l P-P
O4
77,27,47,67,888,28,48,68,89
pH
P-PO4 pH
Supersaturation tests
First supersaturation test In order to study MAP or HAP formation it is important to investigate the influence of phosphate, calcium and magnesium concentrations. First curve (increase of ammonium and phosphate): phosphate concentration increased from 20 mgP/l to 54 mgP/l, after the addition of (NH4)2HPO4; pH was increased by adding alkali until the nucleation pH value was reached. Table 11 shows the results.
Table 11: first supersaturation curve- first set
P-PO4, mg/L pH at beginning pH* mg/L NaOH added 20 7,62 9,07 0,5 22 7,69 8,74 0,4
28,5 7,76 8,43 0,3 42 7,59 8,33 0,16 54 7,58 8,22 0,2
Second curve (increase of ammonium, phosphate and magnesium): phosphate concentration increased from 20 mgP/l to 52.5 mgP/l after the addition of (NH4)2HPO4; each sample was also added with 50 mg/l of MgCl2. pH was increased by adding alkali until the nucleation pH value was reached. Table 12 shows the results.
Table 12: second supersaturation curve-first set
P-PO4, mg/L pH at beginning pH* mg/L NaOH added 20 7,62 9,07 0,5 23 7,9 8,7 0,45
28,5 7,63 8,52 0,4 43,4 7,5 8,4 0,3 55,2 7,7 8,2 0,2

Cecchi, Battistoni, Boccadoro, 2003, page 29
Third curve (increase of only phosphate): phosphate concentration was increased from 20 mgP/l to 68 mgP/l after the addition of H3PO4; pH was increased by adding alkali until the nucleation pH value was reached. Table 13 shows the results.
Table 13: third supersaturation curve-first set
P-PO4, mg/L pH at beginning pH* mg/L NaOH added 20 7,62 9,07 0,5
32,5 7,45 8,5 0,38 39 7,33 8,4
46,9 7,26 8,35 0,4 68 7,15 8,28 0,45
Figure 12:supersaturation curves- first set of test
The trends in figure 12 show that when the phosphate concentration in solution increases, the pH necessary for the nucleation decreases. The addition of magnesium salt (second test) doesn’t produce a different salt (the curve does not shift), probably because of the high magnesium concentration in the natural supernatant. The same behaviour is observed in the thirst test, where H3PO4 was added instead of (NH4)2HPO4. Second set of supersaturation test This second set of test was carried out to investigate the effect of different supernatants on MAP or HAP formation. To perform this tests a real supernatant was implemented with the appropriate amount of phosphate as (NH4)2HPO4.
Table 14: first supersaturation test- second set of tests
pH* Initial pH PO4-P, mg/L NH3-N, mg/L ml NaOH added 9,46 7,98 10,3 118 0,65 8,57 7,93 14,5 130 0,2 8,2 7,64 24,32 138 0,08
7,98 7,6 38 155 0,075
0
1020
3040
50
6070
80
8 8,2 8,4 8,6 8,8 9 9,2pH
mgP
-PO
4/l
prima provaseconda provaterza prova
firtssecondthird

Cecchi, Battistoni, Boccadoro, 2003, page 30
Table 15: second supersaturation test- second set of test
pH* Initial pH PO4-P, mg/L NH3-N, mg/L ml NaOH added 8,83 7,69 11,4 103,7 0,4 8,4 7,69 15 114 0,3 8 7,68 22,9 137,7 0,1
7,88 7,68 27,7 290 0,08 7,71 7,65 50,4 140 0,06 7,69 7,55 52 322 0,05
Table 16: third supersaturation test- second set of tests
pH* Initial pH PO4-P, mg/L NH3-N, mg/L ml NaOH added 10,4 7,68 8,02 85,18 0,4 9,8 7,64 17,5 90 0,3
8,44 7,7 42,6 103,9 0,1 8,2 7,9 63,7 123 0,1
8,15 7,9 75,1 / 0,1 8,04 7,87 99,7 / 0,08
Table 17: fourth supersaturation test. Second set of tests
pH* Initial pH P-PO4, mg/L N-NH3, mg/L ml NaOH added 9,71 7,62 16,8 103,3 0,7 8,9 7,79 31,7 112,2 0,3
8,55 7,84 44,6 131,2 0,2 8,4 7,9 63,8 133,3 0,2 8,3 7,94 84,1 140 0,1
Table 18: fifth supersaturation test- second set of tests
pH* Initial pH P-PO4, mg/L N-NH3, mg/L ml NaOH added 9,07 7,62 15 / 0,5 8,74 7,69 21 / 0,4 8,43 7,76 28,5 / 0,3 8,33 7,59 42 / 0,16 8,22 7,58 54 / 0,2
Figure 13 shows the supersaturation curves obtained. The main trends are in accordance with the hypothesis previously made: increasing phosphate concentration the pH necessary for nucleation decreases. It is possible to distinguish two groups of curves: the curves of the first and second test (which can be found at lower pH) and the ones of the fourth and fifth test. This tendency gives to the prevalence of one type of salt, while the fifth test curves witness the co-formation of MAP and HAP. Unfortunately during this set of tests cations were not analysed, so these hypotheses are not confirmed by Ca and Mg molar ratios; however many information about this phenomenon are reported in literature (Battistoni et al.,1998). It is feasible that struvite is represented by the curves at higher pH values, and hydroxylapatite by the curves at lower pH value.

Cecchi, Battistoni, Boccadoro, 2003, page 31
Figure 13: supersaturation curves- second set
Third set of supersaturation tests During the third set of tests phosphate is added both as H3PO4 and (NH4)2HPO4 and calcium as CaCl2 to verify the percentage of phosphate distribution in MAP and HAP formation. The following tables show the analytical procedures adopted . For each test, two tables are set. The first one shows the initial and final (at pH*) phosphate concentrations, the amount of added alkali, the initial and final potassium, magnesium and calcium concentrations (in mg/l and mmol). The final concentrations, when the supersaturation conditions are obtained, are marked in grey. In the second table the calculations used to determine HAP, MAP and calcite (moles) and the percentage of each precipitated salts are reported. The first supersaturation curve (tables 19-20) was carried out on the supernatant after the addition of H3PO4.
Table 19: first supersaturation test- concentrations
PO4-P pH* NaOH added NH4-N K Mg Ca P Mg Ca/PO4 Mg/PO4 Ca
mg/l mg/l ml in 100ml mg/l mg/l mg/l mg/l mmol mmol mmol
19 7,5 131,6 43,6 46,1 119,8 0,61 1,90 4,88 3,09 2,99 2,83 9,62 1,45 114,9 43,0 40,8 56,2 0,09 1,68 15,37 18,38 1,40
22 131,2 43,2 44,8 120,8 0,71 1,84 4,25 2,60 3,01 4,6 8,91 0,6 123,3 42,7 41,2 65,2 0,15 1,69 10,96 11,42 1,63
34 127,8 43,3 39,5 93,1 1,10 1,63 2,12 1,48 2,32 11,64 8,36 0,5 126,8 43,0 42,4 74,1 0,38 1,74 4,92 4,64 1,85
52 131,1 43,8 45,3 88,7 1,68 1,86 1,32 1,11 2,21 22,41 8,22 0,45 126,6 42,6 41,2 67,7 0,72 1,70 2,34 2,34 1,69
59,2 130,6 44,4 43,2 88,5 1,91 1,78 1,16 0,93 2,21 20,12 8,2 0,45 126,4 43,7 41,6 64,2 0,65 1,71 1,60
0
20
40
60
80
100
120
7 8 9 10 11
pH
mg
P-P
O4/
l
prima provaseconda provaterza provaquarta provaquinta prova
first
second
thirdfourthfifth

Cecchi, Battistoni, Boccadoro, 2003, page 32
Table 20: first supersaturation test- calculations
P as MAP P as HAP MAP HAP Calcite X MAP X HAP X CALCITE
% % mmol mmol mmol % % %
41,88 58,12 0,22 0,10 1,08 15,6 7,2 77,2 26,68 73,32 0,15 0,14 0,70 15,2 13,9 71,0 -16,20 116,20 -0,12 0,28 -0,92 15,4 -36,8 121,4 17,54 82,46 0,17 0,26 0,00 39,0 61,0 0,0 5,29 94,71 0,07 0,40 0,00 14,3 85,7 0,0
With the increasing phosphate concentration, the hydroxylapatite formation increases replacing calcite. During the second test the supernatant is enriched with H3PO4 and CaCl2 to increase the calcium concentration to about 150mg/l. Table 21-22 show the results.
Table 21: second supersaturation test- concentrations
P-PO4 pH* NaOH added N-NH4 K Mg Ca P Mg Ca Ca/PO4 Mg/PO4
mg/l mg/l ml in 100ml mg/l mg/l mg/l mg/l mmol mmol mmol
19 8,12 0,25
22 131,3 42,1 43,9 257,2 0,71 1,81 6,42 9,04 2,55 7 7,91 0,15 129,2 42,9 44,0 215,9 0,23 1,81 5,39 23,86 8,02
34 131,5 42,4 43,5 212,2 1,10 1,87 5,30 4,83 1,71 9,04 7,54 0,1 119,1 43,8 45,4 214,0 0,29 1,87 5,34 18,31 6,41
52 130,1 42,4 44,4 257,0 1,68 1,82 6,41 3,82 1,09 10,71 7,35 0,05 129,9 42,3 41,9 191,9 0,35 1,72 4,79 13,86 4,99
59,2 133,8 43,7 45,5 262,0 1,91 1,87 6,54 3,42 0,98 11,1 7,24 0,05 131,2 44,4 44,9 239,7 0,36 1,85 5,98 16,70 5,16
Table 22: second supersaturation test- calculations
P as MAP P as HAP MAP HAP Calcite X MAP X HAP X CALCITE
% % mmol mmol mmol % % %
0,00 100,00 0,00 0,16 0,22 0,0 42,0 58,0 0,10 99,90 0,00 0,27 0,00 0,3 99,7 0,0 7,54 92,46 0,10 0,41 0,00 19,6 80,4 0,0 1,62 98,38 0,03 0,51 0,00 4,7 95,3 0,0
Phosphate precipitates as HAP instead of MAP (HAP formation 90% higher); moreover when the pH value increases the calcite formation is favoured (58%). The third test was carried out adding (NH4)2HPO4. The results are reported in tables 23-24. Phosphate is removed mainly as hydroxylapatite instead of struvite, and the percent of calcite

Cecchi, Battistoni, Boccadoro, 2003, page 33
formation is below 16%, while it is absent at low pH value, when phosphate concentration increases.
Table 23: third supersaturation test- concentrations
P-PO4 pH* NaOH added N-NH4 K Mg Ca P Mg Ca Ca/PO4 Mg/PO4
mg/l mg/l ml in 100ml mg/l mg/l mg/l mg/l mmol mmol mmol
19 131,64 43,62 46,09 119,77 0,61 1,90 2,99 4,88 3,09 2,83 9,62 1,45 114,87 43,02 40,78 56,23 0,00 1,68 1,40
26,6 136,57 42,71 44,51 115,87 0,86 1,83 2,89 3,37 2,13 6,51 8,63 0,45 129,70 42,64 41,47 66,51 0,00 1,71 1,66
39,2 142,86 42,48 44,64 117,88 1,26 1,84 2,94 2,33 1,45 10,24 8,37 0,30 141,04 45,27 41,10 62,19 0,33 1,69 1,55 4,70 5,12
54,6 32,22 157,93 43,13 43,88 89,07 1,76 1,81 2,22 1,26 1,03 19,60 8,28 0,12 154,51 41,77 37,64 54,73 0,63 1,55 1,37 2,16 2,45
79 165,12 43,16 44,5 117,74 2,55 1,83 2,94 1,15 0,72 40,64 7,90 0,10 163,35 42,69 43,23 89,54 1,31 1,78 2,23 1,70 1,36
Table 24: third supersaturation test-calculations
P as MAP P as HAP MAP HAP Calcite X MAP X HAP X CALCITE
% % mmol mmol mmol % % %
14,58 85,42 0,13 0,24 0,01 33,0 64,4 2,6 15,59 84,41 0,15 0,26 0,08 30,1 54,3 15,6 22,74 77,26 0,26 0,29 0,00 46,9 53,1 0,0 4,22 95,78 0,05 0,40 0,00 11,7 88,3 0,0
The fourth supersaturation test was carried out adding calcium as CaCl2 and (NH4)2HPO4. In tables 25-26 the results are shown.
Table 25: fourth supersaturation test- concentrations
P-PO4 pH* NaOH added N-NH4 K Mg Ca P Mg Ca Ca/PO4 Mg/PO4
mg/l mg/l ml in 100ml mg/l mg/l mg/l mg/l mmol mmol mmol
19 8,12 0,25 26,6 135,13 43,43 46,28 268,96 0,86 1,90 6,71 7,82 2,22
5,70 7,71 0,15 133,35 42,15 43,05 202,51 0,18 1,77 5,05 27,48 9,63 39,2 143,54 43,15 44,57 242,83 1,26 1,83 6,06 4,79 1,45
10,24 7,49 0,05 142,53 43,05 43,63 204,26 0,33 1,80 5,10 15,43 5,43
Tab. 26: fourth supersaturation test- calculations
P as MAP P as HAP MAP HAP Calcite X MAP X HAP X CALCITE
% % mmol mmol mmol % % %
19,71 80,29 0,13 0,18 0,76 12,4 16,9 70,7 4,14 95,86 0,04 0,30 0,00 11,5 88,5 0,0

Cecchi, Battistoni, Boccadoro, 2003, page 34
Calcite formation is not observed at low pH values (7.5) while, when the pH value is about 7.7, calcite prevails. However the removal of phosphate prevalently as HAP (80-95%) is observed. During the fifth test (NH4)2HPO4 and calcium (100 mg/l) were added. Tables 27-28 show the results.
Table 27: fifth supersaturation test- concentrations
P-PO4 pH* NaOH added N-NH4 K Mg Ca P Mg Ca Ca/PO4 Mg/PO4
mg/l mg/l ml in 100ml mg/l mg/l mg/l mg/l mmol mmol mmol
18,8 130,27 43,85 46,99 231,01 0,61 1,93 5,76 9,50 3,19 3,77 8,48 8,3 125,75 42,82 43,87 168,39 0,12 1,80 4,20 34,55 14,84
27 139,71 43,88 46,45 211,21 0,87 1,94 5,27 6,05 2,23 14,39 8,12 8,2 136,88 44,58 47,25 185,32 0,46 1,94 4,62 9,96 4,18
30 140,98 43,18 45,44 206,71 0,97 1,87 5,16 5,33 1,93 15,94 8,04 0,08 141,56 43,84 45,26 176,37 0,51 1,86 4,40 8,56 3,62
38 154,6 43,71 45,92 185 1,23 1,89 4,62 3,77 1,54 21,93 7,88 0,02 151,85 42,9 44,32 147,38 0,71 1,82 3,68 5,20 2,58
Table 28: fifth supersaturation test- calculations
P as MAP P as HAP MAP HAP Calcite X MAP X HAP X CALCITE
% % mmol mmol mmol % % %
26,48 73,52 0,13 0,12 0,97 10,6 9,8 79,7 0,00 100,00 0,00 0,14 0,00 0,0 100,0 0,0 1,63 98,37 0,01 0,15 0,01 4,4 87,7 7,9
12,70 87,30 0,07 0,15 0,18 16,4 37,6 46,0 This test shows the removal of phosphate as HAP. The percent of MAP, HAP and calcite conversions are apparently anomalous because of their variability during the test. The trends of the five supersaturation curves are showed in figure 14.

Cecchi, Battistoni, Boccadoro, 2003, page 35
Figure 14: supersaturation curves
0
10
20
30
40
50
60
70
80
90
7 7,5 8 8,5 9 9,5 10
pH
mg/
l P-P
O4
Serie1Serie2Serie3Serie4Serie5
The figure shows two supersaturation curves (1 and 3) for higher pH, and two curves (2 and 4) for lower pH. At lower pH and higher P concentration precipitation of HAP (85-95%) and MAP (10-15%) occurs. When P content decreases, at higher pH, precipitation of calcite (60-80%), HAP(10-30%) and MAP(10-15%) takes place.
Methodology used in the study of crystallisation tests The study on the pilot plant is based on the following methodology. The whole period of crystallisation tests, roundabout 2 years, was analysed with particular concern for the following tips:
1) Definitions of the operational parameters which are characteristic of the test 2) SCP monitoring by on-line measurements (pH, flow rates, ORP) and discrete analysis
Inlet concentrations (in the stripping column) Outlet concentrations (from FBR reactor) Control of real bed fluidity
3) Exhausted sand analysis at the end of each run 4) Mathematical modelling
First period Operational parameters During the first period some problems caused the impossibility to have on line data recording. The following table shows the automatically registered parameters.

Cecchi, Battistoni, Boccadoro, 2003, page 36
Table 29: operational parameters
Q feed Q in Q recycle Q air pH ORP T air T stripper m3/h m3/h m3/h N m3/h mV °C °C average Min Max Std.Dev.
Even if no data is recorded, the criteria used in the definition of their value are:
o Q feed represents the flow rate of the supernatant taken from the dewatering section. The value should be lower than 9 m3/h to avoid high turbulence in the pumping section that could drag suspended solids in the SCP plant. The pumps, which take the supernatant from the dewatering station, do not run continuously but only after sludge dewatering operations, that is to say when supernatant is get.
o Q in represents the feed to the SCP plant: its values range from 1 to 1.5 m3/h. This value permits to have continuous feeding of the SCP and to guarantee an adequate contact time.
o Q recycle represents the flow that enters from the bottom of the FBR reactor and its value should be chosen considering that the sand in the FBR reactor should be kept in suspension to guarantee a fluidised bed. Values of about 6 m3/h are recommended.
o Q air is the air flow rate in the stripping column needed to raise the pH at values higher than 8. Values ranging from 40 to 60 m3/h are enough to guarantee the optimum pH.
o The pH value depends on the capability of CO2 stripping from the supernatant by the air stream. Values from 8.1 to 8.9 are enough to guarantee MAP and HAP crystallisation.
o ORP is only a control parameter but not always available, because of the aptitude of the probes to become dirty in few days of operation.
Inlet and outlet concentrations During the crystallisation tests, samples of the inlet were taken and analysed for total alkalinity, phosphorus, ammonia content and pH. Some parameters (i.e. Ca, Mg, K) were analysed by Ancona University laboratory. Occasionally also suspended solids were analysed. Average values are summarised in tab.30

Cecchi, Battistoni, Boccadoro, 2003, page 37
Table 30:inlet concentrations pH Ptot PO4-P NH4-N K Mg Ca Alk-M P Mg Ca
mgP/l mgP/l mgN/l mg/l mg/l mg/l mg/l mmol mmol mmol 7,73 31,2 18,6 54,5 0,60 7,71 31,2 25,7 54,5 0,83 7,62 22,2 12,8 10 0,41 7,7 18,7 12,8 41,4 0,41
7,56 23,2 15,3 10,4 30,7 40,9 124,5 825 0,49 1,68 3,11 7,47 25,5 20 18 28,3 36,4 119,8 1080 0,65 1,50 2,99 7,62 20,5 18,9 30,2 39,1 125,6 880 0,61 1,61 3,13 7,69 18,9 17,7 31,2 40,4 126,8 1015 0,57 1,66 3,16 7,68 21,5 20,2 33 41,5 131,8 1010 0,65 1,71 3,29
16,5 15,6 0,50 15 14,8 0,48 14,4 0,46 14,5 14,2 0,46 14,1 14 0,45 13,5 13,1 0,42 18 17,4 0,56 19,3 19,3 0,62 0,00 29,1 27,7 0,89 32 22,2 0,72 34,3 32 1,03 41 41 1,32 33,4 29,3 0,95 33 32 1,03 32 30 0,97 39 36 1,16
Because it is a full-scale pilot, the characteristics of the supernatant used as reactor inflow are linked to the operation of the whole wastewater treatment plant. Furthermore, the Treviso sewerage network is characterised by consistent infiltration flows that bring to the wastewater dilution with an average value of influent P of 4 mg/l. This situation and the problems encountered in the management of the digester in mesophilic conditions, resulted in a supernatant low in P during the period of these experiment. Looking at Tab.31, which represents the supernatant characteristics, it is clear that it was necessary to add phosphorus in the supernatant to run singificant crystallisation tests. P content, thus, was raised with the addition of phosphorus salts (H3PO4or (NH4)2HPO4). Outlet concentrations, average values, are summarised in Tab.32

Cecchi, Battistoni, Boccadoro, 2003, page 38
Table 31: supernatant characteristics
t pH Alkalinity PO4 -P Ptot NH4-Nh mg/l mgP/l4 mgP/l mgN/l 0 7,34 670 10,6 12.02 163,4
Table 32: outlet concentrations
pH Ptot PO4-P NH4-N K Mg Ca Alk-M P Mg Ca mgP/l mgP/l mgN/l mg/l mg/l mg/l mg/l mmol mmol mmol
8,05 12,9 8,9 940 0,29 0,00 0,00 8,3 11,1 2,5 800 0,08 0,00 0,00 7,6 9,8 7,9 28 875 0,25 0,00 0,00
8,26 12,3 12,1 29,6 39,4 125,1 825 0,39 1,62 3,12 8,1 14,3 13,6 10 33 39,1 114 918 0,44 1,61 2,84 8,2 10,5 10 12 33 38,1 111,8 878 0,32 1,57 2,79 8,6 5,3 7,9 36,2 33,3 24,2 49 490 0,25 1,00 1,22
8,45 12,4 10,3 19,6 29,2 36 93,9 915 0,33 1,48 2,34 8,64 10,2 10,3 35 33 42,4 128 805 0,33 1,74 3,19 8,23 0,00 8,25 10,3 9,2 0,30 8,45 9,2 0,30 8,39 9,4 9,1 0,29
10,2 9,4 0,30 8,44 0,00 8,4 9,5 9 0,29
8,35 11 10,2 0,33 8,73 13,7 11 0,35 8,64 6 4,5 8,51 13 12,3 8,67 13,4 12,7 8,94 18,8 12,2 8,62 26,9 23 8,37 22 13,4 8,55 18,5 14,7 8,36 20 18,4 8,57 17,8 15,7 8,9 15,2 11,9
8,93 9,5 7,6 9,5 7
Control of the fluidised bed To have the possibility of P salts deposition around the seed material (sand) it is necessary to guarantee the fluidity of the sand bed that is keep the sand particles in suspension. To verify this condition during the crystallisation tests some controls were planned. They are based on the so called V’10 test: one litre of sample was taken from each of the four different heights of the FBR and put in an Imhoff cone; after 10 minutes the volume of the settled material was observed. The comparison among the 4 values indicates whether the amount of sand is uniform along all the bed and therefore if there is fluidity of the sand. However, in this first period no analyses concerning V’10 were carried out.

Cecchi, Battistoni, Boccadoro, 2003, page 39
Model control and process performances Process performances were evaluated on the basis of conversion (X%), crystallisation (η%) and precipitation efficiencies (L%). The average of these parameters is clearly showed in the following figure (Fig.15). The equations for their determination are expressed below (Eq.20-21-22).
Figure 15 definition of removal efficiencies
Nucleation efficiency (η%)
intot
outtotintot
POPOPO
4
4 4 )(100% −=η Eq. 20
Precipitation efficiency (L %)
in 4tot
out 4solout 4tot
PO)PO(PO100L% −
= Eq. 21
Phosphates conversion (X%)
in 4tot
out sol 4in 4tot
POPO -PO100L%%X% =+=η Eq. 22
To obtain the real performances of the crystallisation process, the values of Ptot and PO4-P determined by chemical analyses in the inlet and outlet, were substituted in the explained formulas. To evaluate if the theoretical model was representative of the real process, a comparison between calculated data from experimentation (obtained data) (equations 20,21,22) and the data derived from the application of the model (equations 25,26) (previewed data) was made. Previous experiments proved that nucleation efficiency is strongly related to the operational pH, both for laboratory scale experiments (Battistoni et al., 1998a) and for half scale experiments (Battistoni et al., 2001a) but, (Battistoni et al., 2001a), a saturational model is not adequate enough to describe the dependence of nucleation efficiency on the process parameters, since a strong dependence of η not only on pH, but also on the contact time (tc), does exist. Therefore a double saturational model, taking into account both for pH and tc, was devised, which is in excellent agreement with the experimental results. The model is expressed by the following equation (Battistoni et al., 2001b):
( )( ) 0.0170t
t0.5017.322pH
7.322pH100%ηc
c
+⋅
+−−
= Eq. 23
PTIN
Pη P PTOT in TOT out% =
−TOT in
100
η
X L η% % %= +
X
PTOUT
PP SOL
SOL
PP SOL
SOL
L P PTout Sout% = −T in
100
LP
PTIN
Pη P PTOT in TOT out% =
−TOT in
100
η
X L η% % %= +
X
PTOUT
PP SOL
SOL
PP SOL
SOL
PTIN
Pη P PTOT in TOT out% =
−TOT in
100
η
X L η% % %= +
X
PTOUT
PP SOL
SOL
PP SOL
SOL
L P PTout Sout% = −T in
100
LP

Cecchi, Battistoni, Boccadoro, 2003, page 40
while, as for all the experimental results carried out on the half scale pilot plant (Battistoni et al., 2001a + Battistoni et al., 2001b), the model is represented by the following equation:
( )( ) 0.0189t
t0.4407.329pH
7.329pH100%ηc
c
+⋅
+−−
= Eq. 24
A general model, which describes all the experiments carried out on FBR (Battistoni et al., 1998a + Battistoni et al., 2001a + Battistoni et al., 2001b), is the following:
( )( ) 0.0196t
t0.3717.325pH
7.325pH100%ηc
c
+⋅
+−−
= Eq. 25
The values of r2 and of the standard error (S.E.) for Eqs(23)-(25) are reported in Table 33.
Table 33: R2 and S.E. values R2 S.E. n* Battistoni, et al.,2002 0.99 2.3 12 Battistoni, et al.,2002; Battistoni et al., 2001 0.99 3.3 27 Battistoni, et al.,2002; Battistoni et al., 2000; Battistoni et al., 2001 0.99 4.9 44
The introduction of the double saturational model (Eqs 23-25) in a pH range which can be easily obtained (8.1 - 9.1), allows to set the most suitable contact time to get the desired crystallization efficiency. Conversion (X) and nucleation (η) must be considered as concomitant phenomena, thus phosphorus removal cannot be optimised considering only the nucleation process on the basis of double saturational model (Eqs 23-25); in fact if conversion efficiency is sensibly higher than nucleation efficiency, a meaningful loss of fines is obtained. The precipitation efficiency (L) is given by the difference between X and η. The precipitation process is obviously undesired, since it enhances particulate phosphorus run-offs with fines and a complex plant would be necessary to provide an additional filtration step, thus decreasing the value of η. The behaviour of X as a function of pH can be described using a saturational model (Battistoni et al., 2001b):
( )( ) 0.387.21pH
7.21pH100%X+−
−= Eq. 26
for which R2 = 0.99 and n = 44 Contact time is expressed by:
t n HRTHRT
HRTHRT
V V VQ
QV
VQ
VQ
c EXPT
FBREXP
i
RIC EXP
RIC
TOT
i= ⋅ = =
+ +=.
( )1 2 3
3
ε αε
Eq. 27 With the substitution of the real parameters obtained during the crystallisation tests, it is possible to obtain the predicted performances. The comparison of the obtained and predicted data, during the first period of operation, is showed in the following table.

Cecchi, Battistoni, Boccadoro, 2003, page 41
Table 34: obtained and predicted performances
predicted obtained X%= η%= L%= X%= η%= L%=
69 65 4 72 59 13 74 71 3 92 64 28 51 42 9 64 56 9 73 71 3 35 34 1 70 67 3 41 38 3 72 69 3 61 59 2 79 76 2 62 74 -13 77 74 2 46 34 11 79 77 2 52 53 -1 73 70 3 39 31 7 77 74 2 37 35 2 76 73 3 33 28 6 76 74 3 33 30 4 76 73 3 43 39 4 75 72 3 43 29 14 79 77 2 58 55 2 77 75 2 60 58 2 79 77 2 64 45 19 79 77 2 67 46 21 75 73 3 56 45 11 78 76 2 44 39 5 75 73 3 51 44 7 78 76 2 70 61 9
The obtained crystallisation is not as high as expected from the model. Though good crystallisation efficiencies were obtained also the precipitation phenomenon occurred meaning that autonucleation of phosphates occurred instead of growth of sand particles. Autonucleated phosphates represent fines particles that are not recoverable and can leave the process getting away from the Dortmund device.
The substitution of Dortmund device The first period of operation was characterised by a loss of fines (high values of L%). Furthermore the deposition of sand particles in the Dortmund was observed, meaning that the Dortmund superficial area was not large enough to retain all the sand particles of the fluidised bed. To retain sand particles more efficiently a new Dortmund had to be designed. The new Dortmund was designed as shown in picture number 17 ( preceded by the old one for comparison). In table 34 there is the comparison between the old and the modified configuration. With the increase of the superficial area the rising velocity of the particles from the bottom decreases and, according to Stokes’ law, it is possible to retain smaller particles, maintaining the same value of recirculation flow-rate.

Cecchi, Battistoni, Boccadoro, 2003, page 42
Figure 16: presence of sand particles in the Dortmund device
Table 35: design parameters of the new Dortmund
old conditions Φend 1,2 m Aend 1,13 m2
Φweir 1,14 m Aweir 1,02 m2
Φin 0,6 m Ain 0,28 m2
modified conditions Φmod 1,88 m Aweir mod 2,77 m2
Fig 17a. The old Dortmund device
OLD DORTMUND DEVICEmeasures in cm

Cecchi, Battistoni, Boccadoro, 2003, page 43
Fig 17b. The new Dortmund device
60260
25
Side View Measures in cm
28 60
188
60
260
188
Plan Measures in cm
43
94
98 104

Cecchi, Battistoni, Boccadoro, 2003, page 44
Second period The second period started in July 2001 and ended in April 2002. Actually, during this long period the plant had some problems and didn’t run continuously. From October 2001 to January 2002 the demonstrative plant was stopped because of problems encountered with low temperatures (part of the plant was frozen) and due to breakage of pumps. Therefore the period was studied as a whole with the usual methodology. Operational parameters The operational parameters were kept in the recommended range. Only some observations can be added:
- the air flow rate registered from February was not a real value, because there were problems in the measure of the blown air;
- the registered pH derived from the probe lecture but in the following calculations a pH, measured in laboratory from the collected samples, will be utilised.
Table 36: operational parameters
period Q feed Q in Q recycle Q air pH ORP T air T stripper
m3/h m3/h m3/h Nm3/h mV °C °C
jul-01 average 1,4 1,4 6,2 35,4 8,1 -136,7 29,2 27,6
min 0,1 1,4 6,1 33,4 8,0 -274,3 28,4 27,2
max 3,0 1,4 6,2 38,5 8,2 -2,3 30,9 28,0
st dev. 1,0 0,0 0,1 1,8 0,1 98,3 0,9 0,3
aug-01 average 1,4 1,3 6,1 49,8 8,2 -412,8 28,4 28,2
min 0,1 0,4 4,4 33,5 7,3 -470,1 26,3 25,7
max 3,0 1,5 6,3 68,2 8,9 -135,3 29,9 29,8
st dev. 0,6 0,3 0,3 7,7 0,5 88,7 1,1 1,1
sep-01 average 1,3 1,0 5,4 60,9 8,8 24,0 25,8 25,8
min 0,1 0,5 0,6 21,6 8,4 21,6 24,0 24,0
max 3,2 1,2 6,3 117,7 9,0 26,5 27,0 27,0
st dev. 0,7 0,2 1,9 23,5 0,1 1,4 1,0 1,0
feb-02 average 2,2 0,7 6,1 4,3 9,0 114,3 12,6 16,3
min 0,2 0,2 5,8 0,0 8,7 12,5 10,6 12,7
max 4,5 1,2 6,6 15,2 9,3 178,0 15,2 19,8
st dev. 1,5 0,3 0,2 6,0 0,2 64,5 1,2 2,1
mar-02 average 1,4 1,1 4,9 0,5 8,9 -1,1 15,8 19,3
min 0,2 0,5 4,3 0,0 8,6 -165,0 14,7 17,5
max 3,1 1,3 6,0 1,1 9,3 133,0 16,8 20,5
st dev. 0,8 0,2 0,8 0,3 0,2 122,8 0,7 1,0

Cecchi, Battistoni, Boccadoro, 2003, page 45
Inlet and outlet concentrations Inlet and outlet concentrations are reported in Tab.37. In this period there are no analysis available for Mg, NH4,Ca and only phosphorus analysis are reported. They are, however, enough to calculate the process performances. The phosphorus added in the inlet stream, made the concentration rise up to 166 mgP/l. Apart from this period, only the complete test of analysis are reported and some test are joined together (if similar concentrations in the input were found). This led to only few analyzable tests in this period.
Table 37: inlet and outlet concentrations (February - March 2002)
inlet outlet
Ptot-P PO4-P pH Ptot-P PO4-P
mg/l mg/l mg/l mg/l
19/02/2002 60,5 39,3 8,3 23,5 13,6
21/02/2002 48,1 34,1 8,4 23,8 11,3
26/02/2002 166,1 109,9 8,2 57,4 26,2
01/03/2002 33,5 22,0 8,2 23,8 9,2
12/03/2002 32,9 18,7 8,4 19,0 11,1
13/03/2002 36,5 20,5 8,3 20,0 10,0
Control of the fluidised bed In this period several tests, for the control of the fluidity of the bed, were made based on the V’10 test; the observed result are shown in tab.38.
Table 38 V’10 tests H1 H2 H3 H4 V' 10 (ml/l) g/l V' 10 (ml/l) g/l V' 10 (ml/l) g/l V' 10 (ml/l) g/l oct-01 260 157,4 260 158,9 270 160,7 275 169,7 feb-02 352 358 365 365 feb-02 420 400 400 410 mar-02 345 167,5 345 167,5 355 174,1 365 179,9 mar-02 340 340 350 355 mar-02 550 490 290 240 apr-02 415 180 280 113 280 114,5 290 115,2 may-02 380 340 340 190
Analysing the V’10 values obtained at different heights of the bed in a single test, the fluidity of the bed can be confirmed or not. If a very different V’10 value is obtained it means that there are different sand concentrations in the FBR. In this case it is necessary to increase the value of the recycle flow rate, Q recycle to keep the particles in suspension. Further analysis consisted in weighing the sand in the sample.

Cecchi, Battistoni, Boccadoro, 2003, page 46
The following observations can be made: • The recycle flow rate determined the fluidity of the bed except for April and May when very
different value of V’10 were observed regarding the samples taken from the top and the bottom of the reactor.
• As crystallisation tests proceeded, a progressive lightening of the bed was observed; this could be ascribed to the deposition of light sludge particles lost from the dewatering station. A substitution of the exhausted and dirty sand with the new sand had to be done.
Before the substitution of the bed, from sand concentration data it was possible to evaluate the amount of sand in the FBR. Assuming a bed volume of 0.9 m3 and a maximum value of sand concentration of 200g/l, an amount of 180 kg is calculated. The amount of sand initially charged in the FBR was about 600 kg. This brings to two possible conclusions: either a lot of sand was lost during the tests (through the Dortmund) or a close-packed layer of sand was present at the bottom of the reactor. Used sand analysis
Sieve analysis of sand particles This analysis is used to evaluate the growth of sand particles thanks to the deposition of phosphorus salts. Sand samples were withdrawn once a month at the 4 different heights of the FBR and the comparison of the curves obtained according to the methodology previously described, shows a real increase of the particles diameters (the curve obtained is shifted on the right of the Cartesian axis represented in logarithmic scale) (fig.18).
Figure 17: Sieve analysis on sand particles during the first period
0,0
10,0
20,0
30,0
40,0
50,0
60,0
70,0
80,0
90,0
100,0
0,01 0,1 1
mm
%
october H1october H2october H3october H4verginesettember H1settember H2settember H3settember H4febrary H1febrary H2febrary H3febrary H4marzo H1marzo H2marzo H3marzo H4april H1april H2april H3april H4

Cecchi, Battistoni, Boccadoro, 2003, page 47
Bed porosity Another analysis used to confirm “bed growth”, is the bed porosity, which indicates the free volume on the bed total volume ratio (previously described). Bed porosity was carried out on the same samples of sand used for sieve analysis. As expected, there was a decrease of bed porosity with time (tab.39).
Table 39: bed porosity
virgin silica 0,74 September 0,72 October 0,67 February 0,67 March 0,67
Chemical analysis on sand Chemical analysis on the exhausted sand are summarised in tab.40.
Tab. 40: weight analysis on sand PARTICLE COMPOSITION sand growth silica MAP HAP Calcite Carbon + other
% % % % % % 13/02/2002 29,80 69,73 3,62 15,13 3,53 7,99 04/03/2002 36,10 63,91 6,46 19,22 3,41 7,01 26/03/2002 39,60 56,18 5,22 19,91 5,92 12,77 25/05/2002 45,70 52,78 4,04 24,74 0,00 18,44
There was a weight increase: in February the average growth (on a wet weight basis) was 30%, whilst in May, the percentage of increase was 46%. Also P-content in the sand increased both as MAP and HAP. Hydroxylapatite crystallisation was predominant rather than struvite due to the operational conditions of performing tests. A little increase in P percentage as MAP was observed from February, afterwards a decrease is observed from May. Tab.40 shows the percentages of substances included in a sand granule (i.e. silica, MAP, HAP, calcite). The highest percentage was obviously represented by silica, about 15-25% was represented by hydroxylapatite, struvite ranged from 3.6 to 6.5 % and calcite from 0 to 6%. There was also a moderate presence of carbonaceous compounds, analysed as COD (7-18%) that are a proof of the deposition of organic substances deriving from solids escaped by the dewatering station and not detained by the pre treatment units (e.g. decanter). This organic film, deposited around the sand particle, inhibits crystals growth on the activated sites of the seed material. To avoid this phenomenon it is necessary to built a device for solids capture.

Cecchi, Battistoni, Boccadoro, 2003, page 48
Process performances and model control The comparison between the obtained performances and the calculated ones with the application of the model equations, led to a quite different situation. Precipitation efficiency showed values higher than the expected ones because of fine particles formation. The last column of tab.41 represents the COD percentage, on weight basis, present on the sand grain. It is clear that this percentage grows with time because of the incoming of sludge particles.
Table 41: obtained and predicted performances
Predicted by the model obtained with experimentation Day X%= η%= L%= X%= η%= L%= COD
% % % % % % % 19/02/2002 74,1 71,0 3,2 77,6 61,2 16,4 7,7 21/02/2002 75,8 73,7 2,1 76,6 50,5 26,1 7,8 26/02/2002 72,3 69,6 2,7 84,2 65,4 18,8 8,5 01/03/2002 72,3 68,7 3,6 72,4 29,0 43,5 9,0 12/03/2002 75,8 73,3 2,5 66,4 42,2 24,1 10,0 13/03/2002 74,1 71,4 2,8 72,7 45,2 27,5 10,3
Sand bed replacement The replacement of the exhausted sand with virgin sand took place on May 2002. In detail:
• 12/05/02: all the plant was cleaned. 330 kg of sand were found in the FBR reactor, about 150 kg in the Dortmund. At the beginning of the plant start-up, the FBR was filled with 600 kg of silica sand.
• 20/05/02: a new gravel filter at the bottom of the FBR reactor was put, made of a layer of 40 cm of gravel (80 mm-diameter), a layer of 40cm of gravel (5-6 mm diameter). In the FBR reactor, 475 kg of virgin silica sand were added.
• 06/11/02: the plant started working again with the following operational conditions: • feed flow rate: 1m3/h; • recycle flow rate: 5 m3/d; • inlet phosphorus concentration (after P addition): about 50 mg/l.
To verify the effectiveness of fluidity, several V’10 tests were made. The test made on 13/06/02 confirmed the proper recycle flow rate applied since at every height the same V’10 was found (i.e. homogenous presence of sand along the reactor).
Table 42: V’10 registered at the new start up of the plant
V’ 10 ml/lH1 280 H2 280 H3 280 H4 280

Cecchi, Battistoni, Boccadoro, 2003, page 49
The supernatant coming from the dewatering station was analysed and chemically characterised. In table 43 the main parameters are reported. With the addition of external phosphorus, the P content in the inlet rose up to 50 mg/l.
Table 43: characteristics of the supernatant from belt press
Day pH Alk (4.3) Ptot PO4-P NH3 NO3-N SO4-S TSS mg/l mg/l mg/l mg/l mg/l mg/l mg/l 6 June 2002 8.14 1400 15 14.8 259 52 7 June 2002 8.03 1500 21 301 1.15 17.4 44 10 June 2002 7.58 1600 23.7 298 0.83 9.7 30
Third period In the third period (June 2002 - November 2002) new crystallisation tests were carried out. In this period the plant worked with a new silica bed and with a new Dortmund. These conditions were considered basic to have good results. Operational parameters The statistical values of the operational parameters are reported in tab.44.
Table 44: operational parameters
period Q feed Q in Q recycle Q air pH T air T stripper m3/h m3/h m3/h Nm3/h °C °C jun-02 average 0,56 0,86 3,88 5,79 8,96 28,12 28,77 min 0,10 0,10 0,67 0,98 8,45 22,60 25,60 max 2,80 1,40 6,20 14,70 9,24 35,60 35,00 st. dev. 0,99 0,44 2,17 5,09 0,28 3,74 2,75 jul-02 average 0,15 1,20 4,45 27,09 8,82 27,42 27,93 min 0,04 0,00 0,50 23,10 8,44 24,70 25,90 max 1,10 2,80 5,30 29,50 9,07 29,30 29,20 st. dev. 0,24 0,75 1,13 1,79 0,19 1,21 1,07 aug-02 average 0,23 0,82 4,09 24,32 8,71 28,56 27,28 min 0,05 0,60 3,80 21,50 8,54 26,20 25,70 max 0,70 1,10 4,20 27,90 8,83 29,90 28,00 st. dev. 0,27 0,21 0,17 2,52 0,12 1,47 0,95 sep-02 average 1,16 0,85 3,79 62,06 9,04 25,33 23,83 min 0,04 0,45 2,60 21,60 8,37 22,20 20,80 max 2,30 1,30 4,50 725,00 9,15 28,10 27,70 st. dev. 0,60 0,21 0,50 127,92 0,14 2,02 2,08 oct-02 average 1,17 0,88 4,01 14,93 9,08 21,65 19,90 min 0,10 0,00 2,70 0,00 8,84 18,60 18,60 max 3,40 1,30 4,80 50,30 9,60 24,00 20,80 st. dev. 0,81 0,34 0,51 16,21 0,17 1,33 0,56 nov-02 average 0,96 0,83 2,90 15,65 9,00 18,74 16,68 min 0,10 0,10 1,60 0,00 8,66 14,20 13,70 max 3,90 2,10 3,90 37,10 9,39 22,20 19,80 st. dev. 0,74 0,43 0,67 12,23 0,17 2,36 1,85

Cecchi, Battistoni, Boccadoro, 2003, page 50
The applied operational parameters ranged in the recommended intervals except for the inlet flow rate which slightly decreased. The registered value of air flow rate was not as expected because of technical problems in the measurement device. The reported value of pH was registered by the probe in the de-aeration column, but to calculate the process performances according to the equation derived from the mathematical model, pH was directly measured in the sample for chemical characterisation. Inlet and outlet concentrations Inlet and outlet concentrations determined in this period are reported in tab.45. Despite in this period the plant worked continuously, except during the month of August (personnel vacations), the number of available data is not very high because of technical problems concerning the feeding flow rate to the SCP plant; furthermore chemical analyses were only periodically carried out. These two factors brought to a relatively small number of complete tests to study the performances of the demonstrative plant and to validate the theoretical model adopted. The external addition of phosphorus produced Ptot a maximum influent concentration of 270 mg/l and a minimum of 30 mg/l. P as PO4 ranged from 25 to 247 mg/l. On the average, Ptot in the incoming flow was 108 mg/l, while soluble P was 93 mg/l. The outlet flow was characterized by Ptot = 48 mg/l and P soluble of 38 mg/l. The crystallisation tests of this period are characterised by wide variations of phosphorus concentrations and this permits to study the phenomenon of crystallisation in very different conditions.
Table 45: inlet and outlet concentrations (February-March 2002) inlet outlet Ptot-P Ptot P* PO4-P pH Ptot-P Ptot P* PO4-P mg/l mg/l mg/l mg/l mg/l mg/l 16/07/2002 150 108 101,7 8,43 70 27 23,4 18/07/2002 99 93 99 8,46 33,9 34 26,1 23/07/2002 68 68 50 8,42 66 72 25,5 29/07/2002 47,3 31 30,8 7,96 17,6 14 17,6 30/07/2002 61,9 51 56,35 8,42 28 27 28 31/07/2002 49 44 42,5 8,41 31,1 23 26 01/08/2002 86 85,6 8,4 29,7 26,44 04/08/2002 102 94,9 8,32 40 39 06/08/2002 250 247 8,18 57,7 40,8 03/09/2002 80 68 72,34 8,31 48,8 37 38,7 04/09/2002 92 28 90 8,42 35,2 71 33 05/09/2002 61,6 50 57,8 8,51 33 26 27,44 06/09/2002 65,6 56 59,3 8,43 35,2 26 26,2 10/09/2002 160 148 150 8,5 50 45 49 16/09/2002 79 46 75 8,62 28 12 23 22/10/2002 30 24 25 8,21 17 14 16,9 23/10/2002 133 129 131 8,51 57 57 55,6 24/10/2002 117 116 114 8,46 65 64 63,1 25/10/2002 105 104 100 8,5 57 57 57,2 28/10/2002 168 179 102 8,29 65 67 56,3 07/11/2002 270 119 164 8,45 48 31 27 11/11/2002 30 25 28,4 8,5 16 17 11,52 19/11/2002 214 206 193 8,3 167 146 143 average 109 85 94 8,39 48 43 38 max 270 206 247 8,62 167 146 143 min 30 24 25 7,96 16 12 12
NB: concentrations of Ptot * derive from other HPLC analysis made at the University of Ancona, laboratory of Hydraulics.

Cecchi, Battistoni, Boccadoro, 2003, page 51
Control of bed fluidity Also in this period, several test of V’10 were carried out to control the fluidity of the sand bed. Results are shown in tab.46.
Table 46: V’10 tests Q recycle H1 H2 H3 H4 m3/h V' 10 (ml/l) g/l V' 10 (ml/l) g/l V' 10 (ml/l) g/l V' 10 (ml/l) g/l
jun-02 4,0 380 340 340 190 jun-02 5,0 280 280 280 280 jul-02 4,8 500 362 500 357,6 500 360 490 357 aug-02 4,2 450 460 460 460 oct-02 4,2 500 330 500 320 510 365 480 323 nov-02 2,8 550 484 500 456 490 377 450 280 nov-02 3,9 520 540 530 520
From the results it can be confirmed that the adopted values of recycle flow rate are adequate (except for the first test of June made as soon as the FBR was filled with the new sand). This kind of approach gives information about the homogeneous fluidity of the bed but is not useful to determine the amount of sand which is actually kept in suspension. To evaluate the amount of sand effectively fluidised, give a look at tab 47 that summarises the computations made to estimate the percentage of fluidised sand on the basis of the following hypotheses:
- 475 kg of initial virgin silica sand; - the increasing percentage is determined according to weight analysis on exhausted
sand (tab.50); - the concentration of the sand comprised between two following heights of the FBR
is the same of the sample taken at the higher point; - the sand concentration in the upper section of the FBR is assumed equal to the
concentration in H4.
Table 47: amount of really fluidised silica
total mass in FBR after growth
fluidised total mass
not fluidised total mass
not fluidised silica
kg kg kg % July 576 290 286 49,60 October 717 303 415 57,8 November 736 329 407 55,3
From this table it appears that a large amount of silica was packed at the bottom of the FBR.

Cecchi, Battistoni, Boccadoro, 2003, page 52
The fluidity of the bed was only partial even if homogeneous. Tab 47 confirms this assertion because the weight of sand in the sample taken at first height is less than expected. To confirm this hypothesis further fluidity tests (V’10 and concentration of sand in the sample) had to be done at very different values of recycle flow rate. Used sand analysis
Sieve analysis The sieve analysis of sand particles was made on samples taken from the bed at different heights, according to the previously described methodology. The results of the analysis are reported in figure 19: the graph of the last sample of sand is more shifted to the right if compared to the one of the previously analysed sample. Also the curve of the virgin sand is reported. A visible growth of the sand grain is observed: Φ50 of the sand (i.e. diameter of the 50% of the sand, on a wet weight basis), passed from 0.09 mm to 0.18 mm in the observed period.
Figure 18: sieve analysis of sand particles
0,0
10,0
20,0
30,0
40,0
50,0
60,0
70,0
80,0
90,0
100,0
0,01 0,1 1
mm
%
lug-02 H1lug-02 H2lug-02 H3lug-02 H4vergineott-02 H1ott-02 H2ott-02 H3ott-02 H4nov-02 H1nov-02 H2nov-02 H3nov-02 H4
Bed porosity The calculated values of bed porosity confirm the increase in particles diameter. When the bed was made of virgin sand, the porosity was 0.80, whilst at the end of this period, the porosity decreased at 0.62. (Tab.48)
Table 48: values of bed porosity with time
period ε Virgin silica 0,80 July 0,75 October 0,64 November 0,62

Cecchi, Battistoni, Boccadoro, 2003, page 53
It is important to notice the variation in the sand specific weight (Tab 49) which changed from 2.66 g/ml to 2.18 g/ml meaning that there was a progressive lightening of the particles probably due to the deposition of lighter suspended solids.
Table 49: sand characteristics with treated volumes
Treated volume Φ50 thickness Bed
porosity (ε) specific weight of exhausted
sand specific weight of
nucleated m3 mm mm kg/m3 kg/m3
Virgin sand 0 0,09 --- 0,8 2,66 ---
July 634 0,14 0,025 0,75 2,37 0,71
October 1900 0,16 0,035 0,64 2,24 1,38
November 2194 0,18 0,045 0,62 2,18 1,37 The decrease in specific weight determined also the loss of particles from the Dortmund because of the change in the physical characteristics of the materials to be retained by the Dortmund. This can bring to a change in the choice of the recycle flow-rate. The growth of sand particles is confirmed by the sieve analysis summarised with the Φ50 value which changes from 0,09 mm (virgin sand) to 0,18 mm (exhausted sand) with a consequent decrease in bed porosity. The sand specific weight lowered because of the deposition of lighter materials. Comparing chemical and sieve analysis results, it can be concluded that the progressive nucleation corresponds to an average deposit with a 45 µm thickness and a lightening of the fluidized bed: lower recycling flow-rates are therefore required to avoid sand losses. In fig20 the observed variations (diameter and specific weight of sand particles, bed porosity) are reported versus the volumes of treated supernatants.
Figure 19: physical variations of sand
00,10,20,30,40,50,60,70,80,9
0 500 1000 1500 2000 2500
m3 trattati
diam
etro
med
io (m
m)-
poro
sità
0
0,5
1
1,5
2
2,5
3
peso
spe
cific
o (k
g/m
3)
diametro medio mmporositàpeso specifico kg/m3
Φ 50porosity
Specific weight
Treated volumes m3

Cecchi, Battistoni, Boccadoro, 2003, page 54
Chemical analyses Chemical analyses on the exhausted sand allowed to determine the composition of the nucleated material. It is clear (see table 50) that the nucleated material grew in time (from 21%w.w. to a maximum of 55%w.w. computed on the wasted sand).
Table 50: particle sand analysis on weight basis CODNucleated MAP/nucleatedCa3(PO4)2/nucleatedCaCO3/nucleated volat.sub./nuc others/nuc % % % % % % %
23/07/2002 0,7 21% 11,9 51,6 5,0 2,5 29,0
08/10/2002 1,1 51% 24,3 59,6 0,0 1,1 15,0
18/11/2002 1,6 55% 13,3 64,9 0,6 1,2 19,9 The salts present were MAP and calcium phosphate (CP) and there was no evidence of calcite presence; for the first time the calcium mass balance strongly supported CP formation rather than HAP. The organic substances were measured either as COD or as volatile products. The COD in the exhausted sand increased with time, but volatile substances content in nucleated fraction appeared to be quite constant. This does not suggest the possible mechanism of inclusion (e.g. growth of a thin biomass film, deposit of volatile suspended solid in nucleation material). In a previous period a consistent loss of total suspended solids or sludge from the dewatering section has always been observed and this determined the accumulation of volatile substances in the nucleated material with a gradual increase up to 9,5%. The comparison among these different results lets conclude that the growth of a biomass film on sand can be more feasible treating a well pre-treated anaerobic supernatant (24-36 mg/l of TSS ). Scanning electron microscopy of exhausted sand revealed two different kind of deposits associated with the main presence of MAP or CP (table 51) associated with a morphology quite similar to those previously observed in bench scale pilot plant (Battistoni et al, 2001).
Table 51: relatively molar percentage Mg (% ) P (%) Ca (%) MAP (%) CaP (%)
type 1 5 36 59 19 81 type 2 38 57 5 96 4
The nucleated material can be well studied using X-ray analysis; in particular exhausted sand (bed of November) showed a partially crystalline deposit explained with the formation of Ca and P salts (CP, HAP or others) in agreement with a P salts to silica weight ratio of 30 to 70 (figure 21).

Cecchi, Battistoni, Boccadoro, 2003, page 55
Figure 20: d X ray analysis
0
1000
2000
3000
4000
5000
6000
7000
8000
0 10 20 30 40 50 60 70 80
2θ
Cou
nts
SCALING
DHV CRYSTALLACTOR
FBR TREVISO
The same partially crystalline deposit was observed on nucleated material drawn from a DHV Crystallactor (Geestmerambacht, The Netherlands): in this case the deposit was mainly constituted by Ca and P salts (P salts to silica weight ratio 80/20). Finally, a complete crystalline scaling on diffuser device of Treviso FBR, was observed mainly formed by MAP and HAP or CP salts. Parameters for agricultural re-use The possibility to employ the exhausted sand as a fertilizer is connected with the P% and N% content (table 52); at the moment there is not enough N to identify the produced pellets as a P-N fertiliser according to Italian law (L.748/84). This condition can be reached only with 55% of nucleated on sand where phosphorus is all coming from MAP; on the contrary a P fertilizer condition can be easily obtained with CP deposit (October-November).
Table 52: P and N content for fertiliser products
Nucleated (%) %P %N P-N fertilizer (L748/84) P fertilizer (L748/84)
July 21% 2,5 0,1 P 2,2% P 4,4 %
October 51% 7,6 0,7 N 3%
November 55% 8,1 0,4

Cecchi, Battistoni, Boccadoro, 2003, page 56
Process performances and model control Table 53 shows the comparison between the obtained and predicted performances. The results permit a double evaluation: one in terms of the performances really obtained in the SCP plant, the second allows a comparison with the performances expected from the model. Regarding this last point, at present it is not possible to validate the theoretical experimental model proposed. In fact the real operational conditions are very variable due to the problems encountered during the technical management of Treviso WWTP that brought to very variable parameters also in the SCP area (e.g. inlet flow rate with very different P mass loading, wide range of operative pH, presence of suspended solids). Thus it is necessary to have a more detailed and efficient control of working parameters. The evaluation of process performances showed satisfactory results, except for singular events like the one registered in day 07/23/02. The average conversion efficiency was 62% with a maximum value of 90% and minimum of 33%. Nucleation efficiency, without taking into account the singular event, ranged from 22 to 82%, with 56% on average. Precipitation efficiency had to be as less as possible if loss of fine was avoided: values in this third period of experimentation ranged from 5 to 15% (without the anomalous event). The obtained performances can not be evaluated without taking into account the influent characteristics. With the help of table 54 it can be deduced that high concentrations of P are linked to the performances that were lower than expected (see October). The analysis of chemical-physical composition shows a stoichiometric lack of Ca e Mg for MAP and HAP formation. The lack of ions is probably due to the practice of washing the belt press thus diluting the collected supernatant. Tab.55 calculates the amount of P (mmols and milligrams) utilised to form MAP and HAP and, consequently, the amount of surplus P that can not precipitate as P salts. In conclusion, in Tab.56 the performances obtained and the maximum that could be obtained in terms of stoichiometry are summarized.

Cecchi, Battistoni, Boccadoro, 2003, page 57
Table 53: comparison of predicted and obtained results
inlet outlet predicted obtained Day Q in Ptot-P Ptot P* PO4-P pH Ptot-P Ptot P* PO4-P X η L X η L
m3/d mg/l mg/l mg/l mg/l mg/l mg/l % % % % % % 16/07/2002 1,3 150 108 102 8,4 70 27 23 76 73 2,9 84 82 2,4 18/07/2002 1,1 99 93 99 8,5 34 34 26 77 74 2,6 74 66 7,9 23/07/2002 1,2 68 68 50 8,4 66 72 26 76 73 2,8 63 3 59,6 29/07/2002 1,4 47 31 31 8,0 18 14 18 66 62 4,6 63 63 0,0 30/07/2002 0,9 62 51 56 8,4 28 27 28 76 74 2,4 55 55 0,0 31/07/2002 1,3 49 44 43 8,4 31 23 26 76 73 2,9 47 37 10,4 01/08/2002 1 86 86 8,4 30 26 76 73 2,6 69 65 04/08/2002 0,7 102 95 8,3 40 39 74 72 2,5 62 61 3,8 06/08/2002 0,9 250 247 8,2 58 41 72 69 3,1 84 77 1,0 03/09/2002 2,3 80 68 72 8,3 49 37 39 74 70 4,2 52 39 12,6 04/09/2002 2,1 92 28 90 8,4 35 71 33 76 72 3,8 64 62 2,4 05/09/2002 2,2 62 50 58 8,5 33 26 27 77 74 3,8 55 46 9,0 06/09/2002 2,2 66 56 59 8,4 35 26 26 76 72 3,9 60 46 13,7 10/09/2002 1,3 160 148 150 8,5 50 45 49 77 75 2,8 69 69 0,6 16/09/2002 1,1 79 46 75 8,6 28 12 23 79 76 2,4 71 65 6,3 22/10/2002 1,3 30 24 25 8,2 17 14 17 73 69 3,4 43 43 0,7 23/10/2002 1,3 133 129 131 8,5 57 57 56 77 75 2,8 58 57 1,1 24/10/2002 1,2 117 116 114 8,5 65 64 63 77 74 2,7 46 44 1,8 25/10/2002 1,1 105 104 100 8,5 57 57 57 77 75 2,5 45 45 0,1 28/10/2002 1,2 168 179 102 8,3 65 67 56 74 71 3,1 66 62 4,9 07/11/2002 0,73 270 119 164 8,45 48 31 27 77 74 2,2 90 82 7,8 11/11/2002 0,85 30 25 28,4 8,5 16 17 11,52 77 75 2,3 62 47 14,9 19/11/2002 0,6 214 206 193 8,3 167 146 143 74 72 2,4 33 22 11,2
average 1 109 85 94 8,39 48 43 38 75 72 3 62 54 8
max 2 270 206 247 8,62 167 146 143 79 76 5 90 82 60 min 0,60 30 24 25 7,96 16 12 12 66 62 2 33 3 0
P* is referred to HPLC analysis

Cecchi, Battistoni, Boccadoro, 2003, page 58
Table 54: inlet flow characteristics
Day Ptot-P PO4-P NH4-N K Mg Ca Ca/Mg P Mg Ca MAP HAP MAP+HAP removable P excess P Max removal
mg/l mg/l mg/l mg/l mg/l mg/l mmol mmol mmol mol P mol P mol P mg mol P %
16/07/02 150 102 270 76 29 47 1,6 4,84 1,18 1,16 1,18 0,70 1,88 58 2,96 39
18/07/02 99 99 274 70 29 57 2,0 3,19 1,20 1,43 1,20 0,86 2,05 64 1,14 64
23/07/02 68 50 262 82 48 61 1,3 2,19 1,98 1,53 1,98 0,92 2,90 90 -0,71 100
29/07/02 47 31 166 32 29 66 2,3 1,53 1,18 1,66 1,18 0,99 2,17 67 -0,64 100
30/07/02 62 56 247 53 37 81 2,2 2,00 1,52 2,02 1,52 1,21 2,73 85 -0,74 100
31/07/02 49 43 256 63 38 74 1,9 1,58 1,58 1,86 1,58 1,11 2,69 83 -1,11 100
01/08/02 86 86 261 63 37 63 1,7 2,77 1,52 1,57 1,52 0,94 2,46 76 0,31 89
03/09/02 80 72 277 55 26 61 2,3 2,58 1,08 1,52 1,08 0,91 2,00 62 0,58 77
04/08/02 102 95 281 56 8 31 3,8 3,29 0,33 0,77 0,33 0,46 0,79 25 2,50 24
06/08/02 250 247 143 11 23 28 1,2 8,06 0,95 0,69 0,95 0,42 1,36 42 6,70 17
04/09/02 92 90 277 51 37 83 2,2 2,97 1,51 2,06 1,51 1,24 2,75 85 0,22 93

Cecchi, Battistoni, Boccadoro, 2003, page 59
Table 55: inlet flow characteristics Day Ptot-P PO4-P NH4-N K Mg Ca Ca/Mg P Mg Ca MAP HAP MAP+HAP Removable P excess P Max removal
mg/l mg/l mg/l mg/l mg/l mg/l mmol mmol mmol mol P mol P mol P mg mole P %
05/09/02 62 58 264 49 32 71 2,3 1,99 1,31 1,78 1,31 1,07 2,37 74 -0,39 100
06/09/02 66 59 232 39 29 62 2,1 2,12 1,19 1,54 1,19 0,93 2,12 66 0,00 100
10/09/02 160 150 295 41 29 60 2,1 5,16 1,18 1,49 1,18 0,90 2,07 64 3,09 40
16/09/02 79 75 256 46 32 76 2,3 2,55 1,33 1,90 1,33 1,14 2,47 77 0,08 97
22/10/02 30 25 12 37 52 1,4 0,96 1,54 1,29 1,54 0,77 2,32 72 -1,36 100
23/10/02 133 131 337 15 34 57 1,7 4,29 1,39 1,43 1,39 0,86 2,24 70 2,05 52
24/10/02 117 114 15 27 58 2,1 3,76 1,12 1,45 1,12 0,87 1,99 62 1,77 53
25/10/02 105 100 296 15 24 50 2,1 3,37 0,99 1,25 0,99 0,75 1,74 54 1,63 52
28/10/02 168 102 200 9 84 77 0,9 5,42 3,47 1,91 3,47 1,15 4,62 143 0,80 85
07/11/02 270 164 209 28 72 76 1,1 8,71 2,96 1,90 2,96 1,14 4,10 127 4,61 47
11/11/02 30 28 244 52 40 85 2,2 0,97 1,63 2,13 1,63 1,28 2,90 90 -1,94 100
19/11/02 214 193 290 28 34 68 2,0 6,90 1,39 1,69 1,39 1,02 2,41 75 4,50 35

Cecchi, Battistoni, Boccadoro, 2003, page 60
Table 56: relationship between obtained performances and maximum nucleation removal deduced from stoichiometry
obtained maximum nucleation removal Day X h L
% % % % 16/07/2002 84 82 2,4 39 18/07/2002 74 66 7,9 64 23/07/2002 63 3 59,6 100 29/07/2002 63 63 0,0 100 30/07/2002 55 55 0,0 100 31/07/2002 47 37 10,4 100
01/08/2002 69 65 3,8 89 04/08/2002 62 61 1,0 24 06/08/2002 84 77 6,8 17
03/09/2002 52 39 12,6 77 04/09/2002 64 62 2,4 93 05/09/2002 55 46 9,0 100 06/09/2002 60 46 13,7 100 10/09/2002 69 69 0,6 40 16/09/2002 71 65 6,3 97
22/10/2002 43 43 0,7 100 23/10/2002 58 57 1,1 52 24/10/2002 46 44 1,8 53 25/10/2002 45 45 0,1 52 28/10/2002 66 62 4,9 85 07/11/2002 90 82 7,8 47 11/11/2002 62 47 14,9 100 19/11/2002 33 22 11,2 35
Chemical analyses on silica sample demonstrate that the problems encountered in the management of the sludge line affected the SCP correct functioning. This is particularly true when the dewatering station is made of a belt press which doesn’t guarantee a high capture percentage of solids: in this case it would be necessary to adopt a safety device to avoid the incoming of solids (e.g. building a simple basin designed to capture foams and solids).
Design of a device for foam capture The design of the “foam trap” is given in fig.22. It will be located on the holding tank. The trap physically will stop foam and suspended solids. Periodical maintenance is necessary to preserve its functionality also during exceptional events of solids input.
Cecchi, Battistoni, Boccadoro, 2003, page 61
CONCLUSIONS On the basis of the remarks made on experimental results, it is clear that the experimentation carried out on Treviso SCP plant was generally affected by the excess of suspended solids in the supernatants from belt pressing. The high presence of suspended solids is strictly linked to the dewatering device utilised. Compared with the centrifuge machine, the belt press needs washing and this causes the loss of solids in the supernatants. Anyway satisfactory results have been obtained. 1) The methodology applied allowed to identify various types of problems linked to the
process:
o the sieve analysis showed a visible growth of sand particles, as a proof of the process good performances.
o the V’10 analysis confirmed the good choice of hydraulic operational conditions that were aimed to obtain the fluidised bed homogeneity, even though the results underlined the fact that the same fluidised bed had a smaller content of sand than the one fed to the reactor at the beginning of the experimentation. The problem of the sand loss from the FBR reactor was observed not only during the start-up phase, but also in the continuous runs. The sand loss from the FBR can cause problems in terms of: decrease of seed material for the crystallization process with negative implications on the nucleation efficiency; presence of sand in the pipes causing problems to the pumps with subsequent increase of the maintenance costs. Two possible hypotheses could explain the phenomenon: the first one providing that a large amount of silica was packed at the bottom of the FBR (but it is difficult to prove, in fact it is impossible to have a sample from the bottom during the plant functioning because of the gravel bed and if the sample is taken after stopping the feeding all the sand of the bed would be settled on the bottom), while the second one that the lack of silica was due to a continuous loss of fine sand fraction from the Dortmund device.
o From the examination of the specific weight of the exhausted material taken from the bed, a progressive decrease was observed during time. Considering the lower weight of the suspended solids (compared to other substances involved in the process like sand and P salts), it is presumable that the organic fraction adheres to sand particles replacing phosphorus crystals of MAP and HAP. This lightening of the fluidised bed affected the process performances because it led to a loss of particles out of the Dortmund device. That is why it was decided to re-design and replace the Dortmund device to improve settling; unfortunately this did not resolve the problem since the loss of particles continued. It is thought, in order to avoid the incoming of suspend solids in the FBR section, the installation of a “foam trap” to remove scum and suspended solids from the supernatant. It will be located in the holding tank. However, this will inevitably involve operating costs and difficulties (cleaning) and clearly the solution for a new plant is to avoid the loss of foams and solid from the dewatering device.
o The presence of organic substances on silica particles was also evident from the chemical analyses results and it seems reasonable to think of their role in hindering MAP and HAP nucleation on silica seeds. An organic content in the recovered P product will also pose problems of handling (water retention) stability , of hygiene, and lower P-content.

Cecchi, Battistoni, Boccadoro, 2003, page 62
2) The process performances on the whole were satisfactory as far as the crystallization efficiency is concerned, but they were characterised by a high value of precipitation efficiency which shows a high quantity of fine irrecoverable particles.
3) It is difficult to confirm the theoretical model with the results obtained by Treviso SCP
plant, and the explanation must be looked for in the sludge treatment line and is mostly ascribable to the significant loss of solids from the belt press.
4) The study has been also interesting from the agronomical point of view since it has been
observed that nucleated particles have not enough Nitrogen as required by Italian law (L 748/84) for P-N fertilizers. This condition can be reached only with 55% of nucleated material on the sand where all the phosphorus is coming from MAP. On the other hand it has been seen that it is easy to obtain the P percentage required by the law; logically the crystallized material will be analysed to check all the chemicals components (heavy metal and other contaminants) for agricultural use.
The aim, now, is to continue with the crystallisation process without any nucleating agent (i.e. silica), but exploiting the self-nucleation process. According to this process, the first step will be MAP crystallisation by self-nucleation and the second the particles themselves will act as seed material for the subsequent nucleation. Founding on the results of other research works reported in literature (first, among all, the ones coming from Japan), the plant hydraulics has been checked, in order to know whether working with the flows required for self-nucleation is possible: the results were positive, thus the experimentation is now to be started. This change in operational conditions is thought to bring a lot of benefits, such as:
o Elimination of sand which represents not only an expense but also a material that often leads to extraordinary maintenance because it can cause pipes and pumps clogging;
o Self-nucleated particles have a high percentage of MAP and absence of silica, thus they can be used as a good fertilizer.
Anyway the self-nucleation needs a solution to the problem of the incoming of suspended solids from the belt press, in order to reach this target: with this aim, a device for foams capture has been designed upstream of phosphate precipitation reactor.

Cecchi, Battistoni, Boccadoro, 2003, page 63
References
Battistoni P., De Angelis A., Prisciandaro, M., Boccadoro R., Bolzonella D. (2002). P removal from anaerobic supernatants by struvite crystallization: long term validation and process modelling. Wat. Res., 36(8), 1927-1938.
Battistoni P., Fava G., Pavan P., Mata-Alvarez J. (1996). Phosphate removal by crystallization. Anaerobic liquors treated in a fluidized bed reactor. In: Proc. of “Water Quality International 96”, Singapore, June 23-28.
Battistoni P., Fava G., Pavan P., Musacco A., Cecchi F. (1997). Phosphate removal in anaerobic liquors by struvite crystallization without addition of chemicals. Preliminary results. Wat. Res., 31, 2925-2929.
Battistoni P., Pavan P., Cecchi F., Mata-Alvarez J. (1998b) Effect of composition of anaerobic supernatants from an anaerobic, anoxic and oxic (A2O) process on struvite and hydroxyapatite formation. Ann. Chim., 88, 761-772.
Battistoni P., Pavan P., Prisciandaro, M., Cecchi F. (2000). Struvite crystallization: a feasible and reliable way to fix phosphorus in anaerobic supernatants. Wat. Res., 34, 3033-3041.
Battistoni P., Pavan P., Prisciandaro, M., Cecchi F. (2001). Phosphorus removal from a real anaerobic supernatant by struvite crystallization. Wat. Res., 35, 2167-2178
Battistoni P., Pavan P., Prisciandaro, M., Cecchi F. (2001b). Phosphorus removal from a real anaerobic supernatant by struvite crystallization. Wat. Res., 35, 2167-2178.
Battistoni. P, Pezzoli S., Bolzonella D.,.Pavan P.,(2001a). The AF-BNR-SCP process as a way to reduce global sludge production comparison with classical approaches on a full scale basis. In: Proc. of Spec. Conf. On Sludge Management: regulation, treatment, utilisation and disposal. October 25-27, 2001, Acapulco, Mexico.
Cecchi F., Battistoni P., Pavan P., Fava G., Mata-Alvarez J. (1994). Anaerobic digestion of OFMSW and BNR processes: a possible integration. Preliminary results. Wat. Sci. Tech., 30, 65-71.
De Rooij, J.F., Heughebaert, J.C., Nancollas, G.H. (1984). A pH study of calcium phosphate seeded precipitation. J. Coll. Int. Sci., 100, 350-358.
Eggers E., Dirkzwager A.H., Van der Honing H. (1991). Full-scale experiences with phosphate crystallization in a crystalactor. Wat. Sci. Tech., 23, 819-824.
Joko I. (1984). Phosphorus removal from wastewater by the crystallization method. Wat. Sci. Tech., 17, 121-132. Kaneko S., Nakajima K., (1988). Phosphorus removal by crystallization using a granular activated magnesia clinker.
J. Water Pollut. Control Fed., 60, 1239-1244. Liberti L., Limoni N., Lopez A., Passino R., Boari G. (1986). The 10 m3/hr RIM-NUT demonstration plant at West
Bari for removing and recovering N & P from wastewater. Wat. Res., 20, 735-739. Murakami T., Koike S., Taniguchi N., Esumi H. (1987): Influence of return flow phosphorus load on performance
of the biological phosphorus removal process. In: Biological phosphate removal from wastewaters. Ramadori R. Ed., Pergamon Press (Oxford), 237-247.
Nancollas, H.G. (1984): The nucleation and growth of phosphata minerals. In: Phosphate Minerals, Hriagn, J.O. and Moore,P.B. (Eds) Springer-Verlay
Pöpel H. J., Jardin N. (1993). Influence of enhanced biological phosphorus removal on sludge treatment, Wat. Sci. Tech, 28(1), 263-271.
Randal C.W., Barnard J.L., Stensel H.D. (1992): Water Quality Management library Vol. 5. Design and retrofit of wastewater treatment plants for biological nutrient removal. Technomics Ed. Lancaster USA
Salutsky M.L., Dunseth M.G., Ries K.M. Shapiro J.J. (1972), Ultimate disposal of phosphate from wastewater by recovery as fertilizer. Effl. Wat. Treat. J., October 509-5019.
Seckler, M.M., Bruinsma, O.S.L., Van Rosmalen, G.M., (1996a). Phosphate removal in a fluidised bed – I. Identification of physical processes. Wat. Res., 30, 1585-1588.
Seckler, M.M., Bruinsma, O.S.L., Van Rosmalen, G.M., (1996b). Calcium phosphate precipitation in a fluidised bed in relation to process conditions: a black box approach. Wat. Res., 30, 1677-1685.
Seckler, M.M., Leeuwen, M.L.J., Bruinsma, O.S.L., Van Rosmalen, G.M., (1996c). Phosphate removal in a fluidised bed – II. Process optimization. Wat. Res., 30, 1589-1596.
Stratful I., Brett S., Scrimshaw M.B., Lester J.N. (1999). Biological phosphorus removal, its role in phosphorus recycling. Env. Technol., 20, 681-695.
Tanaka T., Kawakami A., Yoneyama Y., Kobayashi S. (1987): Study of the reduction of returned phosphorus from a sludge treatment process. In: Biological phosphate removal from wastewaters. Ramadori R. Ed., Pergamon Press (Oxford), 201-211.

Cecchi, Battistoni, Boccadoro, 2003, page 64
Acknowledgements The authors want to thank:
• Marche Polytechnical University and University of Venice for the cooperation partners in the project
• Treviso City and the CEEP (European detergent phosphate industry joint research organisation, a Sector Group of CEFIC) for financial and material support for work