PHD Laursen-masonry Prestressed Walls
309
http://researchspace.auckland.ac.nz Re sear ch Sp ace @Au ck la n d Copyright Statement The digital copy of this thesis is protected by the Copyright Act 1994 (New Zealand). This thesis may be consulted by you, provided you comply with the provisions of the Act and the following conditions of use: • Any use you make of these documents or images must be for research or private study purposes only, and you may not make them available to any other person. • Authors control the copyright of their thesis. You will recognise the author's right to be identified as the author of this thesis, and due acknowledgement will be made to the author where appropriate. • You will obtain the author's permission before publishing any material from their thesis. To request permissions please use the Feedback form on our webpage. http://researchspace.auckland.ac.nz/feedback General copyright and disclaimer In addition to the above conditions, authors give their consent for the digital copy of their work to be used subject to the conditions specified on the Library Thesis Consent Form.
-
Upload
soveja-lucian -
Category
Documents
-
view
227 -
download
0
Transcript of PHD Laursen-masonry Prestressed Walls

7/21/2019 PHD Laursen-masonry Prestressed Walls
http://slidepdf.com/reader/full/phd-laursen-masonry-prestressed-walls 1/308
http://researchspace.auckland.ac.nz
Re se a r ch Sp ac e@Au ck la n d
Copyright Statement
The digital copy of this thesis is protected by the Copyright Act 1994 (New
Zealand).
This thesis may be consulted by you, provided you comply with theprovisions of the Act and the following conditions of use:
• Any use you make of these documents or images must be forresearch or private study purposes only, and you may not makethem available to any other person.
• Authors control the copyright of their thesis. You will recognise the
author's right to be identified as the author of this thesis, and dueacknowledgement will be made to the author where appropriate.
• You will obtain the author's permission before publishing anymaterial from their thesis.
To request permissions please use the Feedback form on our webpage.
http://researchspace.auckland.ac.nz/feedback
General copyright and disclaimer
In addition to the above conditions, authors give their consent for the
digital copy of their work to be used subject to the conditions specified onthe Library Thesis Consent Form.
7/21/2019 PHD Laursen-masonry Prestressed Walls
http://slidepdf.com/reader/full/phd-laursen-masonry-prestressed-walls 2/308
Seismic
Analysis
and
Design
of
Post tensioned
Concrete
Masonry
Walls
By
Peter T.
Laursen
A thesis
submitted in
partial
fulfilment of the
requirements
for
the
Degree
of
Doctor of Philosophy
Supervised
by Dr. Jason
M. Inghant
University of Auckland
Department
of Civil
and
Environmental
Engineering
New
Zealand
December
2002
7/21/2019 PHD Laursen-masonry Prestressed Walls
http://slidepdf.com/reader/full/phd-laursen-masonry-prestressed-walls 3/308
ABSTRACT
This
thesis
explores
the seismic
analysis
and
design
of
post-tensioning
concrete
masonry
(PCM)
walls.
Using
unbonded
post-tensioning,
walls
are
vertically
prestressed
by
means
of
strands or
bars
which
are
passed
through
venical
ducts
inside
the
walls.
As
the
walls
are
sub-
jected
to
lateral
displacements
(in-plane
loading),
gaps
form at
the horizontal
joints,
reducing
the system
stiffness.
As
long as
the
prestressing
strands are
kept
within the elastic
limit, or at
least
maintain
a
considerable
amount of
the
initial
prestressing force,
they
can
provide
a
restor-
ing
force, which
will
return the walls to
their
original
alignment
upon unloading.
The key fea-
ture
in this behaviour
is
attributable
to the
tendons being
unbonded
over the
entire
wall
heighg
allowing
for
distribution of
tendon
strain
over the
entire
length of
the
tendon.
An extensive
literature review
found that
post-tensioning
of
masonry
has
had
limited
applica-
tion in
seismic
areas
and
that there currently
are no specific
code
requirements
for it s
use
for
ductile seismic
design,
largely
as a
consequence
of
little
knowledge about
the
ductility
capacity
and energy
dissipation characteristics.
It
was concluded
that structural
testing
of
PCM
walls
and
concrete
masonry
creep
and shrinkage
testing
were essential
to
advance
the understanding
of
this construction
type.
Creep
and
shrinkage experiments
confirmed
that long term
preshess
losses
are
considerable
in
both
grouted
and
ungrouted
concrete masonry,
and
must
be
taken
into
account
in design.
It was
concluded
that
it is
essential
to
use
high
strength
steel for
prestressing
of PCM
in
order
to
reduce long term
losses.
Structural
testing confirmed that fully
grouted
unbonded
post-tensioned
concrete
masonry
is
a
competent
material combination
for ductile struchral
wall systems. In
particular,
PCM
walls
strengthened
in the
flexural
compression
zones
with confining
plates
are expected to
success-
fully
withstand
severe
ground
shaking
from
an
earthquake.
It
was
suggested
that
partially
and
ungrouted
PCM walls may suitably be
used
in strength
design
(non-ductile).
The
proposed
prediction
method
for wall
in-plane behaviour
was
validated by experimental
results.
Good
correlation between
predictions
and
results was
found.
Displacement spectra
were developed
for ductile seismic design
of
PCM
walls.
These can
be used
to accurately esti-
mate the displacement demand imposed on
multi-storey
PCM
cantilwer
walls.
-l-
7/21/2019 PHD Laursen-masonry Prestressed Walls
http://slidepdf.com/reader/full/phd-laursen-masonry-prestressed-walls 4/308
DISCLAIMER
This
thesis
was
prepared
for
the Department
of Civil
and Environmental Engineering
at the
University
of Auckland,
New
Zealand,
and
describes
analysis and design of
post-tensioned
concrete
masonry
walls.
The opinions
and conclusions
presented
herein
are those of
the
author
and do
not necessarily
reflect those
of
the University of
Auckland
or any
of the
sponsoring
par-
ties
to
this
project.
ACKNO\ryLEDGEMENTS
This
research
was funded
by direct
industry
sponsors W. Stevenson
and
Sons
Ltd., Firth
Indus-
tries Ltd.,
Ready
Mix
Concrete
Ltd.,
and
by
the
industry
organisations
New
Zealand.
Concrete
Masonry
Association
(NZCMA)
and
the Cement and Concrete
Association of New
Zealand
(CCANZ).
VSL
(Aust.)
Pfy.
Ltd., Construction
Techniques
Group Ltd.,
Fletcher
Steel
Ltd.,
Alan
H. Reid
Engineering
Ltd.
and
SIKA
(NZ)
Ltd.
generously
provided
their
products
free
of
charge.
Their contributions are
gratefully
acknowledged.
The
author
also wishes
to
acknowledge
the contributions by
Hank
Mooy,
Tony Daligan
and
Mark Byrarni
who
were
responsible
for
the
practical
aspects
in
relation
to
construction
and
testing
of the walls
in
the
Civil
Test
Hall.
Furthennore,
the
important contributions
made
by
final-year
undergraduate
students
in
designing
and
constructing the
Series
I testing
setup,
and
in
testing
of t wo walls
reported
herein
are
acknowledged.
Special
thanks are
given
to
those
who
found
time to comment
on
this thesis. This
includes
Assistant
Professor
R.C. Fenwick
and
Dr.
B.J. Davidson of the University
of
Auckland, E.
Lapish
of
Auckland,
and
particularly my primary
supervisor
and
friend
Dr.
J.M.
Ingham.
Finally,
a very special
thanks
to my
wife, Jill,
for her
lasting
love and support,
particularly
throughout
the
period
ofresearch
and
preparation
for this thesis.
-lt-
7/21/2019 PHD Laursen-masonry Prestressed Walls
http://slidepdf.com/reader/full/phd-laursen-masonry-prestressed-walls 5/308
ADVISORY
COMMITTEE
Dr. J.M. Ingham, SeniorLecturer
principal
advisor)
Dr. B.J.
Davidsoq
Senior
Lecturer
Assistant
Professor
R.
C.
Fenwick
Professor
B.
Melville
Mr. E. Lapish,
ConsultantEngineer
EXAMINATION
COMMITTEE
Assistant
Professor
C.E.
Ventura, Department
of
Civil
Engineering,
University of British
Columbia,
Canada
chair)
Dr. J.M.
Ingham,
Senior
Lecturer,
University
of
Auckland
Dr.
H.R.
Ganz,VSL
Switzerland)
Ltd.
Professor
M.J.N.
Priestley,
University
of California,
San
Diego,
USA
-iii-

7/21/2019 PHD Laursen-masonry Prestressed Walls
http://slidepdf.com/reader/full/phd-laursen-masonry-prestressed-walls 6/308
v
7/21/2019 PHD Laursen-masonry Prestressed Walls
http://slidepdf.com/reader/full/phd-laursen-masonry-prestressed-walls 7/308
LIST OF
PUBLICATIONS
Journal
articles:
Laursen,
P.T.
and
Ingham, J.M.
(2001),
Structural
Concrete
Masonry
Walls,
TMS
Journal,
Vol. 19,
No.
rado, Sept.2001.
Tbsting of
Single-Storey
Post-Tbnsioned
l, The
Masonry Society,
Boulder, Colo-
Ingham,
J.M.,
Laursen,
P.T.
and Voon,
K.C.
(2001),
Appropriate
Material Values
for
Use in
Concrete Masonry
Design,Joumal
of
the Strucnral
Engineering
Society,
Vol. 14,
No. 1, Auck-
land,
New Zealand,
April200l.
Laurseno
P.
and
Ingham,
J.
M.
(1999), Design
of
prestressed concrete masonry
walls,
Journal
of
the
Stnrctural
Engineering Society,
Vol. 12,
No. 2, Auckland,
New Zealand,
October
1999.
Conference
papers:
Laursen,
P.T.,
Davidson,
B.J.
and
Ingham,
J.M.
(2002),
Seismic analysis
of
prestressed
con-
crete masonry
shear
walls,Proceedings of
the
l2th European
Earthquake Conference,
London,
England, September
2002,
paper
reference247.
Laursen,
P.T.
and Ingham,
J.M.
(2001),
Research
on
multi-storey
post-tensioned
concrete
masonry
walls, Proceedings
of
the
NZCS
Combined
Concrete
Industry
Conference, Thupo,
New
Zealand, October
2001.
Laursen, P.T.
and
Ingham, J.M.
(2001),
Material
prcperties
for
New
Zealand
concrete
masonry,
Proceedings
of
the 6th
Australasian Masonry
Conference,
Adelaide,
Australia,
July
2001.
Laursen,
P.
and Ingham,
J. M.
(2001),
Seismic
Resistance
of
Prestressed
Concrete
Masonry
Shear Walls,Proceedings
of
the Structural
Engineering
Institute
Congtess
Exposition 2001,
American Society
of Civil
Engineers, Washington
DC,
May
2001.
Laursen,
P.
and
Ingham,
J.
M.
(2000),In-plane
Response
of
Post-tensioned
Concrete Masonry,
Proceedings
of
l2th lnternational Brick/Block
Masonry
Conference,
p.
905, Madrid, Spain,
October
2000.
(Alan
H. Yorkdale, FASTM
Memorial Award
winning
paper
2000)
7/21/2019 PHD Laursen-masonry Prestressed Walls
http://slidepdf.com/reader/full/phd-laursen-masonry-prestressed-walls 8/308
Laursen,
P.,
Ingham,
J. M. and
Voon,
K.C.
(2000),
Material
Testing
Supporting
a Study
of
Post-
tensioned Concrete Masonry,
Proceedings
of
12ft International
Brick/Block Masonry
Confer-
ence,
p.
937,Madid,
Spain,
October
2000.
Laursen,
P.
and Ingham,
J. M.
(2000),
Cunent Research
on Post-tensioned
Concrete
Masonry
Walls, Proceedings
of
the
New
Zealand Concrete Society Conference,
p.
56, Thupo,
New
Zea-
land October 2000.
Laursen,
P. and
Ingham,
J.
M.
(1999),
Ductile
response
of
post-tensioned
concrete
masonry
walls,
Froceedings
of
the
IPENZ
Technical Conference,
Auckland,
New
Zealand,
July 1999.
LaurEen, P.T.,
Seible,
F.
and Hegemeir,
G.A.
(1995),
Seismic
retrofit
and
repair of
masonry
walls with
carbon
overlays,
Non-Metallic
(FRP)
Reinforcement
for
Concrete
Structures.
Pro-
ceedings
of the
Second
international
RILEM Symposium
(FRPRCS-2),
pp.
616-623.,
Gent,
Belgium, July
1995,
Technical
reports:
Laursen,
P.T.
and
Ingham
J.M.
(2000),
Cyclic In-plane Structural Tbsting
of Prestressed
Con-
crete
Masonry Walls,
Phase
I:
Simple Wall
Confgurations,
School of
Engineering Research
Report
#599,
Dept.
of Civil
and
Resource
Engn.,
University
of Auckland, New
Zealand,
Sep-
tember 2000.
Laursen,
P.T.
and
Ingham J.M.
(1999),
Mateial
Tbsting
of
Dricon
Superset Mortar, Auckland
Uniservices
Research
Report 7796.00,
University of Auckland, New
Zealand,
July
2000.
Laursen,
P.T.
(1999)
Progress Report
and
Feasibility
Study
into
Prestressed Concrete
Masonry
in
New
Zealand,
Report
prepared
for
the
New
Zealand Concrete
Masonry Association,
Auck-
land,
April
1999.
Laursen,
P.T.,
Seible, F. and
Hegemeir, G.A.
(1995)
Seismic
repair
and
retrofit
of
masonry
walls
with carbon overlays,
Structural
Systems
Research
Project, Report No.
SSRP-95101,
University
of
California, San Diego, USA,
June
1995.
-vl-
7/21/2019 PHD Laursen-masonry Prestressed Walls
http://slidepdf.com/reader/full/phd-laursen-masonry-prestressed-walls 9/308
TABLE
OF
CONTENTS
ABSTRACT
.............
............i
DISCLAIMER
...........
..........ii
ACKNOWLEDGEMENTS
........
..........ii
ADVISORY
COMMITTEE
...........
.....
iii
EXAMINATION
COMMTTTEE
...........
...............
iii
LIST
OF PUBLICATIONS
...................v
TABLE
OF
CONTENTS
........
............vii
LIST
OF FIGURES
.........
xiii
LIST
OF
TABLES
..........xvii
NOTATION
.....................xix
INTRODUCTION
I.
PRINCIPLE
OF UNBONDED
POS}TENSIONED
WALLS
........1
1.I
MOTIVATION
FOR
PCM
RESEARCH
...........
............2
t.2
scopE
AND
ORGANISATION
OF THESrS...............
.................3
LITERATURE
REVIEW
2.
OVERVIEW
.............7
2.1
CODIFICAf ION
OF PRESTRESSED
MASONRY
..........8
2.2
CURRENT
STATE
OF R8S8ARCH............
................9
2.2.1
Materials
.....10
2.2.1.1
Concrete
masonry....
...................10
2.2.1.2
Prestressing
steel
......10
2.2.2
Structural
behaviour.
.....10
2.2.2.1
Out-of-plane
response
................10
2.2.2.2
In-plane
response
......11
2.2.2.3
Joints
.......14
2.2.2.4
Prestress
loss...........
...................14
2.3
CONCLUSrONS........
..............14
2.4
REFERENCES..........
...............16
MATERIAL
PROPERTIES
3.
3.1
3.2
OVERVIEW.............
................
19
STRESS-STRAIN
CHARACTERISTICS
...................20
CRUSHTNG
STRENGTH............
..............21
3.2.1
Grade
dependent
strength
...............22
3.2.2
Characteristic
strength
....................23
3.2.3
Experimental
data
........24
3.2.4
Australian
approach
......27
3.2.5
USA
approach............
.....................2g
ELASTIC
MODULUS. .............
................28
3.3.1
Current
New
Zealand
codification............
........2g
3.3.2
Literature
and
other
codes........
.......2g
3.3.3
Experimental
data
.........29
MASONRY
STRAIN
CAPACTTY
..... ........
...............30
3.3
3.4
-vii-
7/21/2019 PHD Laursen-masonry Prestressed Walls
http://slidepdf.com/reader/full/phd-laursen-masonry-prestressed-walls 10/308
3.5
3.6
3.8
3.9
J.t
3.4.I Code
rules
and
recommendations..
...................30
3.4.2
PCM testing
results
......
3l
FLEXURAL
STRESS DISTRIBUTION........... .........32
THEORETICAL
STRESS-STRAIN
RELATIONSHIP.........
.......
33
3.6.1
Unconfined
concrete
masonry....
....34
3.6.1.1
Failure
mode
............34
3.6.1.2
Theoretical stress-sfain
curve
.....................35
3.6.2
Confined
concrete masonry.... ........
36
3.6.2.1
Failure
mode
............37
3.6.2.2 Theoretical stress-strain
curve
.....................37
3.6.3 Evaluationofstress-strainrelationship..........
....................38
3.6.3.1 U200 Unconfined
prisms.......
.....................40
3.6.3.2
CP200 Confined
prisms.......
.....41
3.6.3.3
CPl00 Confined
prisms.......
.....43
3.6.4
Effect
of
strain
rate...........
...........-..44
3.6.5
Tensile
strength.....
........45
3.6.6
Unloading
properries
....45
PRESTRESSING STEEL .....
....................45
3.7.1
Types of
high
strength
prestressing
steel....... .....................
46
3.7
.2
Material
properties
.......46
CONCLUSIONS .....................47
REFERENCES..........
..............
49
TIME DEPENDENT EFFECTS
4.
ASSESSMENT OF PRESTRESSING
LOSSES...
......5I
4.1
THEORETICAL
CONSIDERATIONS.
....52
4.1.1
Creep
and
shrinkage of
concrete............
........-.52
4-I.2
Creep
and
shrinkage of concrete
masonry .....-.
55
4.1.3 Mathematical expressions........-.
....
56
4.1.3.1
Creep stain.........
.....57
4.1.3.2
Shrinkage
strain
.......58
4.1.3.3 Relaxation of
prestressing
steel ...................58
4.1.3.4
Total
Prestress
Loss ...................59
4.2
CREEP
AND
SHRINKAGE
EXPERIMENT.........
....60
4.2.I Design of
the
experiments................ ................ 60
4.2.2 Test setup
and
instrumentation .......62
4.2.3
Series
I
experimental
results
..........
65
4.2-4
Series
2
experimental results..
........67
4.2.5
Discussion
of
experiments........... .....................
7l
4.3 EXPERIMENTAL
VS. CODE VALUES ....................74
4.3.1 Other experimental
work....
............74
4.3.2
Code
values
for creep
and
shrinkage..............
....................
75
4.3.3
Comparison
...............
.....................76
4.4
RECOMMENDATIONS
FOR CREEP
AND
SHRINKAGE
..............
...........
76
4.4.1
Creep
..........76
4.4.2
Shrinkage.
.....................77
4.4.3
Comments .....................77
4.5
TYPICAL
PRESTRESS
LOSS
......... .......77
-
vlll
-
7/21/2019 PHD Laursen-masonry Prestressed Walls
http://slidepdf.com/reader/full/phd-laursen-masonry-prestressed-walls 11/308
5.
5.1
5.2
4.5.1
Typical
losses
- additive
approach
.... 78
4.5.2
Incremental
approach
......'. 80
4.6
REFERENCES..........
..............'85
STRUCTURAL
TESTING.
SERIES
I
STNGLE-STOREY
PCM WALLS............
...................87
TNTRODUCTION.....
..............'
87
CONSTRUCTION
DETAILS
....................88
5.2.1
Wall
specifications
...'....88
5.2.2
Wall
construction
.. '. 89
5.2.3
Material
properties.
... 89
TESTING
DETAILS
.............. 89
5.3.1
Test setup
'-.--...'............'89
5.3.2
Testing
procedure.
'. '90
5.3.3
Predicted
nominal flexural
strength
.....-.'..'...'-..90
5.3.4
Predicted
masonry
shear strength............
.'...'. 91
TEST
RESULTS
.----.--.-..----....--92
5.4.1
Fully
grouted walls
-'-'. 92
5.4.1.1
Force-displacement
response
.--..92
5.4.1.2
Damage
pattern
and
failure
mode
.......-..-.....94
5.4.1.3
Sliding '.......'........-....95
5.4.1.4
Prestressing
force.........
........-.....95
5.4.2
Partially
and
ungrouted
walls....
--..--96
5.4.2.1
Force-displacement
response
'97
5.4.2.2
Damage pattern
and
failure
mode
...-----.......'97
5.4.2.3
Sliding
........-.............98
5.4.2.4
Prestressing
force
--..'98
5.4-3
Vertical
masonry
strain
'...'...........--.98
DrscussloN
...........
...............99
5.5.1
Fully
grouted
walls
....'..99
5.5.1.1
Flexural
strength.....
........'..-. '99
5.5.1.2
Ultimate
drift
capacity.............
........--.........100
5.5.1.3
Tendon
yielding....
.....-'......-'....'
101
5.5.1.4
Vertical
masonry
strain........
-....102
5.5.1.5
Masonry
shear
strength............
................-.103
5.5.1.6
Sliding
propensity
..-.....--..........
104
5.5.1.7
Axial
load
ratio..
'....104
5.5.2
Partially
and
ungrouted
walls...
...105
5.5.2.1
Masonry
shear
strength............
..................
105
5.5.2-2
Flexural
strength.....
...-..-..-........106
5.5.2.3
Vertical strain
.........106
5.5.2.4
Axial
load ratio..
....-
106
CONCLUSIONS
AND
FUTURE
RESEARCH..............
............107
5.6.1
Fully
grouted
walls
. ..107
5.6.2
Partially
and
ungrouted
walls...
-....108
REFERENCES..........
.............109
s.3
5.4
5.5
5.6
5.7
-lx-
7/21/2019 PHD Laursen-masonry Prestressed Walls
http://slidepdf.com/reader/full/phd-laursen-masonry-prestressed-walls 12/308
STRUCTURAL
TESTING
-
SERIES
2
ENHANCED
SINGLE-STOREY
PCM
WALLS.............
........... 1I1
TNTRODUCTION
............ ....
I 11
CONSTRUCTION
DETAILS
.................
I12
6.2.1
Wall
specifications......
..................
112
6.2.2
Wall construction.........
................. I
16
6.2.3
Material
properties
..... I
16
TESTING
DETAILS
.............
I 17
6.3.1 Test
setup.
...................
117
6.3.2
Testingprocedure
.......
119
6.3.3
Predicted nominal
flexural
strength
............:....................
119
6.3.4
Predicted
masonry
shear strength....
...............
120
TEST
RESULTS.
...................
120
6.4.1
Force-displacement
response
.......I2I
6.4.2
Damage
pattern
and
failure
mode
..................123
6.4.3 Sliding
......125
6-4.4
Prestressing
force
.......126
6.4.5
Vertical
masonry
strain........
.........
128
DISCUSSION............
............
135
6.5.1
Flexural
response...
.....
135
6.5.2
Tendon
yielding....
......137
6.5.3
Vertical masonry strain........
.........137
6.5.4
Hysteretic
energy dissipation
.......
138
6.5.5
Sliding
propensity
.......
139
6.5.6
Initial
stiffness
............
139
6.5.7
Comparison
with
Series
I wall
tests.......... .....
140
CONCLUSTONS
...................
r42
REFERENCES
..........
............144
6.
6.1
6.2
6.6
6.7
7.
7.1
7.2
6.3
6.4
6.s
7.3
7.4
STRUCTURAL
TESTING.
SERIES
3
3-STOREY
PCM WALLS.............
..........
l4s
INTRODUCTION
.................
145
CONSTRUCTION
DETAILS
.................
146
7.2.1
Wall specifications......
..................
146
7.2.2
Wall
construction.........
.................
149
7.2.3
Material
properties .....
l5l
TESTING
DETAILS
.............152
7.3.1
Testsetup
..152
7.3.2
Instrumentation.........
..
153
7.3.3
Testing
procedure
.......
154
7.3.4
Flexural strength
prediction. .........
156
7.3.5
Predicted masonry
shear
stength............
.......157
TEST
RESUTJTS
..
158
7.4-l
Force-displacement
response
.......
159
7.4.2
Damage
pattern
and
failure
mode ..................162
7.4.3
Sliding
......162
7.4.4
Prestressing
force ........
.................162
-x-
7/21/2019 PHD Laursen-masonry Prestressed Walls
http://slidepdf.com/reader/full/phd-laursen-masonry-prestressed-walls 13/308
7.5
7.6
7.4.5
External
axial
force
.....167
7.4.6
Vertical
masonry
strain
--...-.......'...167
7.4.7
Lateral
wall displacement
profi1e.......
..--.....--..174
DISCUSSION
'
'174
7.5.1
Flexural
response
-.-..-..174
7.5.2
Tendon
behaviour.
.......178
7.5.3
Vertical
masonry
strain
....'............178
7.5.4
Hysteretic
energy
dissipation
......-.179
7.5.5 Sliding
propensity
-......181
7.5.6
Initial
stiffness....
.........
181
COMPARISON
WITH
RCM
WALL
TESTING
.......182
7.6.1
Priestley
and
Elderwa11s.........
.....' 182
7.6.2
Strategy
for
comparison
of results...........-.
.....183
7.6.3
Comparison
of
results
........-..-.......186
7.6.4
Conclusions
from comparison
of
PCM
with
RCM
testing.................188
CONCLUSIONS........
............
188
REFERENCES..........
.............190
7.7
7.8
8.
8.1
ANALYSIS
AND
DESIGN
PREDICTION
OF WALL
IN-PLANE
BEHAVIOUR............
.....191
FLEXURAL
RESPONSE
OF CANTILEVER
WALLS................................192
8.1.1
Limit
states
192
8.1.2
First
cracking.............
.-.................194
8.1.3
Maximum
serviceability
moment................
.'. 195
8.1.4
Nominal flexural
strength
.......-..--- 198
8.1.5
Yield strength....
.-----..-.202
8.1.6
Flexural
overstrength
.---.-.-............2M
8.1.7
Ultimate
displacement
capacity
----205
8.1.8
Calculation
example....
..--.-.---.-..-.-.209
DESIGN CONSIDERATIONS
................2I1
8.2.1
Required
prestressing force
and
area....
----------2ll
8.2.2
Un-cracked
section
analysis.....
---..213
8.2.3
Cracked
section
analysis
..-.-.'........213
8.2.4
Ultimate
limit
state..
.-.-214
8.2.4.1
Strength
design.......
..'-.--.........-.214
8.2.4.2
Capacity
design
--...-214
8.2.4.3
Displacement
capacity
.............215
8.2.5
Base sliding
..--.........-..-215
VERIFICATION
OF
PREDICTION
METHOD
.......2I8
REFERENCES..........
.............219
8.2
8.3
8.4
DYNAMIC
ANALYSIS
9.
TNTRODUCTION.....
.............22r
9.I
MULTI-DEGREE
OF
FREEDOM
STRUCTURE....
..................221
9.1.1
Prototype
structures
.-..22I
9.1.2
Finite
element
modelling
..-...........223
9.1.3
Push-over
analysis....
.--224
-xi-
7/21/2019 PHD Laursen-masonry Prestressed Walls
http://slidepdf.com/reader/full/phd-laursen-masonry-prestressed-walls 14/308
9.2
9.3
9.4
EQUIVATENT
STNGLE-DEGREE OF
FREEDOM
STRUCTURE
........... 226
9.2.1
Transformation
............ .................226
9.2.2
Definition
of
SDOF
structure
.......227
DYNAMIC ANALYSIS
..............
...........229
9.3.1
Earthquake
records
.....231
9.3.2 Time-History
response:
MDOF
vs.
SDOF
.....233
9.3.2.1
Displacement response
............235
9.3.2.2
Drift
demand...............
.............237
9.3.2.3 Base
moment response............... ...............
238
9.3.2.4
Base shear response
.................238
SPECTRAL
ANALYSIS...............
..........240
9.4.I
Elastic response
..........241
9.4.2
Ductile
response
.........241
9.4.3 Spectral
displacement..............
.....241
9.4.4
Displacement
ductility
demand....
..................245
USE OF
DISPLACEMENT
SPECTRA
. 246
NOTES ................247
CONCLUSIONS ...................247
REFERENCES.......... ............248
9.5
9.6
9.7
9.8
SUMMARY
OF CONCLUSIONS
IO. CONCLUSIONS
AND FUTURE
RESEARCH..............
...........249
l0.l
MATERTAL
PROPERTTES
- CHAPTER 3................
................ 2s0
IO.2
TIME DEPENDENT
EFFECTS
- CHAPTER
4
.......250
10.3
STRUCTURAL
TESTING - CHAPTERS
5
6 AND
7
...............................251
IO.4
ANALYSIS AND
DESIGN -
CHAPTER
8............
..253
10.5 DYNAMIC
ANALYSIS
-
CHAPTER
9:..........
........253
10.6
FUTURE
RES8ARCH..............
..............254
APPENDIX
A
A.
DEFORMATION AT NOMINAL
FLEXURAL
STRENGTH.....................257
APPENDIX
B
B.
FORCE-DISPLACEMENTPREDICTION-CALCULATIONEXAMPLE265
APPENDIX C
C.
COMPARISON
OF
PREDICTED VS.
EXPERIMENTAL BEHAVIOUR..
269
C.1
FLEXURE/ROCKING
PREDICTION METHOD...........
..........269
C.
L
I Assumptions.............. ...................269
C.1.2
Comparison ............... ...................269
C.I.2.l
Series
I walls .........270
C.1.2.2
Series 2
walls
.........276
C.1.2.3 Series 3
walls .........276
C.1.3 Conclusion
..................280
-xll-
7/21/2019 PHD Laursen-masonry Prestressed Walls
http://slidepdf.com/reader/full/phd-laursen-masonry-prestressed-walls 15/308
LIST
OF
FIGURES
Fig.
1.1-Post-tensioned
concrete
masonry
waII..........
..................2
Fig.2.t-schematic
of PRESSS wall
test
12-17)
.......13
Fig.
3.l-Typical
stress-strain
relationship
for
grouted
concrete
masonry.......................20
Fig.
3.2-Typical
PCM cantilever
wall
force-displacement
characteristics......................2l
Fig.
3.3-statistical
compressive strength
distribution,
20 series
concrete
masonry........24
Fig.
3.4-Prism
and
confining
plate
dimensions
and specification.............. ...................26
Fig.
3.5-Flexural
stress
b1ock........
..........32
Fig. 3.6-Priestley-Elder
compression
stress-strain
curves
t3-21.........
..........34
Fig. 3.7-Theoretical
stress-strain
relationships,
definition
of
symbols...........................36
Fig.
3.8-Typical
failure
modes for
prisms.
................39
Fig.
3.9-U200,
Unconfined masonry
stess-strain
curve
..-.........40
Fig.
3.1O-Variation
of
masonry strain e.o
with
masonry
strength
............-...42
Fig.
3.1l-CP200,
Confined masonry
stress-strain
curye
............42
Fig.
3.12-CPl00,
Confined
masoffy stress-strain
curve
.........-..44
Fig. 3.13-Prestressing
steel stress-strain
relationship
...............
....-..-............47
Fig.
4.I-Change
of strain
in
axially
loaded
and drying
concrete
masonry.....................53
Fig. 4.2-Wallette dimensions
and test setup.........
.....61
Fig. 4.3-Wallette
test setup and
instrumentation.........
................64
Fig.
4.4-series
1,
creep
+
shrinkage
strain......
..........65
Fig.4.5-series
1, creep strain
..-...........-..66
Fig.
4.G-Series
1,
ambient
air
temperature
variation.............
......67
Fig.4.7-series
2, creep
+
shrinkage
strain......
..........69
Fig.
4.8-series
2,
creep
strain
......-.-..-.....70
Fig.
4.9-series
2, ambient air temperature
and
humidity
variations.
............71
Fig.
4.1O-Experimental
Creep coefficient
Cr.............
.............-...73
Fig.4.1l-Experimental
Specific Creep
lq. ............
.....................74
Fig.4.l2-Expected
prestress
loss
in
fully
grouted
concrete
masonry
..........79
Fig. 4.13-Expected
prestress
loss
in ungrouted
concrete
masoffy
....-.........-79
Fig.
4.14-Time
variation Fn(t)
for creep, shrinkage
and re1axation................................81
Fig. 4.1S--Comparison of
prestress
loss, incremental vs.
additive
approaches................83
Fig.
5.I-Test
setup and
instrumentation....
................90
Fig.
5.2-Fully
grouted
walls;
Force-displacement
histories....
......................93
Fig. 5.3-Fully
grouted
walls;
Extent of
wall
damage
at failure
....................94
Fig. 5.4-Fully
grouted
walls;
Tendon force histories
(all
tendons)...
............96
Fig.5.5-Partiallyandungroutedwalls;Force-displacementhistories....
......97
Fig.
5.6-Partially
and
ungrouted walls; Extent
of damage
at
failure ............98
Fig. 5.7-Fully
grouted
walls; F-D envelopes
...........
...................99
Fig.
5.8-Fully
grouted
walls; F-D envelopes,
normalised
with Vr................................100
Fig.
5.9-PG
and
UG
Walls, F-D
envelopes,
nonnalised
with
Vr.
............
...106
Fig. 6.1-Wall
geometry
for
CP
walls
(number
I
-
4).............
...113
Fig. 6.2-Wall
geometry
for HB
wall
(number
5).........
.............114
Fig. 6.3-Wall CP-CA-ED
energy dissipation
bars..........
..........115
xllr
-
7/21/2019 PHD Laursen-masonry Prestressed Walls
http://slidepdf.com/reader/full/phd-laursen-masonry-prestressed-walls 16/308
Fig.
6.4-Typical
instrumentation
..........
118
Fig.
6.5-Force-displacement
histories
....................122
Fig. 6.6-Damage
accumulation
at
failure...............
..................124
Fig.
6.7-Relative
sliding between wall
and
base..........
............125
Fig.
6.8-Prestressing
force
histories...........
............127
Fig.
6.9-FG:L3.0-W15-Pl-CR
Horizontal strain
profiles,
pull
direction on1y.............129
Fig.
6.IG-FG:L3.0-WI5-P2-CP,
Horizontal strainprofiles
......
130
Fig.
6.11-FG:L3.0-W15-P2-CP-CA,
Horizontal
stain
profiles.....
............
l3l
Fig.
6.12-FG:L3.0-W15-P2-CP-CA-ED,
Horizontal
strain
profiles.....
.....132
Fig.
6.13-FG:L3.0-Wl5-P2-HB,
Horizontal
strain
profiles.....
..................
133
Fig.
6.14-F-D
envelopes,
P2-CP,
P2-CP-CA
and
P2-HB
.........
135
Fig.
6.15-F-D envelopes,
P2-CP-CA
and P2-CP-CA-ED..........
................ 136
Fig. 6.lHumulated
hysteretic
energy
dissipation
..................
138
Fig.
6.17-Initial
wall
stiffness....
...........
140
Fig.
6.18-F-D envelopes,
P2-CB P2-HB, P2C
and
P2E...........
..................
141
Fig.
7.l-Wall
geomebry
for Series 3
walls......
........147
Fig.7.Z-Dimensions
and
location of confining
plates...
...........
148
Fig.
7.3-{a)
Prestressing
ducting
and shear
reinforcing
and
b)
confining
plate..........
150
Fig.
7.4-Reinforcing
layout
for RC elements...
......
l5l
Fig.
7.5-Testing setup
......... 153
Fig. 7.6-External axial load
system......
..................
154
Fig.7.7-Photograph
of 53-l
in
the testing
setup
ready to
be
tested ...........
155
Fig.
7.8-Instnrmentation,
a)
in-plane
lateral
displacement and
b)
load
ce11s.............
156
Fig.
7.8-Instrumentation
Cont.),
c)
vertical deformation and
d)
sliding displ. ........157
Fig.
7.9-Force-displacement
histories
....................
160
Fig.
7.10-{yclic
loading histories............... ...........
16l
Fig.
7.1l-{a) and
b),
53-l
Damage accumulation at failure....... ...............
163
Fig.
7.11{c) and
d),
S3-2
Damage accumulation
at
failure...
...................
164
Fig.1.l2-Slidingdisplacement..............
.................
165
Fig.
7.l3-Prestressing
force histories
...
166
Fig.
7.l4-Extemal
axial
load histories
...................
168
Fig.
7.15-53-1,
Horizontal strain
profiles,
levels 0-200 mm
and 200400
mm............
169
Fig. 7.15{Cont.)
S3-1, Horiz. strain
profiles,
levels 400-600
mm
and
600-800 mm..
170
Fig.
7.1G-S3-2,
Horizontal strain
profiles,
levels 0-200 mm
and 200-400 mm............
l7l
Fig. 7.lflCont.) S3-2,
Horiz.
strain
profiles,
levels 400-600 mm
and
500-800
mm..I72
Fig.7.l7-S3-1,
Lateral displacement
profi1e................
............
175
Fig.
7.18-33-2,
Lateral
displacement
profi1e................
............
176
Fig.
7.19-Force-displacement
envelopes ................177
Fig.7.2}-lumulated
hysteretic energy
dissipation
..................
180
Fig.7.2l-lnitial
wall
stiffness....
...........
181
Fig.7.22-Priestley/Elder
wall
specification,
from
[7-5]..........
................... 183
Fig.7.23-PEl
experimental result
and
PCM-l
prediction
envelope...
.......
185
Fig.7.24-pE2
experimental result
and
PCM-1
prediction
envelope...
.......
185
Fig.7
.25-PE3
experimental
result
and
PCM-2
prediction
envelope...
.......
186
-xlv-
7/21/2019 PHD Laursen-masonry Prestressed Walls
http://slidepdf.com/reader/full/phd-laursen-masonry-prestressed-walls 17/308
Fig.
8.I-Definition
of cantilever
wall
dimensions,
forces
and
deformations........
........194
Fig.
8.2-First
crackin9............... ............195
Fig.
8.3-Maximum
serviceability moment ................ ...............196
Fig.
8.4-Curvature
distribution
at
maximum serviceability moment..........................,197
Fig.
8.5-Wall
equilibrium
at
nominal
flexural
strength
............199
Fig.
8.6-Wall
deformation
at
nominal
flexural
strength..... .......200
Fig. 8.7-Wall
rocking response
.............203
Fig.
8.8-Vertical
sffain evaluation
at
ultimate displacement capacity .........206
Fig.
8.9-Post-tensioned
concrete
masonry cantilever
wall
..........
...............210
Fig.
8.lG-Predicted
in-plane
wall
response..............
.................211
Fig.
8.ll-Cracked
section
analysis
.......213
Fig.
9.I-S-Storey
PCM
wall
prototype
and
modelling............ ...................222
Fig. 9.2-Masonry constitutive relationships..............
................224
Fig.
9.3-Cyclic
push-over
response..............
...........225
Fig.
9.4-Force-displacement
relationships.............
...................225
Fig.
9.5-5-storey wall, Analytical
prediction
model
based
on Chapter 8.....................229
Fig.
9.6-Bi-linear
elastic model
............229
Fig.
9.7-Uniform
Earthquake
Hazard
Spectra
........230
Fig.
9.8-Normalised
earthquake records
Nl:N4......
.................232
Fig.
9.9-Spectral
response
of
Nl'N4,3 and5Yo damping...
....................233
Fig.
9.lG-5-storey,
Displacement
response MDOF
vs.
SDOF,
Nl:N4
.......234
Fig.
9.1l-8-Storey,
Displacement
response
MDOF
vs.
SDOF,
Nl:N4.........................236
Fig.9.12-5-storey
wall,
storey
shear.........
..............239
Fig. 9.13-8-storey wall,
storey shear.........
..............239
Fig.
9.l4-Displacement spectra,
cr:
0.01
...............242
Fig.
9.l5-Displacement
spectra,
a:
0.02....
...........243
Fig. 9.lfDesign displacement
Spectra,
cr:
0.01
...2M
Fig. 9.l7-Displacement
ductility
demand
Fa.............
...............245
Fig.
A.l-Definition
of cantilever
wall
dimensions, forces
and
deformations...............257
Fig.
A.2-Flexure
/
rocking
cracking
patterns
..........258
Fig.
A.3-Wall
deformation
at
nominal
flexwal strength....
.......259
Fig.
A.4-Moment-curvature
relationships.....
..........260
Fig.
A.5-Wall
deformation at
Mn
for
unconfined
concrete masonry ..........262
Fig-
A.G-Wall
deformation
at
Mn
for
confined concrete masoffy
..............263
Fig.
C.l-Series I
FG-L3.0-W20-P3:
Prediction vs.
experimental behaviour...............271
Fig.
C.2-Series I
FG-L3.0-Wl5-P3:
Prediction vs. experimental behaviour...............272
Fig.
C.3-Series I
FG-L3.0-W15-P2C:
Prediction
vs.
experimental behaviour............273
Fig. C.4-Series I
FG-L3.0-Wl5-P2E:
Prediction vs.
experimental behaviour.............274
Fig.
C.5-Series 1 FG-L1.8-Wl5-P2:
Prediction
vs. experimental behaviour...............275
Fig.
C.6-Series
2
FG-L3.0-Wl5-P2-CP:
Prediction
vs.
experimental behaviour. ........277
Fig.
C.7-Series
2
FG-L3.0-Wl5-P2-CP-CA:
Prediction vs. experimental
behav.........278
Fig.
C.8-Series
2
FG-L3.0-Wl5-P2-FIB:
Prediction vs.
experimental behaviotn........279
Fig.
C.9-Series
3
53-l:
Prediction vs.
experimental
behaviour...........
...,...281
Fig.
C.1G-Series 3
S3-2:
Prediction
vs.
experimental behaviour...........
.....282
xv-

7/21/2019 PHD Laursen-masonry Prestressed Walls
http://slidepdf.com/reader/full/phd-laursen-masonry-prestressed-walls 18/308
xv
7/21/2019 PHD Laursen-masonry Prestressed Walls
http://slidepdf.com/reader/full/phd-laursen-masonry-prestressed-walls 19/308
LIST
OF TABLES
TABLE
3.1-NZS
4230:1990 Masonry
grades
..........22
TABLE
3.2-Measured crushing strength
..................25
TABLE
3.3-{onfined
prism
testing
TABLE 3.4-Ultimate compression
strain
....................................31
TABLE 3.S-Vertical
masonry strain,
test
results
.......31
TABLE 3.6-Material
properties
of
prestressing
stee1.........
........47
TABLE
4.l-Relaxation
of
prestressing
steel
(20 C)................
.....................58
TABLE
4.2-Specifications
for series
I
...............
......62
TABLE
4.3-Specifications
for
series
2 ...............
......63
TABLE
4.4-1reep
and
shrinkage testing,
schedule of events... ....................63
TABLE
4.5-Series
l,
summary of results
.................68
TABLE
4.6-Series
2, summary
of
results
.................70
TABLE
4.7-Experimental
maximum values
of
C ,
k,
e.r,.
.........74
TABLE
4.8-Experimental
values of k , normal
weight
concrete
masomy.....................75
TABLE
4.9-Experimental
values
of
lq, light
weight concrete masonry.........................75
TABLE
4.l0-{ode
defined
creep
and
shrinkage
coefficients............
...........75
TABLE
4.1l-Recommended
values
of C.,
h,
E
r,.
......................77
TABLE
S.I-Wall specifications.............
.......,...........88
TABLE S.2-Predictions and
results
........91
TABLE
5.3-Measured
masonry vertical strain
.........99
TABLE
5.4-Masonry
shear
strength
.....103
TABLE
6.1-Wall specifications
..,.........112
TABLE
6.2-Material
properties
............
..................116
TABLE
6.3-Predictions and results
......120
TABLE
6.4-Measured
masonry vertical
strain .......I34
TABLE
7.I-Wall
specifications
.............
.................146
TABLE
7.2-Material
properties
............
.......-..........152
TABLE
7.3-Strength
predictions
..........
..................158
TABLE
7.4-Predictions
and
results
......158
TABLE
7.S-Vertical
stain
....................173
TABLE
T.FTheoretical
and
experimental
results for PE
and
33
wa11s........................184
TABLE
7.7-Theoretical
performance
of
PCM walls for comparison
.........184
TABLE
8.I-Basic
plastic
deformation
zone
parameters
...........207
TABLE
8.2-Predicted
force
and
displacement
.......210
TABLE
9.1-Equivalent
SDOF
properties,
m
at each
floor
and
roof.............................228
TABLE
9.2-Equivalent
SDOF
properties,
m
at
each floor,m/2
at
roof........................228
TABLE
9.3-Analysis
results
for
S-storey
wall
models, maximum values....................235
TABLE
9.4-Analysis
results for
8-storey
wall
models,
maximum values....................235
-
xvll
-

7/21/2019 PHD Laursen-masonry Prestressed Walls
http://slidepdf.com/reader/full/phd-laursen-masonry-prestressed-walls 20/308
x
7/21/2019 PHD Laursen-masonry Prestressed Walls
http://slidepdf.com/reader/full/phd-laursen-masonry-prestressed-walls 21/308
NOTATION
Roman
characters:
a
equivalent rectangular
stress
block compression
zone
length
as
seismic
ground
acceleration
As
gross
area
of
wall
cross section
ao
flexural
compression zone
length
at
Mo
Ae confining
plate
area
for Priestley-Elder
stress-strain curve
Ao.
total
prestressing
steel
area
in
wall
cross
section
Aprj
prestressing
tendon
area
of tendon
J'
A,
wall
aspect
ratio
,\
shear
(horizontal)
reinforcing
steel area
)
flexural compression
zone
length
at M,
b* wall thickness
c distance from
exherne
masonry fibre in compression
to flexural neutral
axis
C
concrete masonry
creep coefficient
ce distance
from extreme
masoffy fibre
in compression to flexural neufral
axis
at M
d
effective wall length
for
calculation
of
V*
d
lateral
displacement
at h
D
displacement
level
4,
total lateral
displacement at h due
to
V ,
4,n
lateral
flexural displacement
at
I
due
to
V ,
d oh
lateral shear
displacement
at
h
due
to V .
d total lateral
displacement
at
h
due
to V
4n
lateral flexural
displacement
at h
due
to
V
4sr,
lateral
shear
displacement at
tq
due
to
Vu
dn* lateral
displacement
demand
at
the
equivalent SDOF structure height
dj
lateral
displacement
of
floor'j'
d,
total lateral
displacement
at tr.
due
to
Vg
4n
lateral flexural
displacement
at
tq
due
to
V1
4sr,
lateral
shear
displacement
at
h
due
to
V1
do lateral
displacement
increment
at flexural
overstrength
4
roof
lateral
displacement
demand
4,
target
displacement
demand
d,
lateral
displacement
increment
at first tendon
yield
q lateral
displacement
at fust tendon
yield
-xrx-
7/21/2019 PHD Laursen-masonry Prestressed Walls
http://slidepdf.com/reader/full/phd-laursen-masonry-prestressed-walls 22/308
d
ultimate
wall
displacement
capacity
{,no
measured
wall displacement
at
V*u*
EI
elastic
stiffness
of
wall cross section
E,o
masonry elastic modulus
En' average
masonry
elastic modulus
related
to
Priestley-Elder
stress-strain curve
Eo,
prestressing
steel
elastic
modulus
et
total
tendon force
eccentricity
with
respect
to
wall centre
line
et
shortest
horizontal
distance
between any
tendon and compression end
of
wall
ot
horizontal
distance
between
extreme
tendon
in
tension
and compression end
of wall
e1.;
horizontal
distance
between tendon
J'
and compression end of wall
f' b
concrete
masoffy unit
crushing strength
f' 8
grout
cylinder
crushing
strength,
specific
to
AS
3700
f',
grout
cylinder
crushing
shength
f'j mortar cylinder
crushing
strength
f'* masonry
crushing
strength
f'u
unconfined
masoffy
unit
crushing sfrength,
specific
to AS 3700
f.
axial
mason-ry
stress
Lr
final
prestress at
termination of
creep
and shrinkage experiment
f'oi
masonry stress
immediately
after
prestressing
Fn
generic
rymrbol
for'function
of'
Fn
time
development
function
for creep
Fn'h
time
development
function
for
shrinkage
fe,
instantaneous
prestressing
steel
stress
tr
prestressing
steel stress
immediately
after
anchorage
lock-off
fu
ultimate
(rupture)
strength
of
prestressing
steel
f'
yield
strength
of
prestressing
steel
{
average
tendon stress
at Vs
for
wall
in
unloaded state
q
nominal
yield
strength
of shear
reinforcing
steel
fy nominal
yield
strength
of
reinforcing
steel
&r
nominal
yield
strength
of
confining
steel
h*
equivalent
height
of
SDOF structure
h
horizontal
confined
dimension
h.,
location
of fust
cracking
height
for
applied moment
of
M
h.
wall equivalent
height
hn*
equivalent
height of
modal
mass
of
nth
mode
ho
vertical
extent
of
plastic
deformation
zone at
wall ultimate
displacement
7/21/2019 PHD Laursen-masonry Prestressed Walls
http://slidepdf.com/reader/full/phd-laursen-masonry-prestressed-walls 23/308
h,
vertical
distance between
floors
n
and n-l
h*
wall
height
k
defining
the
maximum
permissible
extreme
masonry
strain kf,n at Ir{
K
prism
strength and strain enhancement
factor for Priestley-Elder
stress-strain
cuwe
Kr
initial stiffiress of
bilinear
elastic
SDOF
K,
post-yield
stiftress
of bilinear elastic
SDOF
lq
concrete masonry
specific
creep
Kd
similar to
K but related to
high
strain rate
lq
prestressing
steel
relaxation
parameter
I
length of
tendon
J'
l*
wall
length
M
base
moment
M*
applied
factored moment
M'f equivalent mass
of SDOF structure
M*
first cracking
moment
N4
maximum serviceability moment
M*o
maximum
developed
base moment
from
time-history analysis
Mo
nominal
strength
of
wall
(moment)
N4*
modal
mass of nth mode
Mo
wall
base
moment
overstrength
M
total
seismic
horizontal
mass
Mty
wall base moment increase
at first tendon
yield
M,
wall
base
moment
at first tendon
yield
M, required
yield
moment
strength
of
nominally
elastic
SDOF
structure
Mr'
provided
yield
moment
strength for SDOF structure
N
axial
load
due
to
wall
self-weight
and
live
and dead
load
from
suspended
floors
N*
applied
factored
axial force
N
externally
applied
axial
load in Series 3
experiments
N,
wall
self-weight
in
Series 3 experiments
P
prestress
force
in
wall
P*
applied factored
prestress
force
Pi
prestressing
force
immediately
after anchorage
lock-off
Pj
prestressing
force
in
tendon
J'
(unloaded
state)
Pl
prestressing
force
after all
loss has
occurred
Py
total
tendon
force
when
stress in
all
tendons is fo,
-xxl-
7/21/2019 PHD Laursen-masonry Prestressed Walls
http://slidepdf.com/reader/full/phd-laursen-masonry-prestressed-walls 24/308
R
force
reduction
factor associated with ductile seismic
design
ra concrete roughness
amplitude
of construction
joint
(shear
friction
calcula-
tion)
s
vertical spacing of shear
reinforcing steel
Su
elastic spectral
acceleration
Sd
spectral
displacement
Sh
vertical confined dimension
(confining
plate
spacing)
T
fundamental structural
period
Tl first mode natural
period
t
time
h
time of application of
prestress
to masonry
tl
time
at
which
all time
dependent prestress loss has
occurred
t
time
at
time
step
n
ue
vertical extension of
'tension' end of wall at Vt
q
vertical
displacement
of top anchorage
point
of tendon
'j'
at V1
us
vertical shortening of
ocompression'
end of
wall
at Vt
V
applied
lateral force at
\
V*
applied
factored shear
force
Vu .
base shear due
to lateral forces
V.,
wall lateral force at t5
corresponding to
M.,
%
wall lateral
force
at
tq corresponding
to M
Vr
lateral force applied at
h corresponding
to
Mn
vm
masoffy shear strength
(stress)
V,
wall
shear
strength
(force)
due
to masonry
v**
maximum measured
wall shear stress
V.*
maximum experimental
lateral
force
Vr *
estimated
maximum
base shear
at
wall
overstrength
(shear
friction
calcula-
tion)
V,no maximum developed
base shear
from time-history analysis
vneh,p
shear strength
(stress)
predicted
by NEHRP
provisions
Vn,.
shear strength
(stress) predicted
by
NZS 4230:1990
provisions
%
wall lateral
force at
h
corresponding to
Mo
Vpp shear strength
(stress)
predicted
by Paulay and
Priestley
provisions
V.
wall shear strength
(force)
due
to contribution from V,
and Vr,
V,,
wall
shear strength
(force)
due to horizontal reinforcing
steel
Vry
wall lateral
force at
h
at
first tendon
yield
V
wall
lateral force at h corresponding to M
- xxll -
7/21/2019 PHD Laursen-masonry Prestressed Walls
http://slidepdf.com/reader/full/phd-laursen-masonry-prestressed-walls 25/308
Vy required
yield
strength
of
nominally elastic SDOF structure
provided
yield
shength
for
SDOF structure
y:
horizontal location
of
tendon
J'
with
respect to
wall centre line
Z
seismic
zone
factor
CNZS
4203:1992)
Z^
slope
of
descending branch
of
Priestley-Elder
stress-strain curve
Z^a
similar
to
Z^
but
related
to
high
strain rate
th)
vector
indicating location
(height)
of
masses
given
by
{m}
{m}
mass
vector
of
MDOF
structure
Greek
characters:
cr defines equivalent rectangular
stress
block
average stress
c[f'*
o
strain hardening
ratio for bilinear
SDOF
structure
P
defines equivalent rectangular
stress
block length
a:
pc
Aeo,
strain
increase in
extreme
tendon
at first
tendon
yield
Ai,
long
term
prestress
loss due to creep
Afpr total long term
prestress
loss
Afp, long term
prestress
loss
due
to
prestressing
steel
relaxation
Afr,
long terrn
prestress
loss
due
to shrinkage
AP
total
tendon force increase
at
Mn
APj tendon
force
increase of
tendon
J'
at Vg
APry total
tendon force increase
a
fust tendon
yield
APtvj force
increase
in tendon
J'
at first tendon
yield
At
length
of
time step
n
€
masonry
axial strain
8",
long term concrete masonry
creep
strain
%
masonry
strain
at
maximum
prism
strength f'-
en"
extreme
fibre strain
in wall
section
due
to
M,
eni
elastic masonry
strain
immediately after
prestressing
tmp
masoffy
axial
strain at
initiation
of
post-peak
strength
plateau
for
Priestley-
Elder
stress-strain
curye
gnu
maximum dependable
masonry
strain
%u
ultimate elongation
strain ofprestressing
steel
€sh
concrete masonry
final
shrinkage
shain
0
curvature
at
wall
section
due
to
applied
moment
M
0
wall
average
curvature
in the
plastic
deformation zone atultimate displace-
ment
capacity
-
xxlll
-
7/21/2019 PHD Laursen-masonry Prestressed Walls
http://slidepdf.com/reader/full/phd-laursen-masonry-prestressed-walls 26/308
0
shength
reduction
factor
0..
curvature at wall section due
to M ,
0
curvature
at wall
section due to M.
0r
flexural
strength
reduction
factor
T
non dimensional crack
length
at
M
Tr,*
drift demand at
equivalent SDOF structure
height
Ti
interstorey drift
demand
Ti,,nu*
interstorey drift
limitation
yo
wall ultimate drift capacity
Tu.*
wall drift corresponding to
dn,o
T,
roof
drift demand
A
Loss ratio between
prestress
loss calculated with additive and incremental
methods
Fa
displacement
ductility demand
v
poisson's
ratio
e
wall
rocking rotation
pu
fransverse
confining ratio for Priestley-Elder sbess-strain curve
p.
volumetric confining
ratio for Priestley-Elder stress-strain curve
(&
seismic dynamic base
shear amplification factor
x
ratio
of net concrete masonry
unit area to total area
ofmasonry unit and
void
€
wall axial
load ratio
q
viscous damping
ratio
q,,
wall axial load ratio at M
E,
wall axial load ratio at
wall
ultimate
displacement
capacity
{0 }
mode shape vector for n6 mode
-
xxlv
-
7/21/2019 PHD Laursen-masonry Prestressed Walls
http://slidepdf.com/reader/full/phd-laursen-masonry-prestressed-walls 27/308
Chapter
1
INTRODUCTION
I.
PRINCIPLE
OF UNBONDED
POST:TENSIONED
WALLS
Using unbonded
post-tensioning,
walls
are vertically
prestressed
by means
of
strands
or
bars
which
are
passed
through vertical
ducts inside the walls.
As the walls
are subjected
to lateral
displacements
in-plane
forces),
gaps
form
at the horizontal
joints,
reducing the
system
stiff-
ness.
As long
as
the
prestressing
strands are
kept
within
the
elastic
limit,
or
at
least
maintain
a
considerable amount of the initial prestressing
force, they
can
provide
a
restoring
force which
will
return the walls
to
their
original alignment
upon
unloading. Thus, the lateral
force-dis-
placement
response
may
be idealised
by
a
nonJinear
elastic relationship.
The integrity
of the
walls is maintained
as
no tensile
strains
form
in
the
wall
units and there are no residual post-
earthquake
di
splacements.
The
key feature in
this behaviour
is attributable to the tendons
being unbonded
over the
entire
wall
height, allowing for
distribution
of tendon strain over the entire length of the
tendon.
This
results
in
a large
tendon elongation capacity
before
yielding
which directly
results
in
a large
elastic
deformation
capacity of the
wall
panel.
It
is important to
use
high strength prestressing
steel
f,,
>
900
MPa)
because
of
its larger
elastic strain
capacity when
compared
to
ordinary
steel
grades
300-500
MPa).
High
strength
prestressing
steel improves
the elastic
wall
dis-
placement
capacity and reduces the
potential
prestressing
force loss
due to creep
and shrink-
age.
A
single large
gap
opening is
expected
to
occur at
the
base
of
unbonded
post
tensioned
concrete
walls,
this
location
being
a constnrction
joint
and subjected
to
the largest
flexural
demand.
Fig.
l.l shows
two
Post{ensioned
Concrete
Masonry
PCM)
wall
solutions
schematically.
Both
consist
of a
foundation
beam, the masonry
wall
panel
built of hollow
core
concrete
blocks, and
a beam
bond
beam) on top
of
the
wall
accommodating
prestressing
anchorages.
Typically grouting
of the wall
cavities
is
required. When
grouting
is
required,
prestressing
-l-
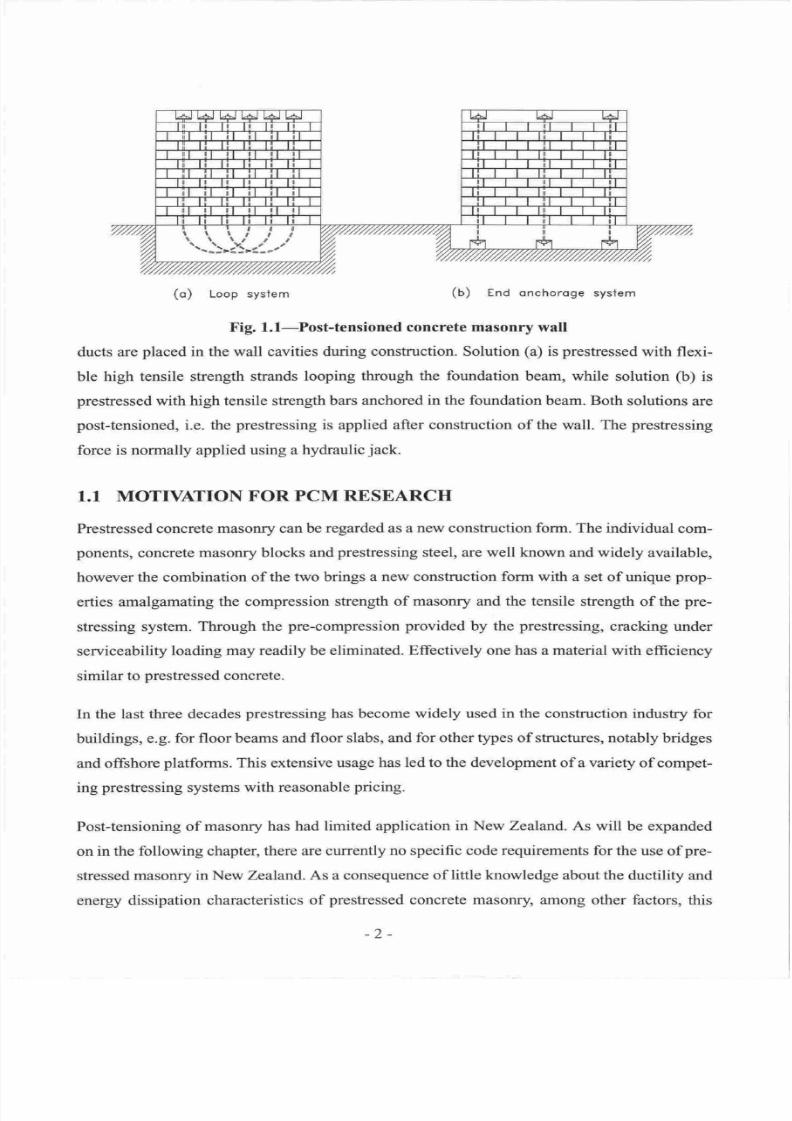
7/21/2019 PHD Laursen-masonry Prestressed Walls
http://slidepdf.com/reader/full/phd-laursen-masonry-prestressed-walls 28/308
o)
Loop
sysiem
b)
End onchoroge
syslem
Fig.
1.1-Post-tensioned
concrete
masonry
wall
ducts
are
placed
in the
wall cavities during
construction. Solution
a)
is
prestressed
with flexi-
ble
high
tensile strength strands
looping
through
the
foundation
beam, while
solution
b)
is
prestressed
with
high
tensile strength
bars
anchored
in the
foundation
beam.
Both
solutions
are
post-tensioned,
i.e. the
prestressing
is applied after construction
of
the
wall.
The
prestressing
force
is normally applied using
a
hydraulic
jack.
1.1
MOTIVATION
FOR
PCM RBSEARCH
Prestressed
concrete
masoffy can be
regarded
as
a
new construction form.
The
individual
com-
ponents,
concrete
masonry
blocks
and
prestressing
steel,
are well
known
and widely
available,
however the combination of
the two brings
a
new constnrction form
with a
set
of unique
prop-
erties amalgamating
the compression strength
of
masonry
and the tensile strength
of
the
pre-
stressing
system. Through
the
pre-compression
provided
by
the
prestressing,
cracking
under
serviceability
loading may
readily
be
eliminated.
Effectively
one
has
a
material
with efficiency
similar
to
prestressed
concrete.
In the last
three
decades
prestressing
has
become
widely used in
the construction
industry
for
buildings,
e.g.
for floor beams and
floor
slabs,
and
for other
types
of structures, notably
bridges
and
offshore
platforms.
This extensive
usage
has
led to the development of a variety
of compet-
ing
prestressing systems
with reasonable
pricing.
Post-tensioning
of
masonry
has
had
limited
application
in New
Zealand.
As
will
be expanded
on
in the
following
chapter,
there
are
currently
no
specific
code
requirements
for the
use
of
pre-
stressed
masonry
in New
Zealand.
As
a consequence
of little
knowledge
about
the ductility
and
energy
dissipation characteristics
of
preshessed
concrete masonry, ,rmong other factors,
this
-2-
7/21/2019 PHD Laursen-masonry Prestressed Walls
http://slidepdf.com/reader/full/phd-laursen-masonry-prestressed-walls 29/308
technology
is
currently not applied
for
seismic design
in
New
Zealand,.
Designers
are
effec-
tively
discouraged
from
speciffing
prestressed
masonry,
partially
due to uncertainty
about the
material
and
panially
because
of the
liability
risk.
The lack
of
detail on the use
of
prestressed
concrete masoffy in
the
current
New Zealand
masoffy
design standard is,
in
fact,
due to
a
worldwide lack of understanding
of the in-plane
seismic behaviour
of PCM, which
differs
considerably
from the
behaviour
of
reinforced
masoffy.
There
is
a distinct lack
of
experimental
data
illustrated
by the fact
that the tests
on
PCM
shear wall
subjected to
cyclic in-plane loading,
as
reported
in
this document,
constitute
the
only
testing
of
this
kind
yet
to
be carried out worldwide. Seismic
design
principles
for
PCM,
therefore, need
to
be
developed
through
a
research
programme.
Theoretical
concepts
need
to
be
refined
and subsequently verified
by laboratory experiments.
Recently,
considerable attention has
been
given
to
the use
of
post-tensioned
concrete walls.
This
research
effort underlines the
large
potential
of using
post-tensioning
in
conjunction
with
concrete
masonry walls
because
concrete
masonry
material
properties
are similar
to
those
of
concrete.
Motivation for
the
research
reported herein derives
from
the
fact
that
l)
the understanding
of
PCM
walls
subjected
to
seismic loading
is limited,
2)
the
seismic structural
performance
is
likely
to
be
satisfactory
or
better)
3)
little
structural testing
has been
conducted,
and
a)
PCM
presents
a
potential
industry
opportunity.
In
the wake
of
the above
findings,
an
indusfiy
supported research
programme
on
Prestressed
Concrete
Masonry
PCIO
was
initiated
in 1997
at
the
University of Auckland.
Initial
research
was funded
by
the
Univenity of
Auckland
and
by
the
Cement
and
Concrete
Association
of
New Zealand
CCANZ).
The
research
actMties in the
past
three
years
were
primarily
funded
by the New Zealand Concrete
Masonry
Association
NZCMA)
through
a
student
grant.
I.2
SCOPE
AND
ORGANISATION
OF
THESIS
Scope:
The
principal
scope
of
the thesis is
to
provide
detailed
guidelines
for
complete
analysis
and
design
of ductile
post-tensioned
concrete
masonry
walls, including assessment
of
seismic
demand
and
time
dependent
effects.
-3-
7/21/2019 PHD Laursen-masonry Prestressed Walls
http://slidepdf.com/reader/full/phd-laursen-masonry-prestressed-walls 30/308
The focus in this thesis
is on in-plane
response
of
post{ensioned
concrete
masonry walls
with
un-bonded
tendons
and
fully
grouted
wall
cavities. Three structural
testing
series were
con-
ducted to
create
an
experimental
data base.
Analytical
procedures
were
developed for
predic-
tion
and design
of
PCM
walls
subjected
to lateral in-plane
seismic forces.
Material
properties
of
concrete masonry were investigated in
relation to strength,
strain capacity
and
time depend-
ent
losses.
Organisation
The thesis
is
organised in the
following main
subjects:
Literature Review: Chapter
2
presents
a
literature review
of
the
curent
state
of
research
and
codification of
prestressed
masonry.
It
focuses on concrete masonry
because it
is the
dominant
structural
masonry material
in New
Zealand.Issues associated
with
materials
and
structural
response are discussed.
The conclusions
identifu the
areas
where
research
is
needed,
and serve
as
background
and
justification
of the current
prestressed
concrete masoffy
research
activities
at
the University of
Auckland.
Material
Properties: The
objective
of
Chapter 3 is
to
discuss
appropriate
material
properties
for
grouted
concrete masonry manufactured
in New
Zealand,,
with
particular
emphasis
given
to
the use of
these
parameters
when
designing
prestressed
concrete
masonry
GCM)
walls. The
discussion targets
concrete masonry crushing strength,
modulus
of
elasticity
and strain
capac-
ity, and
assesses
criteria from current international
research
and
masonry design
standards.
Time dependent
e/fects. Assessment of
prestressing
losses
for
prestessed
concrete masonry
structures
is
presented
in
Chapter
4. The effective
prestress
level
decreases
over time
due
to
creep, shrinkage
and steel relaxation,
hence
reducing structural
efficiency.
A
detailed
review
of
the
current
state
of
research
on the topic
is
presented
and
recommendations
are
given
for
New
Zealand
conditions with support
from experimental
results.
Stntctural
ksting:
Three
series of
structural testing
were
carried out. Chapters
5, 6 and
7
are
concemed
with
interpretation
of
the testing results.
The
principal
intent
with
these
in-plane
wall tests
was
to
validate the use
of
PCM
in a
realistic
sfuctural
configwation. Furthennore,
the tests
explored
means
of
masonry confinement or strengthening that
are expected
to increase
the reliable
wall drift capacities.
-4-
7/21/2019 PHD Laursen-masonry Prestressed Walls
http://slidepdf.com/reader/full/phd-laursen-masonry-prestressed-walls 31/308
Analysis and design' Chapter
8
is
concerned with
analytical methods for
predicting
the in-
plane
force-displacement relationship
for unbonded
post-tensioned
concrete masonry.
The
scope of such methods is to
describe the
wall behaviour throughout the
entire loading
range,
including non-linear
large displacement
response
that
can be
anticipated
in
a
seismic
event.
Dynamic
analysis: Chapter 9 is concemed
with non-linear time-history
analysis of unbonded
post-tensioned
concrete masonry
GClv
cantilever walls. Analyses
were carried
out
in
order
to
clari$ the
relationship
between
wall
stiftress
and sfiength,
and
the
wall
displacement demand
due to dynamic
seismic excitation. Pseudo
displacement specha
(S)
were dweloped
for
design
use, and a
displacement focused
design
procedure
is outlined.
-5-

7/21/2019 PHD Laursen-masonry Prestressed Walls
http://slidepdf.com/reader/full/phd-laursen-masonry-prestressed-walls 32/308
7/21/2019 PHD Laursen-masonry Prestressed Walls
http://slidepdf.com/reader/full/phd-laursen-masonry-prestressed-walls 33/308
Chapter
2
LITERATURE
REVIEW
2.
OVERVIEW
Post-tensioning
of
masonry
has
had
limited
application in
New
Zealand.
There
are
currently no
specific code requirements
for
the
use
of
presffessed
masonry, largely
as a consequence
of
little
knowledge
about the
ductility capacity
and
energy dissipation ofprestressed concrete
masonry,
among
other factors.
Designers
are effectively
discouraged
from
specifuing
prestressed
masoffy,
partially
due
to
uncertainty
about
the construction form and
partially
because
of the
liability
risk.
There are, however, a few
examples of the
use
of
prestressed
concrete
masonry in New Zea-
land. The
classic example is
a S-storey
building
erected
in
Christchurch
in 1970.
The
apartment
complex was
supported
by
12
n.
cavity
walls
with
vertical
prestressing
strands
l2-ll.At
that
time the
solution
was
found
to
be both structurally and economically
feasible. It
should
be
noted
that
the design requirements
at
that time were
less
stringent. The
earthquake loading
was
lower than
seen
today
and
the
building was designed according to the allowable
stress limit
state.
In the United Kingdom
prestressing
of masonry is mostly
used
for wall and
pier
designs. The
walls are
primarily
designed
to
resist
out-of-plane
loading, i.e.
face loading such as
strong
winds or
earth
prsssure.
The in-plane
forces
in
non-seismic
areas
are normally
negligible
in
comparison
to
the
face loading.
Post-tensioning of masonry
has
typically
been
used for
stmc-
tures of unusual dimensions,
e.g.
for
large masonry beam
spans
and
tall
walls. There
are, for
example, many reports
on the
use
of
prestressed
masonry
fin-walls
[2-2]
with
eccentrically
placed
post-tensioning
because
of unidirectional
loading
applied to such stnrctures
as storage
tanks
and
retaining walls. The fins
or
pilasters) greatly increase
the lateral
strength of
the
wall,
allowing for
thin
wall
sections
between the
fins.
n
7/21/2019 PHD Laursen-masonry Prestressed Walls
http://slidepdf.com/reader/full/phd-laursen-masonry-prestressed-walls 34/308
The
use
of
prestressed
masonry in the United
States
of America
has been
limited
so
far.
There
are
reports on
some
two-storey
homes, factory buildings,
retaining
walls and
sound
walls,
e.g.
l2-3,2-4).
All
of
these
were in non-seismic
areas.
Currently in
the
U.S.A.,
prestressed
concrete
masoffy is
designed
in
accordance
with
allowable
sfress
design
principles
based
on
elastic
response
to
seismic excitation.
Therefore,
prestressed
masonry
is
presently
not
applied in
seis-
mic
zones where design loads
potentially
can be reduced significantly
by means
of
ductility
and
energy dissipation.
Post-tensioning
can be
used
advantageously
for
rehabilitation
of
old buildings.
Such applica-
tion
used
for
seismic
strengthening
is
discussed
by Ganz[2-5] who
provides
several
case
stud-
ies on
masonry stmctures
located on
the
American west
coast-
It
is
beyond
the
scope
of
this
thesis to discuss the use of
post-tensioning
for masonry building
rehabilitation,
so
no
further
details
are
given
here
on that subject.
Detailed discussions
of
the development of
prestressed
masonry research
and application
can
be
found in
Schultz
and
Scolforo
p-61and
Lissel et
al.12-71.
2.I
CODIFICATION
OF
PRESTRSSSED MASONRY
The development of
prestressed
masonry
was
pioneered
in
the
United Kingdom
P-61,
begin-
ning
in
the late 1950's and
primarily promoted
by daring
structural engineers. The
combined
efforts of
development through
the
years
led to
a
draft code
in
the late
1970's, which
was
even-
tually approved
and
incorporated
into the
general
masonry
code
BS
5628,1985:
'Code of Prac-
tice
for
Use of
Masonry'. This
code
is
based
on
limit state
design
principles.
The
early
uses
of
prestressed
masoffy
predominantly
involved clay brick, which is widely
available in the
U.K.,
but more recent efforts
have
incorporated
prestressed
concrete masonry. BS 5628
part2,
Code
of
Practice for Use of Masonry,
Stnrctural Use
of
Reinforced
and
Prestressed
Mason.ry
was
revised
in 1995
[2-8].
In
the U.S.A.,
masonry codes have
recently incorporated
provisions
for
design
of
preshessed
masonry. The
process
of
developing the appropriate
chapters for
amendment to
the
codes
had
been
proceeding
since
the early
1990's. The
proposals
were explicitly
recognised
with
the
pub-
lication
of
the
MSJC
'Building
Code
Requirements
for
Masonry
Structures'
in
2002
12-91.
These
were
inspired by the relevant masonry
codes and
prestressing
codes,
and
to
some
extent
by BS 5628.
The MSJC 2002 is
partially
based
on the allowable
stress
concept, which
simpli-
fies
calculations but
also
produces
unnecessarily
conservative
results. MSJC
recognises the
use
-8-
7/21/2019 PHD Laursen-masonry Prestressed Walls
http://slidepdf.com/reader/full/phd-laursen-masonry-prestressed-walls 35/308
of
prestressed
masonry for
ductile seismic
design.
A
minimum amount flexural
reinforcement
mild
steel)
is required. Bonded
prestressing
steel
may
count
towards the
minimum
amount
of
reinforcement
but unbonded
prestressing
steel may not.
This
means
that
mild
steel is required
in
the
plastic hinge
zone
for
unbonded post-tensioned masonry
walls.
Prestressed
masonry was first
adopted in the Australian masonry design
code
with the
issue
of
AS
3700-1998
[2-10].
This
code
mainly
targets constnrction
in non-seismic
regions,
but
can
be
applied
for
design
of
structures in earthquake
zones
given
design
to the elastic
response
of the
seismic forces. The
prescriptions
for
preshessed
masonry
iue largely
inspired
by
BS
5628:1995
[2-8].
There
are currently no specific code requirements
for
the
use
of
prestressed
masonry
in
New
Zealand.In
the
New Zealand masonry
design
code
NZS 4230:1990
[2-11]
reference
is
made
to
the
design
of
prestressed
masonry, being
conceptually
parallel
to
design
of
prestressed
con-
crete, but no
guidance
is
given.
However,
the fact that
prestressing
of masonry is
incorporated
in the Australian masonry design
standard is
of significant
importance in
the
New Zealand
con-
text
due
to the expected
harmonisation
of
the
New Zealand
and
Australian
codes
in the
future.
It
seems natural
that
the
design concepts
for
prestressed
masonry
in
seismic zones
for a
future
common masoffy
code
should
be developed
in
New Zealand,
primarily
because
of
New
Zea-
land
expertise
in
seismic design and
because of
less concern about earthquakes
in
Australia.
This
is
clearly
a
strong incentive to
push
forward the
research
into
prestressed
masonry
in New
Zealand.
There
has been
significant interest
in
developing
codes
in many
other
countries.
ln
Canada, for
example,
code
development is well
advanced
and
is
coordinated with
the U.S. effort.
2.2
CURRENT
STATE OF RESEARCH
This chapter
focuses on concrete masoffy
because it
is the dominant sfiructural
masonry
mate-
rial
in New Zealand. Fired
brick is widely
used
for wall cladding,
but rarely
for
load
bearing
purposes.
[n order to describe
the current state
of
research, issues associated
with
materials
and
structural response
are
discussed.
The
subsequent conclusions
identifo the
areas
where
research
is
needed, and serve
as
background
andjustification
ofthe
current
prestressed con-
crete
masonry
research
activities
at
the
University
of
Auckland.
-9
-
7/21/2019 PHD Laursen-masonry Prestressed Walls
http://slidepdf.com/reader/full/phd-laursen-masonry-prestressed-walls 36/308
2.2.1 Materials
2.2.1.1
Concrete
masonry
The strength and constitutive
properties
of
grouted
concrete masonry
are
well
established
as
documented
in
Chapter 3.
With
the
introduction
of
pre-compression,
the creep
and shrinkage
parameters
of
concrete masonry
become
more important, and
the higher magnitude
of
unre-
coverable deformation
over
time
leads
to significant
prestressing
losses.
There
have
been
sev-
eral
studies
on
creep and shrinkage
of
concrete
masoffy,
most recently
by Hamilton
and
Badger
12-12)
who
studied
U.S.
concrete
masonry.
It is
unclearwhether
these
studies
apply
directly
to the New
Zealand
type
of
concrete
block,
which may
have
significantly
different
creep
and
shrinkage behaviour
due
to
its unique
aggregate
composition. The
studies
by
Hamil-
ton
and
Badger did not
include
experiments
on
fully
grouted
concrete masonry.
2.2.1.2
Prestressing steel
The
constitutive
properties
of
high strength
prestressing
steel are well
established
as docu-
mented
in Chapter
3. In
terms
of
time
dependent
effects,
steel
relaxation
for high-strength
steel
also
affects
the
effective
prestress
level
over
time.
This
depends on the type
of
high-strength
steel,
generally
categorised
as
high
relaxation
or
low
relaxation.
The steel relaxation
effect is
well
defined
and
may
be
extracted
from most
codes
for
prestressed
concrete,
e.g.
NZS
3l0l
[2-
131.
2.2.2 Structural behaviour
2.2.2.1 Out-of-plane
response
Current
codes
L2-8,2-9,2 10]
that incorporate
criteria on
prestressed
masonry,
apply
directly
to
non-seismic
application
where
out-of-plane
lateral
forces
typically govem
design.
For
non-
seismic
application,
these codes,
supported by
extensive
laboratory
research,
appear
to
perform
satisfactorily despite
some
differences.
A
selected
list of out-of-plane
wall tests
can be
found in
12-61and,12-71.
An
extensive literature
review
suggests
that no
tests
of
prestressed
concrete
masoffy
walls
sub-
jected
to
simulated
oucof-plane
seismic loading
have
yet
been
conducted.
This
lack
of
test data
limis
the knowledge about the
ductility
capacity and energy
dissipation
properties
of
PCM
out-of-plane
response,
and
necessarily
leads
to the
use of
design
forces
based
on
elastic
-10-
7/21/2019 PHD Laursen-masonry Prestressed Walls
http://slidepdf.com/reader/full/phd-laursen-masonry-prestressed-walls 37/308
response
to
ground
motion for
design
of
PCM
walls carrying significant
out-of-plane
seismic
forces.
Thus no force reduction
due
to
ductility is
permitted.
In
most New Zealand
applications, walls
do not carry significant
out-of-plane lateral
seismic
forces,
other than
those arising from
wall
self
weight
and the
imposed overall
structural
dis-
placements seismic
forces
are
resisted
by other structural elements). In
that
case
the
require-
ment for
ductility and
energy
dissipation
will
be
low
and
design
to the elastic
seismic response
will
probably
be
satisfactory.
2.2.2.2
In-plane
response
The
in-plane
response
of
prestressed
masonry
walls
for
non-seismic design
has been
studied
in
some
detail.
Page
and
Huizer
[2-14,2-15]
and Huizer and Shrive
[2-16]
have
reported
on
monotonic lateral in-plane
load
tests
of
post-tensioned
hollow
clay masonry
shear
walls.
Page
and
Huizer
l2-I4l
tested
three clay masonry
walls. The walls
were 3.0
m high and
2.5
m
long,
constructed
in
running
bond
of
hollow
clay masonry units. The
walls were
reinforced
vertically
with
four VSL
prestressing
bars. Walls
A
and
B
had the four
VSL
bars
prestressed
vertically
to approximately
390IdlIupon
construction.
These
walls
were not
grouted.
The
VSL
bars
in
wall
C
remained
unstressed
but were
bonded
to
the
wall
by
grouting
of the wall
cavities.
Furthermore
wall
A had
four
VSL
bars
embedded
horizontally which were
post-tensioned
to
a
total
of
about 200
kN. Testing
of
the
walls
in
a
monotonic
push
excursion
revealed
signifi-
cantly different
behaviour. The
maximum
applied horizontal
shength
was 146
kN,
175
kl.{
and
I
15
kN for
walls
A, B
and C, respectively.
Wall
A
failed
prematurely
due
to
a
construction
error but the actual wall
strength was
assessed
to be significantly higher
than
175
kN.
The typ-
ical failure
mode
for all
walls
was
tensile
splitting of
the diagonal compression strut.
Applica-
tion
of
prestress
demonstrated
that
the
vertical
precompression
in
wall B
and more
so
the
vertical
and horizontal
precompression
in wall
A
deferred
wall
tensile
splining to higher
hori-
zontal loads when
compared to
the
non-prestressed
wall
C. Effectively larger
strength
and
dis-
placement
were reached
for wall
B
and
also
for
wall
A
had
it
not failed
prematurely)
during
testing.
These wall tests
attest to
the
significant
increase in masonry
shear
strength
due to
pre-
stressing. However,
they
did not
provide
much information
on
prestessed
wall
behaviour
in
the context
of
ductile seismic
design
where
reversing displacement excursions
far
beyond the
wall yield
displacement
are
expected.
Similarly,
the
tests
reported
in
[2-15]
and
[2-16]
demon-
-
l1-
7/21/2019 PHD Laursen-masonry Prestressed Walls
http://slidepdf.com/reader/full/phd-laursen-masonry-prestressed-walls 38/308
strated
that
prestressed
masonry
walls
provide
higher strength
and comparable
deformation
capacity,
when compared
to
reinforced
masonry walls.
The
design
procedures
for
shear walls
subjected
to in-plane forces,
suggested
by
l2-l4l,12-151
and
[2-16],
largely
follow
those
for
the
out-of-plane
response as
given
by
12-8,2-9,2-L01.
These
codes
have
drawn on
research
into
both
prestressed
concrete
and
prestressed
concrete
masonry
t2-6).The
procedures
treat
presfressed
masonry
walls
as
conceptually
similar to
unreinforced
masonry
walls
with
the
prestress
acting
as
an
additional
extemally
applied axial load.
Currently,
limited
experimental
data exists
for
prestressed
concrete masonry
walls
under
in-
plane
seismic loading.
It is in
fact
believed,
that the
only
tests
to
have
considered
unbonded
post-tensioned
concrete masonry
walls
subjected
in-plane seismic loading
are those
conducted
at
the
University
of
Auckland,
as
reported
in
Chapters 5,
6
and 7.
For
proper
in-plane
ductile
seismic
design
of
unbonded
post-tensioned
concrete
masonry walls,
it
is imperative
to
under-
stand
the
ultimate behaviour
of
prestressed
masonry.
It is
important to
be
able
to categorise
var-
ious
failure
modes, such as
flexural failure
characterised
by
concrete
compression
failure
or
steel
rupture,
shear
failure
characterised
by
diagonal tension cracks
or
bed
joint
sliding,
joint
failure and axial instability.
As knowledge of
these modes
of failure, and their
associated
strength
and ductility capacity
is
heavily
dependent
on experimental
work,
it
is a
cumbersome
process
to establish
an
appropriate
design
procedure.
The experimental
database
must
consider
cyclic
load
tests,
simulating
seismic
motion. Clearly more in-plane testing
is
needed.
On
the
confary,
there has
been
extensive
research undertaken
on
other types
of
prestressed
systems
under
seismic
loading, notably
prestressed
concrete. The
culmination
of
this research
was testing of a
precast prestressed
concrete
wall with
unbonded tendons carried
out by
the
PRESSS coordinated
research
group
in the
USA
[2-
17,2- I
8]. The elevation
of the large
scale
wall is
shown
in
Fig. 2.l.lt consisted
of
four
panels
each 9'
(2.7a
m) long,
l8'-9
(5.72
m)
tall,
l'
(0.305
m) thick,
and stacked
in
a
2
x 2
pattem.
The wall
was
prestressed
vertically with
unbonded
prestressing
tendons
that were
located centrally
in
the
wall
panels.
The
wall
panels
were clamped
together
vertically
by
the
prestressing
such
that
panels
I and
3
(P13)
could move
independently
in the
vertical
direction
from
panels
2
and
4
(P24\.
UFP connectors
(energy
dis-
sipators) were located
in
the interface between
Pl3
and P24 such
that relative
vertical
displace-
ment
between
Pl3
andP24
due
to
wall
lateral displacement would
force
the
UFP
connectors to
dissipate
energy.
The
wall
panels
were
lightly
reinforced
vertically.
Panels
I
and
2
had
special
confinement
reinforcement embedded
in the compression
toes.
-t2-
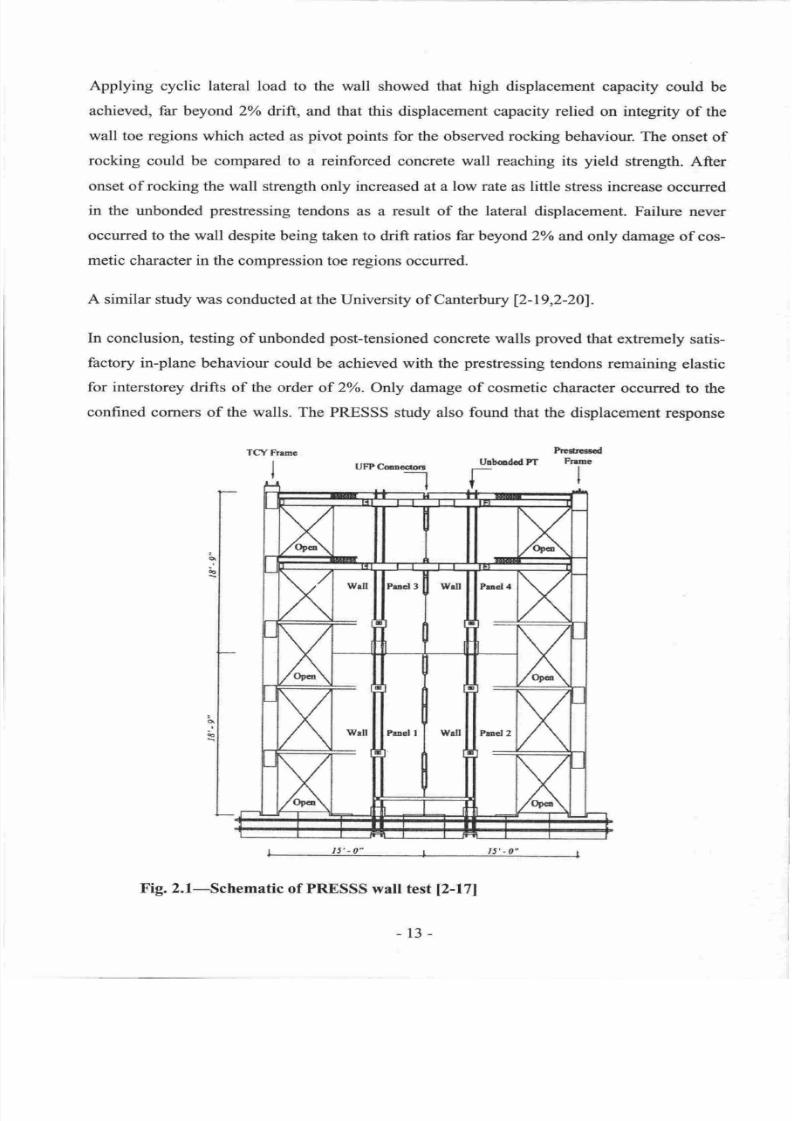
7/21/2019 PHD Laursen-masonry Prestressed Walls
http://slidepdf.com/reader/full/phd-laursen-masonry-prestressed-walls 39/308
Applying
cyclic
lateral load
to
the
wall
showed that
high
displacement capacity
could be
achieved,
far beyond zoh
drift, and that this displacement capacity relied
on integrity
of
the
wall toe regions
which
acted
as
pivot points
for the observed rocking
behaviour. The
onset
of
rocking could be
compared
to
a reinforced
concrete
wall
reaching
its
yield
strength.
After
onset
of
rocking
the wall
strength only increased
at
a low rate
as
little
stress
increase
occurred
in
the
unbonded
prestressing
tendons
as
a
result
of
the lateral
displacement. Failure
never
occurred to the
wall
despite being taken to
drift
ratios far beyond
2Yo
and
only
damage of
cos-
metic
character in the
compression toe regions
occurred.
A
similar
study was conducted
at
the University
of
Canterbury
[2-19,2-20].
In
conclusion, testing
of
unbonded
post-tensioned
concrete
walls
proved
that
extremely
satis-
factory in-plane
behaviour could
be achieved
with
the
prestressing
tendons
remaining
elastic
for
interstorey
drifts
of
the
order
of 2%.
Only damage of cosmetic character
occurred
to
the
confined corners
of
the walls.
The
PRESSS study also found that the
displacement response
TCYFmrc
I
UFPC,:@dd
Urbodrd
{-
Flclrtcr.d
Fnrnc
I
I
X
t
E
X
X
Wrll
Pnd
3 wdl
Prcl4
X
OpGtr
Wrll
hsol
I Wrtl
hd
2
X
X
I
I5'-0'
I
I5'-0"
t
Fig.
2.I-Schematic
of PRESSS
wall
test
l2-l7l
-13-
7/21/2019 PHD Laursen-masonry Prestressed Walls
http://slidepdf.com/reader/full/phd-laursen-masonry-prestressed-walls 40/308
amplitude
could be effectively
confolled
(limited)
by
incorporation
of
enerry
dissipators.
lnsignificant
residual wall displacement
was observed
after sustaining
the
peak
drift.
The
structural behaviour of
this type
of
wall
resembles
that of PCM,
so
results
are
highly
relevant
to
the current
study.
2.2.2.3
Joints
Wall to floor
joints
could
potentially
be simplified
with
the
use of
prestessing.
As
suggested
by Ganz
12-211,
a system
with
precast
concrete
floor
slabs clamped
between
prestressed
con-
crete
masonry walls from the below and above storeys could
potentially
reduce
the
amount
of
mild
steel
in
the
joint.
Reinforcement
congestion in
the
joint
can
be avoided
and speed
of con-
struction improved.
There
has been some
research
into this
type
ofjoint
for
concrete
solutions
for non-seismic application.
There
is,
however,
a
total lack
of experimental
data
for
prestressed
concrete
masonry
joints
of this
type when subjected to seismic
loading.
2.2.2.4
Prestress
loss
Guidelines
for assessing
the
prestress
loss
are
provided
by
existing
masonry codes,
e.g.
BS
5628l2-8),
MSJC
[2-9]
and
AS
3700
[2-10]. Application of
the provisions
in
these codes
to
similar
materials results
in
considerable
difference
in
the
calculated
prestress
losses.
It has
been
estimated
[2-6]
that
the
prestressing
losses
over time
due
to
creep,
shrinkage,
steel
relaxa-
tion etc.
for
concrete
masonry may amount
to
up to 30 of
the
initial
tendon stress.
2.3 CONCLUSIONS
The following
conclusions
on
the current
state
of
prestressed
concrete masonry
wall
research
are
drawn
from
the
above
discussion.
These
conclusions focus on the use
of
unbonded
post-
tensioning,
which is the topic of this
thesis. Furthermore, the
focus
of
this document
has
been
limited to studying
prestress
loss
due
to time dependent
effects and in-plane
wall
response.
(l)
Material
properties
for concrete
masonry
and
prestressing
steel,
in terms
of constitutive
behaviour
(stress-strain
relationship),
have
been researched
extensively
and
are rela-
tively well understood.
(2)
There
is
a
need
for
better understanding
of
the creep and shrinkage properties
for
con-
crete masonry subjected to axial
loading, with
a view
to New Zealand
conditions.
This
is
particularly
the case
for fully
grouted
concrete masonry,
which
has
not
been
thor-
oughly examined experimentally.
-t4-
7/21/2019 PHD Laursen-masonry Prestressed Walls
http://slidepdf.com/reader/full/phd-laursen-masonry-prestressed-walls 41/308
Nunnerous laboratory
tests
have been conducted
m
the out-of-plane response
of
pre-
stressed
concrete
lnasonqr
walls
but
only
few in-plane tests.
Little
research
has
tieen
done
on
in-plane
seismic
response
neither
experimentally
nor
theoretically
in
particrr-
lar
for
the
case
of
rmbonded post-tensioned concrete
lunonry
walls.
-15-
7/21/2019 PHD Laursen-masonry Prestressed Walls
http://slidepdf.com/reader/full/phd-laursen-masonry-prestressed-walls 42/308
2.4
REFERENCES
L2-Il
Hanlon, J.
R.
G.,
Concrete
Masonry
in
New Zealand:
Prestressed
Concrete Masowyo
Concrete, The
Concrete Society
England),
Vol.
4,
No. 9,
September
1970.
t2-21
Curtin,
W.G.,
Shaw,
G.,
Beck, J.K. and Parkinson,
G.1.,
Masonry-frn
walls, The
Struc-
tural Engineer, Vol. 624,
No. 7,
July
1984.
12-31
Biggs, D.T., Planning
Projects to
Use
Prestressed
Masonry, Proceedings
of
the
2001
Structures
Congress
and
Exposition
CD-ROM),
American Society
of Civil
Engineerso
Washington
D.C., May 2001.
l24l
Hamilton
III,
H.R.
and Woodham,
D.B.,
Prestress
Losses
in Post-tensioned
Concrete
Masonry
Sound Walls,
Proceedings
of
the 2001
Structures
Congress
and Exposition
CD-ROM),
American Society
of
Civil
Engineers, Washington
D.C.,
May 2001.
12-51
Gatu,
H.R.,
Strengthening
of
masonry stntctures
with
post-tensioning,Proceedings
of
the
6th
North American
Masonry
Conference, Philadelphia,
Pa., 1993,YoL.2,
pp.
645-
655.
12-61
Schultz,
A.
E. and Scolforo,
M.
J.,
An Overview of
Prestressed
Masonry, The
Masonry
Society Journal,
August
1991,
Vol.
10,
No.
l,
pp. 6-21.
12-71
Lissel, S.L.,
Sayet-Ahmed,
E.Y. and Shrive,
N.G.,
Prestressed
Masonry
-
The
Last
Ten
Years,Procedings of the
8fr
North American
Masonry
Conference, Austin
Texas,
USA,
June
1999.
[2-8]
855628:
1995, Part
2:
Code of
Practice
for
use
of
Masonry.
Structural Use
of Rein-
forced
and
Prestressed
Masonry,
British
Standards
Institution, London.
12-91
MSJC:
Building
Code
Requirements
for
Masonry Structures and
SpeciJication
for
Masonry Stntctures,
ACI 530-02/ASCE
5-02/TMS 402-02, The
Masonry
Standards
Joint
Committee, USA,
2002.
[2-10]
AS 3700-1998,
Masonry Structures,
Standards
Australia,
Homebush,
NSW
Australia.
[2-11]
NZS
4230:1990, Code
of
Practice
for
the
Design
of
Masonry
Structures,
Standards
Association
of New Zealand, Wellinglon.
l2-I2l
Hamilton,
H.R.
III and
Badger, C.C.R.,
Creep
Losses
in
Prestressed
Concrete
Masonry,
The Masonry Society
Journal, July
2000, Vol.
18, No.
l.
-
16-
7/21/2019 PHD Laursen-masonry Prestressed Walls
http://slidepdf.com/reader/full/phd-laursen-masonry-prestressed-walls 43/308
l2-I3l
NZS
3101:1995
Code
of
Practice
for
the Design
of
Concrete Stnrctures
Standards
Association of New Zealand
Wellington.
l2-I4l
Page A.
W.
and
Huizer A.
Racking
Tbst
on Reinforced
and Prcstressed
Hollow
Clay
Masonry
Walls Proceedings
of
the
Eighth International
Brick/Block
Masonry Confer-
ence
Dublin Ireland
Yol.2
September
1988
pp.
538-547.
[2-15]
Page
A.
W. and Huizer
A.
Racking Behaviour of Prestressed
and Reinforced
Hollow
Masonry
Walls Masonry International The
British
Masonry Society
Vol. 2 No.
3
Winter
I
988/1
989
pp.
97
-102.
12-16l
Huizer A.
and
Shrive N. G. Performance
of
a
Post-tensioned Single
Wythe
Clay
Brick
Masonry
Wall
Tested
in
Shear Proceedings
of
the fourth
Canadian
Masonry
Sympo-
sium Fredericton
N.8.
Vol.
2
June
1986
pp.
609-619.
l2-l7l
Nakaki
S.D.
Stanton
J.F.
and Shritheran
S.
An
overview of the
PRESS S
Five-Story
Precast
Test Building PCl
Journal
March-April
1999 pp 26-39.
[2-18]
Priestley M.J. Nigel
Shritheran
S.
Conley J.R.
and
Pampanin
5. Preliminary
Results
and
Conclusions From
the PRESSS
Five-Story
Precast
Concrete
Test Building
PCI
Journal
Yol.44
No.
6
Nov.-Dec.
1999.
I2-l9l
Rahman
A.M.
and Restrepo
J.1.
Earthquake
Resistant
Concrcte Buildings:
Seismic
Performance
of
Cantilever
Walls Prestressed
Using
Unbonded Tbndons
Research
Report 2000-05 Department
of
Civil
Engineering
University
of
Canterbury Christch-
urch New
Zealand .
12-201Holden
TJ.
A
Comparison
of the Seismic Performance
of
Precast
Wall
Constntction:
Emulation
and
Hybrid
Approaches Research Report
2001-04 Deparfinent
of
Civil
Engineering
University
of Canterbury Christchurch New
Zealand .
[2-2I]
Ganz
H.
R.
Post-tensioned
Masonry
Stntctures Report 2
VSL
lntemational
Ltd.
Berne
Switzerland
1990.
-t7
-

7/21/2019 PHD Laursen-masonry Prestressed Walls
http://slidepdf.com/reader/full/phd-laursen-masonry-prestressed-walls 44/308
l8
7/21/2019 PHD Laursen-masonry Prestressed Walls
http://slidepdf.com/reader/full/phd-laursen-masonry-prestressed-walls 45/308
Chapter
3
MATERIAL
PROPERTIES
3.
OVBRVIEW
The
objective of this chapter is to
discuss appropriate
material
properties
for
grouted
concrete
masonry manufactured
in
New
Zealand,
with
particular
emphasis
given
to
the
use
of
these
parameters
when designing
prestressed
concrete masonry
eCM)
walls.
The discussion
targets
the concrete masonry
crushing strength,
modulus of elasticity and strain capacity,
seen
from a
New
Zealand
perspective.
However,
a
review
of criteria
from
current
international
research
and
masonry
design standards is included.
Strength and
strain
enhancement
of
the
wall
compres-
sion
zone
due to confinement is
also discussed, and
a
concrete masonry
constifutive relation-
ship model for detailed
structural
analysis
is
described
and
erraluated. Prestressing
steel
material properties
are discussed
at
the
end
of
this
chapter.
Time
dependent
effects
in
PCM,
notably masonry
creep
and
shrinkage, and
prestressing
steel
relaxation
are
discussed
in Chap-
ter 4-
It
is noted
that the term
PCM
in this
chapter refers to
post-tensioned
concrete
masoffy
walls
with unbonded tendons,
suitable
for
ductile seismic design.
Design
of
PCM
generally
benefits from
an accurate
estimation of the material
properties.
Cur-
rently,
the
New Zealandstandard
for
design of masonry structures NZS 4230:1990
[3-l]
speci-
fies
unrealistically low
masonry compression
strength.
This
may not
greatly
affect the design
of
reinforced
masonry,
but certainly affects
the design
of
PCM, where increased
axial wall
forces
place
greater
demand
on
the
available compression strength
of
the masoffy.
Similarly,
the current
New
Zealand
practice
is
to adopt unrealistically high
values
of
the masonry
elastic
modulus, thereby
underestimating
the structural
period
and
overestimating
the
design lateral
forces resulting from
earthquake
response.
Structural testing
of
PCM
walls has shown large
masonry
strain capacity
of
the flexural
compression zone.
Strain
values
far beyond those
spec-
ified
in NZS
4230
have consistently
been measured, suggesting that
current code criteria
are
unnecessarily
disadvantageous when
designing PCM.
It
is argued that there is
little
value
in
-19-
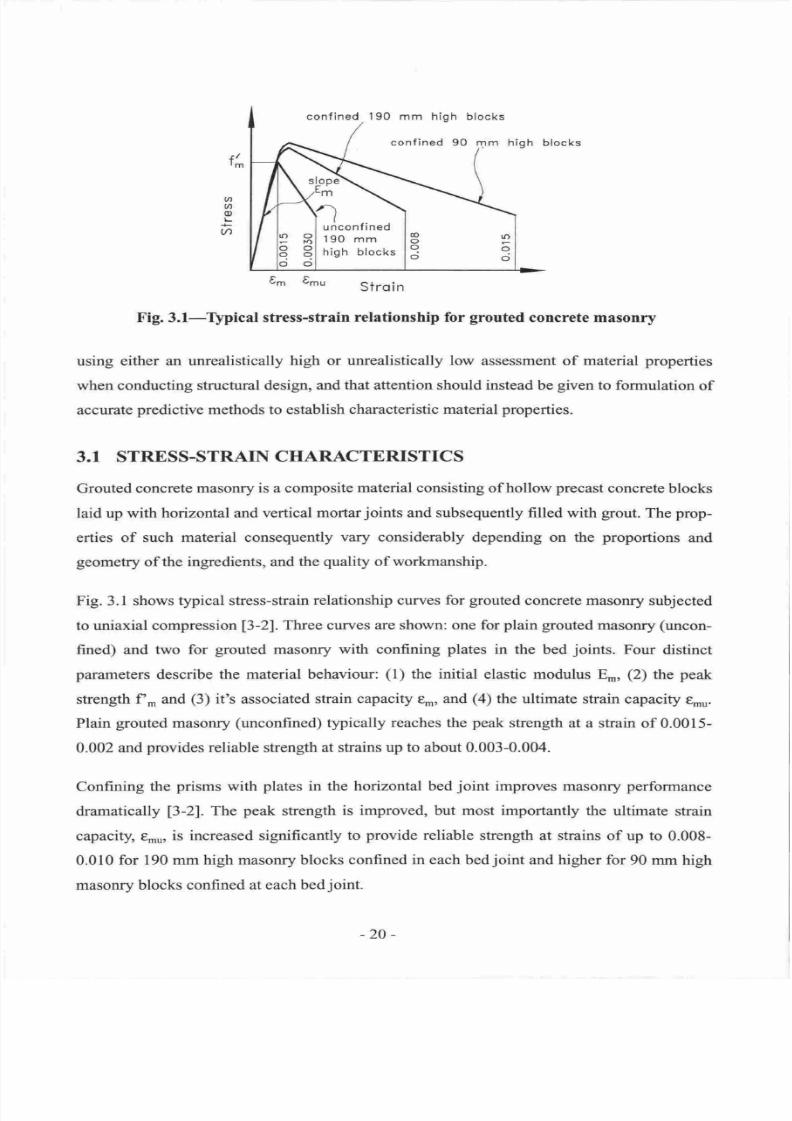
7/21/2019 PHD Laursen-masonry Prestressed Walls
http://slidepdf.com/reader/full/phd-laursen-masonry-prestressed-walls 46/308
190
mm high
blocks
confined
90
mm
high
blocks
unconfined
190
mm
high
blocks
+/
,m
0m
t-,
Stroin
Fig.
3.l-Typical
stress-strain
relationship for
grouted
concrete masonry
using
either
an
unrealistically
high or
uffealistically low
assessment
of material
properties
when
conducting
structural
design,
and
that
attention should
instead be
given
to
formulation
of
accurate
predictive
methods to establish
characteristic material properties.
3.1
STRESS-STRATN
CHARACTERISTICS
Grouted
concrete
masonry is
a
composite
material consisting
of hollow
precast
concrete
blocks
laid up
with
horizontal
and
vertical
mortar
joints
and
subsequently
filled with
grout.
The
prop-
erties
of
such
material
consequently
uary
considerably depending
on the
proportions
and
geometry
of the
ingredients,
and
the
quality
of workmanship.
Fig. 3.1
shows typical
stress-strain
relationship curves
for
grouted
concrete
masonry subjected
to uniaxial
compression
[3-2].
Three curves
are
shown: one
for
plain grouted
masonry
(uncon-
fined) and
two for
grouted
masonry with confining
plates
in the bed
joints.
Four
distinct
parameters
describe
the material behaviour:
(l)
the initial
elastic modulus E,,
(2)
the
peak
strength
f ,n
and
(3)
it s
associated
strain
capacity em,
and
(4)
the
ultimate
strain capacity
e*u.
Plain
grouted
masonry
(unconfined)
typically
reaches
the
peak
strength
at a strain
of
0.0015-
0.002
and
provides
reliable
strength
at
strains up
to about
0.003-0.004.
Confining
the
prisms
with
plates
in
the
horizontal bed
joint
improves masonry
performance
dramatically
l3-2l.The
peak
strength
is improved, but most importantly
the
ultimate
strain
capaciry
enu,
is
increased
significantly
to
provide
reliable
strength
at
strains
of up to
0.008-
0.010
for
190
mm
high
masonry
blocks confined
in
each
bed
joint
and
higher
for
90 mm high
masonry blocks confined
at
each bedjoint.
UI
a
q)
l-
a
-20
-
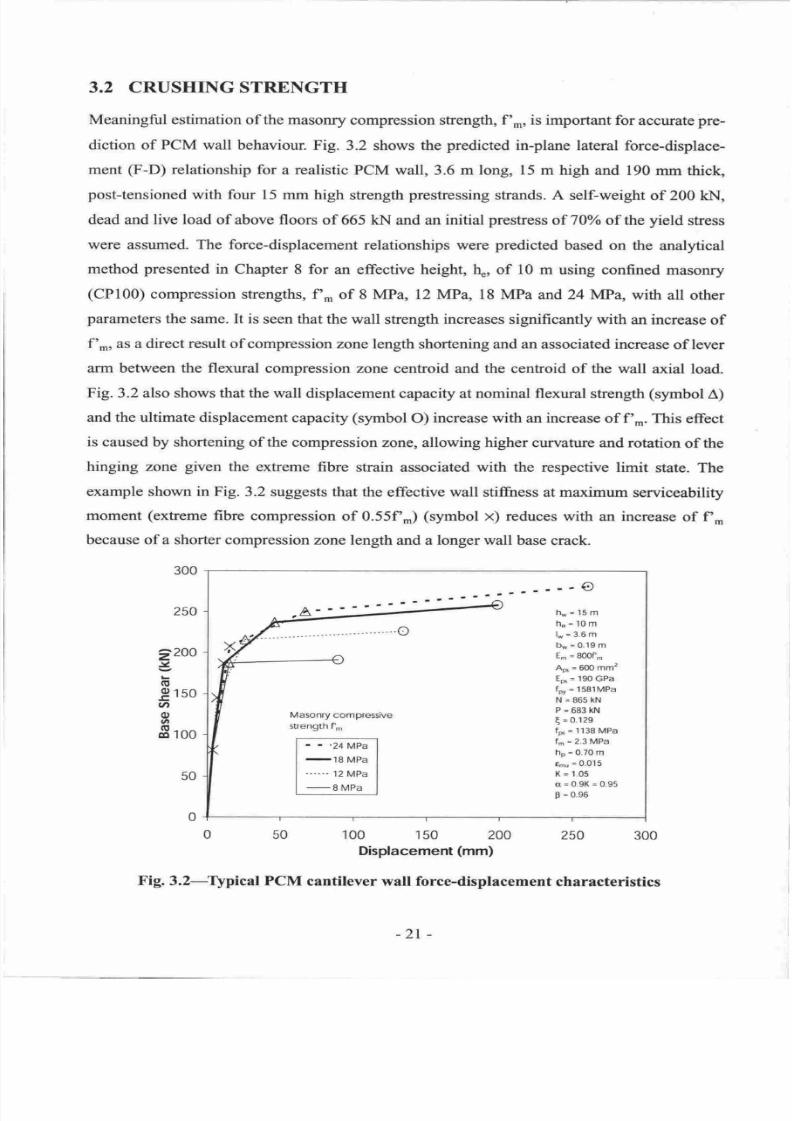
7/21/2019 PHD Laursen-masonry Prestressed Walls
http://slidepdf.com/reader/full/phd-laursen-masonry-prestressed-walls 47/308
3.2 CRUSHING
STRENGTH
Meaningful
estimation of the masonry
compression strength, f',n, is important
for
accurate
pre-
diction
of
PCM
wall
behaviour.
Fig.
3.2 shows the
predicted
in-plane lateral
force-displace-
ment
(F-D)
relationship
for
a
realistic PCM
wall,
3.6
m long,
15
m
high and
190
mm thick,
post-tensioned
with four 15
mm high
strength
prestressing
strands. A
self-weight
of 200 kl.l,
dead
and live load of
above
floors
of
665 kN and
an
initial
prestress
of
70Yo
of
the
yield
stress
were assumed. The force-displacement
relationships
were
predicted
based on the
analytical
method
presented
in
Chapter
8
for
an
effective
height,
tL,
of
10
m
using confined
masoffy
(CPl00)
compression
strengths,
fn'
of
8 MPa,
12 MPa, 18
MPa and24 MPa,
with
all
other
parameters
the
same.
It
is
seen
that
the
wall
strength
increases
significantly with
an
increase
of
f'r,
as a
direct result of
compression zone
length shortening
and an
associated increase
of lever
arm between
the flexural
compression
zone centroid and the cenfioid
of
the
wall
axial load.
Fig. 3.2
also
shows
that
the
wall
displacement
capacity
at
nominal
flexural
strength
(symbol
A)
and the
ultimate
displacement
capacity
(symbol
O)
increase
with
an increase
of
f'-. This
effect
is
caused
by shortening
of
the
compression
zone,
allowing higher curvature
and
rotation
of
the
hinging zone
given
the extreme
fibre
strain associated
with the
respective
limit
state. The
example shown
in
Fig.
3.2
suggests
that the
effective
wall
stiffness
at
maximum serviceability
moment
(extreme
fibre
compression
of
0.55fl, )
(symbol
x)
reduces
with
an increase
of fl*
because
of
a
shorter
compression
zone
lenglh
and a
longer
wall
base
crack.
300
250
o
.a'
h*=15m
he=10m
l*=3.6m
b*
=
0.19 m
E.
=
80Of-
Ap
=
600 mm2
Ep
=
190 GPa
fpy
=
l58lMPa
N=865kN
P=683kN
E
=
0.129
fp
=
1138 MPa
f.
=
2.3
MPa
hp
=
o,7o
m
tmu
=
0 015
K
=
r,05
a=0.9K=0.95
p
=
0.e6
Masonry compressive
strength f'-
50
100
150 200 250
300
Displacement
(mm)
Fig.
3.2-Qpical PCM
cantilever
wall
force.displacement
characteristics
22oo
J
o
g
150
tn
o
in
E
roo
50
-2t
-
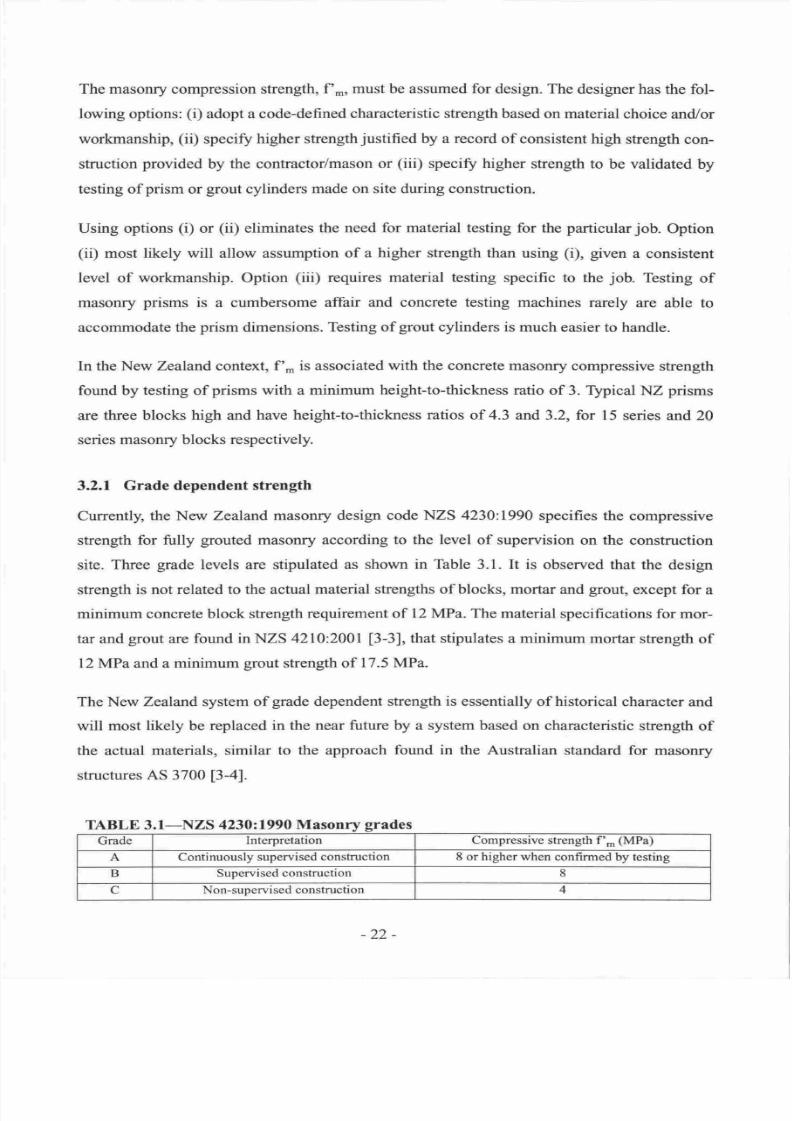
7/21/2019 PHD Laursen-masonry Prestressed Walls
http://slidepdf.com/reader/full/phd-laursen-masonry-prestressed-walls 48/308
The
masonry
compression
strength,
f *,
must
be
assumed
for design. The
designer
has
the
fol-
lowing
options:
(i)
adopt
a
code-defined
characteristic strength
based
on
material
choice
and/or
workmanship,
(ii)
specifu higher
strength
justified
by
a
record
of
consistent
high
strength con-
struction provided
by
the
contractor/mason
or
(iii)
specify higher
strength
to
be
validated
by
testing of
prism
or
grout
cylinders
made
on site
during
construction.
Using
options
(i)
or
(ii)
eliminates
the
need
for
material
testing
for
the
particular
job.
Option
(ii)
most
likely will allow
assumption
of
a
higher
strength
than using
(i),
given
a
consistent
level
of
workmanship.
Option
(iii)
requires
material testing
specific to
the
job.
Testing
of
masonry
prisms
is
a
cumbersome
aflair
and
concrete
testing
machines
rarely
are
able
to
accommodate the
prism
dimensions. Testing
of
grout
cylinders
is much
easier
to
handle.
In the New
Zealand
context,
f n
is
associated
with
the concrete
masonry compressive
strength
found by testing of
prisms
with
a minimum
height-to-thickness
ratio
of
3.
Typical
NZ
prisms
are three blocks
high
and
have height-to-thickness
ratios
of 4.3
and3.2, for
15
series
and20
series
masoffy
blocks
respectively.
3.2.1
Grade
dependent
strength
Currently,
the New Zealand
masoffy
design code
NZS
4230:1990
specifies the
compressive
strength
for fully
grouted
masoffy
according
to the
level
of
supervision
on
the construction
site.
Three
grade
levels
are
stipulated
as shown
in
Table
3.1.
It is
observed that
the
design
strength is not
related
to the
actual
material strengths of blocks, mortar
and
grout,
except
for
a
minimum concrete block strength
requirement
of l2
MPa. The material
specifications
for
mor-
tar
and
grout
are
found in
NZS
4210:2001
[3-3],
that stipulates
a
minimum
mortar
strength
of
12
MPa
and
a
minimum
grout
strength
of
17.5
MPa.
The New
Zealand system
of
grade
dependent strength
is
essentially
of
historical
character
and
will
most
likely
be
replaced
in
the
near future
by
a system
based
on characteristic
strength
of
the
actual
materials,
similar to
the
approach
found
in
the Australian
standard
for
masonry
structures
AS 3700
t3-41.
TABLE
3.1-NZS
423021990
Mason
Compressive
strength
f *
(MPa)
8
or higher when confirmed
by testing
Supervised
construction
Non-supewised
construction
-22-
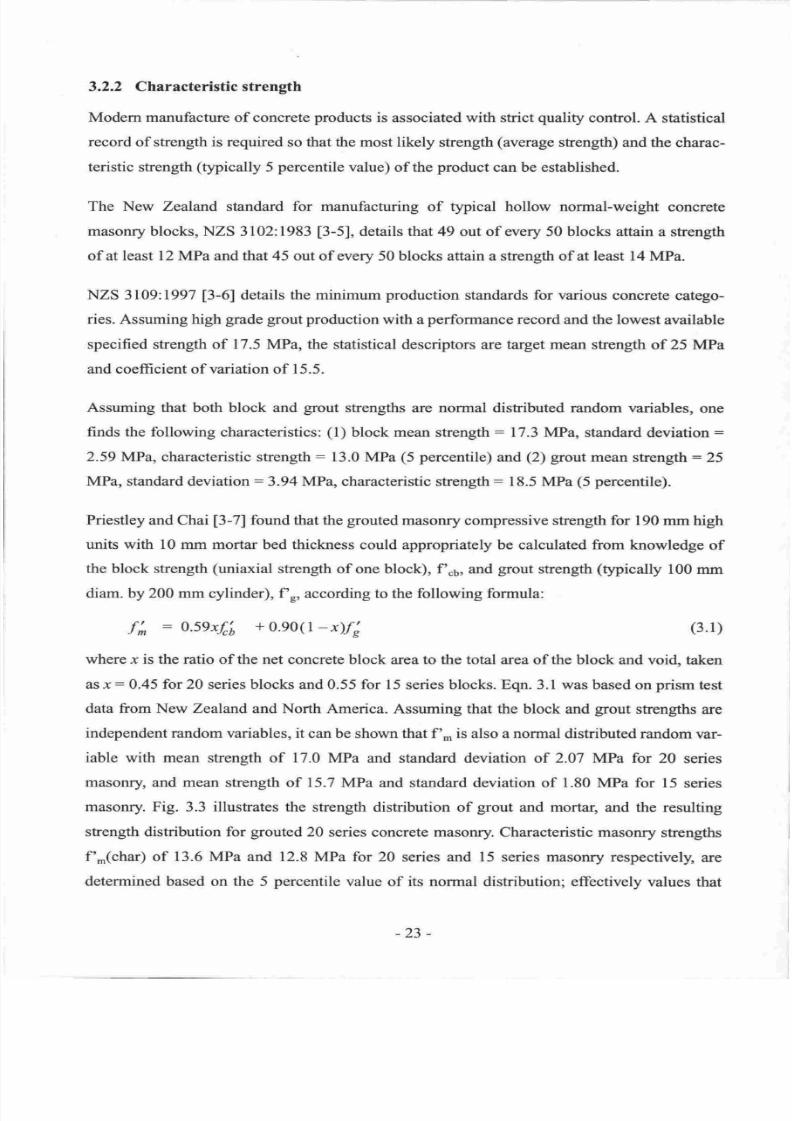
7/21/2019 PHD Laursen-masonry Prestressed Walls
http://slidepdf.com/reader/full/phd-laursen-masonry-prestressed-walls 49/308
3,2,2
Characteristic strength
Modem manufacture of
concrete
products
is
associated with
strict
quality
control.
A
statistical
record
of strength
is required
so
that the most likely
strength
(average
sfength)
and
the
charac-
teristic
strength
(typically
5
percentile value)
of
the
product
can be established.
The New
Zealand
standard
for
manufacturing
of typical hollow
normal-weight
concrete
masonry
blocks,
NZS
3102:1983
[3-5],
details
that
49 out
of wery
50 blocks attain
a
strength
of at least
l2
MPa
and
that 45 out
of every
50
blocks attain
a
strength of at least
14
MPa.
NZS
3109:1997
[3-6]
details
the minimum
production
standards
for
various concrete
catego-
ries. Assuming high
grade
grout production
with
a
performance
record
and
the lowest
available
specified strength
of 17.5
MPa, the statistical
descriptors are target mean
strength
of
25 MPa
and
coefficient of variation
of 15.5.
Assuming that
both
block
and
grout
strengths
are
normal
distributed random variables,
one
finds
the
following
characteristics:
(l)
block mean
strength
:
17.3
MPa,
standard
deviation
:
2.59
MPa, characteristic strength
:
13.0
MPa
(5 percentile)
and
(2) grout
mean
strength:25
MPa,
standard
deviation
:3.94
MPa,
characteristic
strength:
18.5
MPa
(5
percentile).
Priestley
and
Chai
[3-7]
found that
the
grouted
masonry compressive strength
for
190
mm high
units
with 10
mm mortar
bed thickness could appropriately be calculated from
knowledge
of
the
block strength
(uniaxial
strength
of
one
block), f' 6,arrd
grout
strength
(typically
100
mm
diam. by 200 mm cylinder), f'n,
according to the
following
formula:
f;
:
0.59xf,'6
+
0.90(1
-*)fi
(3.1)
where
x is
the
ratio
of
the net concrete
block
area
to
the
total
area
of
the
block
and
void,
taken
as .r
:
0.45
for
20
series
blocks
and
0.55 for
l5
series
blocks. Eqn. 3.1
was
based
on
prism
te
st
data
from
New Zealand and North America.
Assuming that
the block and
grout
strengths
are
independent
random variables, it
can be
shown that
f'*
is
also
a
normal distributed random
var-
iable
with
mean
strength of 17.0 MPa
and standard deviation
of
2.07
MPa for
20 series
masonry, and mean strength
of
15.7 MPa and
standard
deviation
of
1.80
MPa
for
15
series
masonry.
Fig.
3.3 illustrates
the strength distribution
of
grout
and mortar, and the
resulting
sfength
distribution
for
grouted
20
series
concrete masonry.
Characteristic
masonry strengths
f',o(char)
of 13.6
MPa
and 12.8
MPa
for
20
series
and
15
series
masonry respectively,
are
determined based on the
5
percentile
value
of
its normal distribution; effectively
values
that
-23
-
7/21/2019 PHD Laursen-masonry Prestressed Walls
http://slidepdf.com/reader/full/phd-laursen-masonry-prestressed-walls 50/308
s
t,
510
3
CT
E
l
15 20
25
Compre*sion Stength
(MPa)
Fig.3.}-Statistical
compressiye
strength
distribution,20
series
concrete
masonry
can
safely be
specified for
supervised
constnrction
in New Zealand
without any
need
for
mate-
rial testing.
Eqn. 3.1 also
provides
a
method
for verification
of
f'n,
using the characteristic
block
strength
provided
by
ttre
manufacturer
in
conjunction
with
the characteristic
grout
strength found
by
cylinder
testing. Using
Eqn.
3.1
in
this
way,
it
was recorlmended
[3-7]
to
apply a
strength
reduction
factor of 0.75 to
derive
a
lower-bound value.
3.2.3
Experimental data
The experimental
data presented here
was
recorded
in
conjunction
with
PCM
wall
testing
at
the University
of
Auckland.
Results
from testing of unconfined
and
confined
grouted
concrete
masonry
were taken from wall test Series
I
and2
described in
Chapters
5 and
6.
Thble 3.2
shows the
average
strength
of unconfined masonry
prisms,
grout
and mortar
meas-
ured
for 10
wall
tests.
Generally,
three
prisms, three
mortar
cylinders
and
three
grout
cylinders
were
tested for each wall. Prism construction
was
performed
by registered masons
using
stand-
ard
140
mm
precast
grey
hollow
core concrete
blocks
that were
provided by
a
range
of
manu-
facturers.
The
blocks were filled
with
standard
17.5
MPa
target
strength
grout.
Prior
to
grouting,
SIKA
CAVEXTM shrinkage
compensating agent was
added
to the
grout.
All
test cyl-
inders
were
100
mm
diam.
and
200 mm
high.
-24
-
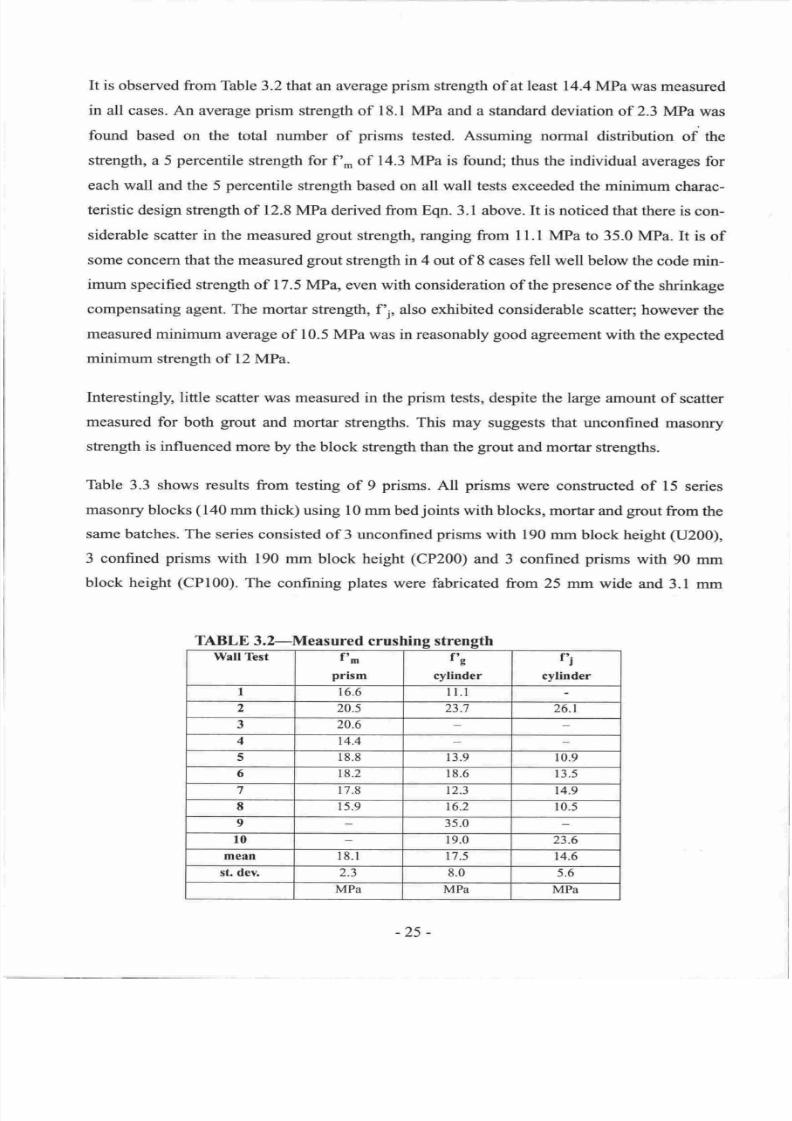
7/21/2019 PHD Laursen-masonry Prestressed Walls
http://slidepdf.com/reader/full/phd-laursen-masonry-prestressed-walls 51/308
It
is observed
from
Table
3.2
that an average
prism
strength
of
at least
14.4
MPa
was
measured
in
all
cases. An average
prism
strength
of
l8.l MPa and
a
standard
deviation
of
2.3
MPa
was
found
based
on the total
number
of
prisms
tested. Assuming
normal
distribution
of
the
strength,
a
5
percentile
strength
for
f -
of
14.3
MPa is found;
thus
the
individual
averages
for
each
wall and
the 5
percentile
strength
based
on
all
wall tests exceeded
the
minimum
charac-
teristic
design strength
of 12.8
MPa derived from Eqn. 3.1
above.
It
is noticed
that
there
is con-
siderable scatter
in
the
measured
grout
strength, ranging
from
11.1 MPa to
35.0
MPa.
It
is
of
some
concem
that
the measured
grout
strength in 4 out
of
8
cases
fell well below
the
code
min-
imum
specified
strength
of
17.5
MPa,
even
with
consideration of
the
presence
of the
shrinkage
compensating agent.
The mortar strength,
f .;, also exhibited considerable
scatter; however
the
measured
minimum
average
of
10.5
MPa was in reasonably good agreement
with
the expected
minimum strength
of
12
MPa.
Interestingly,
little
scatter
was measured
in the
prism
tests,
despite the large
amount
of
scatter
measured
for
both
grout
and
mortar
strengths.
This may
suggests
that unconfined
masonry
strength is inlluenced
more by
the block strength
than
the
grout
and
mortar
strengths.
Table
3.3 shows results
from
testing
of
9
prisms.
All
prisms
were
constnrcted
of
15 series
masonry blocks
(140
mm thick)
using
10
mm
bed
joints
with
blocks, mortar
and
grout
from the
same
batches.
The series
consisted
of 3 unconfined
prisms
with 190
mm block height
(U200),
3
confined
prisms
with
190
mm
block
height
(CP200)
and
3
confined
prisms
with
90 mm
block height
(CPl00).
The
confining
plates
were fabricated
from
25 mm
wide
and 3.1
mm
ABLE
3.2-Measured
cru
Wall
Test
ft
m
prism
frg
cylinder
fi
cylinder
I 16.6
I
l.l
2
20.5 23.7 26.1
3 20.6
4
t4.4
5
I8.8
13.9
0.9
6 18.2
t
8.6
3.5
7
17.8
t2.3
4.9
E 15.9
t6.2
0.5
9
35.0
l0
19.0
23.6
mean 18.l
t7.5
14.6
st. dev.
2.3
8.0
5.6
MPa
MPa
MPa
-25
-
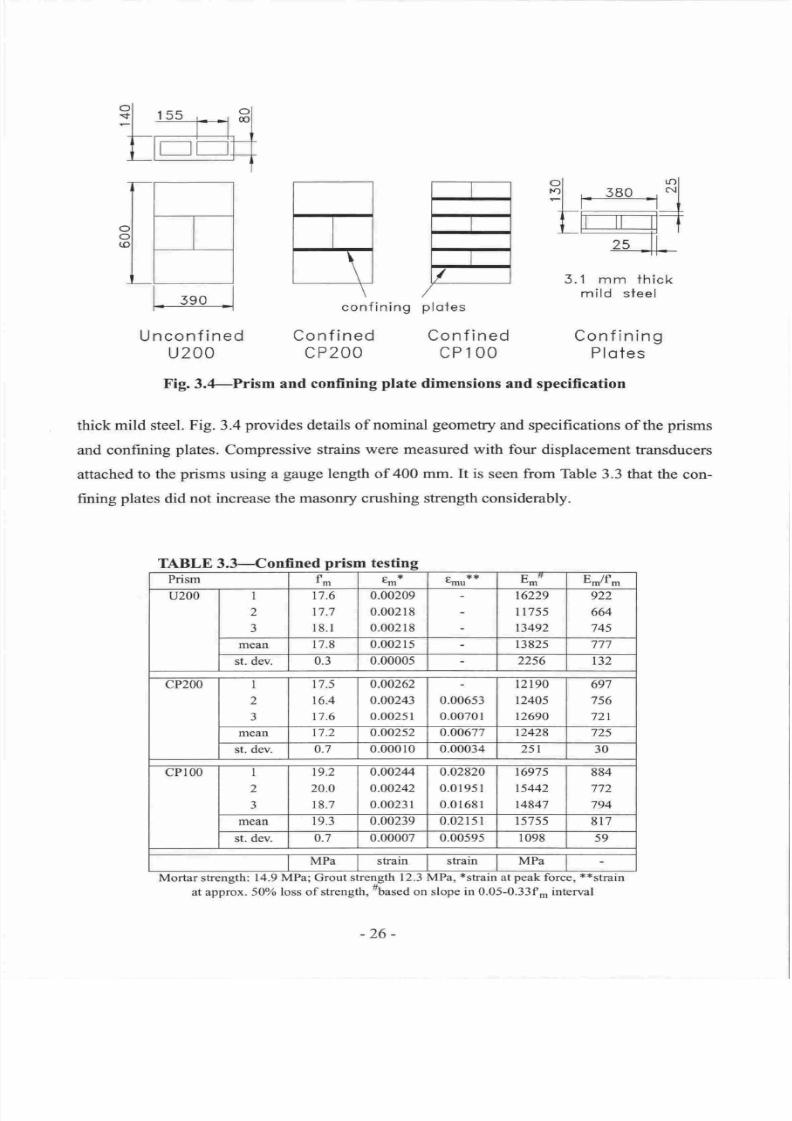
7/21/2019 PHD Laursen-masonry Prestressed Walls
http://slidepdf.com/reader/full/phd-laursen-masonry-prestressed-walls 52/308
El
,
s8o
-{
Kl
l_l
rl
lr--lT-tl-l
-
,5
ll
-'n<-
nconf
ined
u200
Fig.3.4-Prism
conf ining
Conf
ined
CP2OO
and
confining
plate
plotes
Conf
ined
CP1
OO
3.1 mm
thick
mild
steel
Conf inin
g
Plotes
dimensions and specification
thick
mild steel.
Fig. 3.4
provides
details of nominal
geometry
and
specifications
of the
prisms
and confming
plates.
Compressive
strains
were measured
with
four
displacement
transducers
attached
to the
prisms
using
a
gauge
length of 400 mm. It is
seen
from
Table 3.3 that the
con-
fining
plates did
not
increase the
masonry crushing strength considerably.
TABLE
3.3-Confined
prism
testing
Prism
fm
e**
c**
Ynu
E-*
Em/fm
u200
I
2
3
7.6
7.7
8.1
0.00209
0.00218
0.00218
6229
1755
3492
922
664
745
mean
7.8 0.00215 382s 777
st.
dev. 0.3
0.0000s
2256
t32
CP2OO
t
2
3
t7.5
t6.4
t7.6
0.00262
0.00243
0.00251
0.00653
0.00701
2190
2405
2690
697
756
72r
mean
t7.2 0.00252
0.0067't 2428
725
st.
dev.
o.7 0.00010
0.00034 251
30
cPl00
I
2
J
t9.2
20.0
18.7
0.002M
0.00242
0.00231
0.02820
0.0 195
I
0.01681
t6975
ts442
14847
884
772
794
mean
19.3 0.00239 0.02151 15755
817
st.
dev. 0.7
0.00007 0.00595 1098
59
MPa
strain
strain
MPa
Mortar strength:
14.9
MPa; Grout
strength 12.3
MPa,
*strain
at
peak
force,
**strain
at
approx. 50
loss
ofstrength,
Fbased
on slope
in 0.05-0.33f*
interval
-26 -
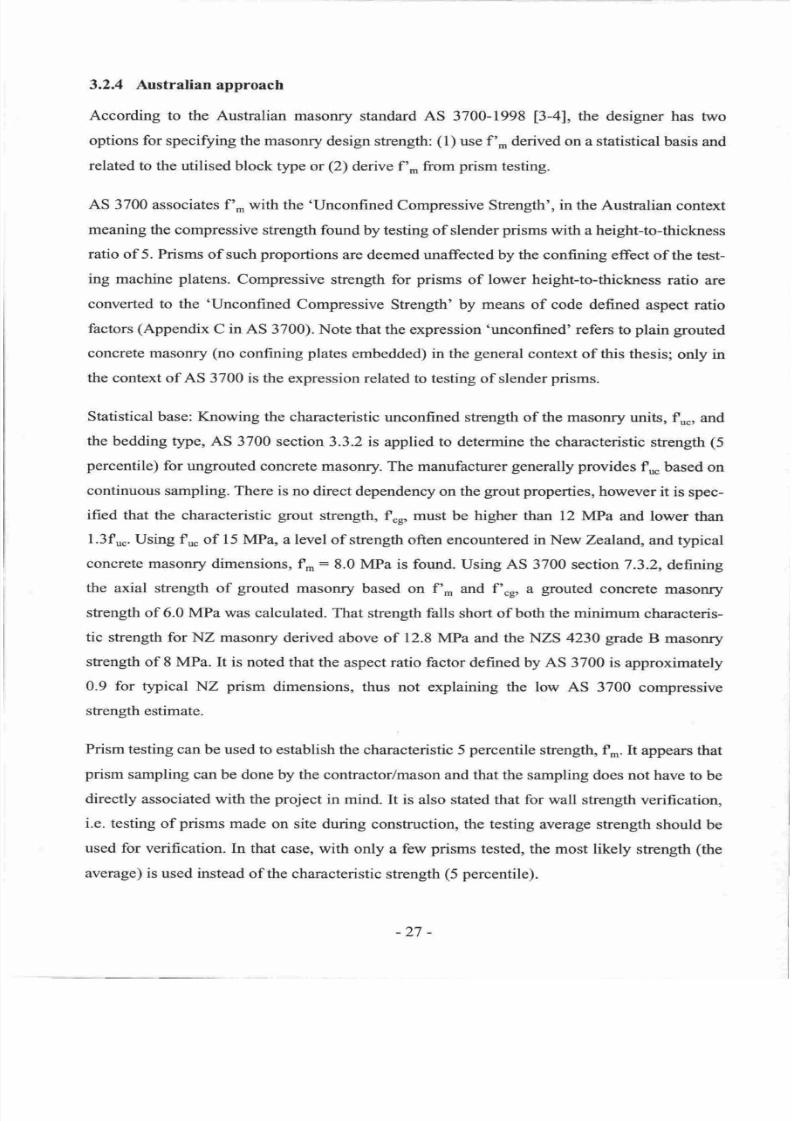
7/21/2019 PHD Laursen-masonry Prestressed Walls
http://slidepdf.com/reader/full/phd-laursen-masonry-prestressed-walls 53/308
3.2.4
Australian
approach
According
to the
Australian
masonry
standard
AS 3700-1998
[3-4],
the
designer
has two
options for
specifying
the
masonry
design
strength:
(l)
use f',
derived
on
a
statistical basis and
related
to
the
utilised block
type
or (2)
derive
f'n'
from prism
testing.
AS
3700
associates
f''n with the
'Unconfined
Compressive
Sfrength',
in
the
Australian
context
meaning
the
compressive
strength found
by testing of
slender
prisms
with
a
height+o-thickness
ratio
of 5.
Prisms
of
such
proportions
are
deemed
unaffected
by the
confining effect
of
the
test-
ing machine
platens.
Compressive
strength
for
prisms
of
lower height-to-thickness
ratio
are
converted
to
the
oUnconfined
Compressive
Strength'
by
means
of code defined
aspect ratio
factors
(Appendix
C
in AS
3700). Note that the expression
'unconfined'
refers to
plain
grouted
concrete
masonry
(no
confining
plates
embedded)
in the
general
context
of
this
thesis;
only
in
the
context
of
AS 3700 is
the expression related
to testing of slender
prisms.
Statistical
base:
Knowing the
characteristic
unconfined strength of the masonry
units,
fu ,
and
the bedding
type, AS 3700
section
3.3.2
is
applied
to
determine the characteristic
strength
(5
percentile)
for
ungrouted concrete
masonry.
The manufacturer
generally provides
f* based
on
continuous sampling. There
is
no
direct
dependency
on
the
grout properties, however
it
is
spec-
ified
that the characteristic
grout
strength, f r, must be higher than 12
MPa
and lower
than
[.3fu .
Using fu
of l5
MPa,
a
level
of strength often
encountered
in New Zealand,
and
typical
concrete masoffy
dimensions, f,
:
8.0 MPa
is found. Using AS 3700 section
7.3.2,
defining
the
axial
strength
of
grouted
masonry
based on f',
and
f'.*,
a
grouted
concrete
masonry
sfength of 6.0 MPa was
calculated. That strength
falls short of both the minimum
characteris-
tic
strength for
NZ
masonry
derived above
of
12.8
MPa
and
the
NZS
4230
grade
B
masonry
strength
of
8
MPa.
It
is noted that the
aspect
ratio factor
defined by
AS
3700
is approximately
0.9 for typical
NZ
prism
dimensions,
thus
not
explaining
the low AS
3700
compressive
stength
estimate.
Prism testing
can
be used
to establish
the
characteristic
5
percentile
strength,
f-. It
appears
that
prism
sampling
can be done
by the contractor/mason
and
that the
sampling
does
not
have
to
be
directly
associated
with
the
project
in
mind. It is
also
stated
that
for wall strength
verification,
i.e. testing
of
prisms
made
on
site
during
construction, the testing
average
strength
should
be
used for
verification.
In
that
case, with
only a few
prisms
tested, the most
likely
strength
(the
average) is
used
instead
ofthe
characteristic
strength
(5
percentile).
-27
-
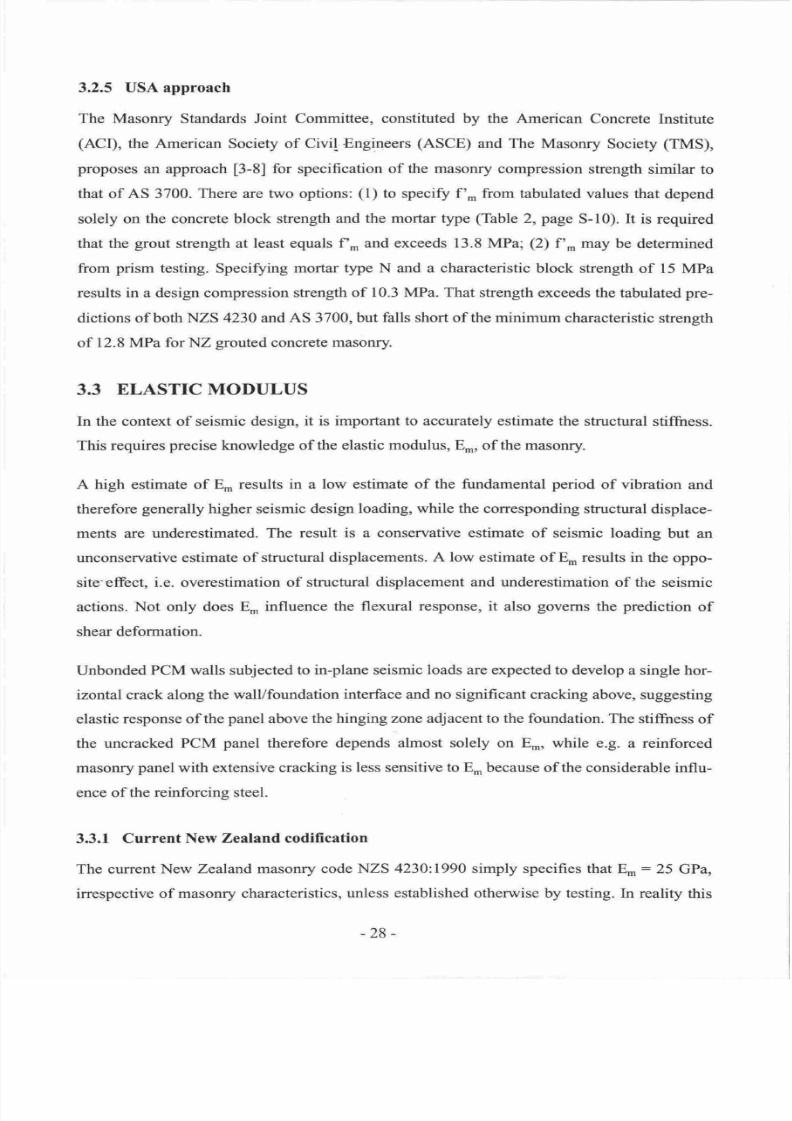
7/21/2019 PHD Laursen-masonry Prestressed Walls
http://slidepdf.com/reader/full/phd-laursen-masonry-prestressed-walls 54/308
3.2.5
USA approach
The
Masonry
Standards
Joint
Committee,
constituted
by
the
American
Concrete
Institute
(ACD,
the American Society
of Civi
Engineers
(ASCE)
and The Masonry
Society
(TMS),
proposes
an
approach
[3-8]
for
specification
of
the masonry
compression strength
similar
to
that
of
AS
3700. There
are
two options:
(l)
to
specify
f',
from
tabulated values
that
depend
solely
on the
concrete
block
strength
and the
mortar
type
(Table
2,page
S-10).
It
is
required
that the
grout
strength at
least equals
f,n
and exceeds 13.8
MPa;
(2)
f'^may
be detennined
from
prism testing.
Specifying mortar
type
N
and a characteristic
block strength
of
15 MPa
results
in
a
design
compression strength
of 10.3
MPa. That
strength
exceeds the
tabulated
pre-
dictions of both NZS
4230
and
AS
3700,
but
falls short
of the minimum characteristic
strength
of
12.8
MPa for
NZ
grouted
concrete
masonry.
3.3
ELASTIC
MODTJLUS
In
the context
of
seismic
design,
it
is important to accurately
estimate
the stmctural
stiffiress.
This
requires
precise
knowledge
of the elastic modulus,
E,o,
of the masoffy.
A high
estimate
of
En,
results
in
a
low estimate of
the fundamental
period
of vibration
and
therefore
generally
higher seismic
design loading,
while
the corresponding
structural
displace-
ments are
underestimated.
The result
is
a
conservative estimate
of
seismic loading
but an
unconservative estimate of
structural displacements.
A
low estimate
of
E,n
results in
the oppo-
site'effect,
i.e. overestimation
of struchrral
displacement
and
underestimation
of
the
seismic
actions.
Not only
does
E-
influence
the flexural
response,
it
also
governs
the
prediction
of
shear
deformation.
Unbonded
PCM walls subjected to
in-plane seismic
loads
are
expected
to
develop a single
hor-
izontal crack along
the wall/foundation
interface
and
no significant cracking
above,
suggesting
elastic
response
of
the
panel
above the
hinging
zone adjacent
to the foundation.
The stiffiress
of
the
uncracked
PCM
panel
therefore depends
almost solely
on
E,n,
while
e.g. a reinforced
masonry
panel
with extensive
cracking
is
less
sensitive
to En.,
because
of
the
considerable
influ-
ence
of
the reinforcing
steel.
3.3.1
Current
New Zealand codification
The current New
Zealand masonry code
NZS
4230:1990 simply specifies that
E.o
:25
GPa,
irrespective
of
masonry characteristics,
unless established otherwise by testing.
In
reality
this
-28 -
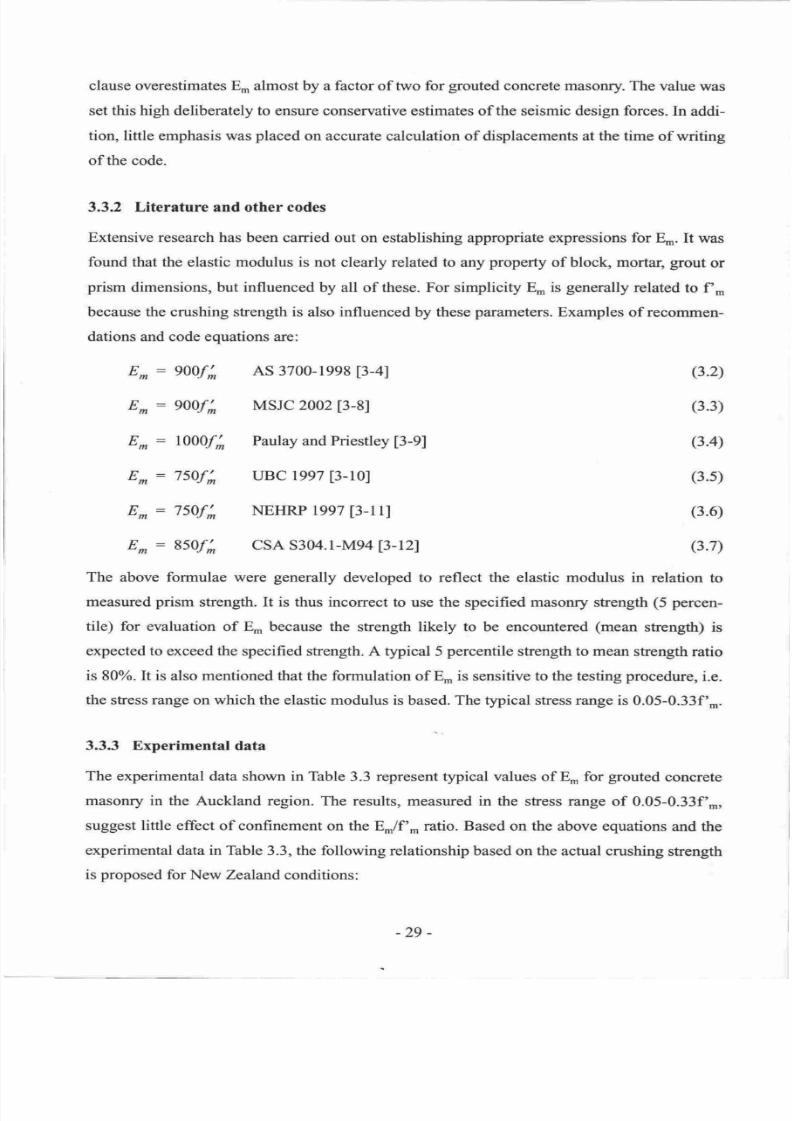
7/21/2019 PHD Laursen-masonry Prestressed Walls
http://slidepdf.com/reader/full/phd-laursen-masonry-prestressed-walls 55/308
clause
overestimates
Em
almost
by
a factor
of two for
grouted
concrete masoffy. The
value
was
set
this high
deliberately
to
ensure
conservative estimates of the seismic design forces.
In
addi-
tion,
little
emphasis
was
placed
on accurate calculation
of
displacements
at
the time
of
writing
of
the
code.
3.3.2 Literature
and other
codes
Extensive
research has been
carried
out on establishing appropriate expressions for
E*. It
was
found that the elastic modulus is
not clearly related to any
property
of block, mortar,
grout
or
prism
dimensions, but
influenced
by
all
of
these.
For simplicity
En., is
generally
related
to f',
because
the crushing strength is
also
influenced
by
these
parameters.
Examples
of recommen-
dations
and code
equations
are:
E,
:
900f;
E^:
900f;
AS 3700-1998
[3-4]
MSJC 2002
[3-81
(3.2)
(3.3)
(3.4)
(3.5)
(3.6)
(3.7)
E^
:
1000f
;
Paulay
and
Priestley
[3-9]
E^
:
7s0f; UBC 1997
[3-10]
E,
=
750f
;
NEHRP 1997
[3-l
l]
E^
:
850f; CSA S304.1-M94
[3-12]
The above formulae were
generally
developed
to
reflect the elastic
modulus
in
relation
to
measured
prism
strength.
It
is
thus incorrect to use the specified masonry strength
(5
percen-
tile) for
evaluation
of
E*
because the
strength
likely to
be
encountered
(mean
strength) is
expected
to
exceed
the specified strength.
A
typical
5
percentile
strength
to
mean
shength ratio
is 80 .
It
is
also
mentioned that the formulation
of
En'
is sensitive to the testing
procedure,
i.e.
the stress
range
on
which
the
elastic modulus
is
based.
The
typical
stress
range is
0.05-0.33f'-.
3.3.3 Experimental
data
The
experimental data
shown
in
Table 3.3
represent
typical
values of
E. for
grouted
concrete
masonry in
the Auckland region.
The results, measured
in
the
stress
range
of
0.05-0.33f,o,
suggest
little
effect
of
confinement
on
the
E./f',
ratio.
Based
on
the above equations and the
experimental
data
in Table 3.3, the
following
relationship
based
on
the
actual crushing
strength
is
proposed
for New Zealand conditions:
-29
-
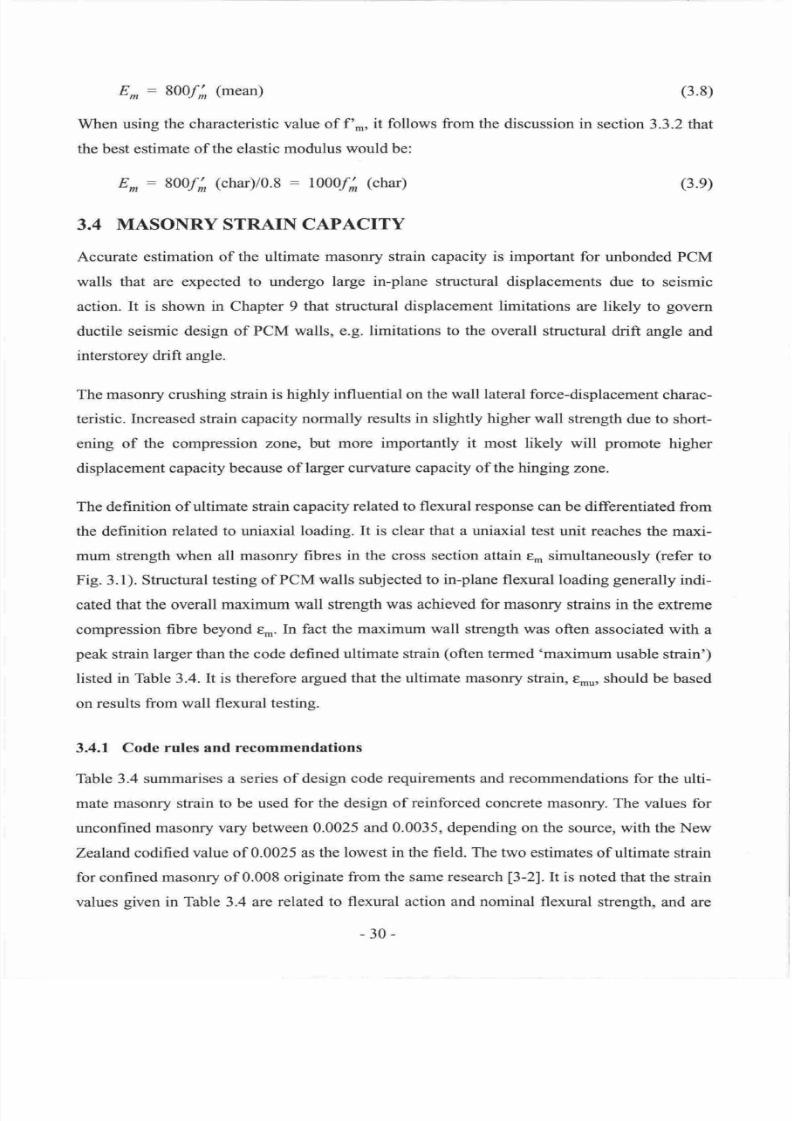
7/21/2019 PHD Laursen-masonry Prestressed Walls
http://slidepdf.com/reader/full/phd-laursen-masonry-prestressed-walls 56/308
E.
:
800f;
(mean)
(3.8)
When
using the characteristic
value
of
f ., it follows
from
the
discussion
in
section
3.3.2
that
the
best
estimate of
the elastic modulus would
be:
E,
:
800f
;
(char)/O.8
:
1000f;
(char)
3.4
MASONRY STRAIN CAPACITY
(3.e)
Accurate
estimation
of
the ultimate
masonry strain capacity
is
important
for
unbonded PCM
walls
that
are
expected
to
undergo
large
in-plane structural
displacements
due to
seismic
action.
It
is
shown
in
Chapter
9
that
structural
displacement
limitations
are
likely to
govern
ductile
seismic design
of
PCM walls,
e.g.
limitations to
the overall structural
drift
angle
and
interstorey
drift angle.
The masonry
crushing
strain
is highly
influential
on
the wall
lateral
force-displacement
charac-
teristic.
lncreased strain capacity
normally results
in slightly
higher
wall
strength
due
to short-
ening of
the
compression zone,
but
more importantly it most likely
will
promote
higher
displacement
capacity
because of
larger curvature capacity of the
hinging
zone.
The
definition
of
ultimate strain capacity
related to flexural
response
can be
differentiated
from
the definition
related to
uniaxial
loading.
It
is clear that
a
uniaxial
test
unit reaches
the maxi-
mum
strength
when
all
masonry
fibres
in
the cross section attain e,n
simultaneously
(refer
to
Fig. 3.1).
Structural testing
of
PCM walls subjected to
in-plane
flexural loading
generally
indi-
cated
that
the
overall
maximum
wall
strength was achieved
for
masonry
strains in
the extreme
compression
fibre
beyond
er.
In
fact the maximum
wall
strength was
often
associated with
a
peak
strain
larger
than
the
code
defined ultimate strain
(often
termed
omaximum
usable
strain )
listed in Table
3.4.It
is
therefore
argued
that the
ultimate
masonry
strain,
e-u, should be
based
on results
from
wall
flexural testing.
3.4.1
Code
rules
and
recommendations
Table 3.4
summarises a
series of
design
code requirements
and
recommendations
for
the
ulti-
mate
masonry strain to be
used
for
the design
of
reinforced concrete masonry.
The values
for
unconfined
masonry
vary
between 0.0025
and
0.0035, depending on the source,
with
the
New
Zealand
codified
value
of 0.0025
as
the
lowest in the field. The
two
estimates
of ultimate strain
for confined
masonry
of
0.008
originate from
the
silne
research
[3-2].
It
is noted
that
the
strain
values
given
in
Table
3.4 are
related
to flexural
action and nominal
flexural
strength, and
are
-30-
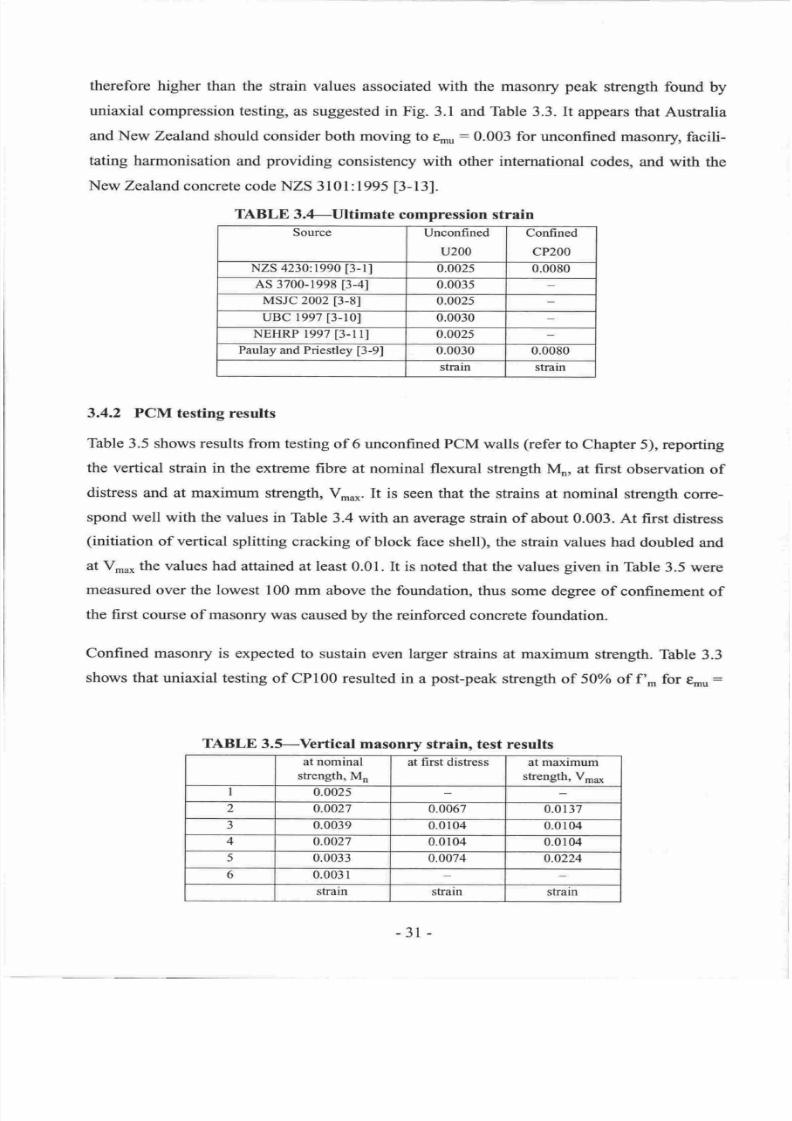
7/21/2019 PHD Laursen-masonry Prestressed Walls
http://slidepdf.com/reader/full/phd-laursen-masonry-prestressed-walls 57/308
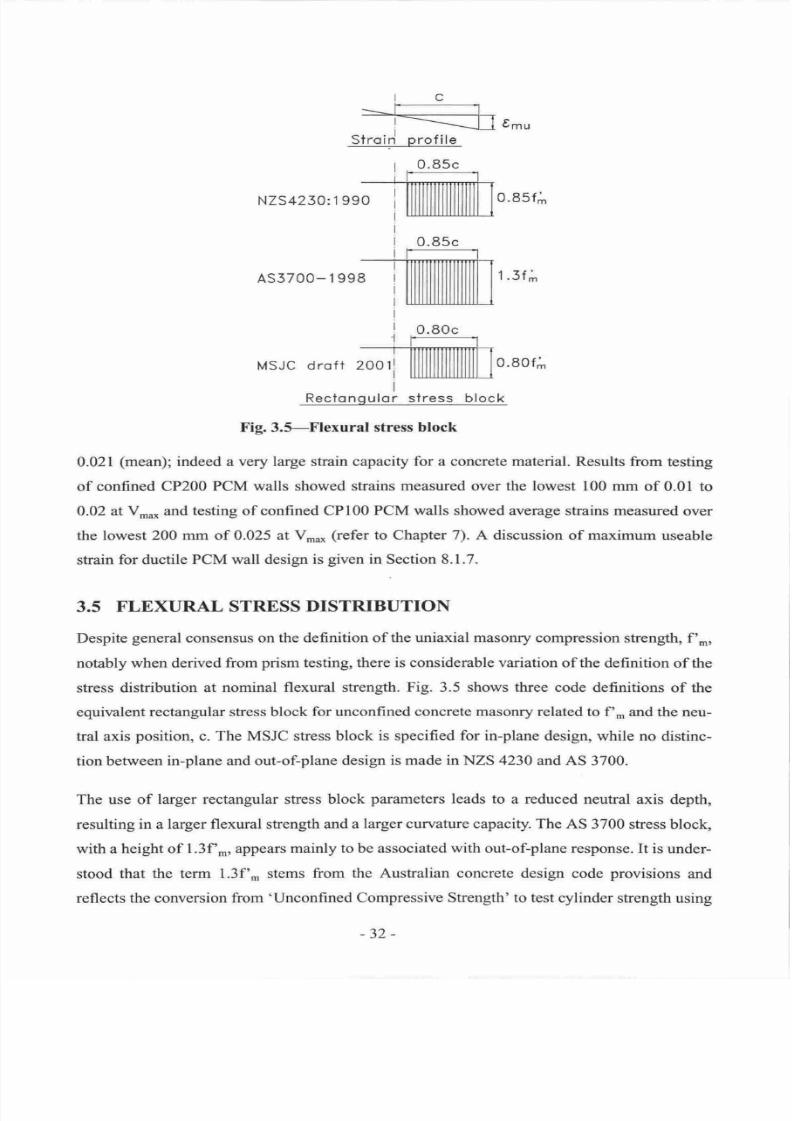
7/21/2019 PHD Laursen-masonry Prestressed Walls
http://slidepdf.com/reader/full/phd-laursen-masonry-prestressed-walls 58/308
6mu
Stroiri
prof
ile
NZS4230:1
990
0.85f;
0.85c
AS5700-
1
998
1.5f
;
MSJC droff
0.80f;
Rectongulor stress block
Fig.
3.S-Flexural
stress
block
0.021
(mean);
indeed
a
very large strain capacity
for
a
concrete
material. Results
from
testing
of
confined CP200
PCM walls
showed strains
measured
over
the
lowest
100
mm of
0.01
to
0.02 at
Vrr and
testing
of
confined CP100
PCM walls showed
average
strains
measured
over
the lowest
200
mm
of
0.025 at
Vn'*
(refer
to
Chapter
7).
A
discussion
of
maximum
useable
strain
for ductile
PCM wall design is
given
in Section
8.1.7.
3.5 FLEXURAL
STRESS
DISTRIBUTION
Despite
general
consensus
on the
definition
of the uniaxial masonry compression
strength, f',.,.,,
notably
when derived
from
prism testing, there is considerable
variation of
the
definition of
the
stress
distribution
at nominal flexural
strength.
Fig. 3.5
shows three
code
definitions
of
the
equivalent
rectangular
stress
block
for unconfined
concrete masonry
related to
f n
and
the neu-
tral
axis
position,
c. The MSJC
stress
block
is
specified
for
in-plane
design, while no
distinc-
tion between
in-plane
and
out-of-plane
design
is
made
in
NZS
4230
and
AS
3700.
The use
of
larger rectangular stress
block
parameters
leads
to
a
reduced
neutral
axis
depth,
resulting in
a
larger
flexural
strength
and a
larger curvature capacity. The
AS
3700
stress
block,
with
a
height
of l.3f'., appears
mainly
to
be associated
with
out-of-plane
response.
It is
under-
stood
that the term 1.3f'.
stems
from
the Australian
concrete design code
provisions
and
reflects
the conversion
from
'Unconfined
Compressive
Strength'
to
test
cylinder
strength using
0.80c
32

7/21/2019 PHD Laursen-masonry Prestressed Walls
http://slidepdf.com/reader/full/phd-laursen-masonry-prestressed-walls 59/308
a height-to-thickness ratio
of
2.
Given the
origin
of
this tenn, the
suitability
of
the
AS
3700
flexural
stess
block
for
limit
state design
of
grouted
concrete masonry is
questionable.
The
American
and
New Zealand
stress
block
parameters
arc comparable,
and
in
reality
predict
sim-
ilar
behaviour.
In-plane testing
of
PCM walls
reported
in
Chapter
5
supports
using
the
NZS
4230
or MSJC definition.
3.6 TI{EORETICAL
STRESS-STRAIN RELATIONSHIP
Further to the
above discussion,
accurate
modelling of
the
concrets masonry constitutive
rela-
tionship is
essential
for
detailed calculation
of
the
global
response
of
PCM
walls
with
unbonded tendons. This
material model
should be of
continuous nature to
allow for
capture
of
the
wall
response
in the service load regime
elastic
response), at
nominal
wall
strength
and
at
large
displacement
response,
including
possible
strength degradation.
The NZ
and
US design
code approaches
for calculation of concrete masonry
response
are
con-
cemed with the
elastic modulus
and
with
the equivalent
rectangular masonry
stress
block
and
associated
ultimate strain capacity
for calculation of nominal
strength.
These
parameters
do
not
provide
sufficient information
for
establishing
the
concrete masonry
constitutive
relationship
because
only
the
initial
elastic
response
and
the nominal flexural
response
are captured.
In
order
to
select
a
suitable constitutive
relationship,
a
literature review
on
concrete
masonry
stress-strain behaviour
was conducted.
Amongst the various research efforts
in
the
past
dec-
ades,
the following two contributions
stand
out:
A
study
by
Drysdale
and
Hamid
[3-14]
considered the behaviour
of
concrete
block
masonry
under
axial compression and
provides
a
good
description of
the masonry
compression
failure
mechanism
in
the context
of
allowable
stress
design. However,
it
does
not offer
essential
infor-
mation
on
critical
sffain
parameters
necessary
for
ultimate strength calculations,
which
are
essential for
capturing the wall ultimate
response, such as
ultimate
stain
capacity
and strength
degradation
characteristics.
A concise formulation
of the stress-strain
relationship
for
concrete
masoffy was
established
by
Priestley
and Elder
[3-2]
in
the
context
of
strength
design. This
relationship,
covering
both
unconfined
and
confined
grouted concrete
masoffy,
was
based
on
prism testing
and
the Kent-
Park
stress-strain curve for
concrete
[3-15].
The Priestley-Elder formulation is
considered
suit-
able for the
present
PCM
wall study
because
it
describes
concrete
masonry
behaviour
under
all
loading
conditions
and
is
based
on
laboratory
testing utilising New Zealand materials.
Addi-
-33-
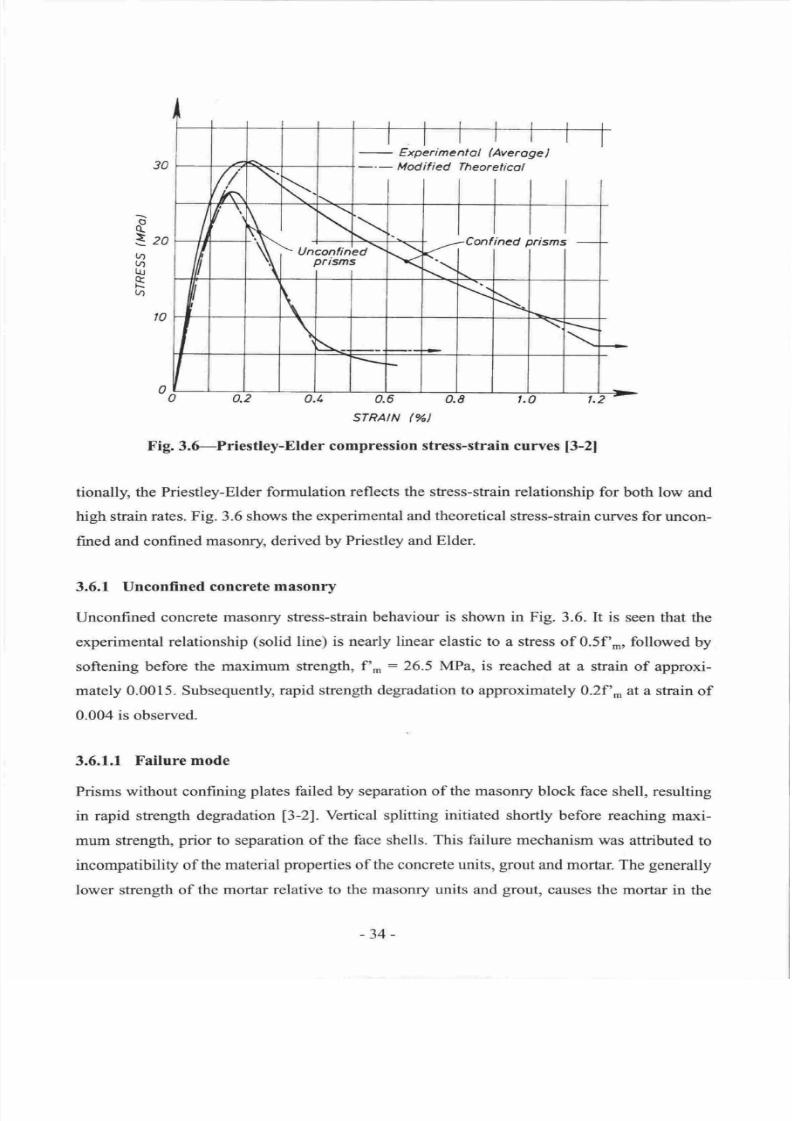
7/21/2019 PHD Laursen-masonry Prestressed Walls
http://slidepdf.com/reader/full/phd-laursen-masonry-prestressed-walls 60/308
o
a-
Izo
vl
t4
trJ
R
tn
Fig. 3,G-Priestley-Elder
compression stress-strain curves
[3-21
tionally,
the
Priestley-Elder
formulation
reflects the stress-strain
relationship
for
both
low
and
high
strain rates.
Fig.
3.6 shows
the
experimental and
theoretical
stress-strain curves
for
uncon-
fined
and confined masonry,
derived by
Priestley and Elder.
3.6.1
Unconfined
concrete
masonry
Unconfined
concrete
masonry
stress-strain
behaviour
is
shown in Fig.
3.6.
It
is
seen
that
the
experimental
relationship
(solid
line)
is nearly linear
elastic to a stress
of 0.5f'*, followed
by
softening before
the maximum
strength,
f', :
26.5 MPa,
is
reached
at
a
strain
of
approxi-
mately
0.0015. Subsequently,
rapid
strength
degradation
to
approximately
0.2f'*
at a strain
of
0.004
is observed.
3.6.1.1 Failure
mode
Prisms without
confining
plates
failed by
separation of the masonry
block
face
shell, resulting
in rapid
strength degradation
l3-zj.Vertical
splitting initiated shortly
before reaching
maxi-
mum
strength,
prior
to separation of
the
face shells.
This
failure
mechanism
was
attributed
to
incompatibility
of
the material
properties
of
the
concrete
units,
grout
and mortar. The generally
lower
strength
of the
mortar
relative
to the masonry
units
and
grout,
causes
the mortar
in
the
qtfined
prisms
STRAIN
I )
-34-
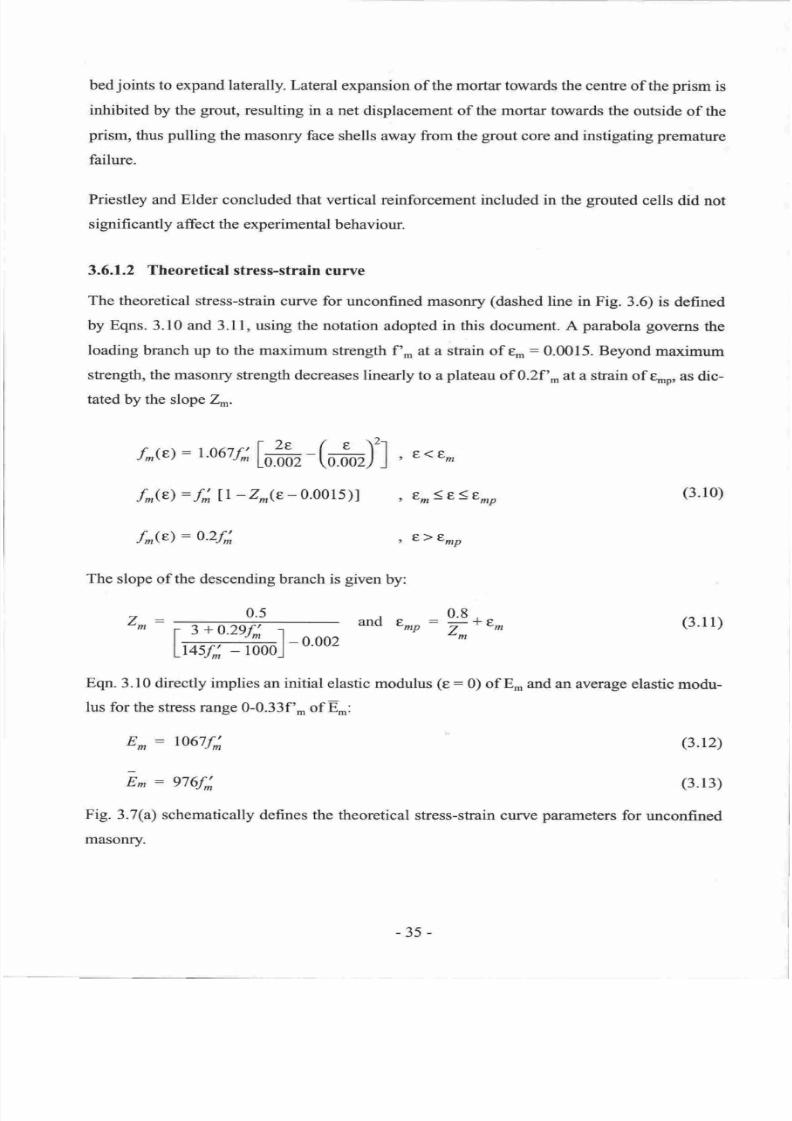
7/21/2019 PHD Laursen-masonry Prestressed Walls
http://slidepdf.com/reader/full/phd-laursen-masonry-prestressed-walls 61/308
bed
joints
to
expand
laterally.
Lateral
expansion
of
the mortar towards the cente
of
the
prism
is
inhibited
by
the grout,
resulting in
a
net
displacement of the
mortar
towards the
outside
of the
prism,
thus
pulling
the
masonry
face
shells
away
from
the
grout
core and
instigating
premature
failure.
Priestley
and
Elder
concluded that
vertical
reinforcement included
in the
grouted
cells did
not
signifi
cantly affect
the
experimental
behaviour.
3.6.1.2 Theoretical
stress-strain
curve
The
theoretical
stress-strain
curye
for unconfined masonry
(dashed
line in Fig.
3.6) is
defined
by
Eqns.
3.10
and
3.1l,
using
the
notation
adopted
in
this
document.
A
parabola governs the
loading
branch
up to
the
maximum
strength f',
at a
strain
of e.
:0.0015.
Beyond
maximum
stength,
the
masonry strength
decreases
linearly to
a
plateau
of 0.2f'.
at a strain
of
enp,
as dic-
tated
by the slope 2n'.
f^(e)
:
t
o67f;
t
-
(o r)']
,
,. ,,,
f^(e)
:
f;
lI
-Zm(E-
0.0015)l
,
t^St<tnp
f^(e):
o-zf;
The
slope
of
the
descending branch is
given
by:
,
E)E^P
(3.10)
(3.1r)
0.8
an0
E^r:
T+8,
zzm
0.5
Z^:
Eqn. 3.10
directly
implies
an
initial
elastic modulus
(e:
0) of
E^
and an
average elastic
modu-
lus
for
the
stress range
0-0.33f'-
of
En,:
E^
=
1067f;
Em
:
976f;
(3.r2)
(3.13)
Fig.
3.7(a) schematically
defines the
theoretical
stress-strain
curve
parameters
for
unconfined
masonry.
-35-
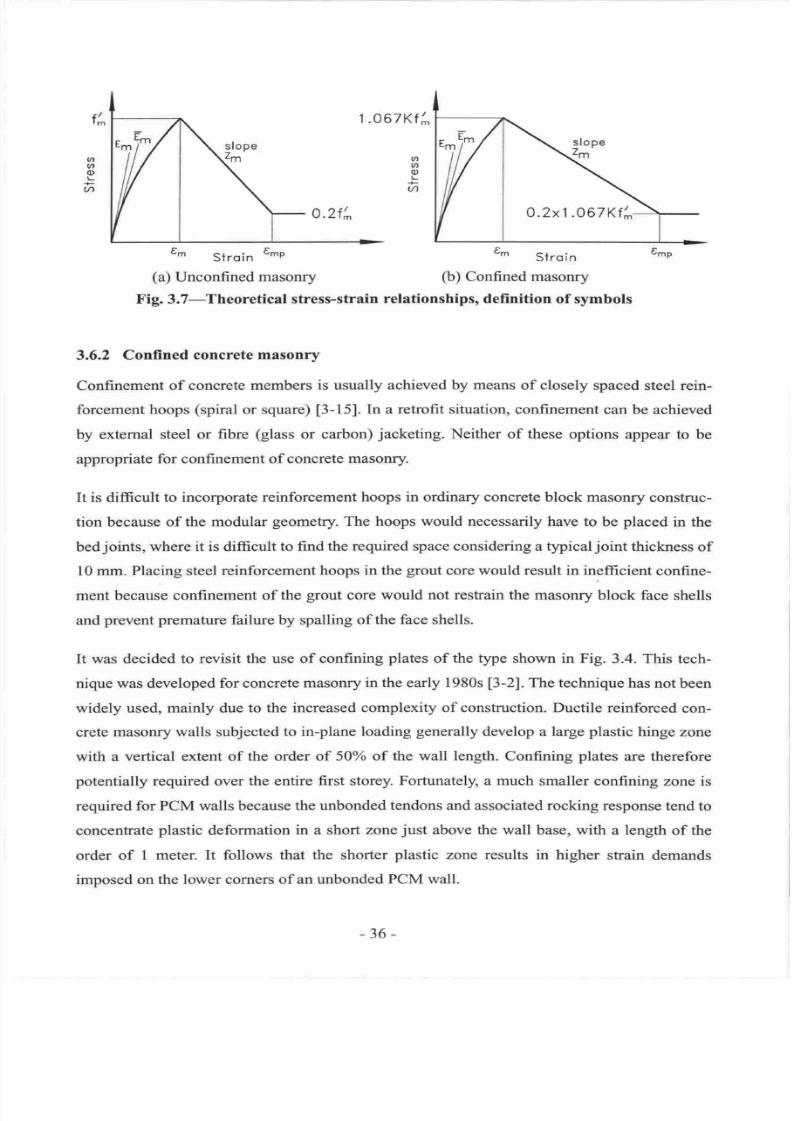
7/21/2019 PHD Laursen-masonry Prestressed Walls
http://slidepdf.com/reader/full/phd-laursen-masonry-prestressed-walls 62/308
n
o
q)
tn
@
o
q,
v',
1.O67Kf
'^
tm
slroin
€-P
tm
slroin
(a)
Unconfined masonry
(b)
Confined masonry
Fig.
3.7-Theoretical
stress-strain
relationships,
defi nition
of
symbols
3.6.2
Confined
concrete masonry
Confinement
of
concrete
members
is
uzually
achieved by
means
of
closely
spaced
steel rein-
forcement
hoops
(spiral
or square)
[3-15].
In a
retrofit
situation, conlinement
can
be achieved
by
external steel
or
fibre
(glass
or
carbon)
jacketing.
Neither
of
these
options
appear
to be
appropriate
for
confinement
of concrete
masonry.
It
is
difficult
to
incorporate
reinforcement
hoops
in
ordinary
concrete
block masomy
construc-
tion
because
of
the modular
geometry.
The
hoops would
necessarily have to
be
placed
in
the
bedjoints,
where
it is difficult
to find the
required
space
considering
a
typical
joint
thickness
of
10
mm-
Placing steel
reinforcement hoops in the
grout
core
would result
in
ineffrcient
confine-
ment
because
confinement
of
the
grout
core would
not restain
the masonry
block
face
shells
and
prevent
premature
failure by spalling
of the face
shells.
It
was decided
to revisit
the
use
of
confining
plates
of
the type
shown
in
Fig.
3.4.
This
tech-
nique
was
developed
for
concrete
masonry in the early
1980s
l3-2).
The technique has
not
been
widely
used,
mainly
due
to the
increased complexity of construction. Ductile
reinforced
con-
crete
masonry walls subjected
to in-plane
loading
generally
develop
a
large
plastic
hinge zone
with
a vertical extent
of
the order
of
50
of
the
wall
length.
Confining
plates
are therefore
potentially
required over the entire
first storey. Fortunately, a much smaller confining
zone is
required
for PCM walls
because
the
unbonded
tendons
and associated
rocking
response
tend to
concentrate
plastic deformation
in
a
short
zone
just
above the
wall
base,
with
a length
of
the
order
of
I meter. It
follows
that
the
shorter
plastic
zone results
in
higher
stain
demands
imposed on
the lower corners of
an
unbonded
PCM
wall.
o.2x1.067Kfl
tm
Stroin
(b)
Confined masonry
-36-
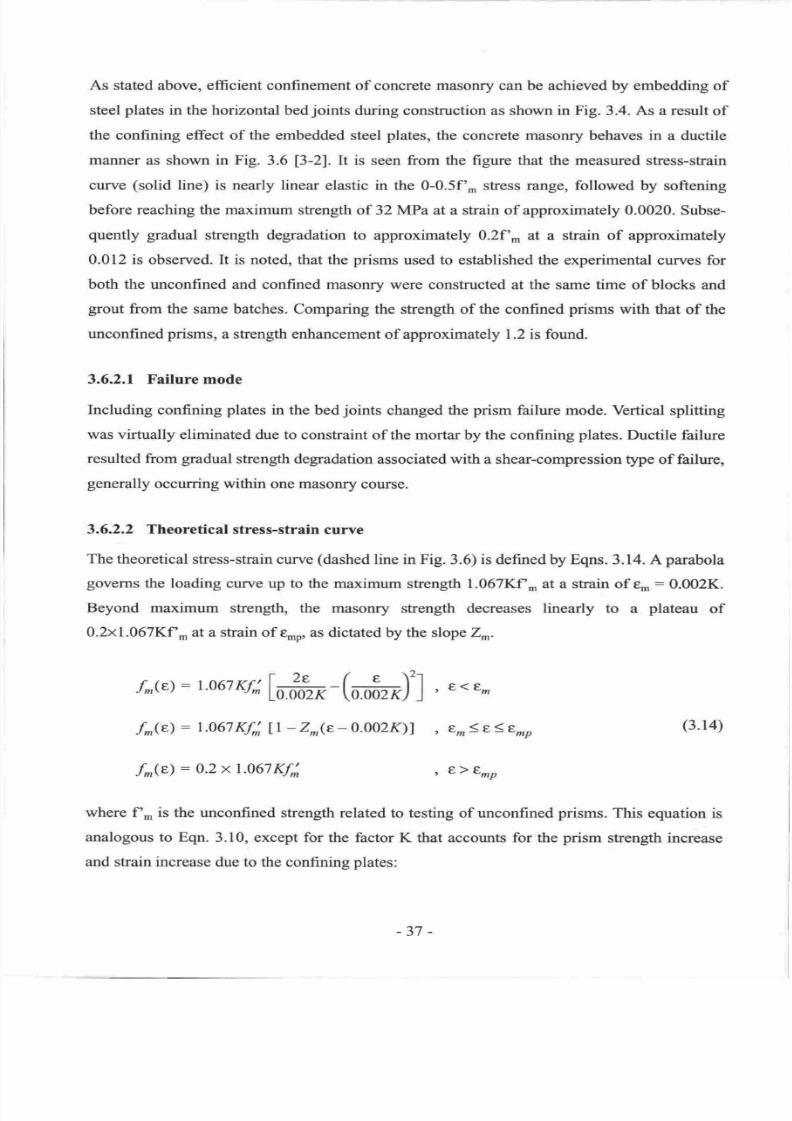
7/21/2019 PHD Laursen-masonry Prestressed Walls
http://slidepdf.com/reader/full/phd-laursen-masonry-prestressed-walls 63/308
As
stated
above,
efficient
confinement
of concrete
masonry
can be achieved by embedding
of
steel
plates
in the
horizontal
bed
joints
dwing construction
as
shown in Fig. 3.4. As
a
result
of
the confining effect
of
the embedded steel
plates,
the
concrete masonry behaves
in
a ductile
manner
as
shown
in
Fig. 3.6
l3-2l.It
is
seen
from
the
figure
that the
measured stress-strain
curye
(solid
line)
is nearly
linear
elastic
in
the
0-0.5f'.
stess range,
followed
by
softening
before
reaching
the
maximum strength
of
32 MPa at
a
strain of approximately
0.0020.
Subse-
quently gradual
strength degradation
to
approximately 0.2f',
at a
strain
of
approximately
0.012 is observed. It is noted, that the
prisms
used
to established the
experimental curves
for
both
the unconfined and confined masonry
were constructed at the same time
of
blocks
and
grout
from the
same
batches.
Comparing the
strength of
the
confined
prisms
with
that
of the
unconfined prisms,
a
strength enhancement
of approximately
1.2
is found.
3.6.2.1
Failure mode
Including
confining
plates
in the
bed
joints
changed
the
prism
failtue
mode. Vertical splitting
was
virtually
eliminated due
to constraint
of the mortar by the confining
plates.
Ductile
failure
resulted from
gradual
strength degradation
associated
with
a
shear-compression
tlpe
of failure,
generally
occurring within
one
masonry
course.
3.6.2.2
Theoretical stress-strain
curve
The theoretical stress-strain
curve
(dashed
line in Fig. 3.6) is defined
by
Eqns.
3.14. A
parabola
govems
the loading curve
up
to
the maximum
strength
1.067Kf,
at a shain
of
e-:0.002K.
Beyond
maximum
strength,
the
masonry
strenglh
decreases
linearly
to
a
plateau
of
0.2x1.067Kf,
at
a
strain of
gnp,
as
dictated
by
the
slope Zr.
r^(e):
r.067Kr;l --(o *)']
,
E1E^
f^(e)
:
1.067
Kf;
[l
-
Z^(e-
0.002J()]
,
En,3s1Enp
(3.14)
f^(e)
:
0.2
x
1.067 Kfl
,
E)Erp
where f', is
the
unconfined strength related
to testing of unconfined
prisms.
This
equation
is
analogous
to
Eqn.
3.10, except
for
the factor
K
that accounts
for
the
prism
strength
increase
and
strain increase
due
to the confining
plates:
-37
-
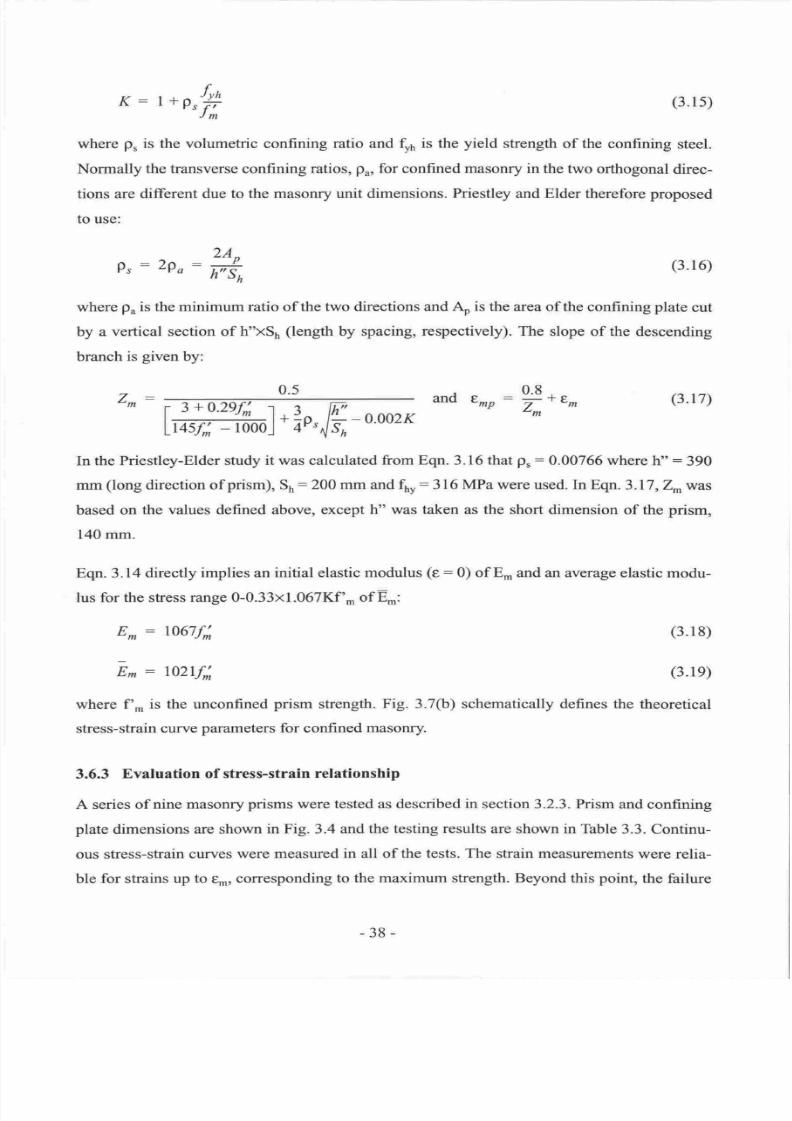
7/21/2019 PHD Laursen-masonry Prestressed Walls
http://slidepdf.com/reader/full/phd-laursen-masonry-prestressed-walls 64/308
(3.15)
where
p,
is the volumetric confining ratio and
tr,
is the
yield
strengttr
of
the confining
steel.
Normally
the
transverse
confining
ratios,
pu,
for
confined rnasonry in
the
two
orthogonal
direc-
tions
are
different due
to the masonry unit dimensions.
Priestley
and Elder therefore proposed
to
use:
K:
1
*rr*
2A^
Pr:
2Po:
6
where
p
is
the
minimum ratio of
the two directions
and
Ao
is the area
of
the
confining
plate
cut
by
a
vertical
section
of
h xSn
flength by
spacing,
respectively). The
slope
of
the
descending
branch
is
given
by:
(3.16)
(3.r7)
.5
.
0.8
anc
E^p:
TnE,
'm
zn
In
the Priestley-Elder
study
it
was calculated
from Eqn.
3.16
that
pr:0.00766
where
h :
390
mm
(long
direction of
prism),
56:200
mm
and
f1,r:316
MPa were
used.ln Eqn.
3.17,
Z',, was
based on
the values defined above, except
h
was
taken
as
the short
dimension of the
prism,
140
mm.
Eqn. 3.14
directly implies
an initial
elastic
modulus
(e:
0)
of
E* and
an average
elastic
modu-
lus for the
stress
range
0-0.33x1.067Kf',
of
E,:
E^:
1067f;
E.
:
l02lf;
where
f'*
is
the unconfined
prism
strength.
Fig. 3.7(b)
stress-strain
curve
parameters
for confined
masonry.
(3.18)
(3.1e)
schematically
defines the theoretical
3.6.3
Evaluation
of stress-strain
relationship
A series
of nine masonry
prisms
were
tested as
described
in
section 3.2.3. Prism
and
confining
plate dimensions
are
shown
in Fig.
3.4
and
the testing results
are
shown
in
Table 3.3.
Continu-
ous
stress-strain
curves were measured
in all of
the
tests. The strain
measurements
were
relia-
ble for strains
up to
e-,
corresponding
to the maximum strength. Beyond
this
point,
the failure
-38-
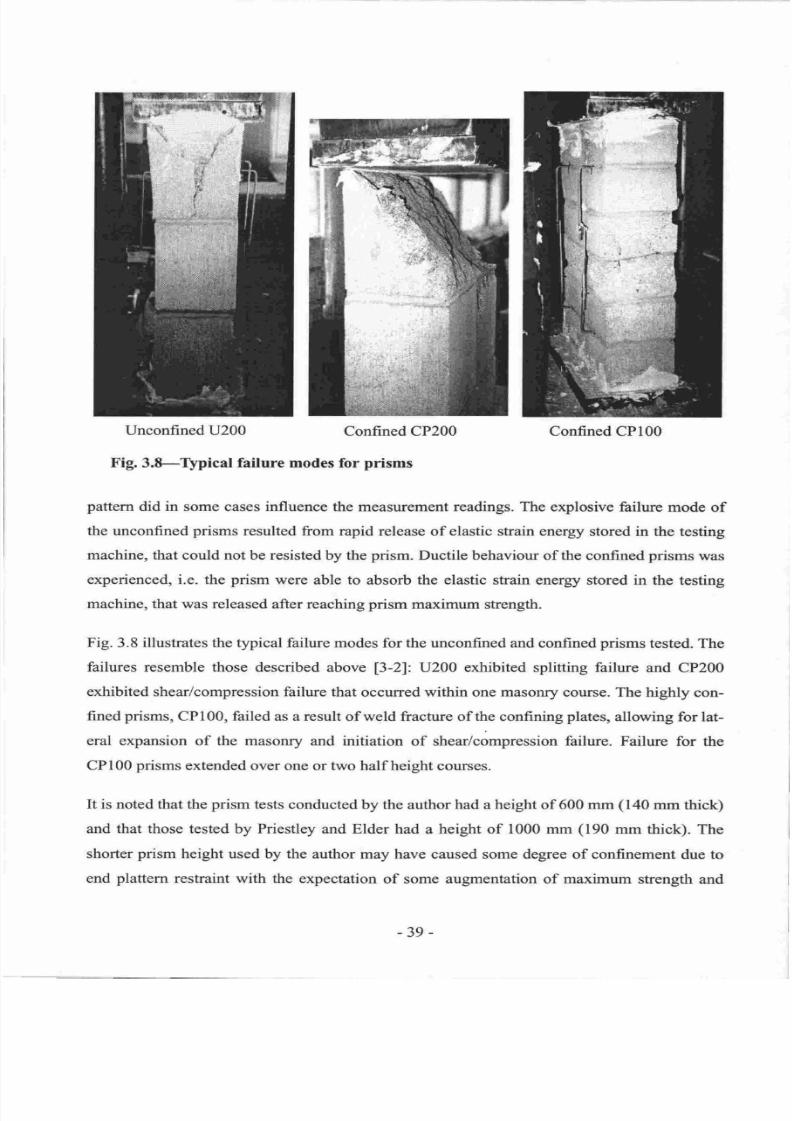
7/21/2019 PHD Laursen-masonry Prestressed Walls
http://slidepdf.com/reader/full/phd-laursen-masonry-prestressed-walls 65/308
Unconfined U200
Confined CP200 Confined
CPl00
F ig.3.8-Ilpical failure
modes
for
prisms
pattern
did
in
some
cases
influence
the
measurement
readings. The
explosive
failure
mode
of
the unconfined
prisms
resulted
from
rapid
release of
elastic strain energy stored
in
the testing
machine, that
could not be
resisted
by
the
prism.
Ductile behaviour of the confined
prisms
was
experienced,
i.e.
the
prism
were able
to
absorb
the
elastic strain
energy stored
in the
testing
machine, that was
released
after reaching
prism
maximum strength.
Fig. 3.8 illustrates the
typical
failure
modes
for the unconfined
and
confined
prisms
tested. The
failures
resemble those described above
13-21:
U200
exhibited
splitting failure
and
CP200
exhibited
shear/compression failure that
occurred
within
one
masonry
course. The
highly
con-
fined
prisms,
CP100, failed
as a
result
of weld
fracture
of
the confining
plates,
allowing
for
lat-
eral
expansion of
the
masonry
and initiation
of shear/compression
failure.
Failure for
the
CPl00
prisms
extended
over
one
or two half height
courses.
It
is
noted that the
prism
tests
conducted
by the author
had
a
height
of 600
mm
(140
mm
thick)
and
that
those tested
by
Priestley and
Elder
had
a
height
of
1000
mm
(190
mm
thick).
The
shorter
prism
height used
by
the author
may have
caused
some
degree
of
confinement
due to
end
plattern
restraint
with
the expectation
of
some
augmentation
of
maximum
strength
and
-39-
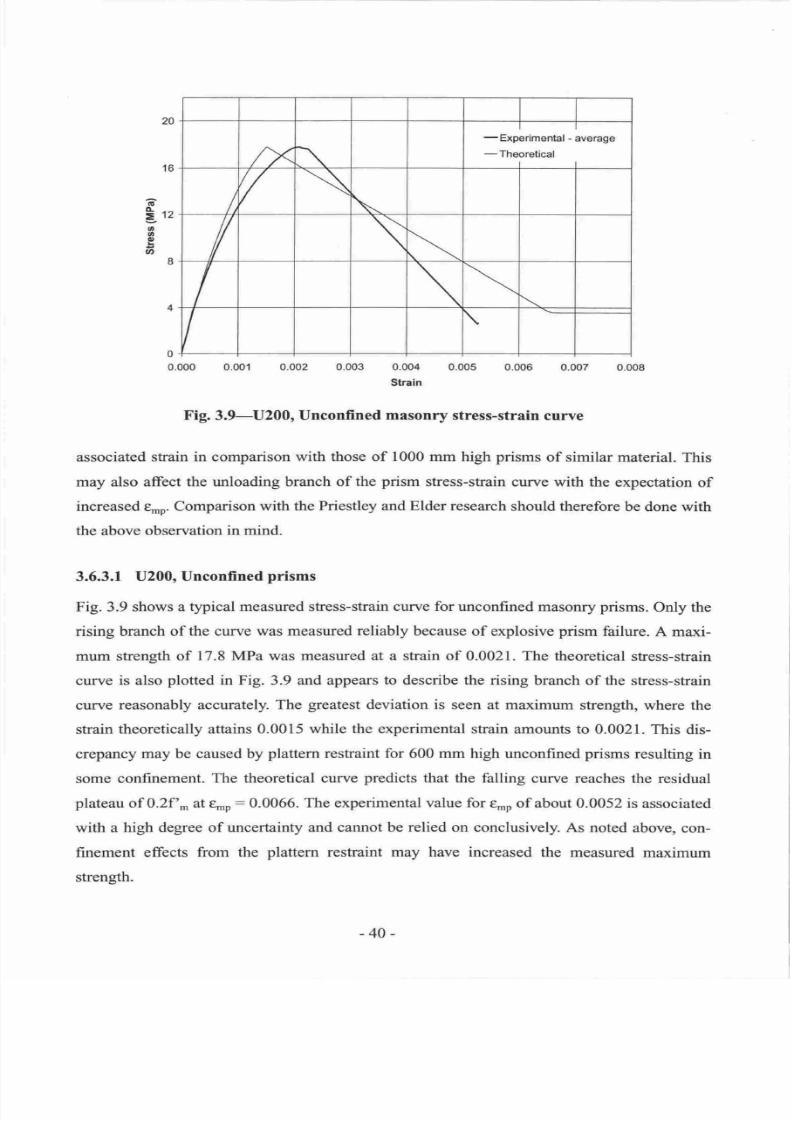
7/21/2019 PHD Laursen-masonry Prestressed Walls
http://slidepdf.com/reader/full/phd-laursen-masonry-prestressed-walls 66/308
7/21/2019 PHD Laursen-masonry Prestressed Walls
http://slidepdf.com/reader/full/phd-laursen-masonry-prestressed-walls 67/308
In
the
Priestley-Elder
study
an
average
compressive strength
of
26.5 MPa
was
found,
and was
used
for
developing the above formulae.
Fig.
3.10, showing t
p
predicted
by
Eqn. 3.il
as a
function of
f ., reveals
drastic increase
of
enp
for
lower masonry
strength when
compared to
the value
associated
with
f ,
:26.5
MPa.
It
is the
opinion of
the author that Eqn.
3.1
I
exagger-
ates
the masonry strain
capacity
for
unconfined
concrete
masonry
of
strength
of less
than
25
MPa.
For example
it
is
found
that
e*o:
0.0083
for
f -:
16
MPa,
a
strength
typically
encoun-
tered
for NZ North
Island
concrete masonry.
The explanation
for
prediction
of
such high
val-
ues
of
s,np
can be
found
in the origin
of
the equation.
The
Kent-Park curve was
determined
from
concrete research
which
rarely
deals
with
specified strengths
of
less than 30 MPa.
The
equation, having
been
calibrated
for
compressive
strengths
higher than 30 MPa, therefore
only
serves as
an extrapolation
for
compressive strength
below 30
MPa.
Consequently,
it
is
pro-
posed
to
limit
tro
to 0.0040
(approximately
the
value
predicted
for
f ,n
:26.5
MPa) for
uncon-
fined masonry in this document,
a
realistic
value for masonry compressive strength
below 26.5
MPa.
Both
Eqn.
3.9 and
the
prism
testing
results reported
in
Table 3.3 support
the elastic modulus
given
in Eqn.3.l3,
although
a
discrepancy
of about
20o/ois
found between Eqns.
3.8
and
3.13.
It
is mentioned that the
0.2f .
plateau
may not
be
appropriate
for
unconfined
masonry.
Both
these
deficiencies
are, howwer,
expected to not affect
prediction
of
flexural
behaviour
signifi-
cantly.
With
due consideration to
the
limited
amount
of
stess-strain data available from
prism
testing
of North Island
concrete
masonry
using
pumice
aggrcgate,
the Priestley-Elder
theoretical
stress-strain relation
is found
acceptable
for
detailed analysis
of unconfined
PCM.
3.6.3.2 CP200o
Confined
prisms
Fig.
3.11 shows
a
typical
measured
stress-strain curve
for
confined masonry,
using the
confin-
ing
plates
shown
in
Fig.
3.4
(p,
:
0.00577, fy1.,:240 MPa).
Shess
and
shain
measurements
for
the loading
part
of
the
curve
are associated with little
uncertainty. The
accuracy
of the
unload-
ing
curve
was,
howeveq
uncertain
because
masonry crushing and
associated
strength
degrada-
tion occurred
over
approximately
one
block height, corresponding to
approximately
0.25
to
0.5
times the
gauge
length
of
the
strain
measurement.
The
post-€m
strain
measurements shown
in
Fig.
3.11 were corrected
according to
the
observed
location
and
extent
of
failure.
-4t-
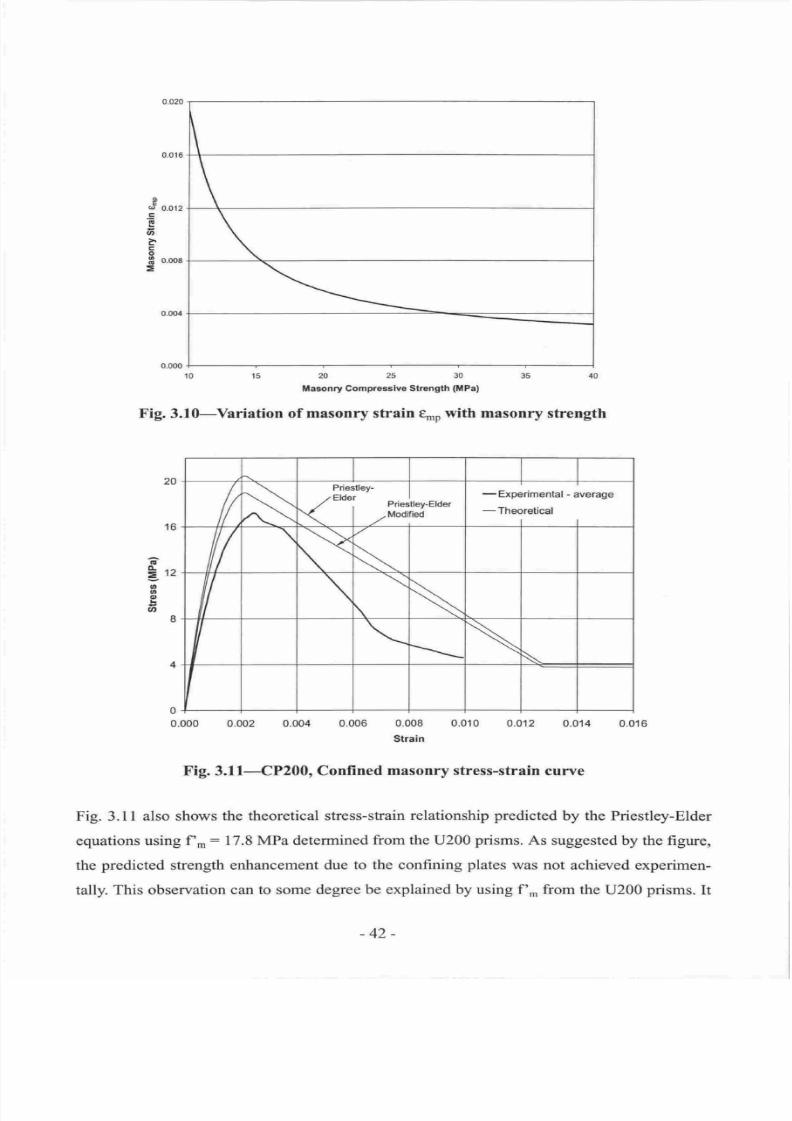
7/21/2019 PHD Laursen-masonry Prestressed Walls
http://slidepdf.com/reader/full/phd-laursen-masonry-prestressed-walls 68/308
S
0.0,,
E
G
art
e
E
o
F
o.oos
-
\
\
\
\
taronry Comprcsslve
Strangth
(llPa)
Fig.3.l0-Variation
of
masonry strain
qnp
with masonry
strength
//
Pdesfey-
|
tEHor
I
,/ ,
Ptiostley-Eldor
r{
|
-uoamea
\t./
-Experimental
-
average
-Theoretical
I $ \
I
\'
I
\
l
16
6
l
rz
6
o
o
o
8
0+-
0.000
0,010
0.012
Fig.
3.11-CP200,
Confined
masonry stress-strain
curre
Fig. 3.1I also
shows the theoretical stress-strain
relationship
predicted
by the Priestley-Elder
equations using
f'.
:
17.8
MPa determined
from the U200
prisms.
As
suggested
by the figure,
the
predicted
shength enhancement
due
to the confining
plates
was
not
achieved experimen-
tally. This observation
can to
some degree
be explained by using
f'*
from the
U200
prisms.
It
0.016
.006
0.008
Strain
-42-
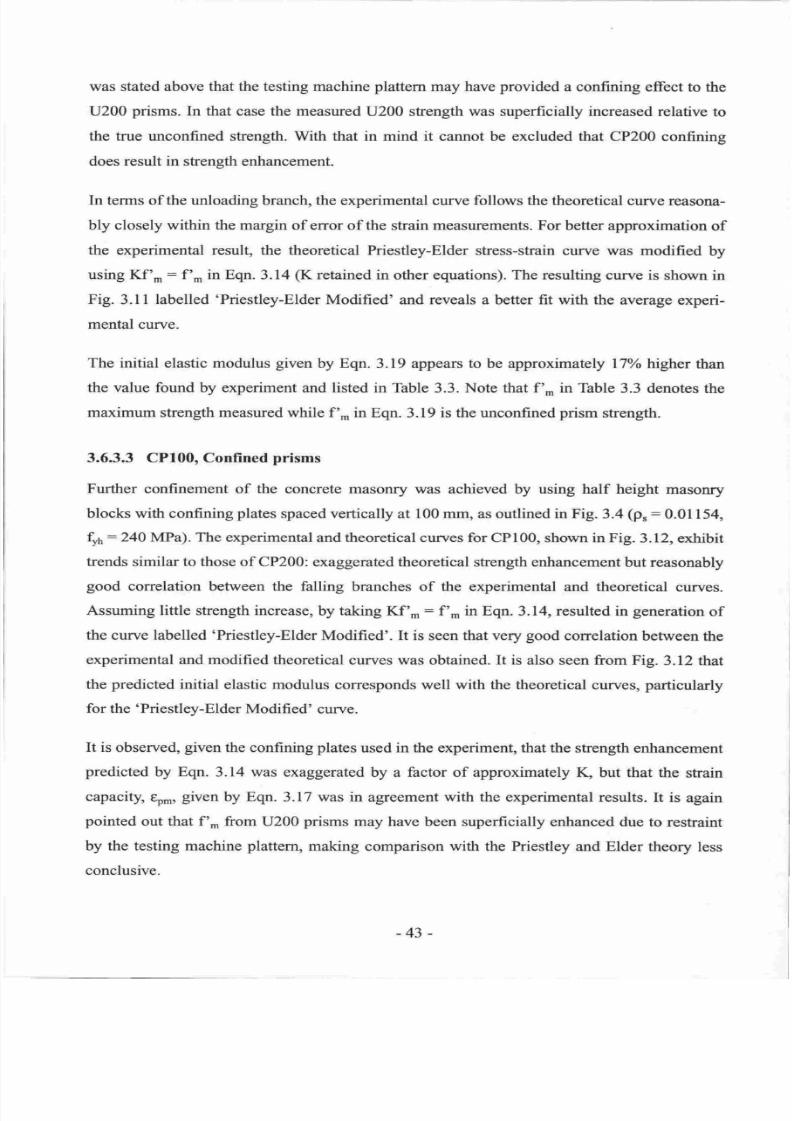
7/21/2019 PHD Laursen-masonry Prestressed Walls
http://slidepdf.com/reader/full/phd-laursen-masonry-prestressed-walls 69/308
was
stated
above that
the
testing
machine
plattem
may
have
provided
a
confining effect to
the
U200
prisms.
In
that
case
the measured
U200 strength was superficially increased
relative
to
the true unconfined strength.
With
that in
mind it cannot be excluded that CP200
confining
does
result in
strength
enhancement.
In terms
of
the
unloading branch, the
experimental curve
follows
the theoretical curve
reasona-
bly closely
within
the margin
of error of the strain
measurements.
For
better approximation
of
the
experimental result, the theoretical
Priestley-Elder stress-strain curye
was
modified
by
using
Kf',
:
f'.
in
Eqn.
3.14
(K
retained in
other equations). The resulting
curve
is
shown
in
Fig. 3.11 labelled
'Priestley-Elder
Modified'
and reveals a better
fit
with
the
average experi-
mental
cun/e.
The
initial
elastic modulus
given
by Eqn. 3.19
appears
to be approximately
l7o/o
higher
than
the value found
by
experiment
and listed
in
Table 3.3.
Note that f',
in
Table 3.3
denotes the
maximum
strength
measured
while f', in Eqn.
3.19 is
the
unconfined
prism
strength.
3.6.3.3 CPl00,
Confined
prisms
Further
confinement
of
the concrete
masoffy
was achieved
by
using
half
height
masonry
blocks with confining
plates
spaced
vertically at
100
mm,
as
outlined in Fig.
3.4
(p,:0.0[
154,
f9:240
MPa).
The
experimental
and
theoretical
curves for CPl00, shown in Fig.
3.12,
exhibit
trends similar to
those
of
CP200:
exaggerated
theoretical
shength enhancement
but reasonably
good
correlation between
the
falling
branches
of
the
experimental
and
theoretical
curves.
Assuming
little
strength increase,
by taking
Kf'-:
f'. in Eqn.
3.14, resulted in
generation
of
the curve
labelled
'Priestley-Elder
Modified'.
It
is
seen
that very
good
correlation between
the
experimental
and
modified theoretical
curves was obtained.
It
is
also
seen
from Fig.
3.12
that
the
predicted
initial
elastic modulus
corresponds
well
with the
theoretical cun/es,
particularly
for
the 'Priestley-Elder
Modified'
curve.
It
is
observed,
given
the confining
plates
used
in
the experiment, that the strength
enhancement
predicted
by
Eqn.
3.14
was
exaggerated
by a
factor
of approximately K, but that
the
strain
capacity,
.,
given
by Eqn. 3.17 was
in
agreement
with
the experimental
results.
It is
again
pointed
out that
f'*
from
U200
prisms
may have been superficially enhanced
due
to restraint
by the testing machine
plattern,
making
comparison wittr the
Priestley
and Elder
theory
less
conclusive.
-43-
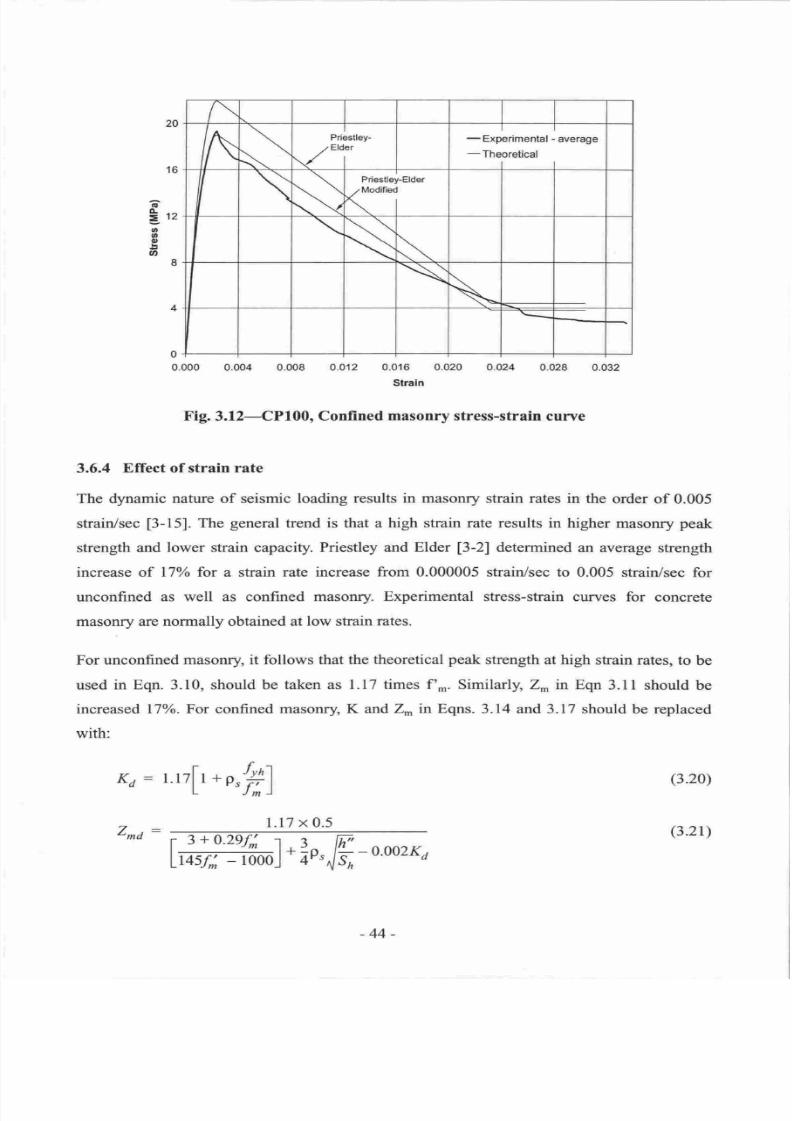
7/21/2019 PHD Laursen-masonry Prestressed Walls
http://slidepdf.com/reader/full/phd-laursen-masonry-prestressed-walls 70/308
20
16
o
3t,
o
t0
E
aD
I
0
0.000 0.016
Straln
0.032
Fig.
3.12-CP100,
Confined masonry stress-strain
curve
3.6.4
Effect of
strain
rate
The
dynamic nature
of
seismic loading results
in
masonry strain
rates
in
the
order
of
0.005
strain/sec
[3-15].
The
general
trend
is
that a
high strain
rate
results
in
higher
masonry
peak
strength
and
lower strain
capacity.
Priestley and
Elder
[3-2]
determined
an average
strength
increase
of
l7% for
a
strain rate increase
from
0.000005
strain/sec
to
0.005 strain/sec
for
unconfined
as well as
confined masonry.
Experimental stress-strain
curves
for
concrete
masonry
are
normally obtained
at
low
sfain
rates.
For
unconfined
masonry,
it
follows
that the theoretical peak strength
at
high
strain
rates,
to
be
used
in Eqn.3.l0,
should be taken as
1.17
times
f-.
Similarly,Z^ in
Eqn
3.11 should
be
increased
l7%o.
For confined masonry,
K and Z^in Eqns. 3.14
and 3.17 should
be replaced
with:
t.l7
x
0.5
(3.20)
(3.21)
Kd: r.rz[r.r,t+]
lffiv;*oo].1'',F,-ooozKd
A
\
Priestley-
TEldar
vl
tl
-
Experimental
-
average
-Theoretical
tl
\
s
PriesUel
( * :
rElder
\
\
\
7
Lmd
-
-44-
7/21/2019 PHD Laursen-masonry Prestressed Walls
http://slidepdf.com/reader/full/phd-laursen-masonry-prestressed-walls 71/308
It
is again
emphasised that
f -
is related
to
unconfined masonry
prism
testing
at
low
strain
rates.
3.6.5
Tensile
strength
The
tension
strength of
grouted
concrete
masonry is
generally
negligible in
comparison
to the
compressive strength,
is
associated
with
high uncertainty,
and nomrally
exerts
little
inJluence
on
wall
design
in the
context of
limit
state
design. The tensile
strength
is therefore ignored
by
most
limit
state design
codes, e.g.
NZS
4230:1990.
Estimates
for
tensile
capacity
of
grouted
concrete masonry
subjected to
in-plane
flexural
loading can
be
found
in
codes
that
allow
design
to
elastic theory
(allowable
stress design), e.g. MJSC
[3-8],
that
defines the tensile
capacity (modulus
of
rupture)
as
f,
:
1.72
MPa
A
tensile capacity
of
the order
of
l-2
MPa
appears
to
be
appropriate
for
design.
3.6.6
Unloadingproperties
The
unloading
properties
describe the
unloading
path
following
development
of
strains
larger
than
t
,
corresponding
to the
peak
stength,
f r.
These
properties
may
inlluence dynamic
ana-
lysis
of
PCM
walls,
which
may
be subjected
to
load reversal
many
times during
a
seismic
event.
There
is little information
available
on
unloading
properties
specific
to
concrete
masonry.
The reader
is therefore
referred to
section
9.I.2
for
a brief discussion
of
unloading
properties
adopted in relation
with
FEM
analysis of PCM walls.
3.7 PRESTRESSING
STEEL
High
strength
prestressing (HSP)
steel is
the
preferred
material
for
prestressing
of
concrete
masonry
walls.
HSP
steel has
considerably
higher
elastic strain capacity than
low
strength pre-
stessing
steel,
simply
because HSP
steel
possesses
a
much
higher
yield
stress
than
low
strength
steel,
while having similar
elastic
modulus. The higher
strain capacity
allows for
large
elastic tendon
elongation
and makes
the HSP
steel
prestress
less
sensitive to
losses
due
to
creep
and
shrinkage
of the
concrete masonry.
Steel is
not the
only material option
for
prestressing
of
walls.
Prestressing
of
masonry
walls
using
carbon
fibre
tendons was invesfigated
by
e.g. Sayed-Ahmed et
al.
[3-16]
and
Holden
[3-
17]. The investigation
by
Sayed-Ahmed
et
al.
featwed testing
of a
prestressed
clay
masonry
wall
and
proved
that
carbon fibre tendons
are a
viable option for non-seismic
design
where
lir
tle displacement
capacity is
required. Holden
investigated
a
prestressed
concrete wall
and
sug-
-45-
7/21/2019 PHD Laursen-masonry Prestressed Walls
http://slidepdf.com/reader/full/phd-laursen-masonry-prestressed-walls 72/308
gested
that
carbon
fibre
tendons
are a
viable
option
for seismic
design
when the carbon
fibre
tendons
are designed
to
remain
elastic
for
the
required
displacement
demand.
Carbon
fibre ten-
dons
behave
in
a
linear elastic manner
in
the entire loading range
until
maximum shength is
attained,
followed immediately
by rupture. The
material
is
inherently of
brittle
nature and gives
no warning
before
failure.
HSP
steel,
on
the other hand,
is
ductile
and
allows
for
plastic
strain
far beyond
nominal
yield
strain.
While
emphasis
in this document
is
put
on
tendons
remaining elastic during maximum
credible
ground
shaking
(design
earthquake
with
approx.
500
year
return
period),
tendon
yielding
can
potentially occur
in
the event
of
an
extraordinarily strong earthquake
(return period
of
more
than
500 years), thus the
ability for
tendons
to
deform
plastically (yielding)
will
prevent
sud-
den
tendon
failure, entail
energy dissipation
and
therefore further
protection
of the structure.
In
addition,
the focus
of
this thesis
is on
application of commonly
used and
commercially availa-
ble materials.
Therefore,
only
the
use
of
HSP steel is
considered for design
of unbonded PCM
walls
in this
document.
3.7.1
Tlpes of high
strength
prestressing
steel
Prestressing
steel
basically
comes
in
two
forms:
as
flexible
strand
and as
rigid
bars.
In
general
terms,
flexible strands
are appropriate
for
undulated
prestressing profiles
and
long
distanceso
and
for
high
loads,
as
they typically
have
higher
yield
stress, whereas bars
primarily
are
useful
for straight
prestressing
over
shorter
distances.
Installation
of
strand
solutions
is more
complex
than
installation
of bar solutions,
because
strands are
anchored
individually
with wedges
or
the
equivalent
and
require specialised
hydraulic
jacks
for
stressing.
Installation
of
bar solutions,
consisting
of
threaded
bars,
anchor
plates
and
nuts, requires
stressing
the
bars
with
a
hydraulic
jack
and tightening of
the
nul
Alternatively,
the
bars
can be stressed
by tightening
the nut
with
a
torque
wrench or by using
calibrated
washers
and a
wrench.
3.7.2
Material
properties
The material
properties
of
strands
and
bars
vary considerably,
as suggested
in Table 3.6, which
presents
typical material
properties
[3-
l8].
Fig 3.13
shows
a
typical
stress-strain curve
for
high
strength prestressing
steel.
It
is noted that there is no
yield
plateau
as
in
the
case
for mild
rein-
forcement.
The curve is approximately
linear elastic
up to the
yield
strength
f,n
then the
curve
bends
over,
gradually
levelling
out,
until
failure at
the
stress
of
f,u
and corresponding shain
of
u.
The
yield
strength
fon
provided by
the manufacturers,
is defined
as
the steel
stress
corre-
-46-
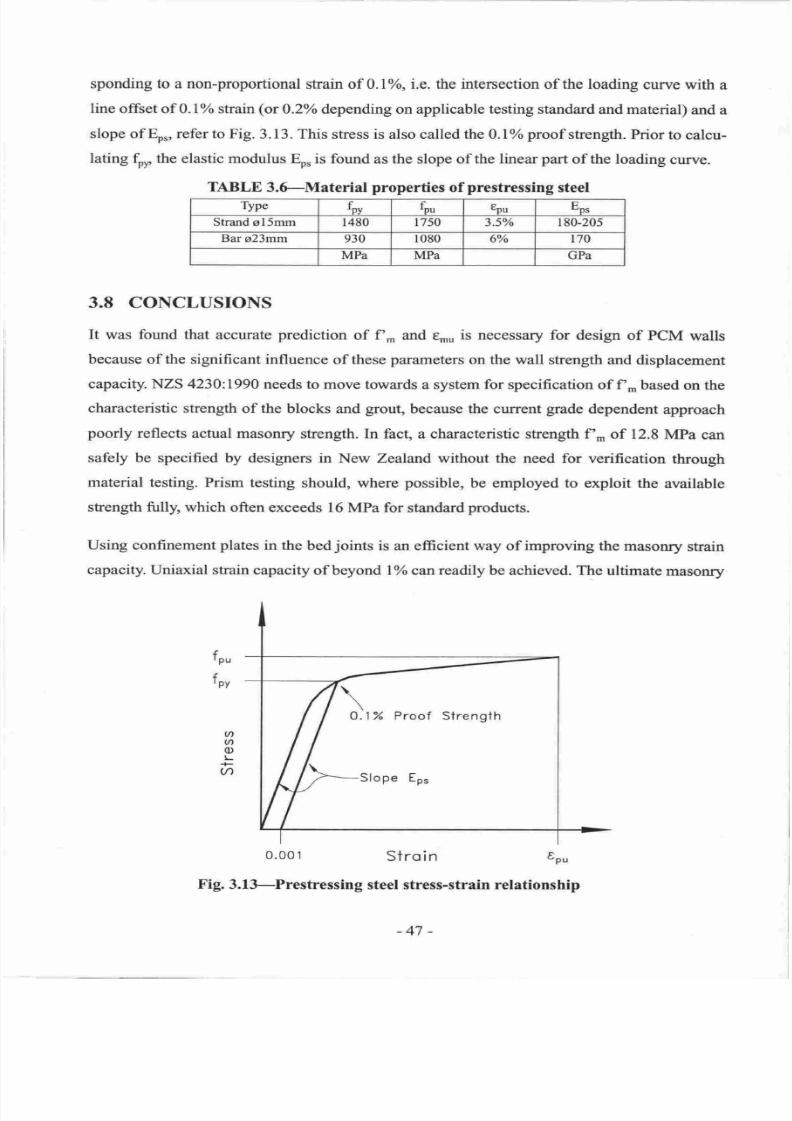
7/21/2019 PHD Laursen-masonry Prestressed Walls
http://slidepdf.com/reader/full/phd-laursen-masonry-prestressed-walls 73/308
sponding
to
a
non-proportional
strain
of
0.
I
%,
i.e. the intersection
of
the
loading
curve with
a
line
offset of 0.1% strain
(or
0.2Yo
depending
on
applicable
testing
standard
and
material)
and a
slope of
Eo.,
refer to
Fig.
3. I
3
.
This
stress
is
also
called the
0. I
%
proof
strength. Prior
to calcu-
lating
Qn
the elastic modulus
Eo,
is found
as
the slope
of
the
linear part of
the
loading
curve.
TABLE
3.LMaterial
properties
of
prestressing
steel
rype
t tu %u
Eo,
Strand
sl5mm r480 1750 3.5% l
80-205
Bar
s23mm
930
1080
60/o t70
MPa MPa
GPa
3.8
CONCLUSIONS
It
was
found that
accurate
prediction
of
f,.,,
and
e.u
is
necessary
for
design
of
PCM
walls
because
of
the
significant influence
of
these
parameters
on the
wall
strength and displacement
capacity. NZS 4230:1990
needs
to move
towards
a
system
for
specification
of
f-
based
on
the
characteristic
strength of the
blocks
and
grout,
because
the
curent
grade
dependent
approach
poorly
reflects actual
masonry
sfrength. In fact,
a
characteristic
strength f', of
12.8
MPa
can
safely be
specified by designers
in New
Zealand without the need
for
verification
through
material testing. Prism
testing
should, where
possible,
be
employed
to exploit
the
available
strength fully, which
often exceeds
16
MPa for
standard
products.
Using
confinement
plates
in the
bed
joints
is
an
efficient way
of
improving
the masonry
strain
capacity.
Uniaxial strain capacity
of beyond lYocanreadily
be
achieved. The
ultimate
masonry
,Pu
?
'pv
n
o
0)
t-
+
V)
0.001
Stroin
tP,
Fig.
3.I3-Prestressing
steel stress-strain relationship
1% Proof Strength
Slope
Ep.
-47
-
7/21/2019 PHD Laursen-masonry Prestressed Walls
http://slidepdf.com/reader/full/phd-laursen-masonry-prestressed-walls 74/308
strain,
e-u,
should be related to the
PCM
wall
flexural
behaviour
because
the expected
maxi-
mum
wall strength
is associated
with
an extreme masonry
fibre
strain
far larger than
the
codi-
fied limits.
Appropriate equivalent
rectangular
stress
block
parameters
need
to
be established
for PCM
wallso
with
due consideration
to
confinement.
It is
recommended to
use
Eqn.
3.8
for
prediction
of E* for New
Zealand
conditions
based
on
the
likely
masonry crushing strength,
and
Eqn.
3.9
when using characteristic strength.
Theoretical stress-strain curves
may
be established using the Priestley-Elder
fomrulation.
The
only
parameters
required
to
define
the curves
are
the masonry geometry
the
expected
uncon-
fined strength,
f r,
and if
present
the confining
plate
dimensions
and
yield
strength-
For
uncon-
fined
masonry,
it appears
that
e-o
is overpredicted
for masonry
strengths
below
25
MPa,
thus
q,o
should
be limited
to 0.004. For
low
volumetric
confining
steel
ratios,
ps,
the
Priestley-Elder
formulation was found to over-predict
the
sfength
enhancement, however,
the
predicted
strain
capacity appears
reasonable.
The
strength enhancement
Kf .
given
in
Eqn. 3.14
could
con-
servatively
be taken
as
just
f*.
The tensile
strength
of
grouted
concrete
masonry
is
unreliable
and should be neglected
for
limit
state
design.
It
was concluded that
it is
essential
to
use
high
strength
steel
for
prestressing
of PCM
walls
because of
the
beneficial effect
of
the large elastic elongation capacity and reduction
of
the
time
dependent
losses.
-48-
7/21/2019 PHD Laursen-masonry Prestressed Walls
http://slidepdf.com/reader/full/phd-laursen-masonry-prestressed-walls 75/308
3.9
REFERENCES
t3-11
NZS
4230:1990,
Code
of
Practice
for
the
Design of Masonry
Structures,
Standards
Association of New
Zealand,, 1
990,
Wellington.
t3-21
Priestley,
M.J.N.
and Elder,
D.M.,
Stress-strain
curves
for
Unconfned and
Confined
Concrete
Masonry,
ACI
Journal, Vol.
80, No.
3,
May-June
1983,
pp.192-201.
t3-31
NZS 4210:2001,
Code
of
Practicefor
Masonry
Construction:
Materials
and
Worhnan-
sftlp,
Standards
Association
of
New
Zealand,l989,
Wellington.
t34]
AS
3700-1998,
Masonry
Structures,
Standards
Association
of Australia,
Homebush,
NSW
Australia.
t3-51
NZS 3102:1983,
Concrete
masonry
units,
Standards
Association
of
New
Zealand,
1983,
Wellington.
[3-6]
NZS 3109:1997, Concrete
Constructio,n,
Standards
Association
of New
Zealand, 1997,
Wellington.
13-71
Priestley, M.J.N.,
and
Chai,
Y.H.,
Prediction
of Masonry
Compression
Snength,
Part
2,
New
Zealand
Concrete
Construction,
April
1984,pp.21-24.
[3-8]
MSJC: Building
Code Requirements
for
Masonry Structures
and Specification
for
Masonry
Stntctures, ACI
530-02/ASCE
5-02/TMS
402-02,
The Masonry
Standards
Joint Committee,
USA,
2002.
t3-91
Paulay, T.,
and
Priestley,
M.J.N.,
Seismic Design of Reinforced
Concrete and
Masonry
Buildings,
John
Wiley Sons Inc.,1992,744p.
[3-10]
UBC,
Unifurm
Building
Code
l99T,Intemational
Conference
of
Building
Officials,
Whittier, Califomia,
USA.
[3-lll
NEHRP, Recommended
Provisions
for
Seismic
Regulations
for
New
Buildings
and
Other
Structures, Part
I
-
Provisions,
Building
Seismic
Safety
Council,
1997,Washing-
ton, D.C., U.S.A.
[3-12]
CSA
5304.1-M94, Masonry
Designfor
Buildings
(imit
states
design),
Canadian
Stand-
ards
Association,
Rexdale,
Ontario,
Canada.
[3-13]
NZS
3101: 1995, Concrete
Stntctures
Standard Standards
Association
of New Zealand,
1995,
Wellington.
-49-
7/21/2019 PHD Laursen-masonry Prestressed Walls
http://slidepdf.com/reader/full/phd-laursen-masonry-prestressed-walls 76/308
[3-14]
Drysdale,
R.G. and
Hamid,
A.A.,
Behaviour
of
Concrete Block
Masonry
Under
Axial
Compression,
ACIJournal,
Proceedings
V.
76, No.
6,
June
1979,
pp.707-721.
[3-15]
Scott,
8.D.,
Park, R
and
Priestley,
M.J.N.,
Stress-Strain behaviour
of
Concrete Confined
by
Overlapping Hoops
at
Low
and
High
Strain
Rates,
ACI
Journal, Proceedings, V. 79,
No. l,
Jan.-Feb.
1982,pp.
13-27.
[3-16]
Sayed-Ahmed,
E.Y.,
Lissel,
S.L.,
Tadros,
G., and Shrive,
N.G., Carbonfibre
reinforced
polymer
CFRP) post-tensioned
masonry
diaphragm walls;
prestressing,
behaviour,
and
design
recommendations, Canadian
Journal
of Civil
Engineering,
Vol.
26,
No.
3,
1999,
pp.324-344.
[3-17]
Holden,
T.J.,
A
Comparison
of
the
Seismic
Performance
of Precast Wall Construction:
Emulation and
Hybrid Approaches,
Research Report 2001-04, Deparhnent
of
Civil
Engineering, University of Canterbury
Christchurch, New Zealand.
[3-18]
VSL
Construction
Systems, VSL
Prestressing
Aust.)
Pty.
Ltd.,
Australia,
1995.
-50-
7/21/2019 PHD Laursen-masonry Prestressed Walls
http://slidepdf.com/reader/full/phd-laursen-masonry-prestressed-walls 77/308
Chapter
4
TIME
DEPENDENT
EFFECTS
4.
ASSESSMENT
OF
PRESTRESSING LOSSES
Assessment
of
prestressing
losses
is of
great
importance
for
prestressed
concrete
masonry
structures. The
effective
prestress
level
decreases
over
time
due to
creep, shrinkage
and
steel
relaxation,
hence
reducing
structural
efficiency.
Research
has indicated that
preshess
losses
in
prestressed
concrete masonry
may nmge
as
high
as25o/o
of the
initial stress
level,
depending
on
the masonry, the
initial
stress
level
and
the
prestressing
hardware
[4-1].
Losses
are typically
attributed to the
following
factors:
L
Shrinkage
2.
Creep
3.
Relaxation
of tendons
4.
Elastic
shortening
Anchorage draw-in
(seating
losses)
Friction
due to
undulation of tendons
Thermal
effects
Elastic
shortening
(4)
occurs
when a
tendon
is
stressed
due
to
the
masonry elastic
properties.
When
more
than
one
tendon
is
used
in
a
wall and
these
are stressed one at the
time,
stressing
of
any tendon
but the
first one
will
theoretically affect the tendon
stress
in
all
previously
stressed
tendons. Elastic
shortening can
readily
be estimated using elastic
analysis, but
is
expected
to
have
minimal
influence
for
PCM because
prestressing
area
ratios
typically
are
relatively
low
As
a
consequence,
(4)
is
only
discussed
in
this
chapter
as a
benchmark
for
shortening
in
rela-
tion with
creep strain.
As this
chapter
primarily
is
concerned
with
post-tensioned
concrete
masonry
(PCM)
walls
with
unbonded
straight tendons,
item
(6)
is
a
non-issue.
Anchorage
draw-in
(5)
may
be estimated
according
to
the
utilized
prestressing
hardware
and
will not
be
5.
6.
7.
-
5l
7/21/2019 PHD Laursen-masonry Prestressed Walls
http://slidepdf.com/reader/full/phd-laursen-masonry-prestressed-walls 78/308
discussed
further. Short term thermal effects
(7)
are disregarded
in
this study
because
of
their
reversible
nafure. Nevertheless, tendon stress change
may
arise
from
temperature
difference
between
the
masonry
and
the
prestressing
steel,
which may readily
be evaluated.
It is
noted
that
the
issues
4 through
7
have
little
or
no
time
dependency.
Consequently,
this
chapter
solely
dis-
cusses
the time
dependent issues
affecting
prestress
losses
in
concrete
masonry: shrinkage,
creep,
and
prestressing
steel
relaxation.
Equations for evaluating
creep and
shrinkage
are
presented,
complying with
current
practice
for
design
of
prestressed
concrete
and the masonry code
provisions
from
the
British
standard
BS 5628
14-21,
the Australian standard
AS
3700
[4-3]
and
the
North American
code
MJSC
[4-
41.
A
creep
and
shrinkage experimental
program
conducted
at the
University
of
Auckland
is
thereafter
presented
and compared
with
creep and shrinkage
code
provisions.
Equations
for
evaluating
steel relaxation are
presented,
followed by
current
code
recommendations.
Lastly
recommendations
are made
for calculation of
prestress
losses
under
New Zealand
conditions.
4.I
THEORETICAL CONSIDERATIONS
4.1.1
Creep and
shrinkage
of concrete
The
following
is
a
short description
of
the creep
and
shrinkage mechanisms in
concrete
(water
based)
as
reported by
Neville
[4-5].
It
is
emphasised
that the description
serves
only to
provide
sufficient
understanding
of
the creep and
shrinkage mechanism
for
development
of
relevant
equations
presented
below.
Despite
the fact that creep and shrinkage
are interactive
processes
and cannot be completely
dissociated,
the
effects
of
creep and
shrinkage
traditionally
are
dissociated
for
simplicity
as
illustrated
in
Fig. 4.1. This
is
of
course
an
extemely simplified
description
of a
very
complex
interaction
between time dependent effects-
The
following
shortening
of
a concrete
specimen
is
observed
when subjected to
sustained
axial
load:
Initial
elastic
shortening
:
The
initial
elastic shortening, denoted
5
in
Fig. 4.1, results
from
application
of axial
load
at
time
to
and
is
often
used
as
reference
for
describing
the
magnitude
of
creep
and
shrinkage. The
initial
elastic shortening
reflects the
stress
level
applied
to
the concrete
and the
initial
elastic
modulus of
the
concrete.
-52-
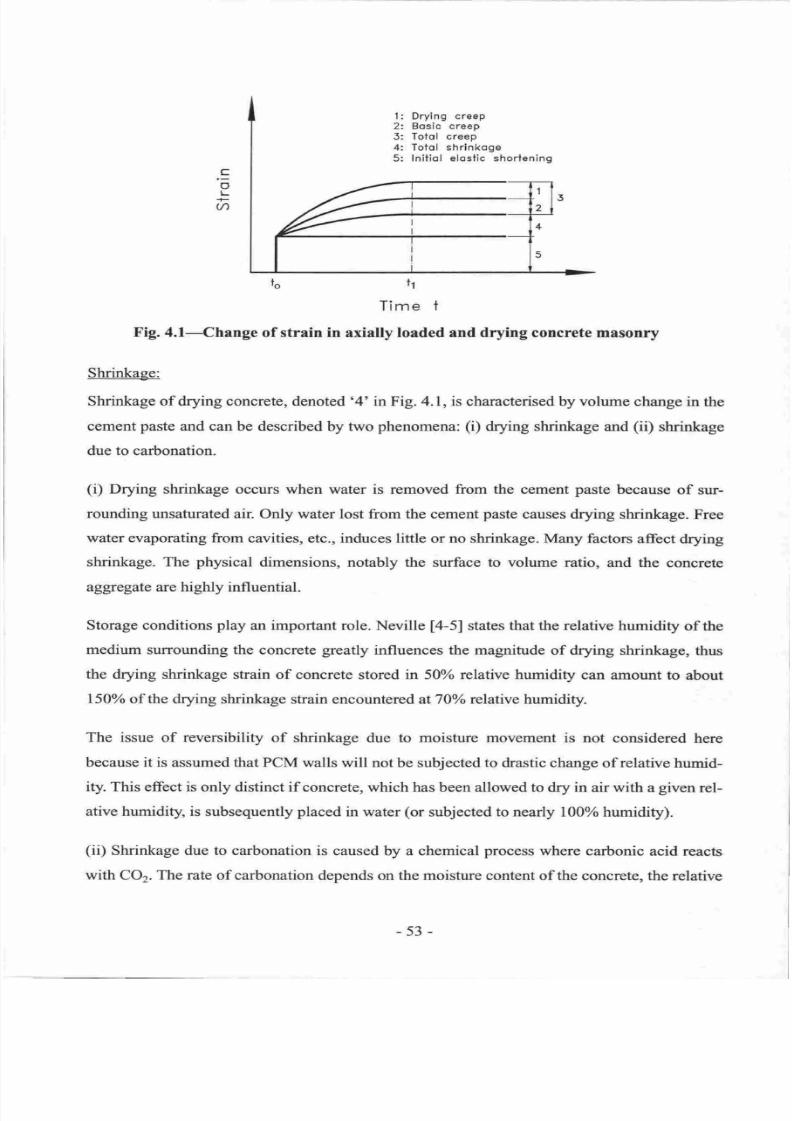
7/21/2019 PHD Laursen-masonry Prestressed Walls
http://slidepdf.com/reader/full/phd-laursen-masonry-prestressed-walls 79/308
'I
.
2-.
3:
4.
5:
Drying
creep
Bosic
creep
Totol
creep
Totol
shrlnkoge
lnitiol
elosiic
shortening
o
L
+
a
to
t1
Time i
Fig.4.l-Change
of
strain
in
axially
loaded and
drying
concrete
masonry
Shrinkage:
Shrinkage
of drying concrete, denoted
'4'
in Fig. 4.1,
is
chamcterised
by
volume
change
in the
cement
paste
and can
be described
by two
phsnomena:
(i)
drying shrinkage and
(iD
shrinkage
due
to carbonation.
(i)
Drying
shrinkage
occurs when water
is
removed
from
the cement
paste
because
of
sur-
rounding
unsaturated air. Only
water
lost
from
the cement
paste
causes
drying shrinkage.
Free
water evaporating
from cavities, etc., induces
little
or no shrinkage.
Many factors
affect
drying
shrinkage. The
physical
dimensions,
notably the surface
to
volume
ratio,
and the
concrete
aggregate are
highly influential.
Storage conditions
play
an important role. Neville
[a-5]
states
that
the relative humidity
of
the
medium surrounding
the concrete
greatly
influences the
magnitude
of
drying shrinkage,
thus
the
drying shrinkage strain
of
concrete
stored
in
50 relative humidity
can amount
to about
L50
of the drying
shrinkage strain
encountered
at70 o
relative
humidity.
The
issue
of reversibility
of
shrinkage
due
to
moisture
movement
is not considered
here
because it is assumed
that
PCM walls
will
not
be
subjected to drastic
change
of relative
humid-
ity. This effect
is
only
distinct
if
concrete,
which
has been
allowed to dry in
air
with
a
given
rel-
ative humidity, is
subsequently
placed
in water
(or
subjected to nearly
l00o/o
humidity).
(ii)
Shrinkage
due
to
carbonation is caused
by
a
chemical
process
where carbonic
acid
reacts
with CO2.
The
rate
of
carbonation
depends
on
the
moisture
content of the concrete,
the relative
-53-
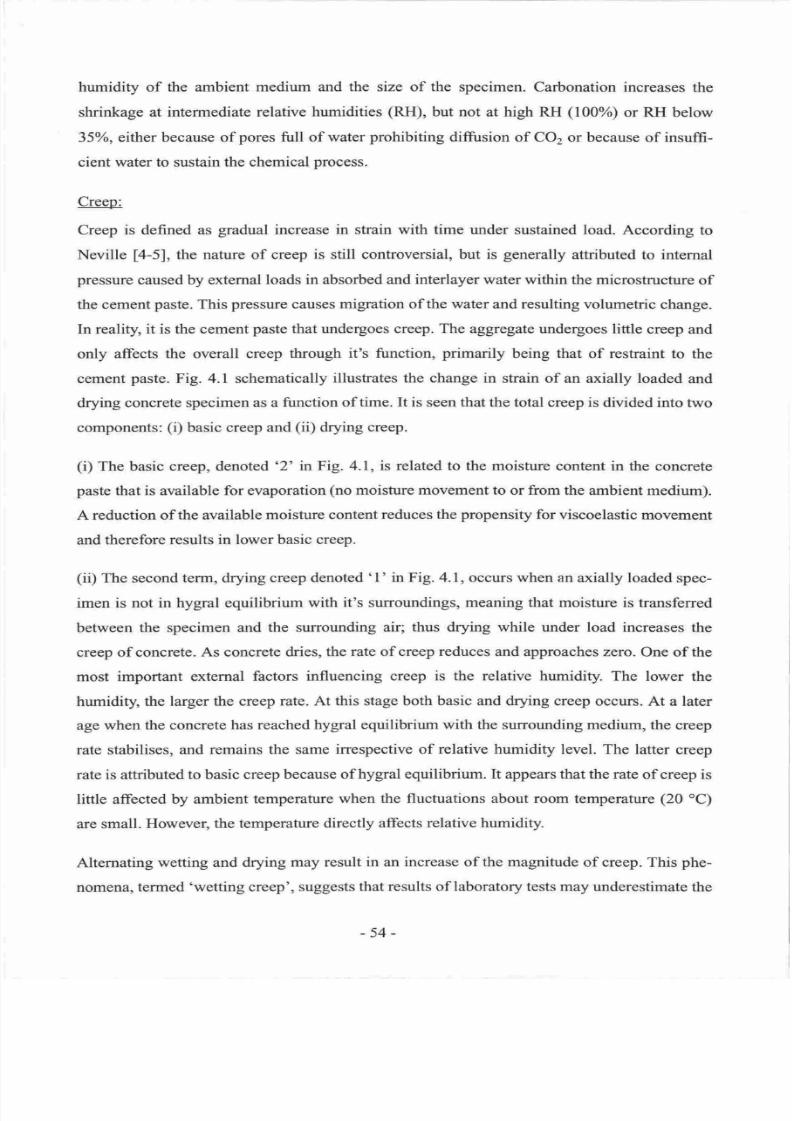
7/21/2019 PHD Laursen-masonry Prestressed Walls
http://slidepdf.com/reader/full/phd-laursen-masonry-prestressed-walls 80/308
humidity
of
the
ambient
medium
and
the size of the
specimen. Carbonation
increases
the
shrinkage
at intermediate relative
humidities
(RH),
but
not
at
high RH
(100%)
or RH
below
35Vo,
either
because of
pores
full of
water
prohibiting
diffi.rsion
of CO2
or because
of
insuffi-
cient
water
to
sustain
the chemical
process.
Creep:
Creep
is
defined as
gradual
increase
in
strain
with time
under sustained
load.
According
to
Neville
[4-5],
the nature
of
creep
is
still
controversial,
but is
generally
attributed
to
internal
pressure
caused
by external
loads
in
absorbed
and
interlayer water
within
the microstructure
of
the cement
paste.
This
pressure
causes
migration of the water
and
resulting volumetric
change.
In reality,
it
is the cement
paste
that
undergoes
creep. The
aggregate
undergoes
linle
creep
and
only
affects
the
overall
creep
through it's function,
primarily
being that of
restraint
to
the
cement
paste.
Fig.
4.1
schematically
illustrates the change
in
strain
of
an
axially
loaded
and
drying concrete specimen
as a
function
of
time.
It
is
seen
that
the total
creep
is divided into
two
components:
(i)
basic
creep and
(ii)
drying
creep.
(i)
The
basic
creep, denoted
'2' ln Fig.
4.1,
is
related
to
the moisture
content
in
the concrete
paste
that
is
available
for
evaporation (no moisture movement
to
or
from
the ambient
medium).
A
reduction of
the
available
moisture content
reduces
the
propensity
for
viscoelastic
movement
and
therefore
results
in
lower
basic
creep.
(ii)
The
second
term, drying
creep denoted
'l'
in Fig. 4.1,
occurs
when
an axially
loaded
spec-
imen
is
not in hygral equilibrium
with
it's
surroundings, meaning that
moisture
is
transferred
between
the
specimen
and
the
surrounding
air; thus drying while
under
load
increases
the
creep
of concrete.
As concrete dries,
the
rate of
creep reduces
and approaches
zero.
One
of
the
most
important external
factors
influencing
creep
is the relative humidity.
The lower
the
humidity
the larger the
creep
rate.
At
this
stage
both basic and
drying
creep
occurs.
At
a later
age
when the concrete
has reached
hygral equilibrium
with
the surrounding medium,
the
creep
rate
stabilises,
and
remains the same
irrespective
of
relative
humidity
level.
The
latter
creep
rate is
attributed
to
basic
creep because
of
hygral equilibrium.
It appears
that
the
rate
of
creep
is
little
affected
by
ambient
temperature when
the fluctuations about room
temperature
(20
C)
are
small.
Howeveq the temperature
directly
affects
relative humidity.
Alternating
wetting and
drying
may
result
in an
increase
of
the magnitude
of
creep. This
phe-
nomena,
termed
'wetting
creep',
suggests
that
results of
laboratory
tests
may
underestimate
the
-54-
7/21/2019 PHD Laursen-masonry Prestressed Walls
http://slidepdf.com/reader/full/phd-laursen-masonry-prestressed-walls 81/308
creep
under normal weather
conditions
[4-5].
Bryant et
al.
[4-61came
to the
opposite
conclu-
sion from comparison
of
creep
strains
in
concrete
specimens
placed
(l)
on top
of a
bridge
deck
(alternating
wetting
and
drying)
and
(2)
inside the
box
girder
of the
same bridge
(sheltered
environment).
Bryant
et
al.
found that
creep
strain
after
600
days
for
(l)
amounted
to
about
90 of the creep
strain
of
(2).
Long term
creep
and shrinkage:
Fig.4.l illustrates that
at a certain
age,
t,, nearly
all
creep and shrinkage
have
occurred.
According
to Neville
[4-5]
creep and
shrinkage take
place
over
long
periods.
Typically,
the
shrinkage
after I
year
amounts to about
7 5
of
the shrinkage after 20
years.
If
the
shrinkage
stain at
I
year
is
taken
as
unity,
the shrinkage strain after
20
years amounts
to
413.
Similar
observation is
made for concrete
creep,
where
the creep shain after 20
years
may
amount
to
4/
3
of
the
creep strain
after
I
year.
This
has
significant
influence
on
the
estimate
of
prestress
loss
in
a structure,
when a service
life of
more than 20
years
commonly
is considered,
given
that
most
creep and
shrinkage
experiments last
I
-
2
years.
According to
Bryant
and Vadhanavikkit
[4-7],
the
final
amount
of
creep and
shrinkage
strain
depend strongly
on size
of
the
concrete
member. Thicker members,
i.e. members
with
further
distance
between the
concrete core
and
the
exterior
surfaces, show
slower
creep
and shrinkage
strain
rates
and
lower long
term
creep
and shrinkage
strain, than
thin
members
subjected
to
similar
stress
level
and environment.
Modelling
of
the strain rate
and long term
sfiain
depend-
encies
of
member
dimensions can
for
example
be
found
in
the CEB-FIP model
code
[4-8]
and
Eurocode
2
l4-9l.The
ACI
approach
in
[4-10]
does
not
take
concrete
dimension
into
account
in
estimation
of creep and
shrinkage
properties.
4.1.2
Creep and
shrinkage
of
concrete
masonry
Creep and
shrinkage
of
concrete
masoffy,
a
material
combination
composed
of
water-based
cementicious
materials,
are expected
to
eventuate
in
a fashion
similar
to
those
of
concrete
as
described
above.
However,
there
are
differences between
concrete
and
concrete
masonry,
such
as
the higher
porosity
of concrete masonry,
the fact that
concrete
masonry blocks
are
precast
and
normally
autoclaved
(steam
cured
and moisture
controlled)
and the
presence
of
mortar
joints.
The nature
of
creep and
shrinkage
for
firlly
grouted masonry
is
expected
to
be
similar to
that
of
concrete
because
of
the
presence
of wet
concrete
(grout,
block fill) in
about
50
of
the
cross
section
after
grouting.
-55-
7/21/2019 PHD Laursen-masonry Prestressed Walls
http://slidepdf.com/reader/full/phd-laursen-masonry-prestressed-walls 82/308
It appears
that
drying
shrinkage
in
concrete
masoffy
can
be reversed
to
a
considerable
extent
because
of
the
inherent
porousness
of
the concrete masonry blocks,
allowing
water
to
easily
penetrate
deep
within
the
specimen. This
can be
prevented
with a
suitable water repellent
coat-
ing.
According to
Lenczner
[4-ll],
who
studied
clay
masonry,
about
95 of all
creep can
be
expected
to
occur
within I
year.
This information
is not
confirmed to apply
for
concrete
masoffy.
As discussed
above
for
concrete,
perhaps
75
of
the
total
creep
and shrinkage
(after
more
than 20
years)
for
concrete occurs
within I
year (strongly
dependent
on member
thick-
ness).
For
concrete masonry
a
larger
proportion
of the long term
shortening
is
expected
to
occur
within
one
year
because
of thin
dimensions
and
high porosity
which
lead
to hygral equi-
librium
with
the
surroundings
at an early
stage. This
is in
particular
the
case for
the concrete
masoffy
shrinkage. Consequently,
nearly
all
shortening
due
to
both creep
and shrinkage
takes
place
within
5
years
of
construction
and
load
application.
This statement
does
not
hold true if
concrete masonry
is
subjected
to
extreme
humidity
variations
which,
as noted
above,
may
reverse
the
shrinkage
process
and
may
instigate wetting
creep.
It is
assumed that
creep
and
shrinkage
of
concrete
masonry can
be
identified
as
independent
and
additive
effects, as
outlined
in Fig.
4.1; a simplification of a
very
complex
interaction
between
the time
dependent
effects.
It appears,
however, that more
complex theoretical
consid-
eration
is
little
warranted
in
the context
of
concrete
masonry
because of significant
scatter
of
creep and
shrinkage results
from
laboratory
testing
14-121,
and
because
of
wide variation
of
material
properties
for
concrete
blocks,
mortar
and
grout.
4.1.3
Mathematical
expressions
This
section
considers
the
total
prestressing loss
due
to creep, shrinkage
and
prestressing
steel
relaxation, meaning
the long
term loss after say 20
years,
when nearly
all axial
movement
in
the concrete masonry
and
all
relaxation
of
the
prestressing
steel
have taken
place.
The
initial
prestressing
force after
anchorage
lock-ofi
Pi, and
the long
term
prestressing
force, P1,
iu€
important
quantities
to the structural designer,
who must
ensure adequate
structural
capacity
at
any
given
time in
a structures
service
life.
The variation
of
the
prestressing
force
with time
is
not
discussed
in this
section
because
such
detail is not
warranted
for this
study. However,
the
implications
of
time
variation
of
shrinkage,
creep and
relaxation
are briefly
discussed
in sec-
tion
4.5.2.
-56-
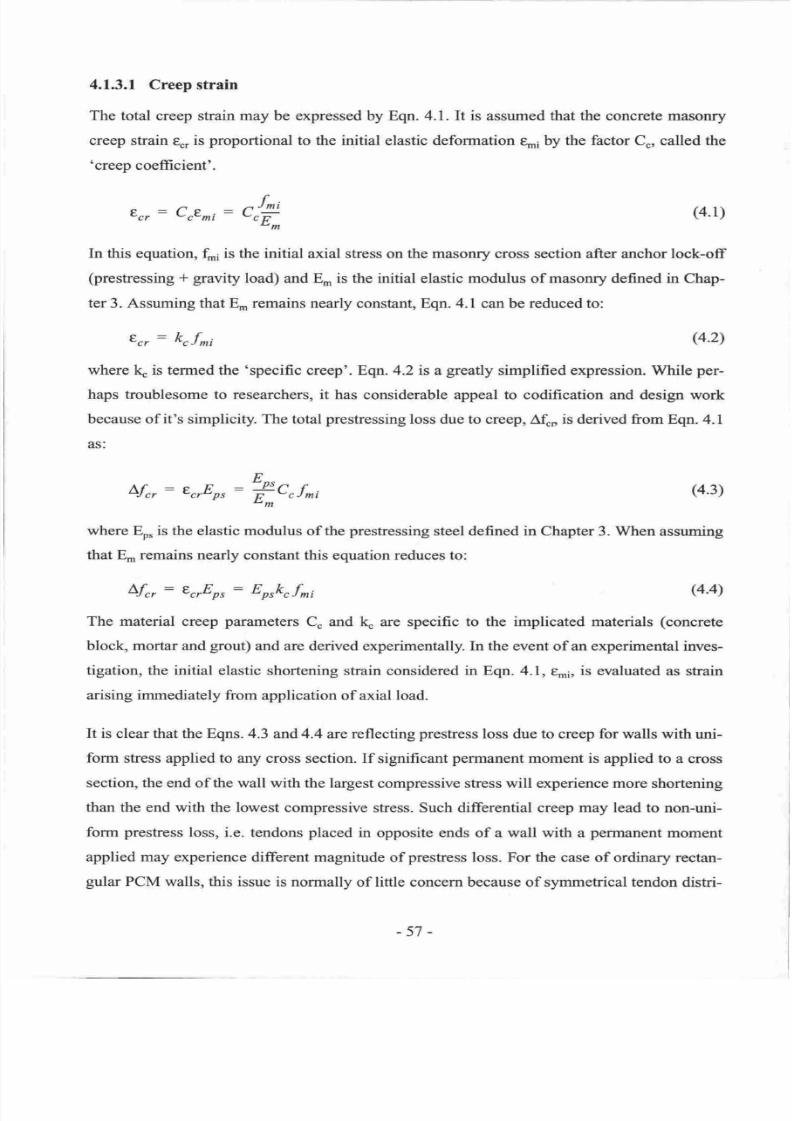
7/21/2019 PHD Laursen-masonry Prestressed Walls
http://slidepdf.com/reader/full/phd-laursen-masonry-prestressed-walls 83/308
4.1.3.1
Creep
strain
The total creep strain may be
expressed
by
Eqn. 4.1.
It
is
assumed
that the
concrete masonry
creep
strain
q,
is
proportional
to the
initial
elastic defonnation
en.,i
by
the factor
C'
called the
'creep
coefficient'.
8 ,
:
C E^r
(4.1)
In
this equation,
[6
is
the
initial
axial
stress
on the masonry cross section after anchor
lock-off
(prestressing
+
gravity
load)
and
E,n
is the
initial
elastic modulus
of
masonry defined in Chap-
ter
3. Assuming that
E,
remains nearly constant, Eqn. 4.1
can
be
reduced
to:
Err:
krf^i
(4.2)
where
k
is
termed the 'specific
creep'.
Eqn.
4.2
is
a
greatly
simplified expression. While
per-
haps troublesome
to
researchers,
it
has considerable appeal
to
codification
and
design
work
because
of
it's
simplicity. The
total
prestressing
loss due
to
creep,
Af ., is derived from Eqn.
4.1
as:
-
nfrr
-
wcF
um
E
4f r:
e rEp,
:
fC f^,
(4.3)
where
Eo,
is the
elastic modulus
of
the
prestressing
steel
defined in Chapter
3.
When assuming
that
E,n
remains nearly constant
this equation
reduces
to:
L.f r:
erQpr: Erskcf^i
(4.4)
The material
creep
parameters
C and
k
are
specific
to
the
implicated materials
(concrete
block, mortar
and
grout)
and
are
derived experimentally.
In
the
event of
an
experimental inves-
tigation, the
initial
elastic shortening
strain considered
in
Eqn. 4.1,
e-i,
is evaluated
as
strain
arising immediately from
application
of axial load.
It
is clear that
the Eqns.
4.3
and
4.4
are
reflecting
prestress
loss
due
to
creep
for
walls with uni-
form
stress
applied to any cross section.
If
significant
permanent
moment is
applied to
a
cross
section,
the end
of
the
wall with the
largest
compressive
stress
will
experience more
shortening
than
the
end
with
the lowest compressive
stress.
Such differential creep may lead to
non-uni-
form
prestress loss,
i.e.
tendons
placed
in
opposite ends
of
a
wall with
a permanent
moment
applied may experience
different
magnitude
of
prestress
loss. For
the
case
of ordinary
rectan-
gular
PCM walls, this
issue
is
normally
of
little
concern
because
of
symmetrical
tendon
distri-
-57
-
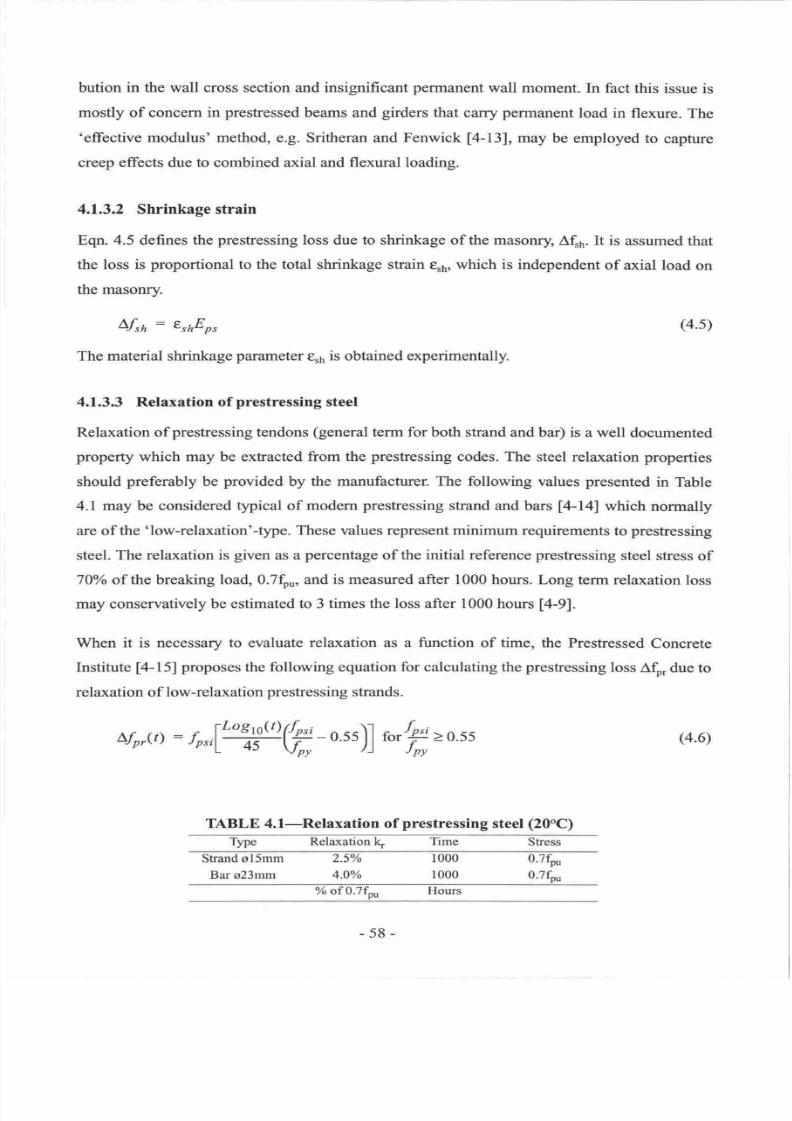
7/21/2019 PHD Laursen-masonry Prestressed Walls
http://slidepdf.com/reader/full/phd-laursen-masonry-prestressed-walls 84/308
bution
in
the
wall
cross section and
insignificant
permanent
wall
moment.
In
fact this
issue
is
mostly of
concern
in
prestressed
beams
and
girders
that carry
permanent
load
in
flexure.
The
'effective
modulus'
method, e.g. Sritheran
and
Fenwick
[4-13],
may
be
employed
to
capture
creep
effects
due
to
combined
axial
and
flexuml
loading.
4.1.3.2 Shrinkage strain
Eqn. 4.5 defines the
prestressing
loss
due
to
shrinkage
of the
masonry,
Ath.
It
is assumed
that
the loss
is
proportional
to the
total
shrinkage strain
€.6,
which
is
independent
of axial
load on
the masonry.
Lfrn
:
erhEp,
The material shrinkage
parameter
ts
is obtained experimentally.
(4.s)
(4.6)
4.1.3.3
Relaxation
of
prestressing
steel
Relaxation of
prestressing
tendons
(general
term
for
both
strand and
bar) is
a well
documented
property
which
may be exfiacted
from
the
prestressing
codes.
The
steel
relaxation
properties
should
preferably
be
provided
by
the manufacturer.
The following
values
presented
in
Table
4.I may
be considered
typical of
modern
prestressing
strand
and bars
l4-l4l
which normally
are of
the
'low-relaxation'-type.
These
values
represent minimum
requirements
to
prestressing
steel.
The relaxation is
given
as a
percentage
of
the
initial
reference prestessing
steel
stress of
70Yo
of the
breaking load,
0.7fou,
and is measured
after
1000
hours. Long term
relaxation
loss
may conservatively
be
estimated to
3
times
the
loss
after 1000
hours
14-91.
When
it is
necessary
to
evaluate
relaxation
as
a function of
time,
the Prestressed
Concrete
Institute
[4-15]
proposes
the
following
equation
for calculating
the
prestessing
loss
Afo, due
to
relaxation
of
low-relaxation
prestressing
strands.
^fp,(t)
:
fo,,lrye
o.5s)]
r ,H>
0.55
TABLE
4.I-Relaxation
of prestressing
steel (20oC)
Type
Relaxation
lg
Time
Stress
Strand sl5mm
Bar s23mm
2.5%
4.0%
1000
1000
0.7fpu
0.7fpu
% of
0.7fou
Hours
-58-
7/21/2019 PHD Laursen-masonry Prestressed Walls
http://slidepdf.com/reader/full/phd-laursen-masonry-prestressed-walls 85/308
In this
equation
t.i
is the initial steel
stress
after anchor
lock-off, t is the time
given
in hours
after stressing
and
f,,
is the
yield
stress for the steel.
Eqn. 4.6
only applies to
prestressing
strand
with
presfress
levels
above
0.55f,r For application to
prestressed
structural components
with
prestressing
of
less than
0.55L
insignificant relaxation
is anticipated.
Relaxation
after
50
years
calculated
with
Eqn. 4.6
amounts
to 3.4%o. This
is
significantly
less
than the
previously
discussed and
probably
conservative estimate
of 3
times
k
(1000
hours)
:7.5o/o.
The
above
information
may be synthesised by
the following
equation
that
evaluates the long
term
prestressing
force loss in stand
due
to relaxation,
AL bV
interpolation between zero
loss
at
0.55$,
and O.7k,fou
at 0.7fp,, assuming that
{yt$
:0.85:
A,fo,
: k,fp,ifilc-
o.5s) tu
E>0s5
(4.7)
4.1.3.4 Total Prestress Loss
The total
long-term
prestressing
loss
due
to
creep,
shrinkage
and
steel
relaxation may be evalu-
ated
by:
Lfil
:
Lf r+
Lfrn+ Lfp,
(4.8)
Eqn. 4.8 is
of conservative nature
because the
prestress
losses are
based
on
the
initial
masonry
stress f.i. h
reality, the
gradually
occurring creep, shrinkage
and
relaxation
gradually
reduces
the masonry
stress
which then
reduces
the creep and relaxation
rates.
Section
4.5.2
discusses
these
implications in
some
detail.
Mild
steel reinforcement
parallel
to the
presfessing
steel effectively resists the vertical
creep
and shrinkage strain movement
and consequently reduces the
prestress
loss.
This effect
is not
considered
herein
because
it
is
assumed
that
prestressing
steel
constitutes all flexural reinforce-
ment for PCM walls.
For later discussion
of structural
performance,
it follows that the total long term
tendon force,
P1, following
all
losses
is
given
by:
Pt
:
Pi-AorLfpt (4.e)
where
P;
represents
the
total
initial
preshess force after anchor
lock-offand
A*
is the
total
pre-
stressing
steel
area-
-59-
7/21/2019 PHD Laursen-masonry Prestressed Walls
http://slidepdf.com/reader/full/phd-laursen-masonry-prestressed-walls 86/308
4.2
CREEP
AND
SHRINKAGE
EXPERIMENT
A
considerable
number of
research
projects
have been
conducted
in various countries
on creep
and shrinkage of concrete masonry,
assessing
the magnitude
of
creep
and
shrinkage
as
a
func-
tion of
materials,
axial
load,
time
and ambient temperature
and
humidity
L4-12,4-16,4-171.
Results
from
these experimental
investigations,
that
all
lasted
about one
year,
constitute
the
basis
for codification of
creep and
shrinkage in
BS
562814-21,
AS
3700
[4-3]
and
MSJC
14-41.
The
precast
hollow
core concrete masonry blocks
ordinarily
used in
the upper
North
Island
of
New
Zealand are
composed
of
a
porous pumice
type
of
aggregate.
With a mass
of
approxi-
mately 1850 kN/m3, this type
of
block
can
be classified
as light-weight
in
the
New
Zealand,
context. The MSJC
working
draftl44l
classifies concrete masonry
in
three
weight
groups:
(l)
light-weight with mass less
than
1680
kd. ,
(2)
medium-weight
with
mass 1680-2000
kg/m,
and
(3)
normal-weight
with mass
higher than 2000 kg/m3.
The
North
Island
concrete
masonry
block
falls in
the medium-weight
category
according
to
the
North
America
weight
specifica-
tion. Normal-weight concrete masonry blocks
are
commonly
used
elsewhere
in
New
Zealand,,
for example
in
the Canterbury
region where
granite
aggregate
(or
other
dense
aggregate
types)
is
readily
available.
None
of
the studies
previously
reported apply
directly
to
the
New
Zealand
light-weight
type
of
concrete
masonry and none
of
the creep and
shrinkage experiments
directly
addressed
fully
grouted
concrete
masonry,
to the knowledge
of
the
author.
It was therefore
considered
neces-
sary
to
conduct a creep and shrinkage study on
locally
manufactured
concrete
masonry.
The
University of
Auckland study
presented
herein was
initiated
in
collaboration
with researchers
at the
University of
Wyoming
U.S.A.,
who initiated
a
parallel
creep study
in
1996
and later
reported the
findings
in
[a-12].
4.2.1
Design of
the experiments
The experiments described in this
chapter
were
conceived to reflect
common
concrete
masoory
construction
practice
in New
Zealand
and to reflect realistic
axial
prestress
levels
expected
in
PCM. In
the
year
of
1998
it was
decided
to manufacture testing
equipment for
10
wallettes,
1.0
m high, 0.59 m
wide
and 0.14
m thick. The wallette dimensions are
shown in Fig.
4.2.
-60-
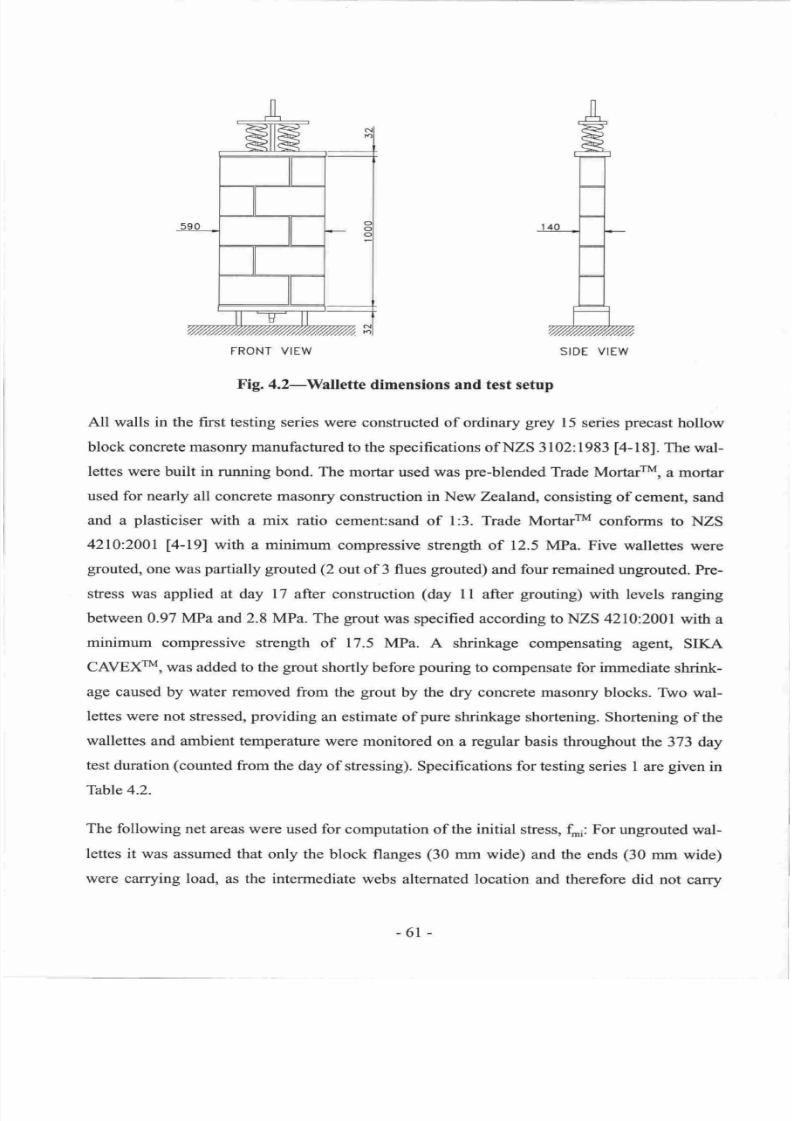
7/21/2019 PHD Laursen-masonry Prestressed Walls
http://slidepdf.com/reader/full/phd-laursen-masonry-prestressed-walls 87/308
FRONT
VIEW
SIDE
VIEW
Fig.4.2-Wallette
dimensions and test setup
All walls in
the
first
testing
series
were constructed of ordinary
grey
15
series
precast
hollow
block concrete masonry manufactured
to the
specifications
ofNZS
31021983
[4-18].
The
wal-
lettes were built
in
running
bond. The mortar
used
was
pre-blended
Trade
MortailM,
a
mortar
used
for
nearly
all
concrete masonry
constnrction in
New
Zealand,,
consisting
of
cement,
sand
and a
plasticiser
with
a
mix
ratio
cement:sand
of
l:3.
Trade
Mortarru conforms
to
NZS
4210:200I
[4-19]
with
a
minimum
compressive
strength of 12.5
MPa. Five
wallettes
were
grouted,
one was
partially
grouted 2
out
of 3
flues
grouted)
and four remained
ungrouted.
Pre-
sffess was
applied at day 17
after construction
day
I I
after
grouting)
with
levels
ranglng
between
0.97 MPa and 2.8
MPa. The
grout
was
specified according
to
NZS
4210:2001with
a
minimum
compressive
strength
of
17.5 MPa.
A
shrinkage
compensating
agent,
SIKA
CAVEXTM,
was added
to the grout
shortlybefore pouring to
compensate
for immediate shrink-
age
caused by
water removed
from
the
grout
by
the
dry
concrete masonry blocks.
TWo
wal-
lettes were
not
stressed,
providing
an estimate of
pure
shrinkage
shortening. Shortening
of
the
wallettes and
ambient temperature
were monitored
on
a
regular
basis throughout the
373 day
test
duration
counted
from the
day
of
stressing). Specifications
for
testing
series
I
are
given
in
Table
4.2.
The
following
net
areas
were
used
for
computation of
the
initial
stress,
fi1:
For ungrouted
wal-
lettes
it
was
assumed that
only
the
block
flanges
30
mm
wide)
and
the
ends
30
mm
wide)
were
carrying
load,
as the
intermediate
webs alternated
location
and
therefore
did
not
carry
-61
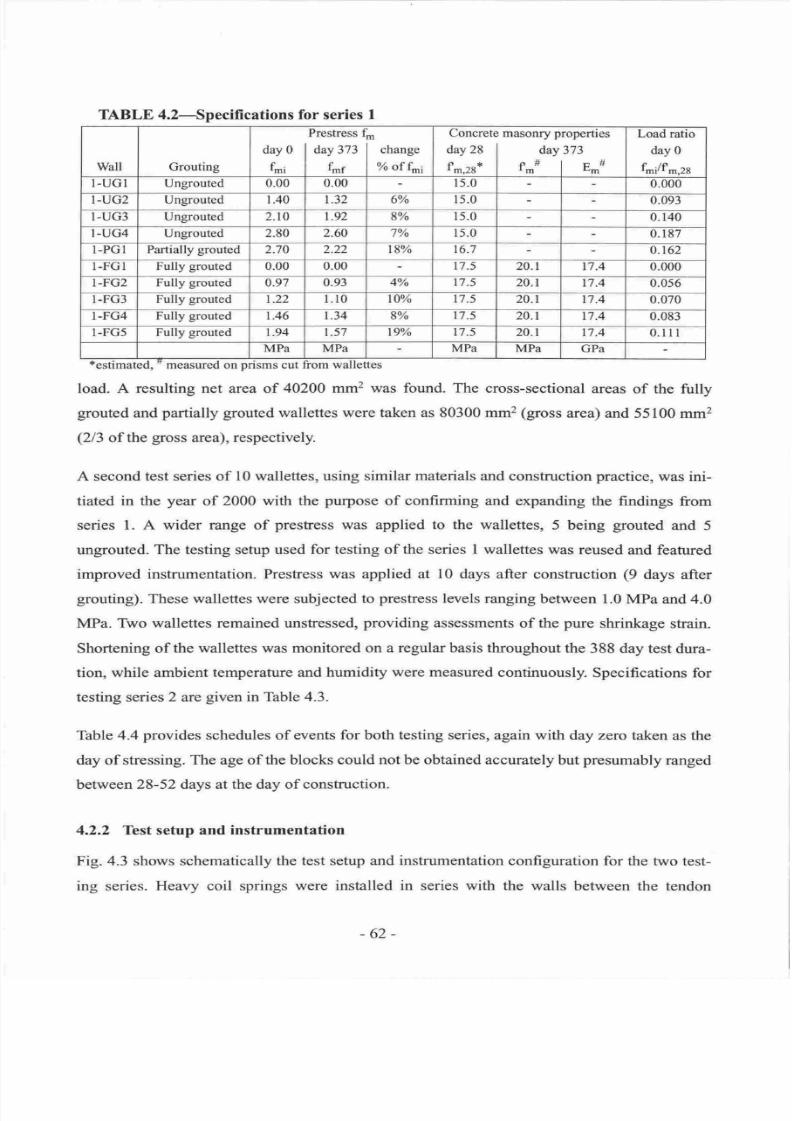
7/21/2019 PHD Laursen-masonry Prestressed Walls
http://slidepdf.com/reader/full/phd-laursen-masonry-prestressed-walls 88/308
TABLE 4.2-Specifications for
series
I
Wall
Grouting
Prestress
oll,o
|
';J'
m
change
%
of
fn,i
Concretr
day 28
fm,28*
masonry
properhes
dav 373
fm
fl
E-n
Load
ratio
day
0
fri/f*,2g
-UGI
Ungrouted 0.00
0.00 5.0
0.000
-UG2
Ungrouted
1.40
t.32
60/o
5.0
0.093
-UG3 Ungrouted 2.
l0
|.92
8o/o
5.0
0.140
-UG4 Ungrouted
2.80 2.60 7o/o 5.0
0.187
.PGI
Partially
grouted
2.70
2.22 t8% 6.7
0.t62
.FGI
Fully
grouted
0.00 0.00
't\
20. I 17.4
0.000
.FG2
Fully
grouted
0.97 0.93
4% 7.5
20.1
17.4
0.056
-FG3
Fully
grouted
r.22 1. l0
t0% 7.5
20.1
t7.4
0.070
-FG4
Fully
grouted
t,46
t.34
8% 7.5 20.1
t7.4
0.083
-FG5
Fully
grouted
t.94
t.57
l9o/o
7.5 20.1
t7.4
0.lll
MPa MPa
MPa
MPa
GPa
*ocfi
measured on cut
load. A resulting net area of
40200 mm2 was found. The cross-sectional
areas
of the
fully
grouted
and
partially grouted
wallettes were taken
as
80300
mm2
(gross
area) and 55100
mm2
(2/3
of the
gross
area),
respectively.
A
second
test
series
of l0 wallettes, using similar
materials
and
construction
practice,
was ini-
tiated
in
the
year
of
2000
with
the purpose
of
confirming
and expanding
the findings from
series
l. A
wider range
of
prestress
was applied
to the
wallettes,
5
being
grouted
and
5
ungrouted.
The testing setup
used
for testing of the series
I
wallettes
was reused
and featured
improved instrumentation. Prestress
was applied at l0
days
after construction
(9
days
after
$outing).
These
wallettes were subjected
to
prestress
levels ranging
between
1.0
MPa
and
4.0
MPa.
Two wallettes remained unstresse4
providing
assessments
of the
pure
shdnkage
strain.
Shortening of
the wallettes was monitored
on
a
regular
basis
throughout
the
388 day
test
dura-
tion, while ambient
temperature
and
humidity
were
measured
continuously.
Specifications
for
testing
series
2
are
given
in
Table 4.3.
Table 4.4
provides
schedules
of
events
for both testing
series,
again with day zero
taken
as the
day of stressing.
The
age
of
the
blocks could
not
be
obtained
accurately but
presumably
ranged
between
28-52 days
at the
day of construction.
4.2.2
Test
setup and
instrumentation
Fig. 4.3
shows schematically
the test setup and instrumentation
configuration
for
the two test-
ing series.
Heavy coil springs
were installed in series with the
walls between
the tendon
estimated,
-62-
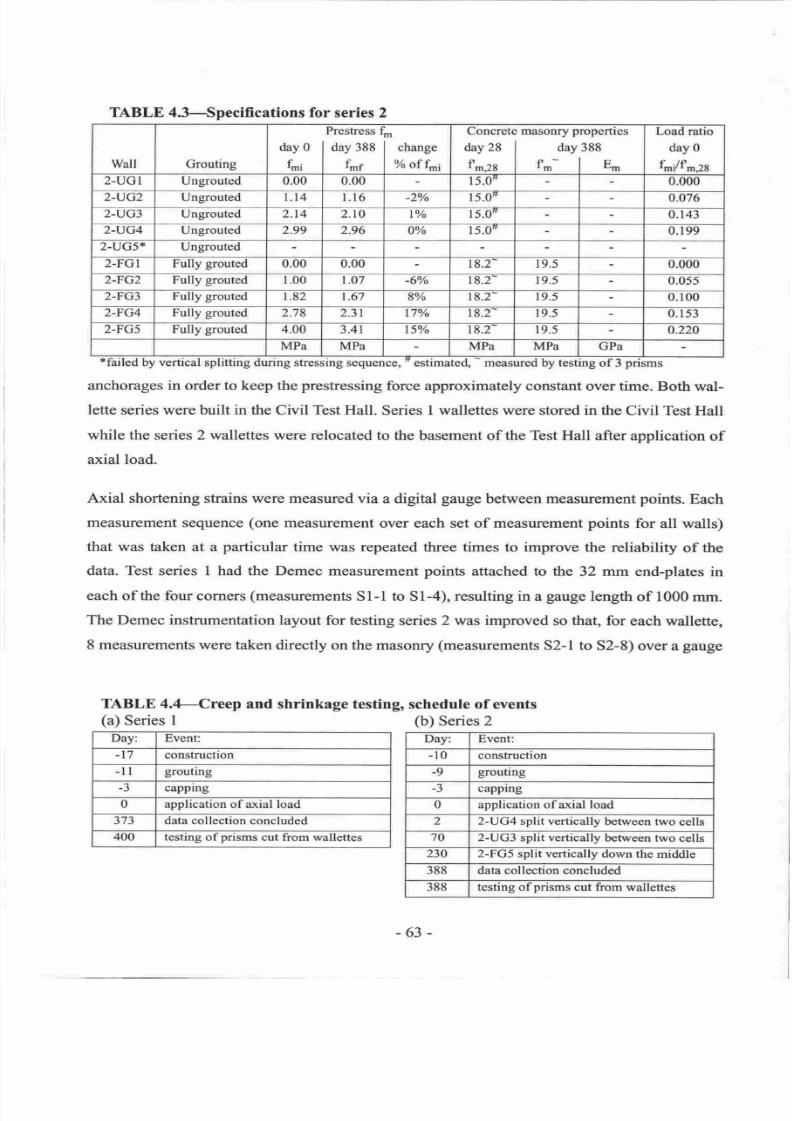
7/21/2019 PHD Laursen-masonry Prestressed Walls
http://slidepdf.com/reader/full/phd-laursen-masonry-prestressed-walls 89/308
TABLE 4.3-,Specifications
for series
2
Wall
Grouting
Prestress
day0
|
day3S8
{-
frnf
m
change
Yo
of
f^1
Concretr
day 28
fm28
masoffy
properoes
day
388
fm- |
n-
Load
ratro
day
0
&r/f'n:s
2-UGI
Ungrouted
0.00 0.00
15.0
0.000
2-UG2
Ungrouted
|.t4 l.l6
-]. /o 15.0
0.076
2-UG3 Ungrouted 2.t4
2.to
lo/o 15.00
0.143
2-UG4 Ungrouted 2.99
2.96
0%
15.0
0.199
2-UG5r
Ungrouted
2-FGI
Fully
grouted
0.00
0.00
r
8.2-
19.5
0.000
t-yul.
Fully
grouted
1.00
|.07 -6%
18.2- 19.5
0.055
2-FG3
Fully
grouted
t.E2
t.67
8o/o
t8.2
19.5
0.100
2.FG4
Fully
grouted
2.78 2.31
t7%
18.2 19.5
0.1 53
2-FG5
f
ully
grouted
4.00
3.41
t5%
t8.2
19.5
0.220
MPa
MPa MPa MPa
GPa
*failed
by
vertical
splifting during
stressing sequence,
tr
estimated,
-
measured by
testing
of
3
prisms
anchorages in
order to keep
the
prestressing
force approximately constant
over
time. Both
wal-
lette
series
were
built
in the
Civil Test Hall.
Series I
wallettes were stored in the
Civil Test
Hall
while
the
series
2 wallettes were relocated
to the
basement
of
the
Test Hall
after application
of
axial load.
Axial
shortening strains were
measured
via
a
digital
gauge
between measurement
points.
Each
measurement
sequence
(one
measurement
over
each
set
of measurement
points
for all walls)
that
was taken
at
a
particular
time
was repeated three times
to
improve
the reliability
of the
data. Test series I had
the
Demec
measurement
points
attached
to the
32
mm
end-plates
in
each
of the four
corners
(measurements
Sl-1
to
S1-4),
resulting in
a
gauge
length
of
1000
mnr
The
Demec instrumentation layout
for
testing
series
2
was
improved
so
that,
for
each
wallette,
8 measurements
were
taken
directly
on
the
masoffy
(measurements
S2-l
to
S2-8)
over
a
gauge
TABLE
4.4-Creep
and
shrinkage testing,
schedule of events
(a)
Series I
(b)
Series
2
Day: Event:
consfructron
n
grouting
-J
cappung
0
application of axial
load
373
data
collection
concluded
400 testing
of
prisms
cut
from
wallettes
Day: Event:
-10
constructlon
-9
grouting
-3
cappmg
0
applrcatton
ot
axlal
loac
2
2-UG4 split vertically
between
two
cells
70
2-UG3
split
vertically
between
two
cells
230 2-FC5 split
vertically
down
the
middle
388 data
collection concluded
388
testing
of
prisms
cut from
wallettes
-63-
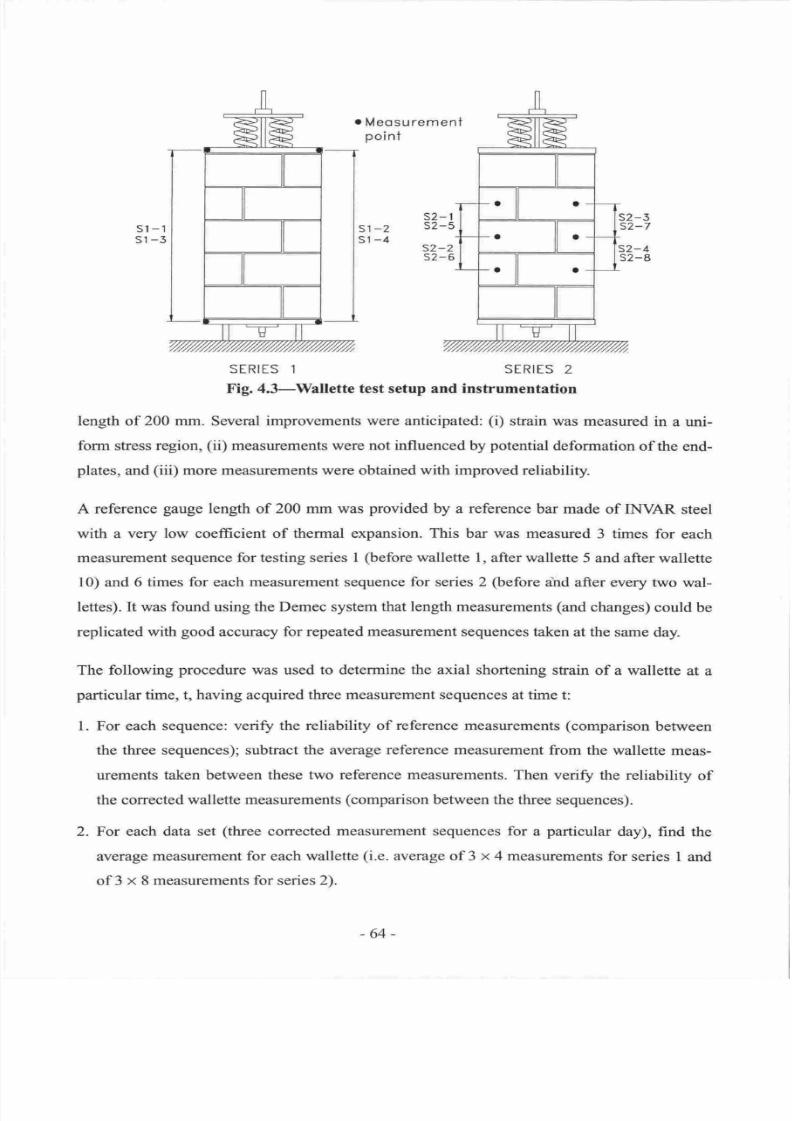
7/21/2019 PHD Laursen-masonry Prestressed Walls
http://slidepdf.com/reader/full/phd-laursen-masonry-prestressed-walls 90/308
.
Meosurement
point
sl
-1
st
-5
s1
-2
sl
-4
s2- 1
s2-5
s2-2
s2-6
s2-5
s2-7
s2-4
s2-8
SERIES 1 SERIES
2
Fig. 4.3-Wallette test setup and instrumentation
length of
200 mm.
Several
improvements were anticipated:
i)
strain was
measured
in
a
uni-
form stress
region,
ii)
measurements were not influenced
by
potential
deformation
of
the end-
plates,
and
iii)
more measurements were obtained
with
improved reliability.
A
reference
gauge
length of
200
mm
was
provided
by a reference
bar made
of INVr\R
steel
with a very
low
coefficient of
thermal expansion. This
bar was measured
3
times
for
each
measurement sequence for testing series
I
before
wallette
l,
after wallette 5
and after
wallette
l0)
and
6
times for
each
measurement sequence for series 2
ftefore
ahd
after every two
wal-
lettes). It was found
using
the Demec system
that length measurements
and
changes)
could
be
replicated
with
good
accruacy
for repeated
measurement
sequences taken
at the
same
day.
The following
procedure
was used
to
determine
the axial
shortening strain
of a wallette
at a
particular
time, t, having acquired three measurement sequences
at
time
t:
l. For each sequence: veriff the reliability
of reference
measurements
comparison
between
the
three
sequences); subtract
the
average
reference measurement
from
the wallette
meas-
urements taken between these two
reference measurements.
Then veriff the reliability
of
the corrected
wallette
measurements
comparison
between the
three sequences).
2.
For
each
data set three corrected
measurement sequences
for
a
particular day),
find
the
average
measurement for each wallette
i.e.
average of 3
x
4 measurements
for
series I and
of 3
x
8 measurements for series
2).
-64-
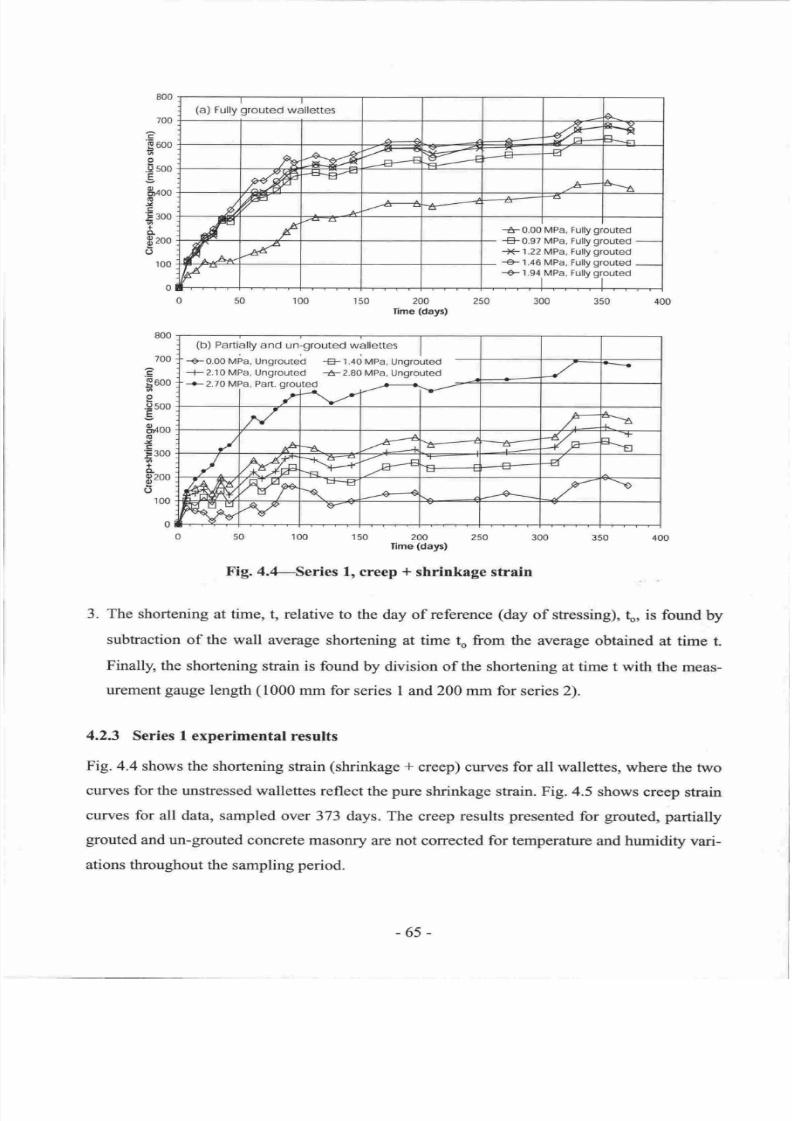
7/21/2019 PHD Laursen-masonry Prestressed Walls
http://slidepdf.com/reader/full/phd-laursen-masonry-prestressed-walls 91/308
800
700
E
ooo
I
.9
500
5
9r+oo
G
.Y
c
E 3oo
+
o
R zoo
o
100
0
800
700
.E
g600
o
.9 500
E
Irqoo
o
x
c
'F
300
z
+
o-
-q200
o
u
100
0
(a)
Fully
grouted
wallettes
s-
#
H
+--
^
M
'-
---84
-d
ffi
-E{
F-
\-._"
1,
F
,-u -/H
{
-6
EE
tA
t
A
tl
+.0.00
MPa, Fully
grouted
+F0.97
MPa,
Fully
grouted
-l<-'t.22
MPa,
Fully
grouted
+
1.46 MPa, Fully
grouted
-O-
l.94,MPa,
Fully grouted
tl
f^.^-
F
tt
0 50 100 150
200
250 300
350 400
lime
(days)
(b)
Partially
and un-grouted wallettes
I
-e-
O.OO MPa,
UngrouteC
-e-
t.+O MPa,
Ungrouted
--F
2.10
MPa,
Ungrouted
-#
2.80 MPa,
Ungrouted
-.-2]O
MPa,
Part.
grouted
-H-
-l
r-n-
-+'--Y
{ | \.'-l
I
ts-x
h/ E
./
p
a
.E
4,/
4r
"_J
----r-
/ MA
--*.
alr--
>---+
-<l
-r
d
E
N&Wr
EJ-fI
\
A
tv'
eF;
ry
o
50 1oo
'150
r,|n"rt8"}'5)
2s0
300
3so 4oo
Fig.4.4-,Series
1,
creep
*
shrinkage strain
3.
The
shortening
at time,
t,
relative
to
the
day
of
reference
(day
of
stressing),
to, is
found
by
subtraction
of
the
wall
average
shortening
at
time
to
from
the average
obtained
at time
t
Finally,
the shortening
shain
is
found by division
of
the shortening at
time
t with
the
meas-
urement
gauge
length
(1000
mm
for series
I
and
200 mm
for series 2).
4.23
Series
I
experimental
results
Fig.
4.4
shows
the shortening
strain
(shrinkage
+
creep) curves
for
all
wallettes,
where
the
two
curves for the
unstressed
wallettes
reflect the
pure
shrinkage strain. Fig. 4.5
shows
creep
strain
curves
for all
data,
sampled
over 373 days.
The creep results
presented
for
grouted,
partially
grouted
and
un-grouted
concrete
masonry
are
not corrected
for
temperature
and
humidity vari-
ations
throughout the
sampling
period.
-65-
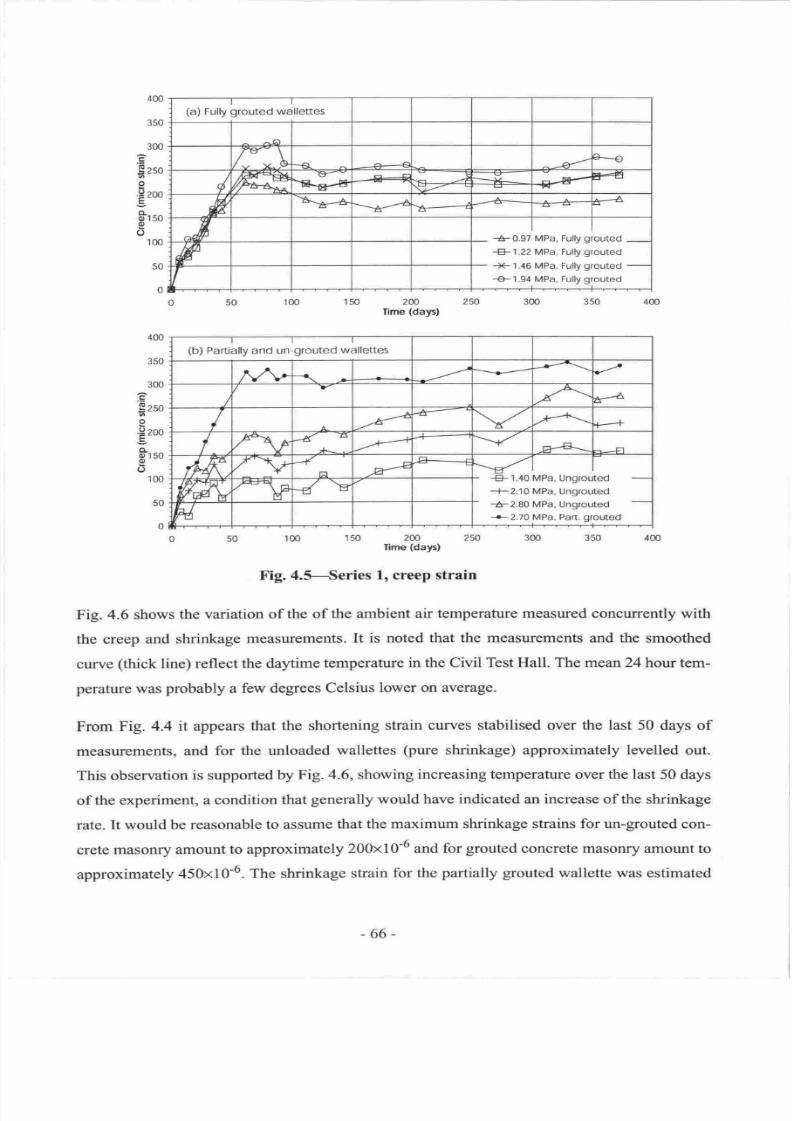
7/21/2019 PHD Laursen-masonry Prestressed Walls
http://slidepdf.com/reader/full/phd-laursen-masonry-prestressed-walls 92/308
400
350
300
c
$zso
I
.9
zoo
E
F'uo
o)
o
100
JU
0
150
200 250
Time
(days)
so
'roo
iso
ri-iffi y.l
25o
Fig.4.5-Series
l,
creep
strain
Fig.
4.6
shows
the
variation of
the
of
the
ambient air
temperature measured
concurrently with
the
creep
and shrinkage
measurements.
It is noted
that the measurements
and
the smoothed
curve
(thick line) reflect
the daytime temperature in the
Civil
Test
Hall.
The
mean 24
hour
tem-
perature
was
probably
a
few
degrees
Celsius
lower on
average.
From Fig.
4.4 it
appears
that
the shortening
strain
curves stabilised over the last
50 days
of
measurements,
and for the
unloaded
wallettes
(pure
shrinkage) approximately levelled
out.
This observation
is supported
by
Fig. 4.6,
showing increasing temperature over
the
last
50
days
of
the experiment,
a
condition
that
generally would
have
indicated
an
increase
of the
shrinkage
rate.
It
would
be reasonable
to
assume
that the
maximum
shrinkage strains
for
un-grouted con-
crete
masonry
amount
to approximately
200x10-6
and
for
grouted
concrete masonry
amount
to
approximately
450x10-6.
Th shrinkage
strain
for the
partially
grouted
wallette was estimated
400
350
300
c
$zso
0
.9zm
E
['uo
o
100
50
0
tl
(a)
Fully
grouted
wallettes
re-- \
/,r
w.-O
-€.
^
J>-'
r-o
d
/tr{'=g
rn&a^*.q
v-
**.E-4|
o------.E
\-,-
.Y
Xn
tsd
-#
-*-*-4
-e---
\---A
Er--
=r
J
-+-0.97
MPa,
Fully
grouted
-€}-1.22
MPa,
Fully
grouted
-X-
1.46
MPa,
Fully
grouted
-€-
1.94
MPa,
Fully
grouted
#
(b)
Paftially
and
un-grouted
wallettes
hrAr,
-\
at'
v'
A/-'
\---4
I
--*-
{
I
{v
-K
z5
*
ffi
lt\
-4
EI F-*
+l-.1.40 MPa, Ungrouted
--F2.10
MPa,
Ungrouted
-e
2.80 MPa,
Ungrouted
+2.7O
MPa. Part.
orouted
-lf
4-E
\t
ad
-66-
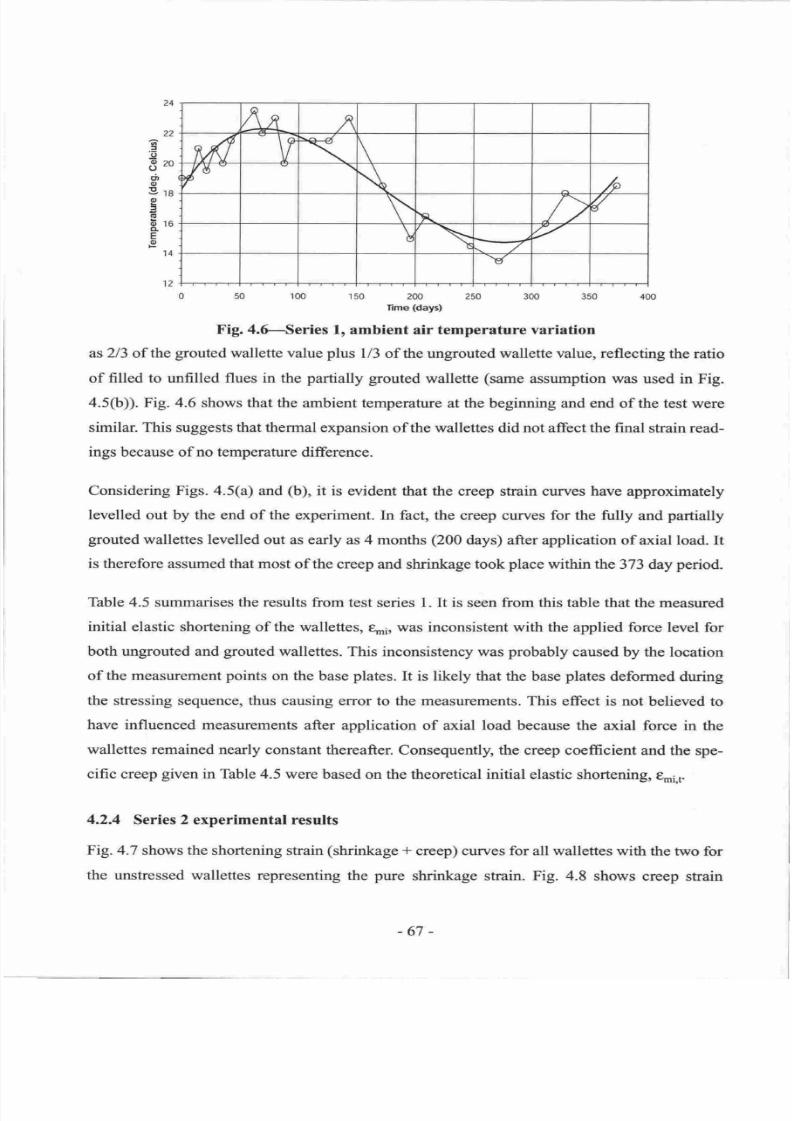
7/21/2019 PHD Laursen-masonry Prestressed Walls
http://slidepdf.com/reader/full/phd-laursen-masonry-prestressed-walls 93/308
M
R
flrtr
,r
u
=(
{6
\ /e
\ R.
r
b
\
-
7
\€f
22
.:
g
-0 20
dt
q,
9rg
o
I
(
bro
E
(,
12
o so 1oo lso
n.iil"*r
25o
3oo 3so
4oo
Fig.4.ASeries
1,
ambient
air
temperature
variation
as
213
of the
grouted
wallette
value plus
l/3
of
the
ungrouted
wallette value, reflecting
the
ratio
of filled to unfilled
flues
in
the
partially
grouted
wallette
(same
assumption was
used
in
Fig.
4.5(b)). Fig. 4.6
shows
that
the ambient temperature
at the beginning
and
end
of
the test were
similar.
This
suggests
that
thermal expansion
of
the
wallettes
did
not
affect
the
final
strain read-
ings
because
of no temperature
difference.
Considering Figs. 4.5(a)
and
(b),
it
is
evident
that
the
creep
strain
curves have
approximately
levelled
out
by
the end
of
the
experiment.
In
fact, the creep curves for the fully
and
partially
grouted
wallettes levelled
out
as
early as 4
months
(200
days) after
application
of axial load. It
is therefore
assumed that
most
of
the
creep and
shrinkage
took
place
within
the373
day
period.
Table 4.5
summarises
the results
from test
series
1.
It
is
seen from
this table that the
measured
initial
elastic shortening
of
the
wallettes,
eni, was
inconsistent
with
the applied force
level
for
both
ungrouted
and
grouted
wallettes.
This inconsistency was
probably
caused
by the location
of
the
measurement
points
on the
base
plates.
It
is
likely
that the
base
plates
deformed
during
the
stressing
sequence,
thus
causing error
to
the measurements.
This
effect
is
not
believed
to
have
influenced measurements
after
application
of axial
load
because the axial force
in
the
wallettes remained nearly constant
thereafter.
Consequently,
the
creep
coefficient
and the
spe-
cific
creep
given
in
Table
4.5
were
based
on
the
theoretical
initial
elastic
shorteningo
en'r
4.2.4
Series 2
experimental
results
Fig.4.7
shows the
shortening
strain
(sbrinkage +
creep) curves for
all
wallettes with
the
two for
the
unstressed wallettes
representing the
pure
shrinkage strain. Fig. 4.8
shows
creep strain
-67
-
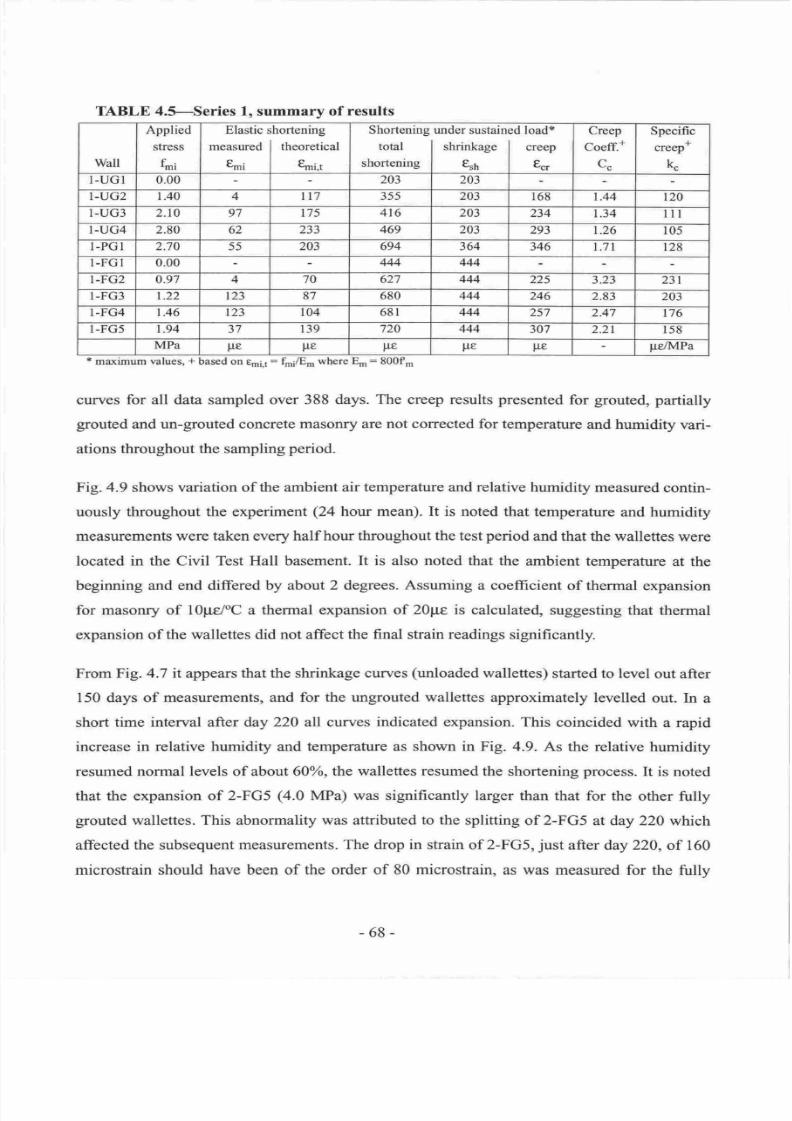
7/21/2019 PHD Laursen-masonry Prestressed Walls
http://slidepdf.com/reader/full/phd-laursen-masonry-prestressed-walls 94/308
TABLE
4.S---Series
1, summary of
results
Wall
Applied
stress
fmi
Elastic
measured
tmi
lhortening
I
theoretical
I
g,,,.,
Shortening under
sustained load*
total
I
shrinkage
shortening
I
t
r,
creep
t ,
Creep
Coeff.+
co
Specific
creep+
kc
I.UGI
0.00
203
203
I.UG2 r.40
4 tt7 355 203
t58
.44
r20
I.UG3 2.t0
97
t75
4t6 203
234
34
ll
I.UG4 2.80 62 233 469 203
293
26
105
I-PGI 2;t0
55
203 694
364 346
7l
128
I-FGI
0.00
444 444
I-FG2 0.97
4
70
627 444
225
3.23
231
I-FG3 t.22
123 87 680 444
246
2.83
203
I-FG4
1.46 t23 104
68r 444 257
2.47 t'76
I-FG5 |.94
37
139
t20
444 307
2.21
r58
MPa
p€ pe p€ p€
pe
pelMPa
f
rased
where
,niEm
Et
curves
for all
data
sampled
over 388
days. The creep results
presented
for
grouted,
partially
grouted
and
un-grouted
concrete masonry
are
not
corrected
for
temperature
and humidity
vari-
ations throughout
the
sampling
period.
Fig.4.9
shows
variation
of the ambient air
temperature and
relative
humidity
measured
contin-
uously
throughout the experiment
(24
hour mean).
It is
noted that temperature
and
humidity
measurements
were
taken
every half
how
throughout
the test period
and
that
the
wallettes
were
located
in
the
Civil
Test
Hall
basement.
It
is
also
noted
that the
ambient
temperature
at the
beginning
and end differed
by
about
2 degrees.
Assuming
a
coefficient
of
thermal
expansion
for
masonry
of
l0pe/ C a
thermal expansion
of 20pe is
calculated,
suggesting that
therrral
expansion
of the wallettes did not affect
the
final
strain readings
significantly.
From
Fig.4.7
it appears
that the shrinkage
curves
(unloaded
wallettes)
started
to level
out after
150 days
of
measurements, and
for
the ungrouted
wallettes
approximately
levelled
out.
In
a
short
time
intenral after day
220 all
curves
indicated
expansion.
This
coincided
with
a rapid
increase
in
relative
humidity
and temperature
as
shown
in Fig.
4.9.
As
the relative
humidity
resumed normal
levels of about
600/o,
the
wallettes
resumed
the shortening
process.
It is noted
that the expansion
of 2-FG5
(a.0
MPa) was
significantly
larger than
that
for
the
other
fully
grouted
wallettes.
This
abnormality
was attributed to the
splitting
of
2-FG5
at day 220
which
affected
the
subsequent
measurements.
The drop
in
strain of 2-FG5,
just
after day
220,
of
160
microstrain
should have been
of the
order
of
80
microstrain,
as was
measured
for the
fully
-68-
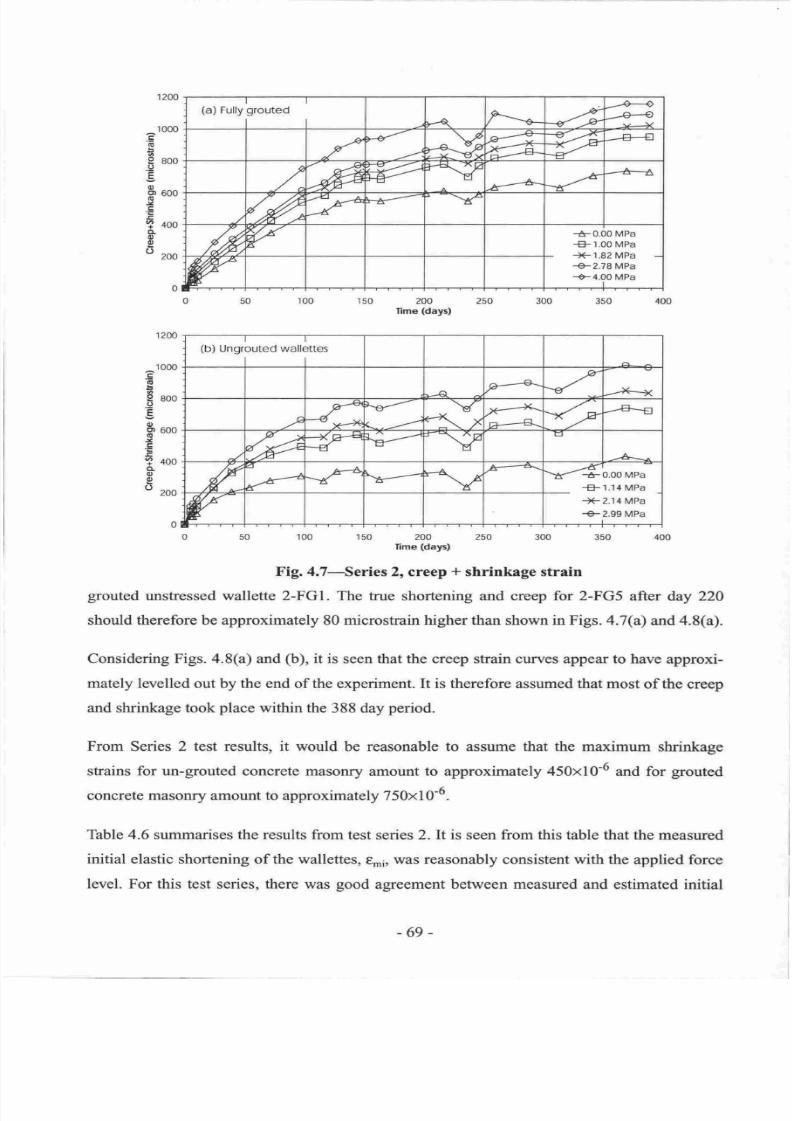
7/21/2019 PHD Laursen-masonry Prestressed Walls
http://slidepdf.com/reader/full/phd-laursen-masonry-prestressed-walls 95/308
1000
F
a
E
.$
eoo
E
6t
o|
600
.t
.g
s
?
loo
o.
o
t,
t
zoo
^100o
.E
5
.$
aoo
E
o)
P
600
.g
c
.tr
?
qoo
rL
o
g
o
zoo
150 200
250
Iime
(days)
350
400
tl
(b)
Ungrouted
wallettes
tl
d
-.6
/
->e--x
.j
f'
4
u--'x
-e--'
-
--'/
V
-\
.*
x____x_
E-----E-
4
--+--g
#
4F'4
--g
V
V
U
f
a*-
A---A
-d
)r-
\
2r-------6\
...*.-{ss6ypu
+F
i
.14 MPa
++
2.14 MPa
€-2.99
MPa
trf
o
so 1oo lso
nrj?i.yrl
250
3oo 35o
4oo
Fig.4.7-,Series
2o
creep
+
shrinkage
strain
grouted
unstressed
wallefte
2-FGl. The
true shortening and creep
for 2-FG5
after
day 220
should therefore
be
approximately
80
microstrain higher than
shown
in Figs.
.7@)
and
4.8(a).
Considering
Figs.
a.8(a)
and
(b),
it
is
seen
that the creep
strain
curves
appear
to
have
approxi-
mately
levelled
out by the end of the experiment.
It
is therefore
assumed
that most
of
the
creep
and
shrinkage
took
place
within
the 388
day
period.
From
Series 2 test results,
it
would
be
reasonable to assume that the
morimum shrinkage
stains for un-grouted concrete masonry
amount
to
approximately
450x10-6
and
for
grouted
concrete masonry amount to approximately
750x10-6.
Table
4.6
summarises the results
from
test
series
2.
It
is
seen
from
this table that the measured
initial
elastic shortening of the wallettes,
rr;,
was reasonably consistent
with
the
applied force
level. For
this test series, there was
good
agreement
between measured
and estimated
initial
1200
(a)
Fully
grouted
I
14.
h=*-
--4
--ffi
t'*
-qt'
fv
# #
--H
,/,
'#
w
ry
s---- -
-1
-_-t_rA
ffi
?
-{
>a-
&'
Tt
-*-0.00
MPa
+F1.00 MPa
+e1.82
MPa
-e-2.78
MPa
+-,+.0OMPa
W
-69-
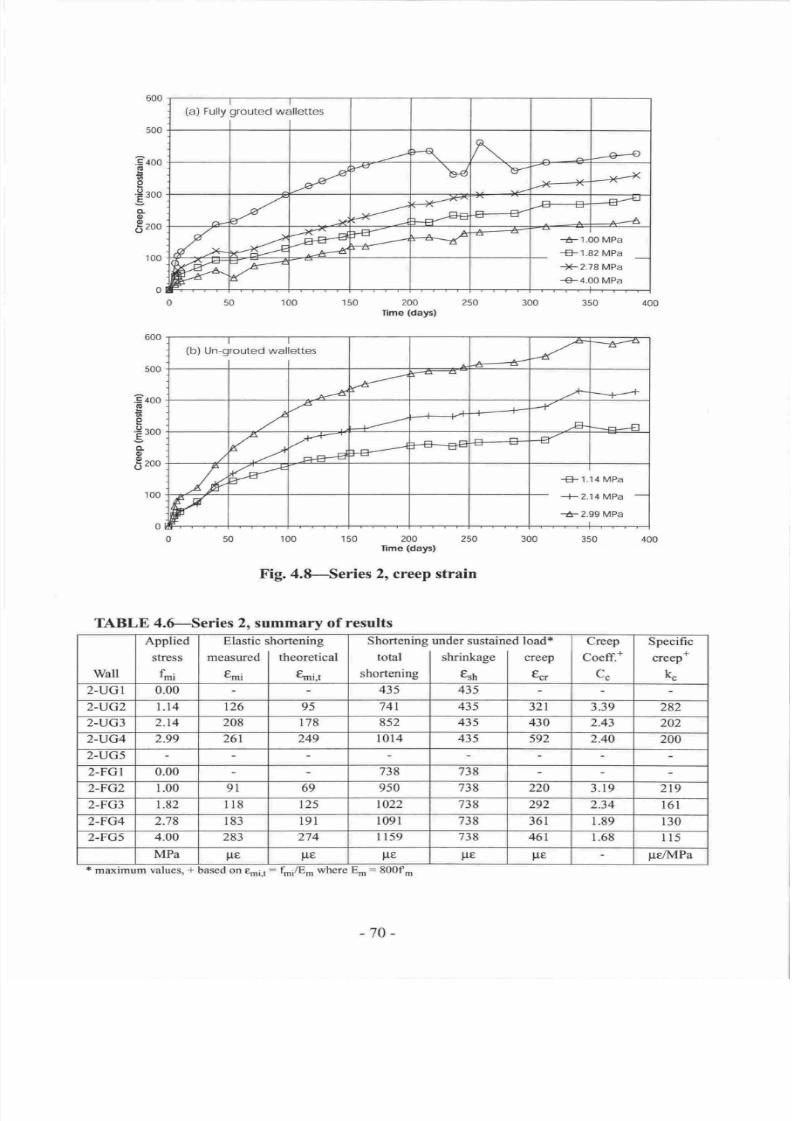
7/21/2019 PHD Laursen-masonry Prestressed Walls
http://slidepdf.com/reader/full/phd-laursen-masonry-prestressed-walls 96/308
600
500
F+oo
(
I
.=
300
E
;
o
$
zoo
'100
0
600
500
Fcoo
o
d
e
€
roo
o
o
$
zoo
'100
0
lime
(days)
tl
(b)
Un-grouted
wallettes
I
-r
^r
---*.-...Z\
,---a
4=-
.+
--_t---+
,l
f
-*'---
,}
L
-{
-B
---E--€
,r
a#
f
E
-g'
lw
{;r"*
-€F
1.14 MPa
--F
2.
14
MPa
-*-
2.99 MPa
Y
0 50 100
r50 200 250
300 350
400
lime
(daF)
Fig.4.8-Series
2, creep strain
lues,
+
3se4 on
eni.r:
fmiEm
where Ern:
800f,
(a)
Fully grouted
wallettes
I
4.
\
--e---O
*"*
J4
\d
)e-
-#
)<-'4
/
-x
"*t'
")<'^
-rEE
H
-tr|-Ff
/^
-#
-)<^
-EE--z
J\"'A
r{
-A'-
-*-^/
fr-
rA- 1.00 MPa
{F1.82
MPa
-X-2.78
MPa
-+-4.00
MPa
r
-F
0 50
100 150 200 250
300
350
400
TABLE
4.HSeries
2,
summary of
results
Wall
Applied
stress
fmi
Etastic
measured
grni
hortening
theoretical
Qni,r
Shortening
total
shortening
under sustainr
shrinkage
€sh
ld load*
creep
ecr
Ureep
Coeff.+
cc
Specific
creep*
kc
2-UG1
0.00
435 435
2-UG2 l.14
t26
95
741 435
321 3.39
282
2-UG3
2.14 208 t78 852
435
430 2.43
202
2-UG4
2.99 261 249
l0t4
435
592 2.40
200
2-UG5
2-FGI 0.00
738 738
2-FG2
1.00 9l 69
950 738 220
3.19 219
2-FG3
1.82
It8
125
t022 738
292
2.34
t6l
2-FG4
2.78
183 l9l l09l 738 361
1.89
r30
2-FGs 4.00 283 274
I 159 738
46r l.68
lt5
MPa
p€ p€
lre
pe
p€
pe/MPa
a
tased
where
-70-
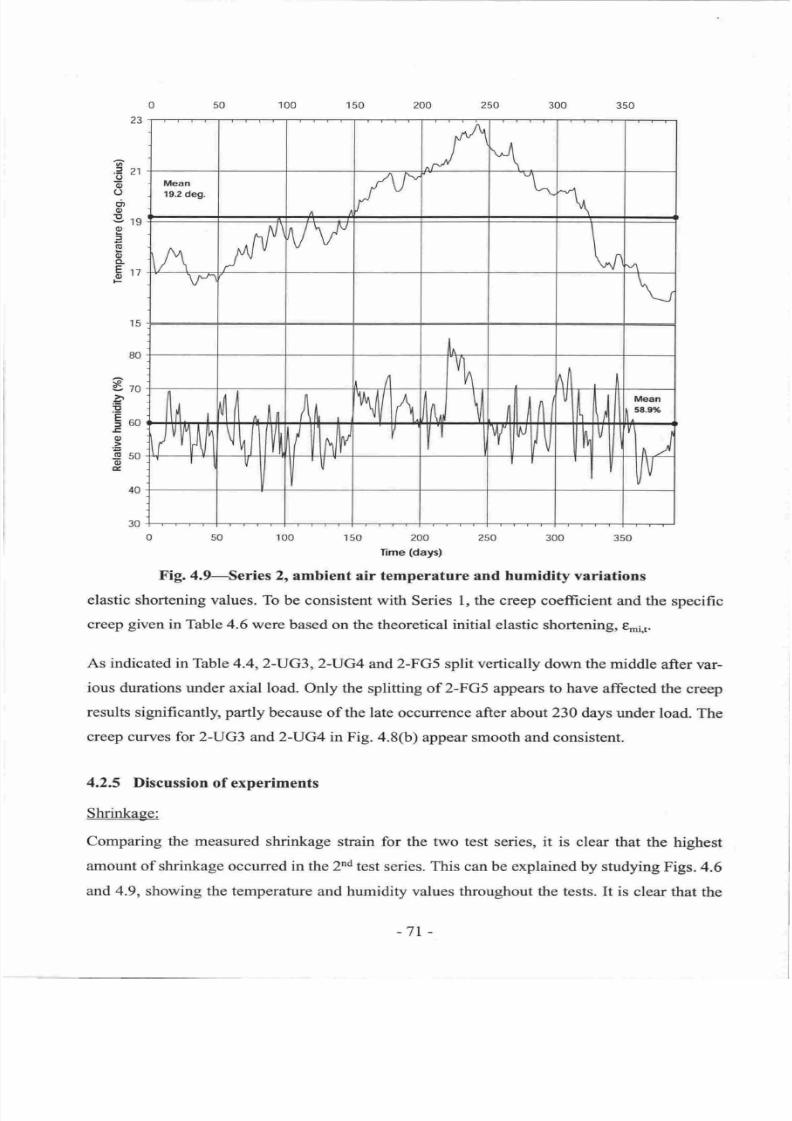
7/21/2019 PHD Laursen-masonry Prestressed Walls
http://slidepdf.com/reader/full/phd-laursen-masonry-prestressed-walls 97/308
0
s0 100
150 200
250
300
350
t^r\
Mean
19.2
deg.
lv
L.
*'1
\
^4
vv
\,
t
\j
l^
A
n
r\
r/\
/l,r
ill
il
^
An W A
I
l/l.
I
I
l'
t]
/l nr
\l
J
Jt/ban
58.9%
/ul'li\
\lh
tl
|llh/h'
u
1r
ll./
l\i
|/il
il
'l
^,
1/
'll
I
|/V
0 50
'ro0
150 200 250
300 350
Time
(days)
Fig.
4.9-Series
2,
ambient air temperature
and
humidity variations
elastic shortening
values. To be consistent with
Series
l, the creep
coefficient
and the specific
creep
given
in
Table
4.6 were based
on the theoretical initial
elastic shortening,qr,i.t.
As
indicated
in
Table
4.4,2-UG3,2-UG4
and
2-FG5 split
vertically
down the
middle
after var-
ious
durations under
axial
load.
Only
the splitting
of
2-FG5
appears
to
have
affected
the
creep
results
significantly,
partly
because
of the late
occurrence
after about 230
days
under
load.
The
creep curves
for
2-UG3
and
2-UG4
in
Fig. 4.8(b)
appear
smooth
and
consistent.
4.2.5
Discussion
of experiments
Shrinkage:
Comparing the
measured shrinkage
strain for
the
two
test series,
it is
clear that
the
highest
amount
of shrinkage occurred in
the 2nd
test series.
This
can
be explained by studying
Figs.4.6
and
4.9, showing the temperature
and
humidity
values throughout the tests.
It
is
clear
that
the
23
.2
21
o
E
a
ct
o
9rg
(1,
f
o
q,
CL
E 1
o
80
a
:)70
E
tr
i60
E
o)
-g
50
o
c
40
15
-7r
-
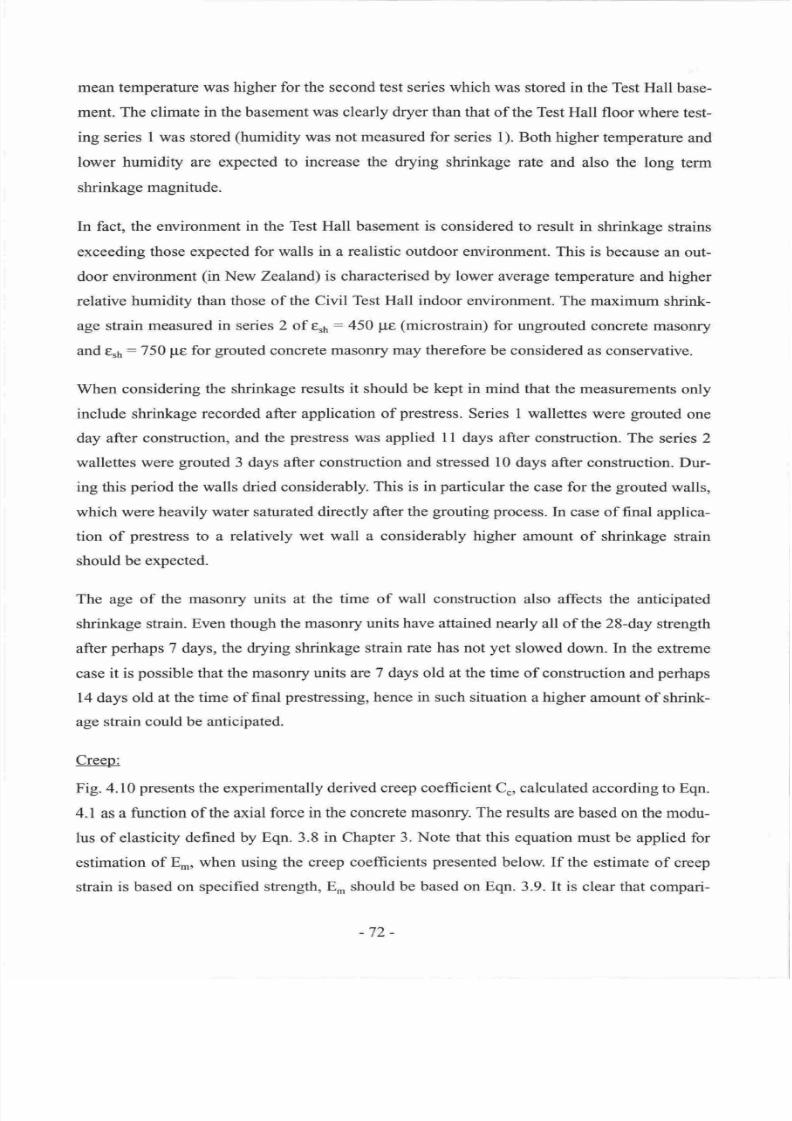
7/21/2019 PHD Laursen-masonry Prestressed Walls
http://slidepdf.com/reader/full/phd-laursen-masonry-prestressed-walls 98/308
mean temperature was higher
for
the
second
test
series which
was
stored in
the
Test
Hall base-
ment.
The
climate in
the
basement
was
clearly dryer than
that
of
the
Test
Hall floor
where
test-
ing
series
I
was stored
humidity
was
not
measured
for
series
l). Both
higher
temperature
and
lower
humidity
are
expected
to
increase
the
drying
shrinkage
rate
and also
the
long
term
shrinkage magnitude.
ln fact, the
environment in the Test Hall
basement
is
considered
to
result in shrinkage
strains
exceeding those
expected
for walls in a realistic outdoor
environment.
This
is because
an out-
door environment
in
New
Zealand)
is
characterised
by lower
average
temperature
and
higher
relative
humidity
than those
of
the
Civil
Test
Hall indoor environment.
The
maximum
shrink-
age
strain
measured
in
series
2 of
er6
:
450 pe microstrain)
for
ungrouted
concrete
masoffy
and
tr6
:750
lre
for
grouted
concrete
masonry may therefore
be
considered
as
conservative.
When
considering the
shrinkage
results
it
should be
kept
in mind that
the measurements
only
include
shrinkage recorded
after application of
prestress.
Series I
wallettes were
grouted
one
day after
construction,
and
the
prestress
was
applied
I
I days
after
construction. The
series
2
wallettes
were
grouted
3 days
after construction
and
stressed
l0
days
after
construction. Dur-
ing this
period
the
walls
dried considerably.
This
is
in
particular
the
case
for
the
grouted
walls,
which
were
heavily
water
saturated directly
after
the
grouting
process.
In case
of
final
applica-
tion
of
prestress
to
a relatively
wet wall a considerably higher
amount of shrinkage
strain
should
be
expected.
The age
of the mason-ry units
at the time of wall
construction
also affects the
anticipated
shrinkage strain.
Even though
the
masonry units
have
attained nearly
all of
the 28-day
strength
after
perhaps
7 days,
the
drying
shrinkage
strain
rate
has not
yet
slowed
down. In
the
exteme
case it is
possible
that the
masoffy
units are
7
days
old
at
the
time
of construction
and
perhaps
14
days
old
at
the
time
of
final
prestressing,
hence
in
such situation
a
higher
amount
of shrink-
age
strain
could
be anticipated.
Creep:
Fig.4.10
presents
the
experimentally
derived
creep
coefficient
C., calculated
according
to Eqn.
4.1
as a function of
the
axial force
in
the
concrete masonry. The results
are
based
on the modu-
lus
of
elasticity
defined by
Eqn. 3.8 in
Chapter
3.
Note that
this
equation must
be applied
for
estimation of
E*
when using the
creep
coefficients
presented
below.
If
the
estimate
of creep
strain is based on
specified
strength,
E should
be
based on
Eqn.
3.9.
It is
clear
that
compari-
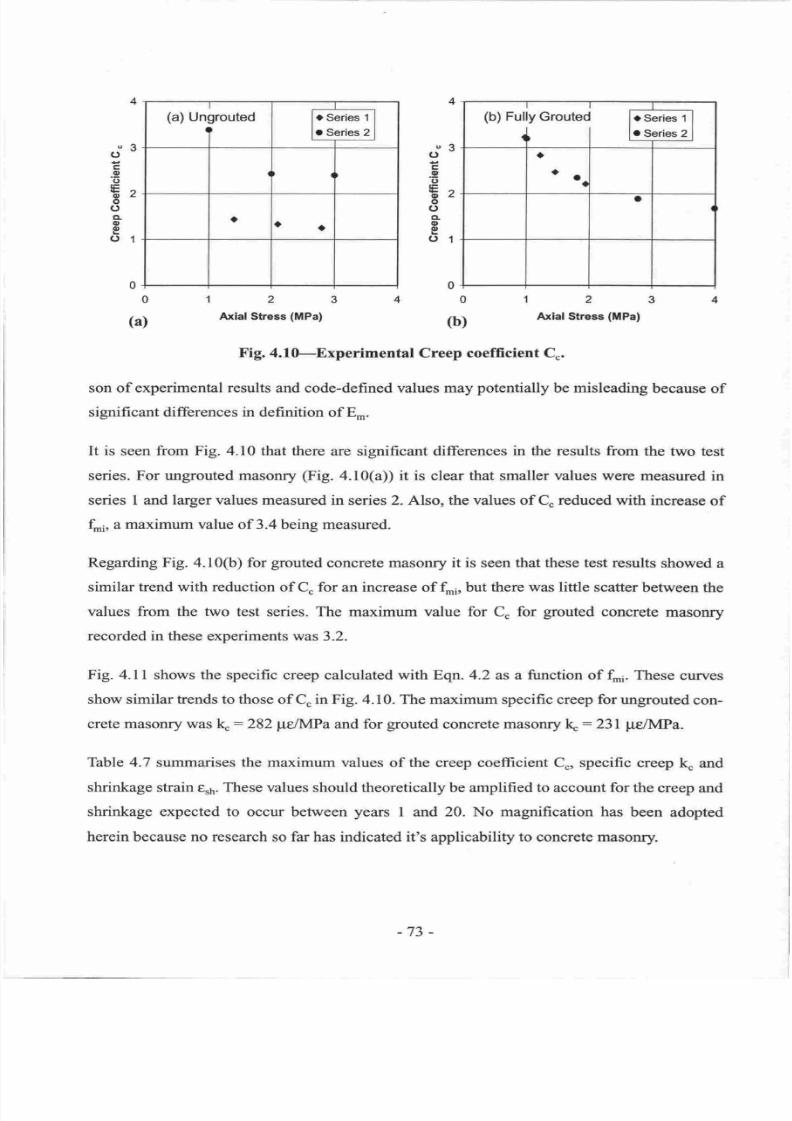
7/21/2019 PHD Laursen-masonry Prestressed Walls
http://slidepdf.com/reader/full/phd-laursen-masonry-prestressed-walls 99/308
o3
C'
c
-9
t
G
6A
o
o
CL
o
E
o1
o3
(t
c
o
a,
Ea
o.
0
o
CL
o
E
(,1
(a)
Ungrouted
T
F
sr *'Tl
lo
Series
2
|
o
)
a
(b)
Fully
Grouted
I
t
FS-GI
lo
Series
2
|
o
oa
a
0
(a)
123
Arial
Stress
(MPa)
40123
(b)
Atlal
Stress
(ilPa)
Fig.
4.l0-Experimental
Creep
coefficient Cc.
son of
experimental
results
and code-defined
values
may
potentially
be
misleading
because
of
significant differences
in
definition
of
En.,.
It is seen from Fig.
4.10
that there
are
significant
differences
in
the results
from
the
two
test
series.
For ungrouted masonry
(Fig.
a.l0(a)) it
is
clear
that
smaller
values
were measured
in
series
I
and
larger values measured
in
series 2.
Also,
the
values
of
C
reduced
with
increase
of
fi;,
a
maximum value of 3.4 being
measured.
Regarding
Fig. 4.10(b)
for
grouted
concrete masonry it
is
seen
that
these
test results
showed
a
similar trend
with
reduction
of C.
for
an
increase of f.', but
there
was little
scatter
between
the
values from the two
test series.
The maximum value
for
C
for
grouted
concrete
masonry
recorded in
these
experiments was 3.2.
Fig.
4.1 I
shows the specific
creep calculated
with
Eqn. 4.2
as
a function
of
Li.
These
curves
show similartrends
to
those
of
C
in Fig.
4.10. The maximum specific creep forungrouted
con-
crete
masonry was
l< :282
pr/MPa
and for
grouted
concrete masonry
I\:231
pe/MPa.
Thble
4.7
summarises the maximum values
of the
creep coefficient C , specific
creep
h
and
shrinkage strain
€.1.
These values
should theoretically
be
amplified to account
for
the
creep
and
shrinkage expected
to
occur
between
years
I
and 20. No magnification
has
been
adopted
herein
because
no
research so
far
has
indicated
it's
applicability
to concrete masonry.
-73
-
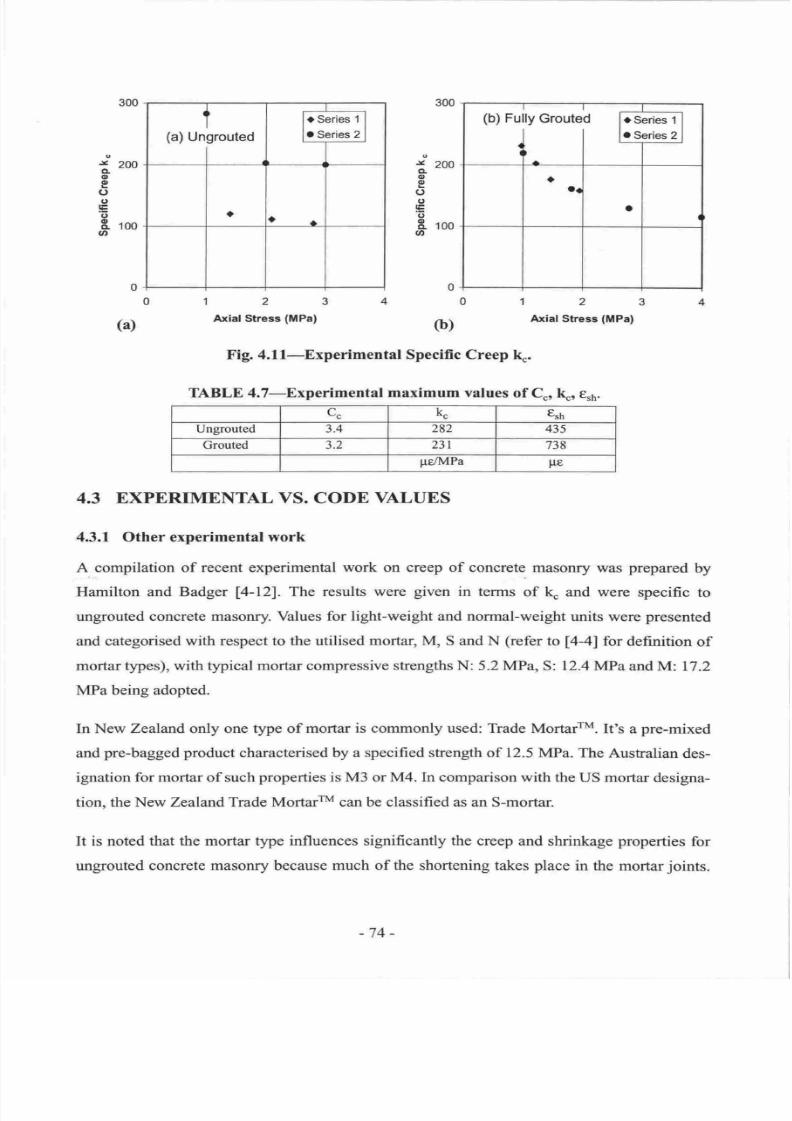
7/21/2019 PHD Laursen-masonry Prestressed Walls
http://slidepdf.com/reader/full/phd-laursen-masonry-prestressed-walls 100/308
(a)
Un
grouted
rS
.s
eries 1
eries
2
o
a
30000
o
v
200
CL
o
E
o
(,
E
(,
t roo
a
g
t
200
IL
o
E
(,
o
rtr
(,
&
roo
(t
2
Arial Stress
(MPa)
2
At<ial
Stress
(MPa)
o)
a)
Fig. 4.ll-Experimental Specific Creep
lq.
TABLE 4.7-Experimental
maximum
values
of Cr,lt,
€rr,.
cc
kc
tsh
Ungrouted
3.4 282
43s
Grouted
3.2
231
738
pe/IvlPa
tl€
4.3
EXPERIMENTAL
VS. CODE VALUES
4.3.1 Other experimental
work
A compilation of
recent experimental
work
on
creep
of concrete.
masonry
was
prepared
by
Hamilton and
Badger
14-121.
The
results
were
given
in
terms
of k and were
specific
to
ungrouted
concrete masonry. Values
for light-weight
and normal-weight
units were
presented
and categorised
with
respect to the
utilised
mortar,
M, S and
N
(refer
to
[4-4]
for definition
of
mortar types),
with
typical mortar
compressive
strengths
N:
5.2
MPa, S:
I2.4MPaand
M:
17.2
MPa being
adopted.
In New
Zealand
only one
type
of
mortar
is
commonly
used: Trade MortarrM.
It's
a
pre-mixed
and
pre-bagged
product
characterised by
a
specified strength
of 12.5
MPa. The
Austalian
des-
ignation for mortar of
such
properties
is
M3
or
M4.
In comparison
with
the
US mortar
designa-
tion,
the New Zealand Trade
Mortarru can be
classified
as an
S-mortar.
It
is noted
that
the mortar
type influences significantly the creep
and shrinkage
properties
for
ungrouted
concrete masonry
because
much
of
the
shortening takes
place
in
the
mortar
joints.
(b)
Fully
Groute
l
?^
d
.S
.s
rrie
1
sries
2
a
a
-74-
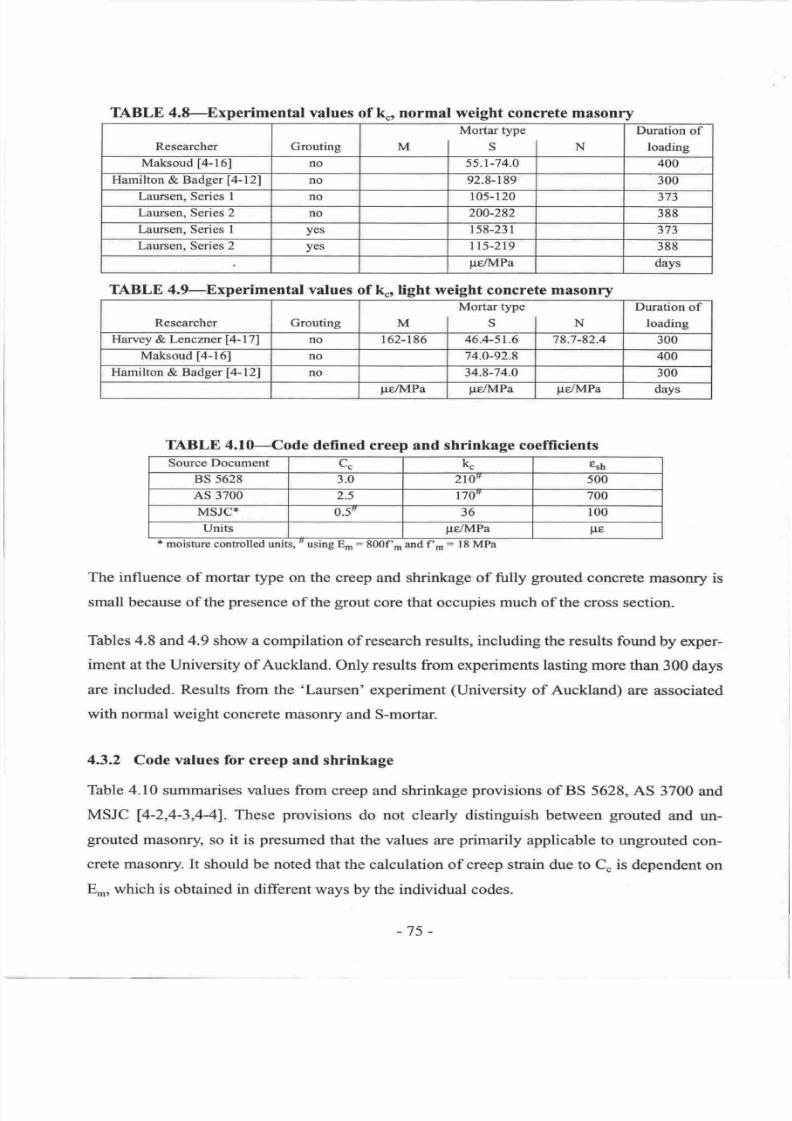
7/21/2019 PHD Laursen-masonry Prestressed Walls
http://slidepdf.com/reader/full/phd-laursen-masonry-prestressed-walls 101/308
TABLE 4.8-Experimental
values
of
k,, normal weight
concrete
masonry
Researcher Grouting
Mortar type
Mlslu
Duration
of
loading
Malaoud [4-16]
no 55.1-74.0 400
Hamilton
&
Badger
[4-12]
no
92.8-
189
300
Laursen, Series I no
105-120
373
Laursen, Series
2
no
200-282
388
Laursen,
Series
I
yes
l
58-23
r
373
Laursen. Series
2
yes
115-219
388
pre/MPa
days
TABLE 4.9-Experimental
values
of
k.,
light weight
concrete masonrT
Researcher
Grouting
Mortar rype
MlslN
Duration
of
loading
Harvey
&Lencmer14-17) no 162-186 46.4-51.6
78.7-82.4
300
Maksoud
[4-16]
no
74.0-92.8 400
Hamilton
&
Badger
[4-12]
no
34.8-74.0
300
pe/MPa
Fe/MPa
pelMPa
days
TABLE
4.10-Code
defined creep and
shrinkage
coefficients
Source Document
cc
kc
€sh
BS
5628 3.0 210,
500
AS
3700
)5
r
70
700
MSJC,r
0.5
36
100
Units
pe/MPa
F€
I
moisture controlled units,
o
using
E
:800f'm
and
f'-:
l8
MPa
The inlluence
of
mortar type on the creep
and shrinkage
of fully
grouted
concrete
masonry
is
small
because
of
the
presence
of
the
grout
core that occupies
much
of
the
cross
section.
Tables
4.8
and
4.9
show
a
compilation of
research
results, including
the
results
found
by exper-
iment
at
the
University of Auckland. Only
results
from
experiments lasting more than 300
days
are included. Results
from the
'Laursen'
experiment
(University
of Auckland)
are
associated
with
normal weight concrete masonry
and
S-mortar.
4.3.2
Code values
for
creep
and
shrinkage
Table 4.10
summarises values
from
creep and shrinkage
provisions
of BS 5628,4,5
3700 and
MSJC
f4-2,4-3,441.
These
provisions
do not clearly distinguish
between
gouted
and
un-
grouted
masonry,
so
it
is
presumed
that
the values are
primarily
applicable
to
ungrouted
con-
crete masonry.
It
should be noted that the
calculation
of
creep
strain due to
C.
is
dependent
on
E*,
which is
obtained in different
ways by the
individual codes.
-75
-
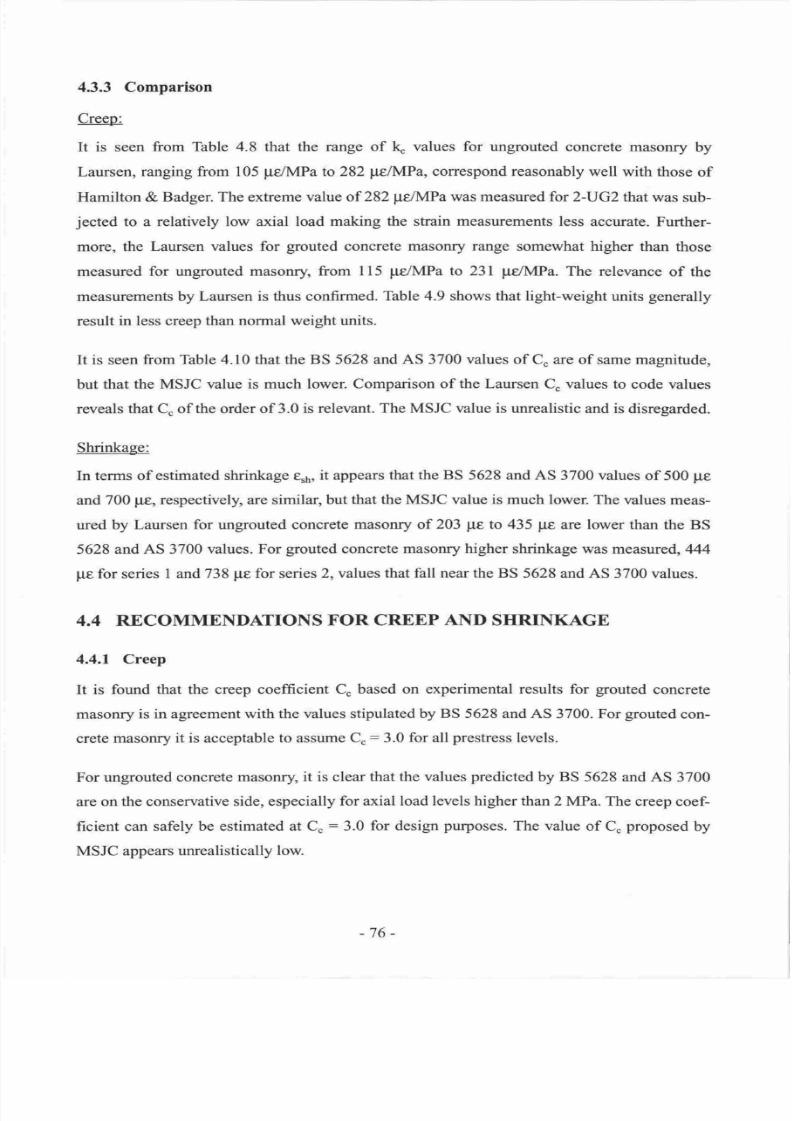
7/21/2019 PHD Laursen-masonry Prestressed Walls
http://slidepdf.com/reader/full/phd-laursen-masonry-prestressed-walls 102/308
4.3.3 Comparison
Creep:
It is
seen
from
Thble
4.8
that
the
range
of
k
values
for
ungrouted concrete
masonry
by
Laursen,
ranging
from
105
gs/MPa
to
282
pe/MPa,
correspond reasonably
well with
those
of
Hamilton
&
Badger. The extreme value
of
282
pr/MPa
was
measured
for
2-UG2 that
was
sub-
jected
to a relatively low axial
load
making
the strain measurements less
accurate. Further-
more, the
Laursen values
for
grouted
concrete
masonry range
somewhat
higher
than
those
measured
for
ungrouted masonry,
from
ll5
F€/MPato
231
pdMPa.
The
relevance
of
the
measurements by Laursen
is thus
confirmed.
Thble
4.9
shows
that
light-weight
units
generally
result
in less creep
than normal
weight
units.
It is seen
from
Table 4.10 that the BS 5628
and AS
3700 values
of
C
are
of same
magnitude,
but
that
the MSJC value is much lower.
Comparison
of
the Laursen
C
values
to code values
reveals
that
C
of the order
of
3.0
is
relevant.
The MSJC value is
unrealistic
and
is
disregarded.
Shrinkage:
In
terms
of
estimated
shrinkage
e,1,
it
appears
that the BS 5628
and AS 3700 values
of
500
pe
and
700 p€, respectively,
are
similar,
but that the MSJC value is
much
lower. The
values meas-
ured
by
Laursen
for
ungrouted
concrete masonry
of
203
pe
to
435
pE
are lower
than the BS
5628
and AS
3700
values. For
grouted
concrete masonry higher
shrinkage was measured,,4M
Us
for
series
I and
738
pe
for series
2,
values
that fall
near
the BS
5628
and
AS 3700
values.
4.4 RECOMMENDATIONS
FOR CREEP
AND
SHRINKAGE
4.4.1
Creep
It is found
that
the
creep
coefficient C.
based
on
experimental results
for
grouted
concrete
masonq/
is in
agreement
with
the values stipulated
by BS
5628
and
AS 3700. For
grouted
con-
crete masonry
it is
acceptable
to
assume
C :3.0 for
all
prestress
levels.
For ungrouted
concrete masonry,
it is clear that
the values
predicted
by BS
5628
and
AS
3700
are on
the conservative
side,
especially
for axial load levels higher than2
MPa
The
creep
coef-
ficient
can
safely
be estimated
at C
:
3.0
for
design purposes.
The value
of
C proposed
by
MSJC
appears
unrealistically
low.
-76-
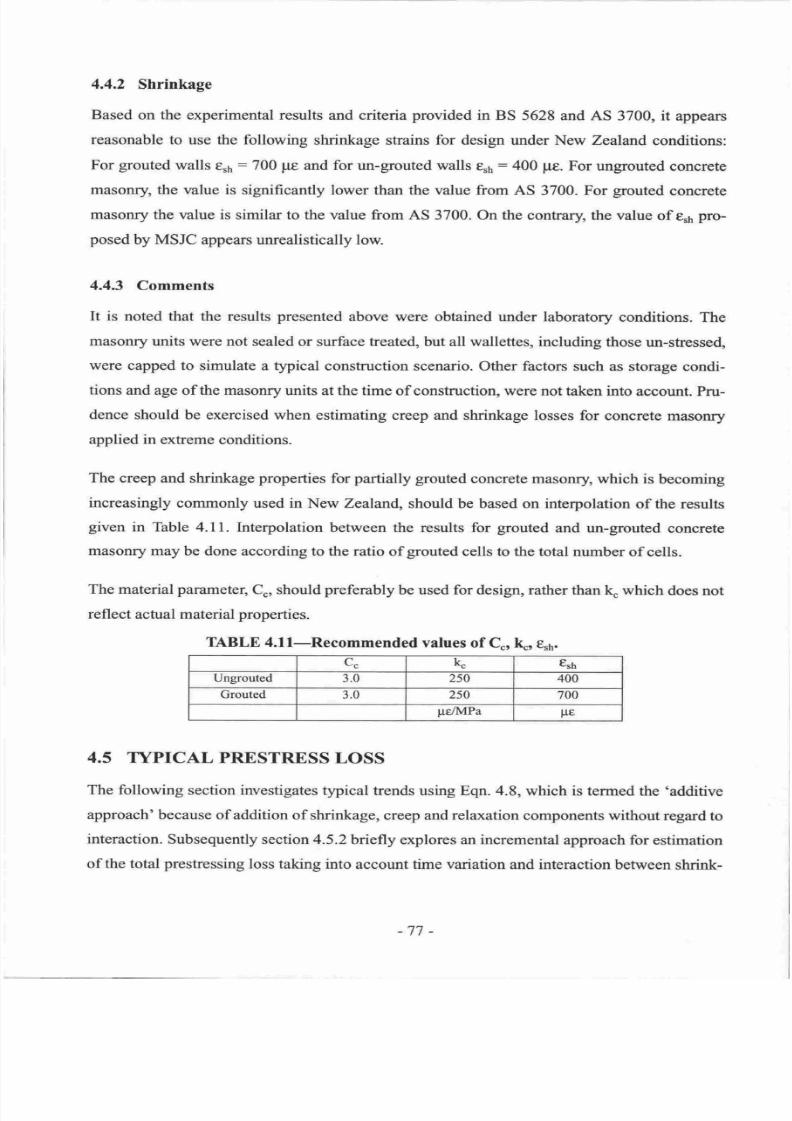
7/21/2019 PHD Laursen-masonry Prestressed Walls
http://slidepdf.com/reader/full/phd-laursen-masonry-prestressed-walls 103/308
4.4.2
Shrinkage
Based
on the experimental results
and
criteria
provided
in
BS
5628
and AS
3700,
it
appears
reasonable
to
use the
following
shrinkage strains
for
design under
New
Zealand
conditions:
For
grouted
walls
t
6
:
700
UE
and
for
un-grouted walls
q6
:400
pe. For ungrouted
concrete
masonry,
the
value
is significantly
lower than the value
from AS
3700. For
grouted
concrete
masoffy
the
value is similar
to the value
from
AS 3700.
On the contrary,
the value
of er6
pro-
posed
by MSJC
appears
unrealistically low.
4.4.3
Comments
It
is
noted
that
the results
presented
above
were
obtained under laboratory
conditions. The
masonry
units were not
sealed
or surface treated, but
all
wallettes,
including
those
un-stressed
were
capped
to
simulate
a
typical
construction
scenario. Other factors
such
as
storage
condi-
tions
and age
of
the
masonry
units
at the
time of construction, were
not taken into
account. Pru-
dence should be
exercised when
estimating
creep
and shrinkage
losses
for
concrete
masonry
applied
in
extreme conditions.
The creep
and
shrinkage
properties
for
partially
grouted
concrete masonry,
which
is becoming
increasingly commonly
used
in
New Zealand,
should be
based
on interpolation
of
the results
given
in
Table
4.11. Interpolation
between
the
results
for
grouted
and un-grouted
concrete
masonry may
be done according
to
the ratio
of
grouted
cells to the
total number
of cells.
The
material
parameter,
C., should
preferably
be
used for
design, rather
than
k
which
does
not
reflect
actual material
properties.
TABLE
4.ll-Recommended
values
of
C ,
hr
r,n.
cc
kc
tsh
Ungrouted 3.0 250
400
Grouted
3.0 250
700
pe/MPa
pe
4.5 TYPICAL PRESTRESS
LOSS
The
following
section investigates
typical
trends using Eqn. 4.8,
which
is
termed the
'additive
approach'
because
of addition
of
shrinkage,
creep and
relaxation components
without regard
to
interaction.
Subsequently
section 4.5.2
briefly
explores
an
incremental
approach for estimation
of
the
total
prestressing
loss
taking
into
account
time variation
and interaction
between
shrink-
-7't -
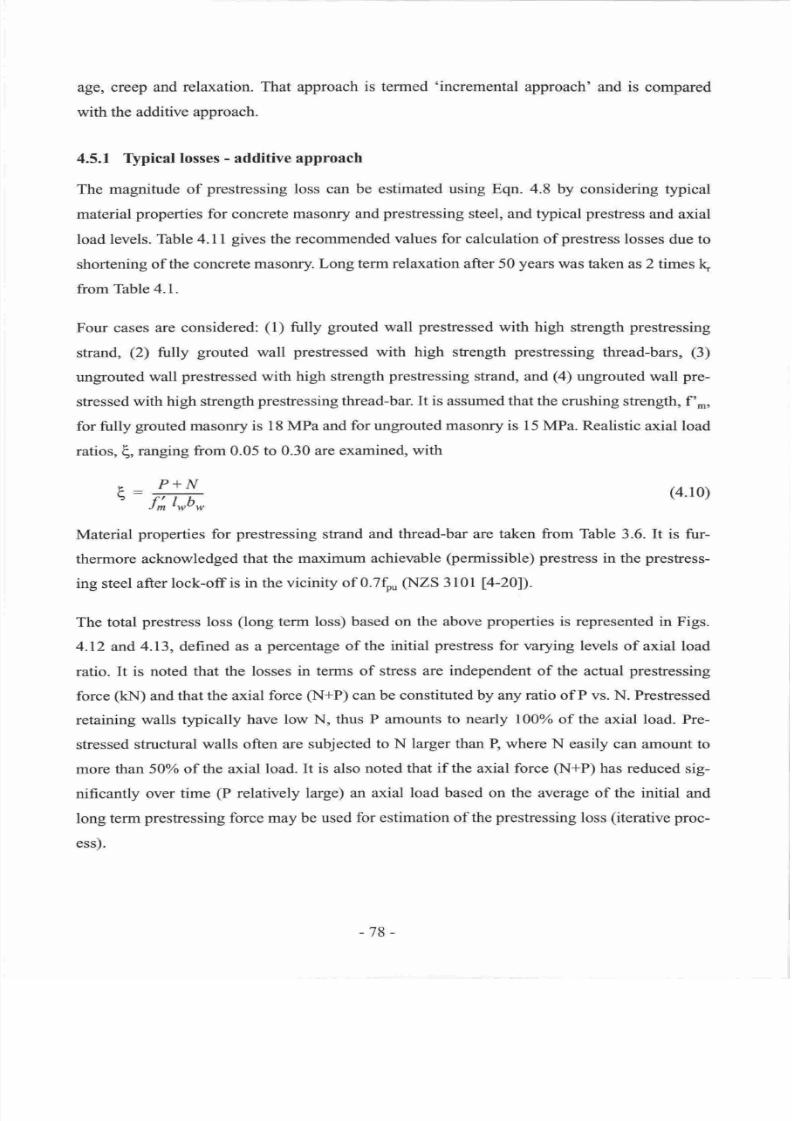
7/21/2019 PHD Laursen-masonry Prestressed Walls
http://slidepdf.com/reader/full/phd-laursen-masonry-prestressed-walls 104/308
age, creep
and relaxation. That approach
is termed
'incremental
approach' and is
compared
with the additive approach.
4.5.1
Tlpical
losses
-
additive approach
The magnitude of
prestressing
loss can be estimated using Eqn. 4.8 by considering
typical
material
properties
for concrete masoffy
and
prestressing
steel, and typical
prestress
and axial
load
levels.
Thble 4.11
gives
the recommended
values for calculation
of
prestress
losses due to
shortening
of the
concrete masoffy.
Long term relaxation after 50
years
was taken as
2 times lq
from
Table
4.1.
Four
cases
are
considered:
(1)
fully
grouted
wall
prestressed
with
high
strength prestressing
strand,
(2)
fully
grouted
wall
prestressed
with high strength
prestressing
thread-bars,
(3)
ungrouted
wall
prestressed
with high strength
prestressing
strand,
and
(a)
ungrouted wall
pre-
stressed
with high strength
prestressing thread-bar. It
is
assumed that the crushing
strength,
f'r,
for
fully
grouted
masonry is l8
MPa and forungrouted
masonry is l5
MPa. Realistic
axial load
ratios,
(,
ranging
from
0.05
to 0.30 are
examined,
with
E
_
P+N
t-
Jffi
(4.10)
Material
properties
for
prestressing
strand
and thread-bar are taken from Table
3.6.
It
is fur-
thermore
acknowledged
that the maximum
achievable
(permissible)
presfress
in
the
prestress-
ing steel after
lock-off
is
in the
vicinity of
0.7f,
(NZS
3 101
[4-20D.
The total
prestress loss
(long
term
loss)
based
on the above
properties
is represented
in Figs.
4.12 and
4.13, defined
as a
percentage
of
the
initial
prestress
for varying
levels of
axial load
ratio.
It
is noted that the losses
in terms of
stress are independent
of
the
actual
prestressing
force
(kN)
and
that the axial
force
(N+P)
can be constituted by any ratio of P vs. N. Prestressed
retaining
walls typically
have low
N, thus P amounts to
nearly
100% of the
axial
load.
Pre-
stressed
strucfural
walls often are
subjected
to
N larger than
R
where
N easily
can
amount to
more than
50Yo of the axial
load. It is also
noted
that
if
the
axial force
(N+P)
has reduced
sig-
nificantly
over time
(P
relatively
large) an axial
load based on the
average
of the initial and
long term
preshessing
force may be
used
for
estimation
of the
prestressing
loss
(iterative
proc-
ess).
-78-
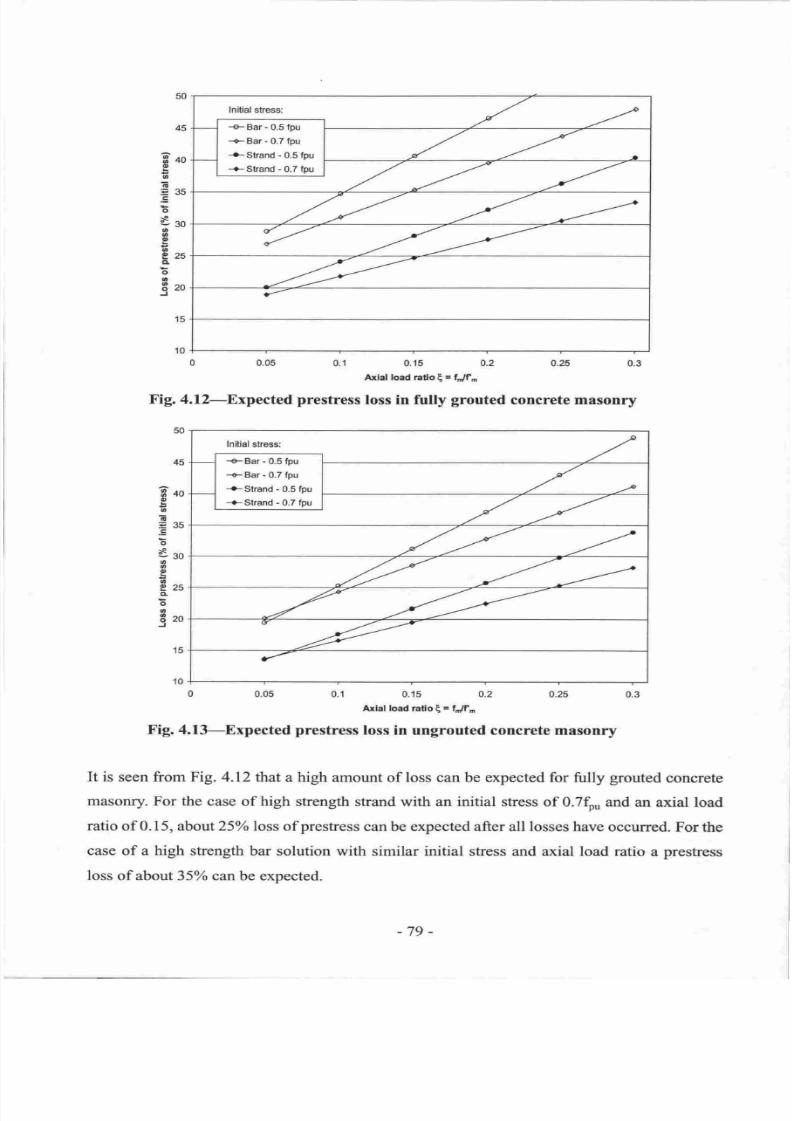
7/21/2019 PHD Laursen-masonry Prestressed Walls
http://slidepdf.com/reader/full/phd-laursen-masonry-prestressed-walls 105/308
+.Bar
-
0.5 fpu
-+.Bar
-
0.7 fpu
-+Sband
-
0.5 fpu
-.-Slrand
-
0.7
hu
3lo
o
o
6
=3s
o
tso
a
a
o
o
825
o
o
o
tzo
15
0 0.05
0.1 0.15 0-2 0.25
0.3
Atlal
load rado
E- H?^
Fig. 4.l2-Expected
prestress
loss in fully
grouted
concrete masonry
0
0'05
0'1
tur
ro l ljto
E
'
'J
o'' o'25
0'3
Fig.4.f}-Expected
prestress
loss
in
ungrouted
concnete
masonry
It is
seen from Fig. 4.12 that
a high
amount of loss can be expected
for firlly
grouted
concrete
masonry. For the case
of
high
strength
strand
with
an
initial
stress
of 0.7fpu and
an axial load
ratio
of0.l5,
about 25%
loss
ofprestress
can be expected
after
all
losses have
occurred.
Forthe
case of a high strength
bar solution with similar initial stress
and
axial load
ratio
a
prestress
loss ofabout35%o
can
be expected.
Brc
o
o
E
=35
o
tso
o
o
o
s
e25
e
o
o
tzo
J
15
-€-
Bar - 0.5
fru
-+-Bar
-
0.7
tsu
-.-Strand
-
0.5 fpu
-+-Strand
-
0.7
fpu
-79 -
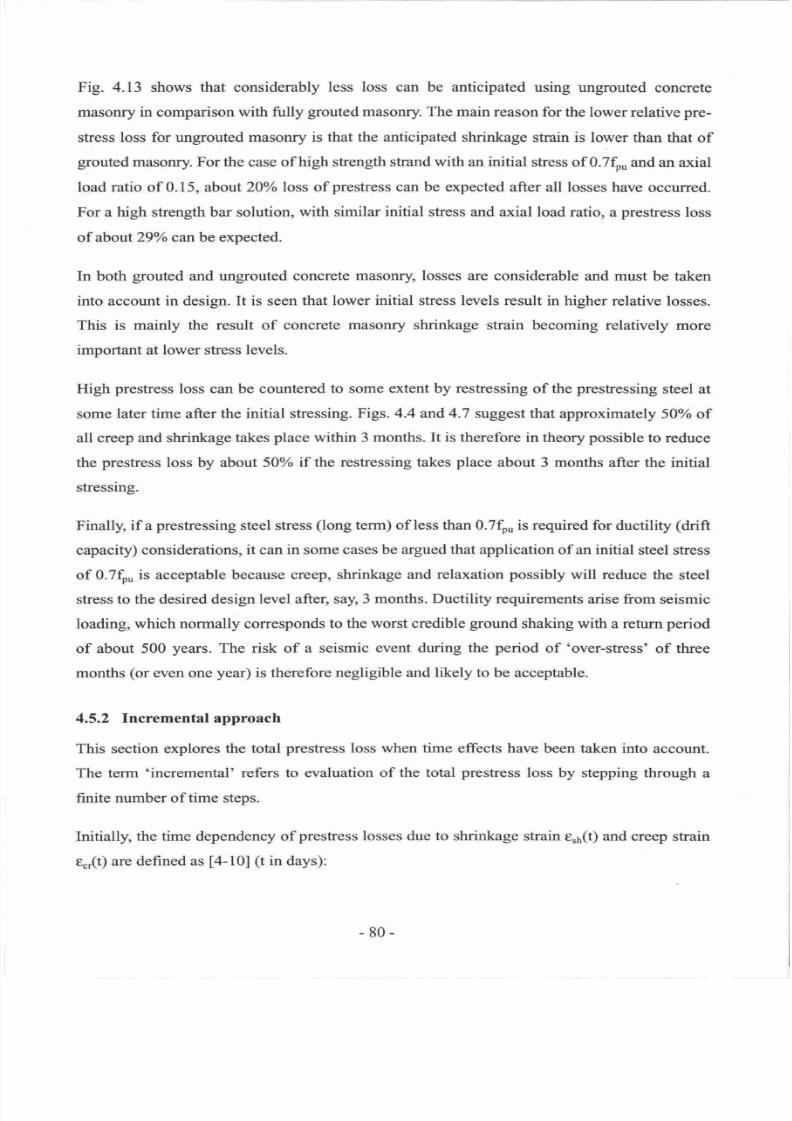
7/21/2019 PHD Laursen-masonry Prestressed Walls
http://slidepdf.com/reader/full/phd-laursen-masonry-prestressed-walls 106/308
Fig. 4.13 shows that considerably
less loss can
be anticipated using
ungrouted
concrete
masonry
in
comparison
with fully
grouted
masonry.
The main
reason for the lower
relative
pre-
stress
loss for ungrouted
masonry is that the anticipated shrinkage
strain is lower than
that
of
grouted
masonry.
For the
case
of high
strength
strand
with
an
initial
stress
of 0.7$
and an
axial
load
ratio
of 0.15, about
20% loss of
prestress
can be expected
after
all
losses
have
occurred.
For
a
high
strength bar solution,
with
similar
initial stress
and
axial
load ratio,
a
prestress
loss
of about
29o/o can be expected.
In both
grouted
and ungrouted concrete
masoffy,
losses
are considerable
and must be taken
into
account
in
design.
It
is
seen
that
lower initial
stress levels
result
in higher relative
losses.
This
is
mainly the
result
of
concrete masonry shrinkage
strain
becoming
relatively
more
impodant
at
lower
stress
levels.
High
prestress
loss can be countered
to
some
extent by restressing
of
the
prestessing
steel at
some
later time
after
the initial stressing.
Figs. 4.4
and
4-7
suggest
that
approximately 50%
of
all creep
and
shrinkage
takes
place
within
3
months. It is therefore
in theory
possible
to reduce
the
prestress
loss by about 50%
if
the
restressing takes
place
about
3
months
after the initial
stressing.
Finally, if
a
prestressing
steel stress
(long
term) of
less
than 0.7t,
is
required for
ductility
(drift
capacity) considerations,
it
can
in
some cases
be argued
that application
of
an
initial
steel stress
of 0.7fp is acceptable because
creep, shrinkage and
relaxation
possibly
will reduce
the
steel
stress
to the desired design
level after,
say, 3
months. Ductility
requirements
arise
from
seismic
loading,
which normally corresponds
to
the
worst credible
ground
shaking
with
a
return
period
of
about 500
years.
The risk
of
a seismic
event during the
period
of
'over-stress'
of
three
months
(or
even one
year)
is therefore negligible
and
likely to
be
acceptable.
4.5.2
Incremental approach
This section explores
the total
prestress
loss
when time
effects have
been
taken
into account.
The term 'incremental'
refers to evaluation of
the total
prestress
loss by stepping through
a
finite
number of
time
steps.
Initially,
the
time
dependency
of
prestress
losses due to
shrinkage strain
e,6(t)
and creep
strain
q,(t)
are
defined
as
[4-10]
(t
in
days):
-80-
7/21/2019 PHD Laursen-masonry Prestressed Walls
http://slidepdf.com/reader/full/phd-laursen-masonry-prestressed-walls 107/308
Lf r(t)
:
er,(t)Eo,
:
Fn '(tffr ro
:
#
Hrr*
Lfrn?):
esh(t)Ep,
:
Fnth(t)ErnEp,
:
7L5*
rroEo,
Afo,(t)
:
fo,@lryw-
o.ss)]
,
ff>
0 55
(4.11)
(4.r2)
The
prestress
loss time
dependency for
high
strength
low relaxation
strand is
given
by Eqn.
4.6
and repeated
below with
time dependency
notation
added
(t
in hours):
(4.13)
It is
noted from
Eqns. 4.1
I and 4.l3
that
prestress
loss
due
to
creep and
relaxation
not
only
are
functions
of
direct
time
variation
Fn(t) but
also
function
of
the
instantaneous
masonry stess
f ,(t)
and
prestress
fo(t). tnfrerent
in
Eqns.
4. I I and 4.13 is
the assumption
that
any increment
in
prestress
loss
due to creep
and relaxation
is a direct
function of the
instantaneous
masonry
stess
t(t)
and
instantaneous prestress
for(t)
and
not
the
initial
masonry
stress
f6
and initial
prestress
fp.i.
The
shrinkage
rate is
per
definition independent
of
the
masonry
stress.
Fig. 4.14
shows
Fn(t) for
shrinkage,
creep
and relaxation for
time between zero
and 1000
days
(approximately
3
years).
It
is
seen
that the shrinkage rate
is
higher than the creep rate and that
relaxation
initially
occurs at
a
higher
rate
than shrinkage
and creep.
0 100 200 300 400 500 600 700
800
t
(days)
Fig.4.l4-Time
variation
Fn(t)
for
creep, shrinkage
and relaxation
-81
-
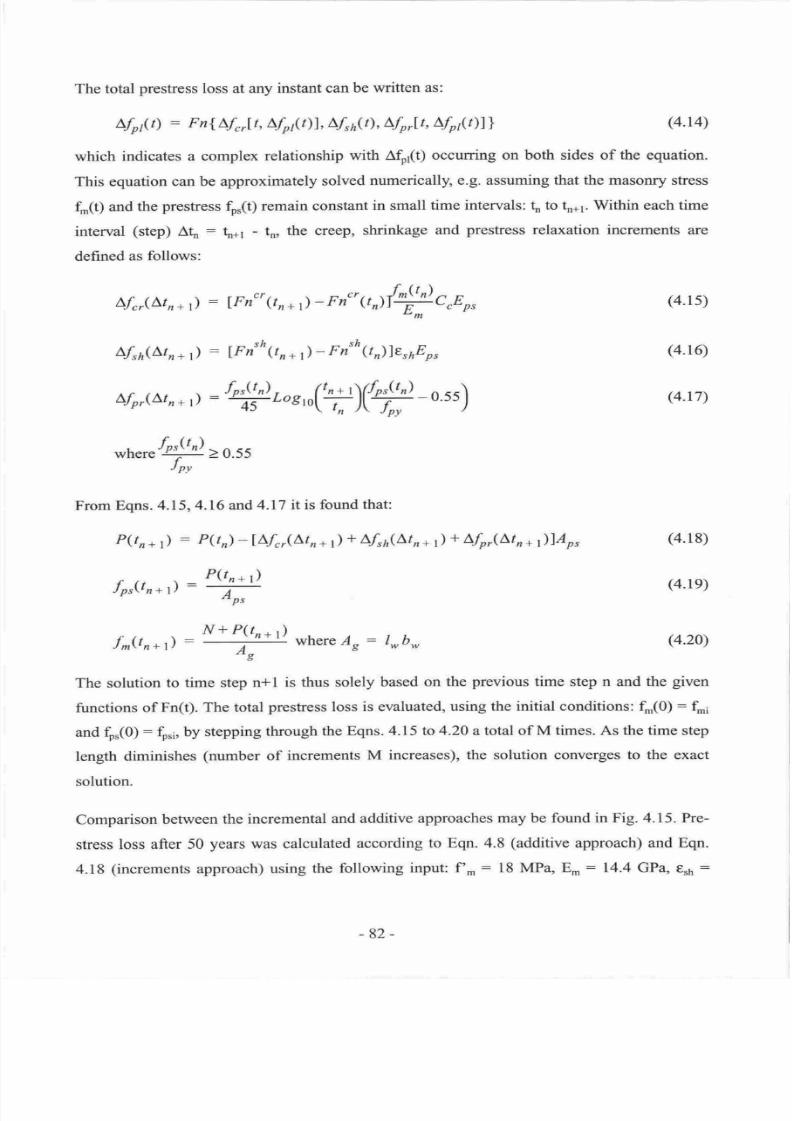
7/21/2019 PHD Laursen-masonry Prestressed Walls
http://slidepdf.com/reader/full/phd-laursen-masonry-prestressed-walls 108/308
The
total
preshess
loss
at
any
instant
can
be written
as:
Lfplt)
:
Fn{Lf,,.lt, Lfp{t)J,
L,frl?),
Lfp,lt, Lfp{t)l}
which
indicates
a complex
relationship
with
Afor(t)
occurring on both
sides
of
the
equation.
This
equation
can be
approximately
solved
numerically,
e.g. assuming
that the
masoffy
stress
fr(t) and
the
prestress
for(t)
remain
constant
in
small
time
intervals:
I
to
h*r.Within
each time
interval
(step)
At
:
*r
-
tn,
the creep,
shrinkage
and
prestress
relaxation increments
are
defined
as
follows:
(4.r4)
(4.15)
(4.16)
(4.r7)
(4.18)
(4.1e)
(4.20)
Lf"r(Ltn+
l)
:
1Fn"1tn+
r)
-
rr"{t)@cpo,
Lf,h(Ltn+
l)
:
1Fn'h
1tn+
r
)
-
Fn'h
1t))erhEp,
Afo,{Lt,*,
)
:
W
t'r
"(+)W-
o.ss)
*1r"r"@->
0.55
Jw
From
Eqns.
4,15,4.16
and
4.17
it is
found
that:
P(t
n
+
)
:
P(t)
-
L\fcr(Ltn*
r
)
*
Lfrr(Ltn*
r
)
*
a'fo,(a'tn
*
1)\Ap,
P(tna
)
fp,(tn*l)
:
T
f^(tn*
l)
:
N+
P(rn+
l)
where
Ar: lnb-
As
The solution
to
time
step
n+l
is thus
solely based
on
the
previous
time
step
n
and
the
given
functions
of
Fn(t).
The total
presfiess
loss
is
evaluated,
using the
initial conditions: fr(O): f",i
and
fo.(O):
fpsi, by
stepping
through
the
Eqns.4.l5
to 4.20
a total of M
times.
As
the
time
step
length
diminishes
(number
of increments
M
increases),
the solution
converges
to
the
exact
solution.
Comparison
between
the
incremental
and additive
approaches may be
found
in Fig.
4.15.
Pre-
stress
loss after
50
years
was calculated
according
to Eqn. 4.8
(additive
approach)
and
Eqn.
4.1 8
(increments
approach)
using
the
following
input: f
,n
:
18 MPa,
E^
:
14.4
GPa,
t6
=
-82-
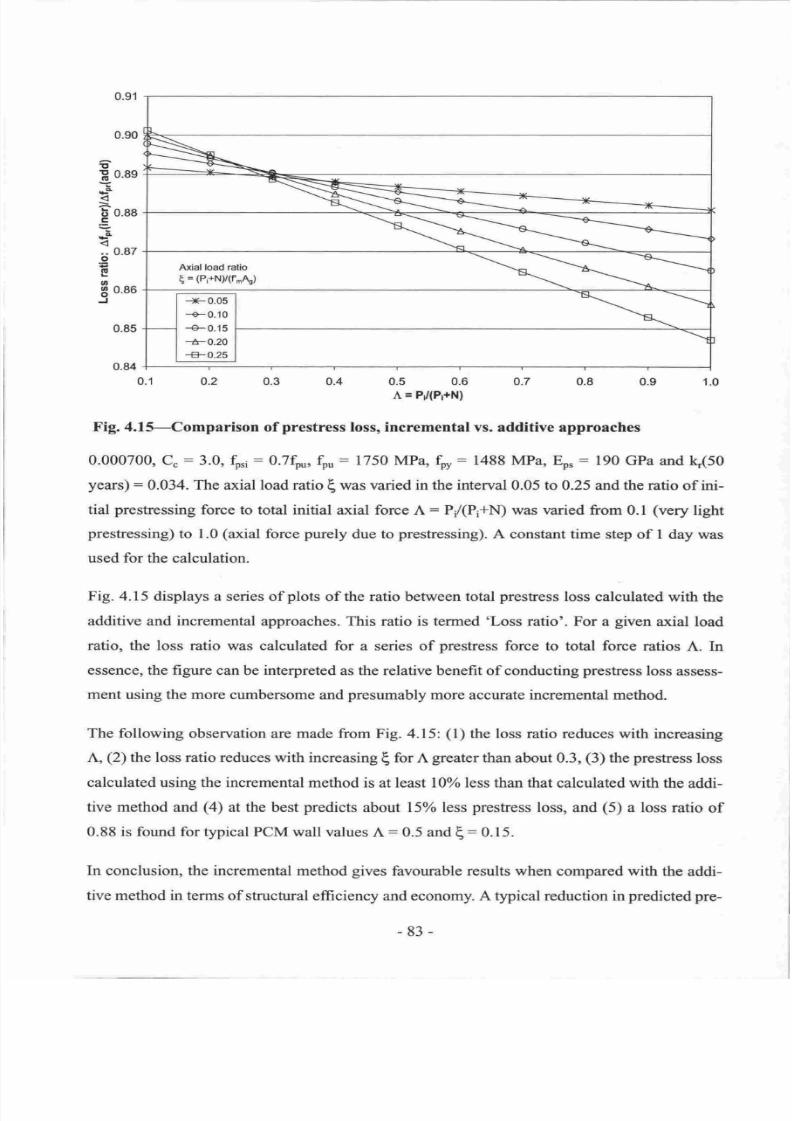
7/21/2019 PHD Laursen-masonry Prestressed Walls
http://slidepdf.com/reader/full/phd-laursen-masonry-prestressed-walls 109/308
0.91
tt
H
0.8s
-
g
b
0.88
tr
F
..
0.87
o
E
o
g
0.86
0.84
0.90
0-1 o-2
0.3 o.4
oiu=
r^rnfl,u
0.7 0.8
0.s 1.0
Fig. 4.I5-Comparison
of
prestress
loss, incremental
vs.
additive
approaches
0.000700,
C
:
3.0,
f,ri
:
0.7q0*
fou
=
1750 MPa,
iy
:
1488 MPa,
Eor
:
190
GPa and
k
(50
years)
:
0.034.
The
axial load ratio
(
was varied in
the
interval
0.05
to
0.25
and
the ratio
of
ini-
tial
prestressing
force
to
total initial
axial
force
A:
Py'(P;+N)
was
varied
from
0.1
(very
light
prestressing)
to 1.0
(axial
force
purely
due
to
prestressing).
A
constant
time
step of I
day
was
used for
the calculation.
Fig.
4. 15
displays
a series of
plots
of
the
ratio betrveen
total
prestess
loss
calculated
with
the
additive and incremental approaches. This
ratio
is termed
ol-oss
ratio'.
For
a
given
axial
load
ratio, the loss ratio
was
calculated
for a
series
of
prestress
force to total force
ratios
A.
In
essence,
the figrne
can
be interpreted
as
the relative benefit of conducting
prestress
loss
assess-
ment using
the
more
cumbersome
and
presumably
more
accurate
incremental
method.
The following
observation
are made
from
Fig. 4.15:
(l)
the loss ratio reduces
with
increasing
L,
(2)
the
loss
ratio
reduces with
increasing
(
for
A
greater
than
about
0.3,
(3)
the
prestress
loss
calculated
using the incremental
method is
at
least
10% less
than that calculated
with
the addi-
tive
method
and
(4)
at the best
predicts
about 15%
less
presfress
loss, and
(5)
a loss
ratio of
0.88
is found
for
typical PCM
wall
values
A
:
0.5
and
6:
0.15.
In
conclusion, the incremental
method
gives
favourable results when
compared
with
the
addi-
tive method in terms
of structural efficiency
and
economy. A typical reduction in
predicted
pre-
Axial load ratio
(,
=
(Pi+N/(f.&)
-83-
7/21/2019 PHD Laursen-masonry Prestressed Walls
http://slidepdf.com/reader/full/phd-laursen-masonry-prestressed-walls 110/308
stress
loss
of
l2 o can
be expected
using
the
incremental
method.
Given the
small magnitude
of
achieved
improvement using the
incremental method in
comparison
with the
significant
uncertainty
of the shrinkage
and
creep
properties
for
concrete
masonry,
it is
questionable
whether
use
of
the incremental method
can
be
justified.
It
is
therefore recomrrended
to
use
the
additive
method
for
prediction
of
prestress
losses in
PCM
walls as defined
by Eqn.
4.8. This
section
confimrs
that typical
prestress
losses
as calculated
and discussed
in
section
4.5.1
are
relevant
to typical PCM wall design.
-84-
7/21/2019 PHD Laursen-masonry Prestressed Walls
http://slidepdf.com/reader/full/phd-laursen-masonry-prestressed-walls 111/308
4.6
REFBRENCES
t4-1]
Schultz,
A.
E. and
Scolforo,
M.
J.,
An
Overview of
Prestressed
Masonry,
The Masonry
Society Joumal,
August 1991, Vol. 10, No. 1.
[4-2)
BS
5628:
L995,Part2:
Code
of
Practicefor
use
of Masonry.
Structural
Use
of
Rein-
forced
and
Prestressed
Masonry, British Standards
Institution,
London.
[4-3]
AS
3700-1998,
Masonry
Structures,
Standards Association
of Australia,
Homebush,
NSW
2140.
t44l
MSJC: Building
Code
Requirements
for
Masonry Stntctures
and,
Specification
for
Masonry
Structures,
ACI
530-02/ASCE
5-02ITMS
402-02,
The Masonry
Standards
Joint Committee,
USA,
2002.
[4-5]
Neville, A.M.,
Properties
of Concrete,
John Wiley Sons, Edition
4F,,844
p.,1996.
[4-6]
Bryant,
A.H.,
Wood,
J.A. and Fenwick, R.C.,
Crcep and Shrinlmge
tn
Concrete
Bridges,
RRU
Bulletin
70,
National
Roads
Board,
Wellington,
New
Zealand,1984.
l4-7)
Bryant.
A.H
and
Vadhanavikkit,
C.,
Creep,
Shrinkage
-
size
and age
loading
effects,
ACI
Material Journal,
Vol.
83,
No. 2,
March-April 1987,pp II7-123.
[4-8]
CEB-FIP
model
codefor
concrete
structures, Commite European
du
Beton
- Federation
lnternationale
de
la
precontrainte,
1978.
[4-9]
Eurocode
2:
Design
of
Concrete Sfiactures,
Part I
General rules
and rules
for
build-
ings,
ENV
1992-l-1,
European Committee
for
Standardization,
Brussels,
December
1991.
[4-10]
ACI
Special Publication
-
76,
Designingfor
Creep Shrinkage
in
Concrete
Structures,
Published
by American
Concrete
lnstitute,
1982,484p.
[4-11]
Lenczner,
D.,
Creep
and Prestress Losses
in Brick
Masonry,
The
Structural
Engineer,
Institution
of
Structural Engineers
(England),
Vol. 648, No.
3, September
1986,
pp.
57-
62.
l4-l2l
Hamilton,
H.R.
and Badger,
C.R.,
Creep
Losses
in
Post-Tbnsioned
Concrete
Masonry,
TMS
journal,
July 2001,
Vol.
18,
No. l.
[4-13]
Sritharan,
S. and Fenwick,
R.C.,
Creep
and
shrinkage
efects
in
prestressed
beams,
Magazine
of
Concrete
Research,
Yol.47, No. 170, March 1995,
pp.
45-55.
[4-14]
YSL
Construction
Systems,
VSL
Prestressing
(Aust.)
Pty.Ltd.,
Ausfialia,
1995.
-85-
7/21/2019 PHD Laursen-masonry Prestressed Walls
http://slidepdf.com/reader/full/phd-laursen-masonry-prestressed-walls 112/308
[4-15]
Recommendations
for
Estimating
Prestress
Losses, Report
of
Prestressed
Concrete
Institute
(PCD
committee
on Prestress
Losses,
Joumal
of
the
Prestressed
Concrete
Insti-
tute,
Vol.
20.
No.
4,
July-August
1975,
pp.43-75,
[4-16l
Marksoud,
A.,
Short
and
Long
Term
Capacities of Slender
Concrete
Block Walls,PhD
thesis, McMaster
University,
Hamilton, Ontario,
1994.
l4-l7l
Harvey,
RJ.
and
Lenczner,
D.,
Creep
Prcstrcss
Losses
in Concrcte Masonry Proceed-
ings,
5h
RILEM
Intl. Symp.
On
Creep
and Shrinkage
of
Concrete,
1993.
[4-lS]
NZS
3102:1983,
Concrete
masonry units,
Standards Association of New Zealand,,
1983, Wellington.
[4-19]
NZS
4210:2001,
Masonry
Constntction:
Materials and
Worlonanshlp,
Standards New
Zealand,
200
l,
Wellington
4-201NZS
3101
1995, Concrete
Structures
Standard,
Standards
Association ofNew Zealand,
1995, Wellington.
-86-
7/21/2019 PHD Laursen-masonry Prestressed Walls
http://slidepdf.com/reader/full/phd-laursen-masonry-prestressed-walls 113/308
Chapter
5
STRUCTURAL TESTING
-
SERIES
1
5.
SINGLB.STOREY PCM
WALLS
In-plane
response
of
post{ensioned
concrete masonry walls
with
unbonded tendons
is
exam-
ined
by
means
of
structural testing.
A
description of the Series
I wall
testing
prognunme
is
fol-
lowed
by
a
presentation
of
the
results
from
structural testing
of six fully
grouted
walls
one
partially
grouted
wall
and one
ungrouted
wall.
Discussion of the results is
concerned
with
wall
structural
response
in
terms
of flexural
strength shear strength
displacement capacity
tendon
stress and
masonry
vertical strain.
5.I
INTRODUCTION
This
chapter
describes
the results
from
structural testing
of
eight
unbonded
PCM
cantilever
walls.
The
walls
were
tested
to
explore
the
behaviour
of
single-storey rectangular
post-ten-
sioned
walls of
various
aspect
ratio
thickness and tendon layout. The
objective
of this
study
was to obtain
data
for
use in
design;
however
design
examples
are
not considered
herein.
Using
unbonded
post-tensioning
walls
are
vertically
prestressed
by
means
of
strands
or bars
which
are
passed
through
vertical
ducts inside the walls.
As
the
walls
are subjected
to
lateral
in-plane
displacements gaps
form
at
the horizontal
joints
reducing
the
system
stiffiress.
As
long
as
the
prestressing
strands
retain
a significant force they will return the
walls
to
their
ini-
tial
position.
Thus the
lateral
force-displacement
response
may
be described by
a
nearly
non-
linear
elastic
relationship.
The
integrity of the
walls
is
maintained
as
no
plastic
hinges
form
and
there
are no
residual
post-earthquake
displacements.
Consequently minimal structural
and
non-
structural
wall
damage can be
expected.
-87
-
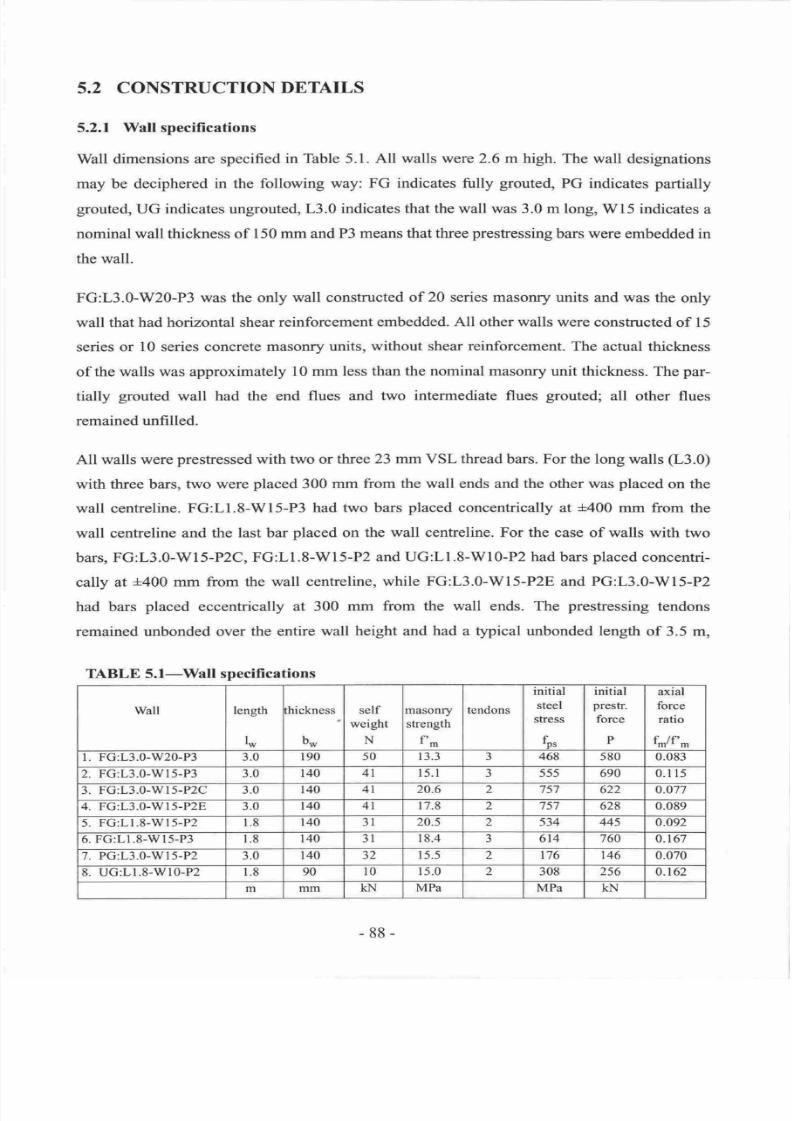
7/21/2019 PHD Laursen-masonry Prestressed Walls
http://slidepdf.com/reader/full/phd-laursen-masonry-prestressed-walls 114/308
5.2 CONSTRUCTION
DETAILS
5.2.1 Wall specifications
Wall
dimensions are
specified
in
Table 5.1.
All
walls
were
2.6 m high. The
wall
designations
may be deciphered
in
the following
way: FG
indicates
fully
grouted,
PG indicates
partially
grouted,
UG indicates ungrouted,
L3.0 indicates
that the
wall was 3.0 m long, Wl5 indicates
a
nominal
wall thickness of
150
mm
and P3
means
that
three
prestessing
bars
were
embedded
in
the wall.
FG:L3.0-W20-P3 was the only
wall constructed
of
20
series masonry
units and was
the only
wall that
had
horizontal
shear
reinforcement
embedded.
All
other walls were
constnrcted
of
l5
series
or
l0
series concrete
masonry units,
without
shear
reinforcement.
The actual thickness
of
the walls was approximately
10 mm
less
than the nominal masonry
unit
thickness.
The
par-
tially
grouted
wall had the
end flues and
two
intermediate flues
grouted;
all other
flues
remained
unfilled.
All
walls were
prestressed
with two or
three 23 mm VSL
thread
bars.
For the long
walls
(L3.0)
with
three bars,
two
were
placed
300
mm from the wall
ends
and the other was
placed
on the
wall
centreline. FG:LI.8-WI5-P3
had
two
bars
placed
concentrically at
+400
mm from
the
wall centreline and the
last bar
placed
on
the wall centreline. For the
case
of
walls
with trvo
bars,
FG:L3.0-W15-P2C,
FG:LI.S-Wl5-P2
and
UG:LI.8-W10-P2 had
bars
placed
concenhi-
cally at
+400
mm
from
the
wall
centreline, while
FG:L3.0-W -P2E
and PG:L3.0-W15-P2
had bars
placed
eccentrically
at 300 mm
from the wall ends. The
prestressing
tendons
remained
unbonded over
the entire
wall height and
had
a typical unbonded length
of 3.5 m,
TABLE
S.I-Wall specifi
cations
Wall
length
lw
n
ickness
bw
self
weight
N
masonry
shength
f't
tendons
initial
steel
shess
fo.
initial
prestr.
force
P
axral
force
ratio
fm/f'm
l.
FG:L3.0-W20-P3
3.0
190 50
13.3
J
468
580
0.083
2.
FG:L3.0-W
5-P3 3.0
140
4
l5.l
a
J )J5
690 0.1 15
3.
FG:L3.O-W
5-PzC 3.0
140
4 20.6
1
757 622
0.077
4.
FG:L3.0-W
5-P2E
3.0
t40
4 17.8
z
757
628
u.uu9
5.
FG:L1.8-W 5-P2
t.8
140
J 20.5 2
534
M5
0.092
6.
FG:L1.8-Wl5-P3
1.8
140 3
18.4
a
614 760
0.t67
7. PG:L3.0-Wl5-P2
3.0
140 32
15.5 2 t76
146
0.070
8.
UG:LI.8-Wl0-P2
1.8
90
l0
15.0 308 256
0.t62
m
mm KN
MPa MPa
KN
-88-
7/21/2019 PHD Laursen-masonry Prestressed Walls
http://slidepdf.com/reader/full/phd-laursen-masonry-prestressed-walls 115/308
including unbonded lengths
in the foundation
300
mm), loading beam
400
mm) and
load
cells
on
top
of
the loading
beam
200
mm).
The
wall
prestressing
force
and
axial
force
ratios
due
to
prestressing
and
self-weight)
are
given
in
Table
5.1.
5.2.2 Wall consfruction
Prior
to
wall
construction, the
prestressing
bars
were
inserted
in
the
foundation and encased by
ducting to ensure
proper
isolation
from
the
grout.
The
walls
were
consfiucted
in running
bond
by
experienced
blocklayers
under supervision, using
standard
grey precast
concrete
masonry
units
and
DRICONTM trade
mortar.
Open-ended concrete
masonry
units
were
used for
most
of
the walls in
order
to
avoid
having to
thread the masonry
units
onto
the
4 m long
prestressing
bars.
Grouting
with
17.5
MPa
ready-mixed regular
block
fill,
containing
SIKA
CAVEXTM
expansion agent,
was perfiormed
the
subsequent day.
5.2.3 Materialproperties
Masonry
crushing
strength
was
determined
by material testing of
masonry
prisms height
by
length of 600 mm by
400
mm) for walls
FG:L3.0-W1,5-P2C, FG:L1.8-WI5-P2, FG:L1.8-
Wl5-P3
and UG:L1.8-W10-P2. Strengths of walls
FG:L3.0-W20-P3, FG:L3.O-Wl5-P3,
FG:L3.0-W15-P2E
and
PG:L3.0-W15-P2
were
estimated on
a
statistical
basis
from
knowledge
of
masonry
block,
mortar
and
gtout
strengths.
VSL
23
mm
diameter
high
stength threaded bars
were
used in
all wall
tests
and had
the
typical
properties: yield
strength of
970 MPa, ultimate
strength of
1160 MPa, ultimate
strain
of
8o/o
and
modulus
of elasticity of 190 GPa.
5.3
TESTING DETAILS
5.3.1
Test
setup
Wall
testing reported herein was conducted
using
the
setup
shown in Fig 5.1 a),
consisting
of a
reusable
foundation
and
loading
beam.
Notably, no effort was
made
to replicate
gravity
and
live
loads
from
suspended
floors, with
the assumption
that
these
loads were
directly
analogous
to
a
component of the applied
post-tensioning
force. Fig. 5.1 b) schematically
shows
typical
wall
instrumentation. Lateral force was measured
by
two
load
cells positioned
in
series
with
the
hydraulic
actuators, denoted
as
instruments 1
and
2 in Fig.
5.lO).
Wall flexural deforma-
tion and vertical strain were
measured
by instruments
5-18
portal
type LVDTs)
and
panel
-89-
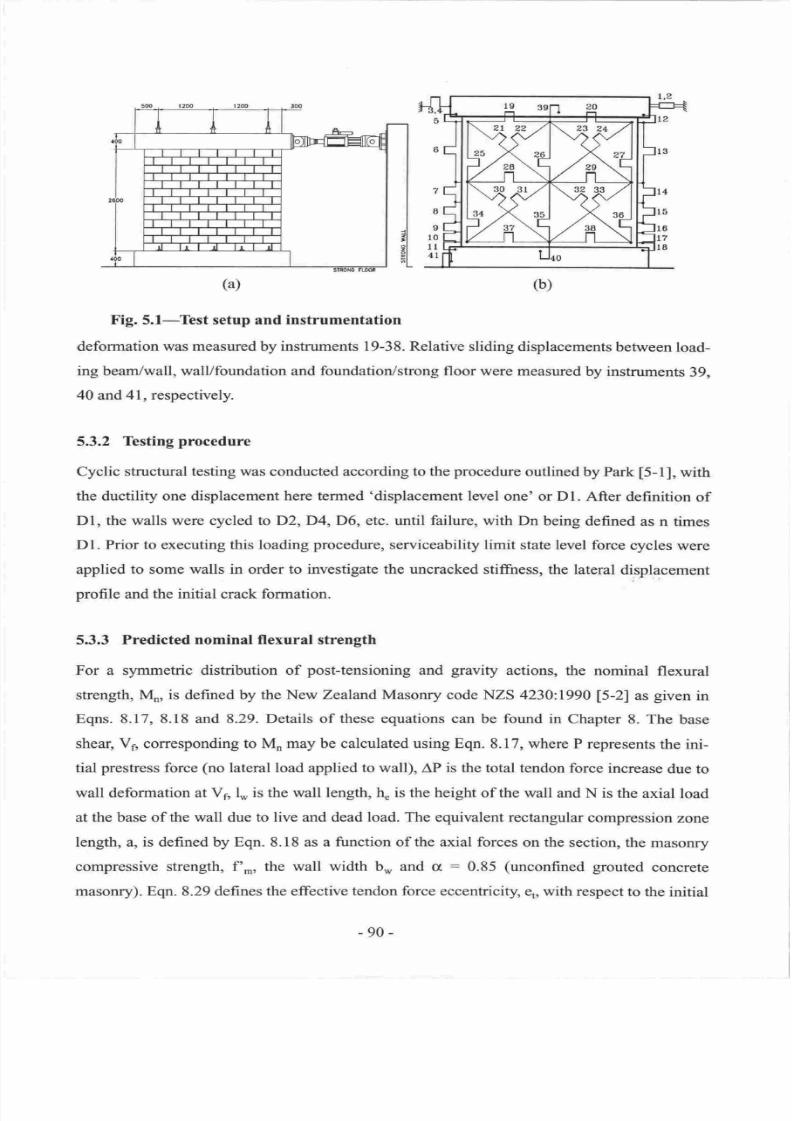
7/21/2019 PHD Laursen-masonry Prestressed Walls
http://slidepdf.com/reader/full/phd-laursen-masonry-prestressed-walls 116/308
7
I
I
l0
ll
4l
L4
l5
l6
l7
t8
Fig.
S.l-Test
setup
and
instrumentation
deformation was measured
by
instruments l9-38.
Relative
sliding
displacements
between
load-
ing beam/wall,
wall/foundation
and
foundation/strong floor
were
measured by
instruments
39,
40
and
41,
respectively.
5.3.2
Testing
procedure
Cyclic
structural
testing
was
conducted according
to
the
procedure
outlined
by Park
[5-1],
with
the
ductility
one
displacement
here
termed displacement
level
one
or
Dl.
After definition
of
Dl,
the
walls
were
cycled to
D2,D4,D6,
etc.
until
failure,
with Dn
being defined
as n
times
Dl. Prior to
executing
this loading
procedure,
serviceability
limit
state
level
force
cycles
were
applied
to
some
walls
in order
to
investigate
the
uncracked
stiffness,
the
lateral
displacement
profile
and
the
initial
crack
formation.
5.3.3 Predicted nominal flexural strength
For
a
symmetric distribution
of
post-tensioning
and
gravity
actions, the
nominal
flexural
strength,
Mn,
is defined by
the
New
Zealand
Masonry
code
NZS
4230:1990
[5-2]
as
given
in
Eqns.
8.17,
8.18 and
8.29.
Details of
these
equations
can be found
in Chapter
8.
The
base
shear,
Vs,
corresponding
to
Mo
may
be calculated
using Eqn.
8.17, where
P
represents
the
ini-
tial
prestress
force
(no
lateral load applied
to
wall),
AP
is
the total
tendon force increase
due
to
wall deformation at Vr, l*
is the
wall length,
h.
is
the
height of
the
wall
and N
is the
axial
load
at
the
base
of
the
wall
due
to
live and
dead load.
The equivalent rectangular
compression
zone
length, a, is
defined
by Eqn.
8.18
as a
function
of
the
axial
forces
on the section, the
masonry
compressive
strength, f ,n, the wall width b* and
a
:
0.85
(unconfined
grouted
concrete
masonry). Eqn.
8.29
defines
the
effective
tendon
force
eccentricity,
e,,
with
respect
to the
initial
-90-
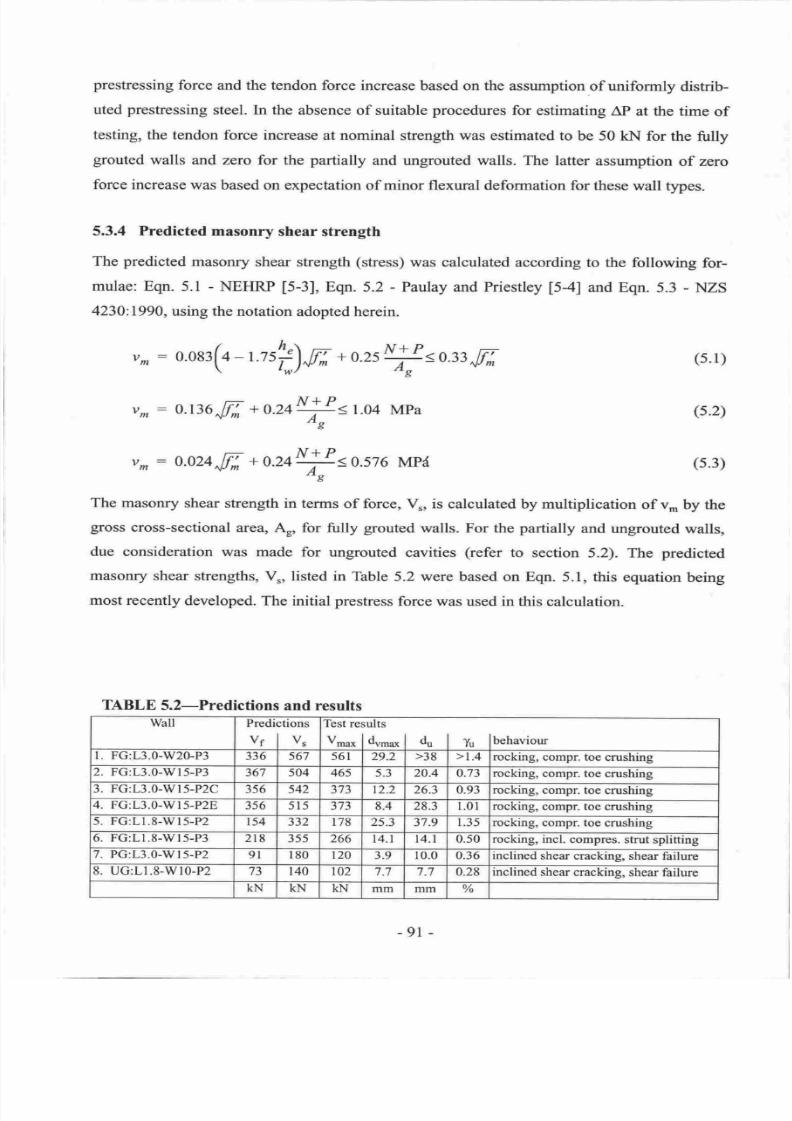
7/21/2019 PHD Laursen-masonry Prestressed Walls
http://slidepdf.com/reader/full/phd-laursen-masonry-prestressed-walls 117/308
prestressing
force
and the tendon
force
increase
based
on the assumption of
uniformly
distrib-
uted
prestressing
steel.
ln the absence
of
suitable
procedures
for
estimating
AP
at the time
of
testing,
the
tendon force
increase
at
nominal
strength was estimated
to be
50 kN
for the
fully
grouted
walls
and zero
for
the
partially
and
ungrouted
walls. The latter
assumption
of
zero
force
increase
was
based
on expectation
of minor flexural deformation for
these
wall types.
5.3.4
Predicted
masonry shear
strength
The predicted
masonry
shear strength
(stress)
was
calculated according
to the following
for-
mulae: Eqn.
5.1
-
NEHRP
[5-3],
Eqn.
5.2
-
Paulay and Priestley
[54]
and Eqn.
5.3
-
NZS
4230:1990,
using the
notation
adopted herein.
u,
:
0.083(4-
t.?s*)lf;
+0.25|J,.;=r-:3fr
v^
:
0.86ffi
+
o.z4*
l'
=1.04
MPa
Ao
v^:
0.024ffi
+0.24V=0.576
MPd
The
masonry
shear
strength
in
terms
of
force,
V,,
is calculated by
multiplication
of
v-
by
the
gross
cross-sectional
area,
A* for
fully
grouted
walls.
For the
partially
and
ungrouted
walls,
due
consideration
was made
for
ungrouted
cavities
(refer
to section
5.2). The
predicted
masonry
shear
strengths,
V*,
listed
in
Table
5.2
were
based
on Eqn.
5.1,
this
equation
being
most
recently
developed.
The
initial
prestress
force
was
used in
this
calculation.
(5.1)
(5.2)
(s.3)
TABLE
S.2-Predictions
and
results
Wall
Preclrctrons
vslv.
Test results
V*u*
lduro I
d
Yu
lbehaviow
l.
FG:L3.0-W20-P3
336
567 561
29.2
>38 >1.4
rocking,
compr.
toe
crushing
2. FG:L3.0-W
5-P3
367 504
465
5.3
20.4
0.73
rocking,
compr. toe
crushing
3.
FG:L3.0-W
5-P2C
3s6
542 373
t2.2 26.3 0.93 rocking,
compr. toe
crushing
4.
FG:L3.0-W
5-P2E
356 515
373
8.4 28.3
l.0l
rocking,
compr. toe
crushing
5.
FG:LI.8-W
5-P2
154
332
178
25.3
37.9
r.J)
rocking, compr. toe
crushing
6.
FG:LI,8-W
5-P3 218
355
266
I4.l
l4.l 0.50 rocking, incl.
compres.
strut
splitting
7.
PG:L3.0-W
5-P2
9l
180
t20
3.9
10.0
0.36
inclined
shear
cracking,
shear failure
8,
UG:L1.8-W
0-P2
73
140 102
7.7 7.7 0.28 inclined
shear
cracking,
shear
failure
KN
KN
KN
mm
mm
o/o
-91
-
7/21/2019 PHD Laursen-masonry Prestressed Walls
http://slidepdf.com/reader/full/phd-laursen-masonry-prestressed-walls 118/308
5.4
TEST
RESIJUTS
This
section describes
the
behaviour of
the eight walls and
presents
the measured masonry
compression
toe strains at
various
wall states. General wall behaviour is summarised
in Table
5.2,
where
V**
is the maximum
lateral
force recorded and
4*o
is the corresponding
displace-
ment. The
ultimate
displacement
capacity, du, is defined as the
point
at
which
the lateral wall
strength
had
degraded
below 80%
of
V.o.
The ultimate
drift
capacity is defined as
y,
-
q,/L.
5.4.1
Fully
grouted
walls
Rocking
response
was recorded
for all
fully
grouted
wall
tests, characterised by opening
of a
single
large crack
along
the
wall-foundation
construction
joint.
No distributed
flexural cracks
were observed and distinct
diagonal
compression
strut
cracking
was
only
observed for
FG:LI.8-Wl5-P3.
High initial
stiffiress
was recorded.
At
nominal
flexural
strength, Mn, wall
softening
occurred
due
to the initiation
of
rocking. Tendon
yielding
was
experienced for all
walls
that failed in
flexure.
The failure
mode was
characterised
by
localised masonry crushing in the compression toe
regions,
resulting in
gradual
strength
degradation
(with
the exception of
wall FG:LI.8-W15-P3
that
failed in
shear).
FG:L1.8-Wl5-P3
exhibited
rocking
response
for
displacements up
to
approximately
Dl
(4.3
mm).
Displacing the
wall towards
D2
(8.6
mm) initiated diagonal
cracking, eventually leading
to failure in both
directions
of
loading.
5.4.1.1
Force-displacement
response
Fig. 5.2, depicting
the
force-displacement
response
for
all
fully
grouted
walls, demonstates
the nearly
non-linear
elastic behaviour
exhibited
by unbonded
post-tensioned
walls
prior
to toe
crushing,
It
is
seen
that the walls
retumed
to
their original alignment, even after
large
displace-
ment excursions.
Therefore
the
response
may be categorised
as
origin
oriented . The
individ-
ual curves
for each
excursion appear
pinched,
implying
little hysteretic energy dissipation. It
is
noted
that the term
'elastic'
in
a
rigorous sense
indicates
reversibility and no
accumulation
of
damage.
In
reality
the
walls
did
accumulate
damage
from the onset of
tendon
yielding
and
masonry
crushing,
causing
a
reduction
in wall
stiffness.
Thus the behaviour
was termed
'nearly'
non-linear
elastic.
-92
-
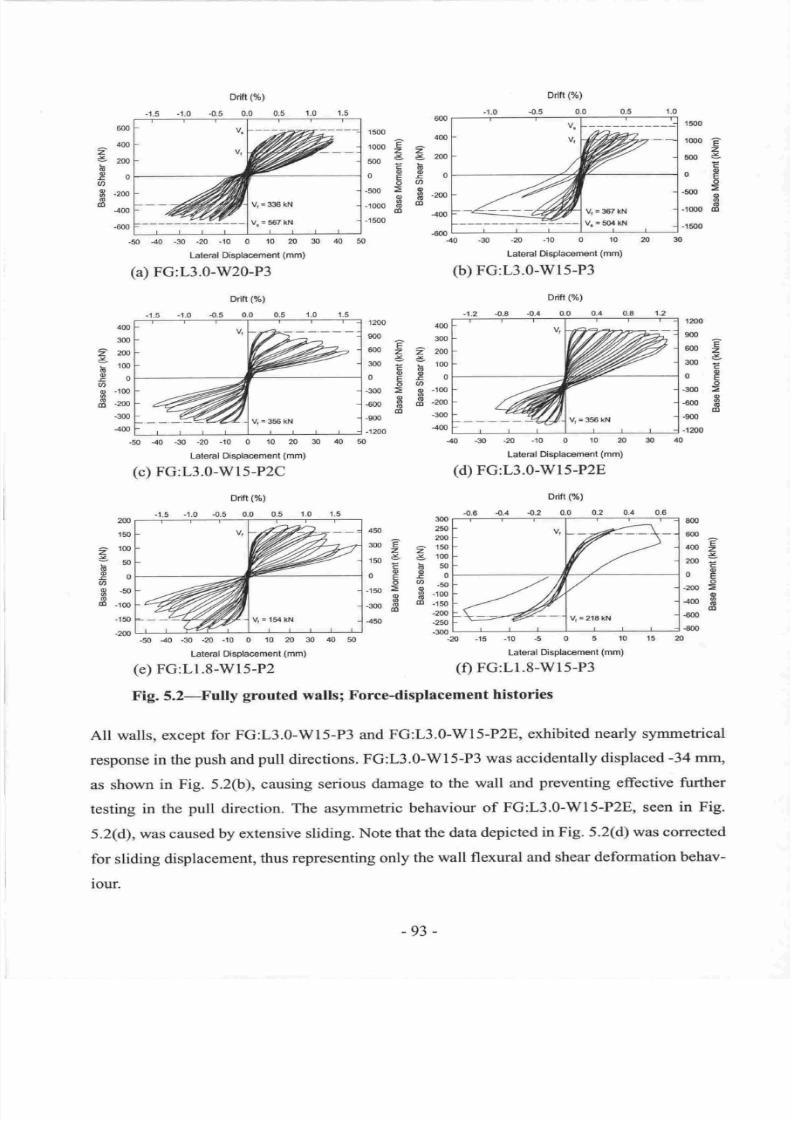
7/21/2019 PHD Laursen-masonry Prestressed Walls
http://slidepdf.com/reader/full/phd-laursen-masonry-prestressed-walls 119/308
*[
400
F
I
*f
OF
I
-400
r
*of
-40
,*oQ
2
4J
5m;;
o
Pg
6a
J6
TS
1(x)0
s
E
z
z
co
E
o
=
o
c
dl
z
v
(g
o
s
o
o
6
ao
lo
4@
300
Ezzm
y
EF'*
E.g
o
6s)
H
3"t
'o
-3{n
-4{n
E
z
x
c
o
E
o
=
@
6
dt
z
I
o
o
a
o
C'
dl
8(x,
600
c
4m:
5
2oo
;
E
op
o
-2m
=
4oo
I
6
€00
{00
3n;
250
l-
20o
l-
15o
r
100
r
50r
0l-
'50
f'
'lm
F
-r5o
r
-20o
F
-250
l-
-3{X'
L
-n
4fi
aoo
€
zz
x
150;;
o
Fi
6.h
-rso
E
g
..*&
A
-450
z
I
o
o
E
o
o
o
o
ao
600
400
N
0
.200
400
600
.t500
t(xl0
500
0
-500
-r@0
-1500
Ddn
(%)
.1.5
-1.0
-0.5
0.0
Vr
=
336 kN
V.
=
567 kN
.50
-40
-30 -20 -10
0
10
N
30
Lsteral Dsplacament
(mm)
(a)
FG:L3.0-W20-P3
Drift
(%)
-1.5 -r.0
-o.5
0.o 0.5
1.0 1.5
v
V
=
gs0
tt't
-50
-40
-30
.20
-10
0
10 20
30 40
50
Lale]al Displaoement
(mm)
(c)
FG:L3.0-W15-P2C
Drift
(70)
-1.5 -1.0
.0.5
0.0 0.5
1.0
1.5
Ddft(%)
o.5
0.0
V=367kN
v.
=50{
lil
.g)
-20
-10
0
10
m
Lateral
Oisplacornont
(mm)
(b)
FG:L3.0-wl5-P3
Drift(%)
-1.2
{.8
-0.4
0.0
0.4 0.8
1.2
v
v
V=356kN
40-30.m-10010,o3040
Lateral
Displacement
(mm)
(d)
FG:L3.0-w15-P2E
Drift (%)
-0.6
.o,4
4.2
0.0 0.2
0.4
0.6
Vt
"
218 kN
400
300
200
,to0
0
-100
.200
-3{X)
400
?@
150
100
50
0
-50
.1(x)
.150
.N
1200
900
600
$0
0
-300
€(X)
-900
-1200
1z)0
900
@0
3@
0
-300
€00
-900
.1200
-15
-t0 -5
0
5 10 15
Lateral Displacement
(mm)
(e)
FG:L1.8-wl5-P2
(f)
FG:L1.8-W15-P3
Fig.
5.2-Fully
grouted
walls; Force-displacement
histories
All
walls, except
for
FG:L3.0-W15-P3
and
FG:L3.0-WI5-P2E,
exhibited
nearly symmetrical
respoffie
in
the
push
and
pull
directions.
FG:L3.0-WI5-P3
was accidentally
displaced
-34
mm,
as shown
in
Fig. 5.2(b),
causing serious
damage
to the
wall and
preventing
effective
further
testing
in
the
pull
direction.
The asymmetric
behaviour
of
FG:L3.0-WI5-P2E,
seen
in Fig.
5.2(d),
was caused
by extensive
sliding.
Note that the
data
depicted
in Fig.
5.2(d)
was
corrected
for sliding
displacement,
thus
representing
only
the
wall
flexural and
shear
deformation behav-
iour.
-50
40
-30
-20 -r0
0
10
20
30
40 50
Lat€ral Displacem€nt
(mm)
(e)
FG:LI.8-Wl5-P2
-93
-
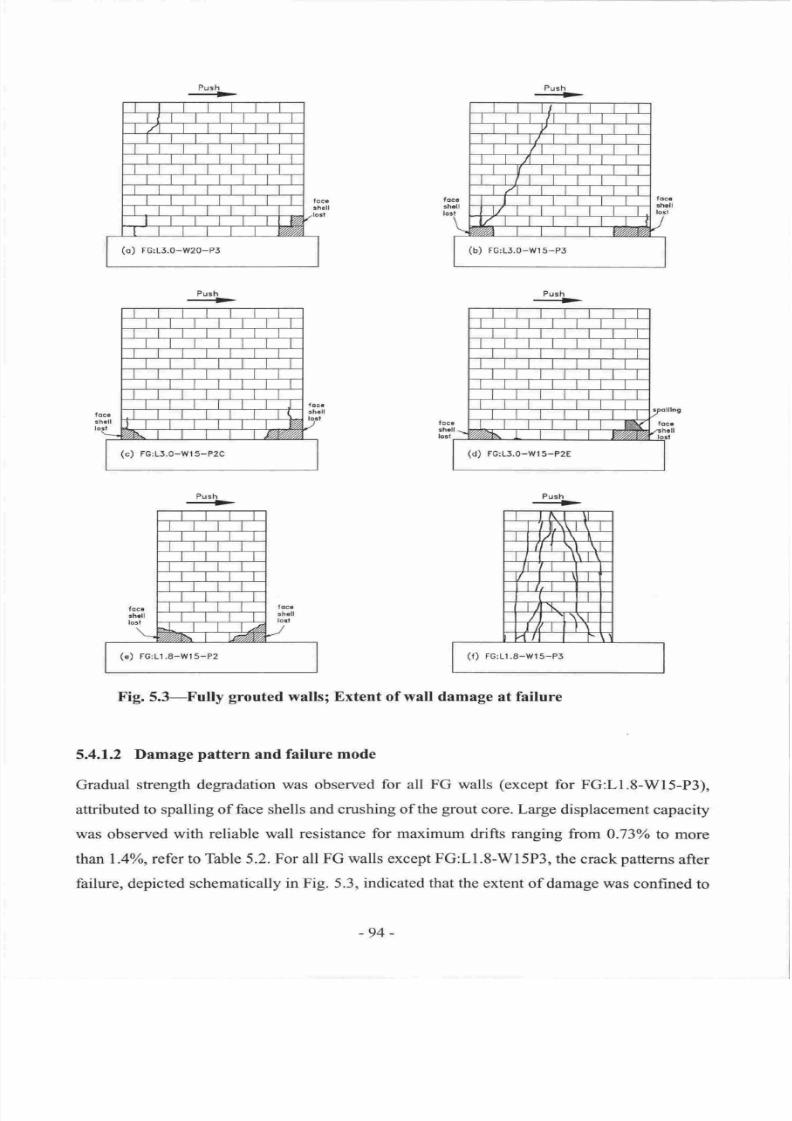
7/21/2019 PHD Laursen-masonry Prestressed Walls
http://slidepdf.com/reader/full/phd-laursen-masonry-prestressed-walls 120/308
Push
-+
(o)
FG:13,0-w20-P3
Push
Push
'+
ush
(c)
FG:15.0-Wl5-P2C
(d)
FG:LJ.o-wts-p2E
Push
(a)
FG:LI.8-Wt5-P2
Push
-+
(r)
FG:L|
.s-wr s-PI
Fig.
5.3-Fully
grouted
walls;
Extent
of
wall damage
at failure
5.4.1.2
Damage
pattern
and
failure mode
Gradual
strength degradation was
observed
for
all
FG walls
(except
for FG:L1.8-WI5-P3),
attributed
to spalling of
face
shells
and
crushing
of
the
grout
core.
Large displacement
capacity
was observed
with
reliable
wall
resistance
for
maximum
drifts
ranging
from
0.73
to
more
than
I
.4Yo,refer
to
Table 5.2. For
all
FG
walls
except
FG:L1.8-W15P3,
the
crack
patterns
after
failure,
depicted schematically
in
Fig.
5.3,
indicated that the
extent
of
damage
was
confined
to
-94-
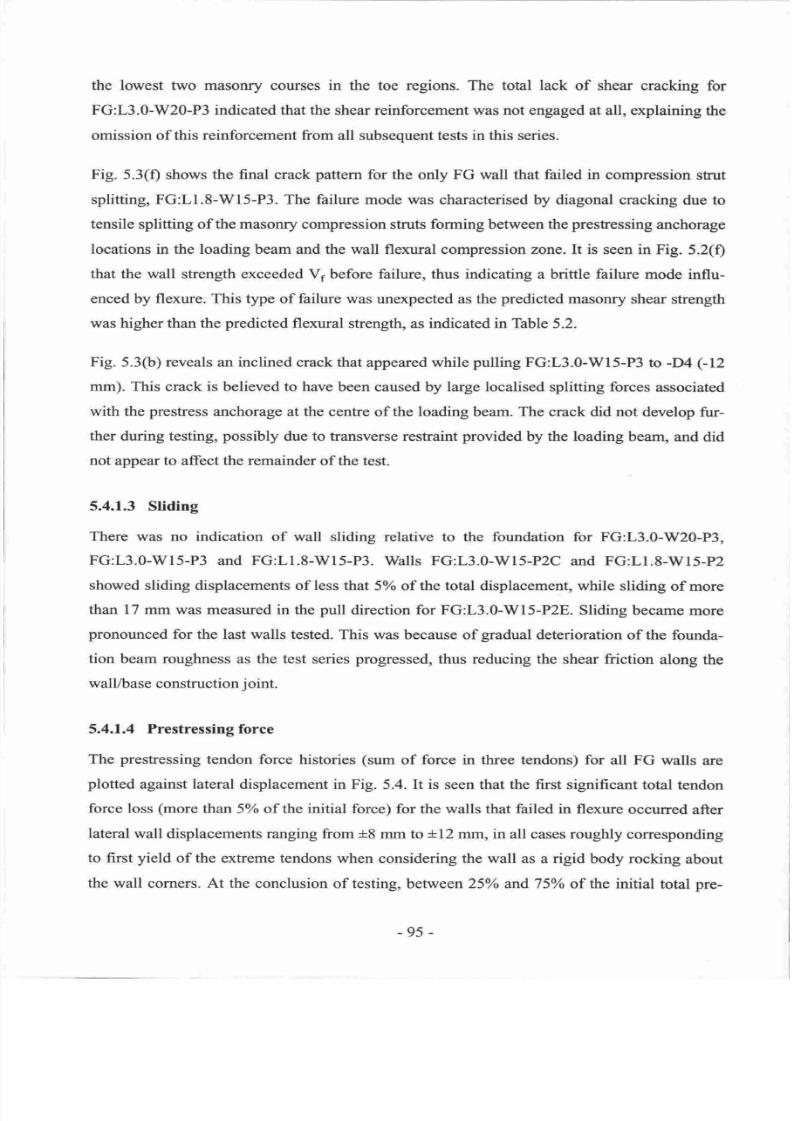
7/21/2019 PHD Laursen-masonry Prestressed Walls
http://slidepdf.com/reader/full/phd-laursen-masonry-prestressed-walls 121/308
the lowest
two masonry
courses
in
the toe regions. The total lack
of
shear
cracking
for
FG:L3.0-W20-P3 indicated
that the shear
reinforcement
was
not
engaged
at
all, explaining
the
omission
of this
reinforcement
from all subsequent tests in this series.
Fig.
5.3(f)
shows
the final
crack
pattern
for the only FG wall that failed in
compression
strut
splitting, FG:LI.8-Wl5-P3. The failure mode
was characterised
by diagonal cracking
due
to
tensile
splitting of the masoffy
compression
stnrts
forming
between
the
prestressing
anchorage
locations
in
the loading
beam and the
wall flexural
compression zone. It
is seen in
Fig.
5.2(f)
that
the
wall
strength exceeded
Vl before failure,
thus indicating
a
brittle failure
mode influ-
enced
by flexure.
This
type of failure
was
unexpected
as
the
predicted
masonry shear
strength
was higher than the
predicted
flexural
strength,
as indicated in
Table
5.2.
Fig.
5.3(b) reveals
an
inclined
crack
that
appeared while
pulling
FG:L3.0-W15-P3
to -D4
(-12
mm). This
crack is
believed
to have
been
caused by
large
localised splitting
forces
associated
with the
prestress
anchorage at the centre
of
the
loading
beam.
The
crack
did
not
develop
fur-
ther during testing,
possibly
due to
transverse
restraint
provided
by
the
loading
beam, and
did
not
appear to affect
the remainder
of
the
test.
5.4.1.3
Sliding
There
was no
indication
of wall sliding
relative to the foundation for
FG:L3.0-W20-P3,
FG:L3.0-W15-P3
and FG:LI.8-W15-P3.
Walls
FG:L3.0-WI5-P2C
and FG:L1.8-WI5-P2
showed sliding displacements of less
that
5oh of
the
total
displacement,
while
sliding
of
more
than
l7
mm
was measured
in
the
pull
direction for FG:L3.0-WI5-P2E. Sliding
became
more
pronounced
for
the
last
walls tested.
This
was
because
of
gradual
deterioration
of the
founda-
tion
beam roughness as
the test
series progressed,
thus reducing the
shear
friction
along
the
wall/base
construction
j
oint.
5.4.1.4
Prestressing force
The
prestressing
tendon
force histories
(sum
of
force
in
three
tendons) for
all FG
walls
are
plotted
against
lateral
displacement
in Fig.
5.4.
It is seen that the first significant
total
tendon
force
loss
(more
than
57o of
the
initial
force) for
the
walls
that
failed
in flexure
occurred
after
lateral
wall
displacements ranging
from +8
mm to
*12
mm, in
all
cases
roughly
corresponding
to first
yield
of the
extreme tendons
when considering
the
wall as a rigid
body
rocking
about
the
wall corners. At the conclusion
of
testing,
between
25Yo
and75 of the initial
total
pre-
-95-
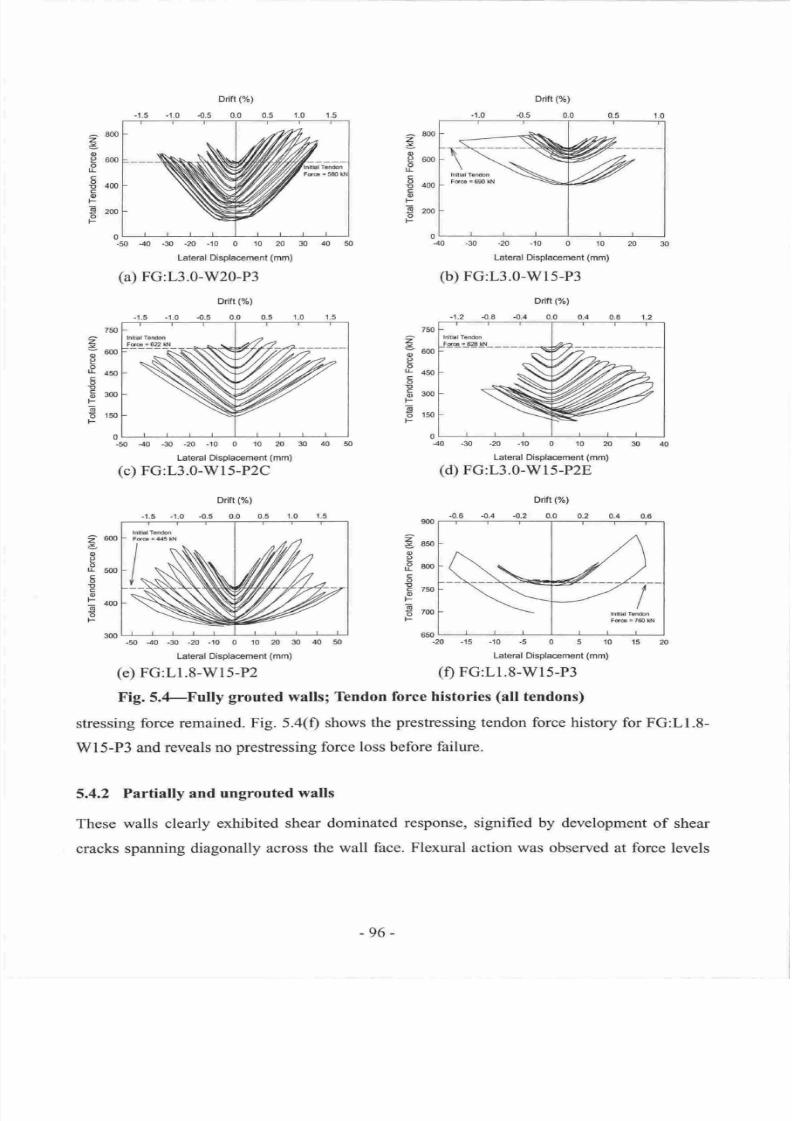
7/21/2019 PHD Laursen-masonry Prestressed Walls
http://slidepdf.com/reader/full/phd-laursen-masonry-prestressed-walls 122/308
.s0
40
-30
-20
-10
0
10
20
30
Lateral Displacemenl
(mm)
(a)
FG:L3.0-W20-P3
Drift
(%)
-1.5
-r.0
.0.5
0.0
0.5
r.0
Drift(%)
.{r.5
0.0
0
-30 -N
-'10
0 10
20
Lateral Displacernent (mm)
(b)
FG:L3.0-w1s-P3
Drifi(%)
-1.2
4-8 4.4 0.0
0.4
0.8
o
-30
-20
-10
0 10
n
30
Lateral Displacement
(mm)
(d)
FG:L3.0-wl5-P2E
Ddfr (%)
-0.6
.0.4
4.2 0.0
-1.0
^
800
z
5
o
g
600
o
L
€o*
o
F
Ert
z
J
o
e
o
u
C
o
E
o
F
E
o
F
z
o
e
&
I
E
o
t'-
6
o
F
75{l
6m
450
300
150
0
-50
-40
-30
-20
-10
0
10
m
30
Lateral Dsplacement
(mm)
(c)
FG:L3.O-W15-P2C
Ddft
P/")
.0.5
0.0
0.5
't.0
I
nitial
Tcftbn
Fd6
-
760
ldJ
-15-10-5051015?{J
Latsral Displacem€nt
(mm)
(e)
FG:L1.8-WI5-P2
(f)
FG:L1.8-W15-P3
Fig.S.4-Fully
grouted
walls; Tendon
force
histories
(all
tendons)
stressing
force
remained.
Fig. 5.4(f) shows
the
prestressing
tendon
force history
for
FG:LI.8-
Wl5-P3
and
reveals
no
prestressing
force
loss
before
failure.
5.4.2
Partially
and ungrouted
walls
These
walls clearly
exhibited
shear
dominated
response,
signified
by
development
of
shear
cracks spanning
diagonally
across the
wall
face.
Flexural action
was observed
at force
levels
-[
*[
'*f
t*F
,*L
z
T
o
P
o
I
5
c
o
F
E
o
F
'*
r,
tt
*[
",o
1-
I
*l-
15o
r
oL
.40
p#
I
I
I
L_\
-50
-40
-30 -20
-10
0
10
20 30
40
50
Lateral Dsplacement
(mm)
(e)
FG:LI.8-Wl5-P2
-96-
7/21/2019 PHD Laursen-masonry Prestressed Walls
http://slidepdf.com/reader/full/phd-laursen-masonry-prestressed-walls 123/308
Drift
(%)
"0.8
-0.6 -0.4
4.2 0.0
0.2
0.4
.25
-m
I
(fl.
/'
V=9rkN
-----c=-
0.6
0.8
125
1m
€ts
=5
3
so
Eb25oo
FSU
da
fl
s'50
co
-ro
-100
-125
z
x
(
o
o
o
o
s
dl
150
100
50
0
-50
.100
-150
400
300
200
100
0
-'t00
-200
-300
-4m
300
20
r00
o
.100
.200
.300
-15-r0-5051015?o25
Lateral Displacement
(mm)
-r0-8-6-4-20246
Lateral Displacement
(mm)
(b)
UG:L1.8-w10-P2a)
PG:L3.0-Wl5-P2
Fig.
S.S-Partially
and
ungrouted
walls; Forcedisplacement
histories
up
to approximately nominal
flexural
strength,
V1,
BS
indicated
in
Fig.
5.5.
Distress
of
the
flex-
ural
compression
zone
was not observed and
tendon
yielding
never
occurred.
5.4.2.1 Force-displacement
response
Fig.
5.5(a)
shows the force-displacement
history
for PG:L3.O-WI5-P2.
At
displacements of
approximately
+3.91-2.3
mm, diagonal
shear
cracking
initiated
with significant strength degra-
dation
in
both
directions of loading,
however PG:L3.O-Wl5-P2
did
not exhibit sudden failure
at this
point
and retained
more than 600/o
of
its maximum
strength up to displacements
of
approximately
t10
mm.
Wall
UG:L1.8-W10-P2
initially exhibited flexural
and rocking
response, signified by opening
of
one
single crack at
the base of the wall
for load
levels up
to
Vs.
Inclined shear cracking then
initiated, resulting in
wall failure.
Fig.
5.5(b)
shows the
non-linear elastic
wall
response
of
UG:L1.8-W1,0-P2
with nearly symmetrical response
in the
push
and
pull
directions
for
applied
lateral forces
up to V1
5.4.2.2 Damage
pattern
and failure mode
The failure
modes for both the PG and UG
walls were
characterised by diagonal
shear
cracking
initiated by tension splitting along
the axis
of
the
diagonal strut.
For the PG
wall,
the
cracks
followed the vertical and horizontal mortar
joints
as shown
in Fig. 5.6(a).
For the UG
wall
the
cracks
took
a
more direct
path
through
the
concrete
masonry units,
as shown
in Fig.
5.6(b).
This failure
mode
was anticipated
for
both
walls, despite
prediction
of
nominal
shear
strength
higher than nominal flexural strength
(Table
5.2), because
the relatively
high steel content was
-97 -
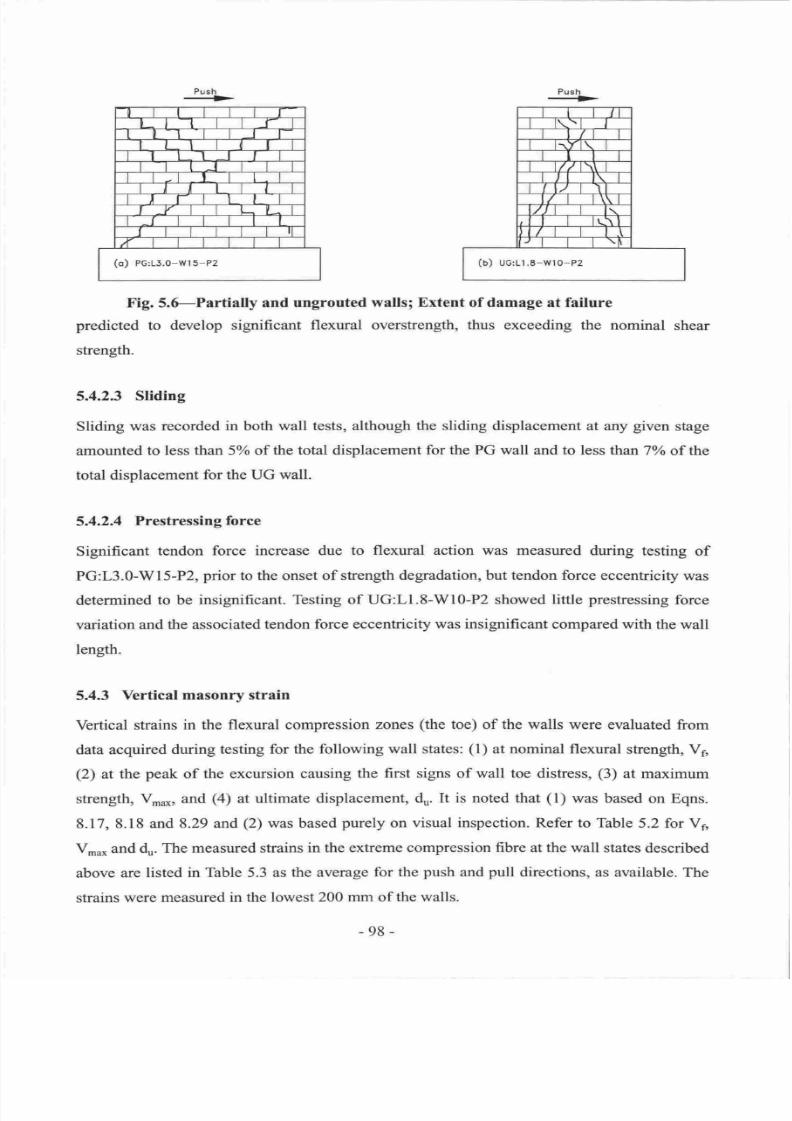
7/21/2019 PHD Laursen-masonry Prestressed Walls
http://slidepdf.com/reader/full/phd-laursen-masonry-prestressed-walls 124/308
Push
(o)
PG:1J.0-wl5-P2
Push
(b)
uc:Lr
.E-wr o-P2
Fig.
S.fPartially
and ungrouted
wallsl Extent
of damage at failure
predicted
to
develop
significant flexural
overstrength,
thus
exceeding
the
nominal
shear
strength.
5.4.2.3
Sliding
Sliding
was
recorded in both
wall tests, although the sliding displacement
at any
given
stage
amounted
to
less than 5 o
of
the
total
displacement
for
the PG
wall
and
to
less
than
7o/o of the
total displacement
for the UG wall.
5.4.2.4
Prestressing
force
Significant
tendon force
increase due to flexural action was
measrued
during
testing
of
PG:L3.0-WL5-P2,
prior
to the
onset
of stength
degradation, but tendon force eccentricity
was
determined
to be insignificant.
Testing of
UG:L1.8-W10-P2 showed little
prestressing
force
variation
and
the
associated
tendon force eccentricity
was insignificant
compared with
the wall
length.
5.4.3
Vertical
masonry strain
Vertical
strains
in the
flexural compression
zones
(the
toe) of the walls
were evaluated
from
data
acquired
during testing for
the following
wall states:
(l)
at nominal
flexural
strength, Vs,
(2)
at
the
peak
of the excursion
causing
the first signs of wall
toe distress,
(3)
at
maximum
strength,
V**,
and
(4)
at ultimate
displacement, du.
It is noted
that
(1)
was based
on Eqns.
8.17, 8.18
and 8.29 and
(2)
was
based
purely
on
visual inspection.
Refer
to
Thble
5.2
for
Vs,
Vn'u*
and
du.
The measured strains
in the extreme compression
fibre
at the wall
states described
above
are
listed in
Table
5.3
as
the
average
for
the
push
and
pull
directionsn as
available. The
strains
were
measured in the lowest
200 mm of
the
walls.
-98-
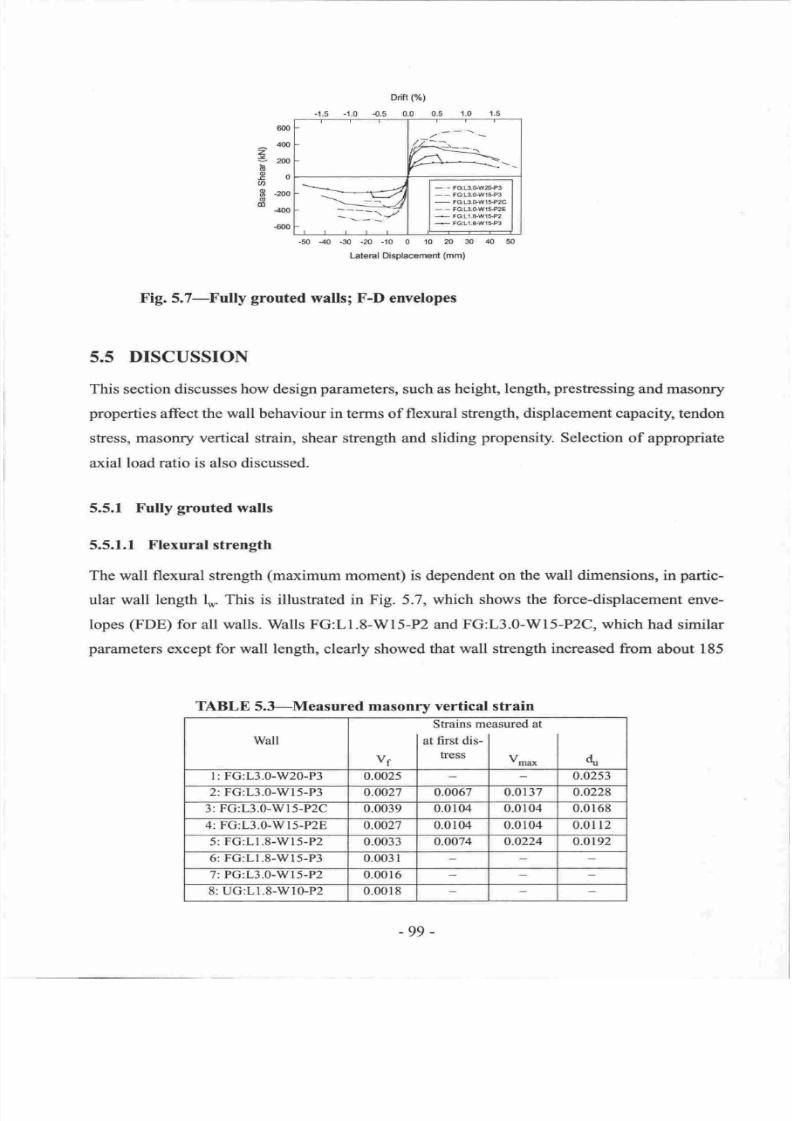
7/21/2019 PHD Laursen-masonry Prestressed Walls
http://slidepdf.com/reader/full/phd-laursen-masonry-prestressed-walls 125/308
Drift( )
-1.5 -1.0
.O.5
0.0
0.5 1.0
1.5
600
^
400
z
5
269
6
go
tt,
E
-zoo
o
6
400
€00
H-
-..-+_.<-4
==v
-
-
FG:L3.GWa}P3
--
FG:L3,GWl3,P3
-
FG:L3,0-W13.P2C
-
-
FG|UISW1*2E
.5
FG:L1_8;W15.P2
+
F6:L.t.&Wr3-P3
-50
40
-30 -20 -10
(
Lateral Displacemont
(mm)
Fig. S.7-Fully
grouted
walls;
F-D
envelopes
5.5
DISCUSSION
This
section
discusses
how
design
parameters,
such as
height,
length,
preshessing
and masoDry
properties
affect the
wall
behaviour
in
terms
of flexural
strength, displacement capacity,
tendon
stress, masonry
vertical strain,
shear strength and
sliding
propensity.
Selection of
appropriate
axial
load
ratio
is also
discussed.
5.5.1
Fully
grouted
walls
5.5.1.1 Flexural strength
The
wall
flexural
strength
(maximum
moment)
is dependent
on the wall dimensions, in
partic-
ular
wall length l* This is illustrated
in
Fig. 5.7, which
shows
the force-displacement
enve-
lopes
(FDE)
for
all walls. Walls FG:LI.8-Wl5-P2
and
FG:L3.0-WI5-P2C, which
had similar
parameters
except
for wall length, clearly
showed that
wall
strength increased
from
about
185
TABLE S.3-Measured masonrv
vertical
strain
Wall
Sbains mr
I
at
first dis-
|
Vf
I
tress
I
nsured at
V,ol
o
l:
FG:L3.0-W20-P3 0.0025
0.0253
2: FG:L3.0-Wl5-P3
0.0027 0.0067
0.0137 0.0228
3: FG:L3.0-Wl5-P2C 0.0039 0.0104 0.0104 0.0168
4: FG;L3.GWl5-P2E 0.0027 0.0104 0.0104
0.01l2
5: FG:LI.8-Wl5-P2 0.0033 0.0074
0.0224 0.0192
6:
FG:L1.8-Wl5-P3
0.0031
/:
ru:LJ.0-wl5-PZ
0.0016
8:
UG:L1.8-WlGP2 0.0018
-99
-
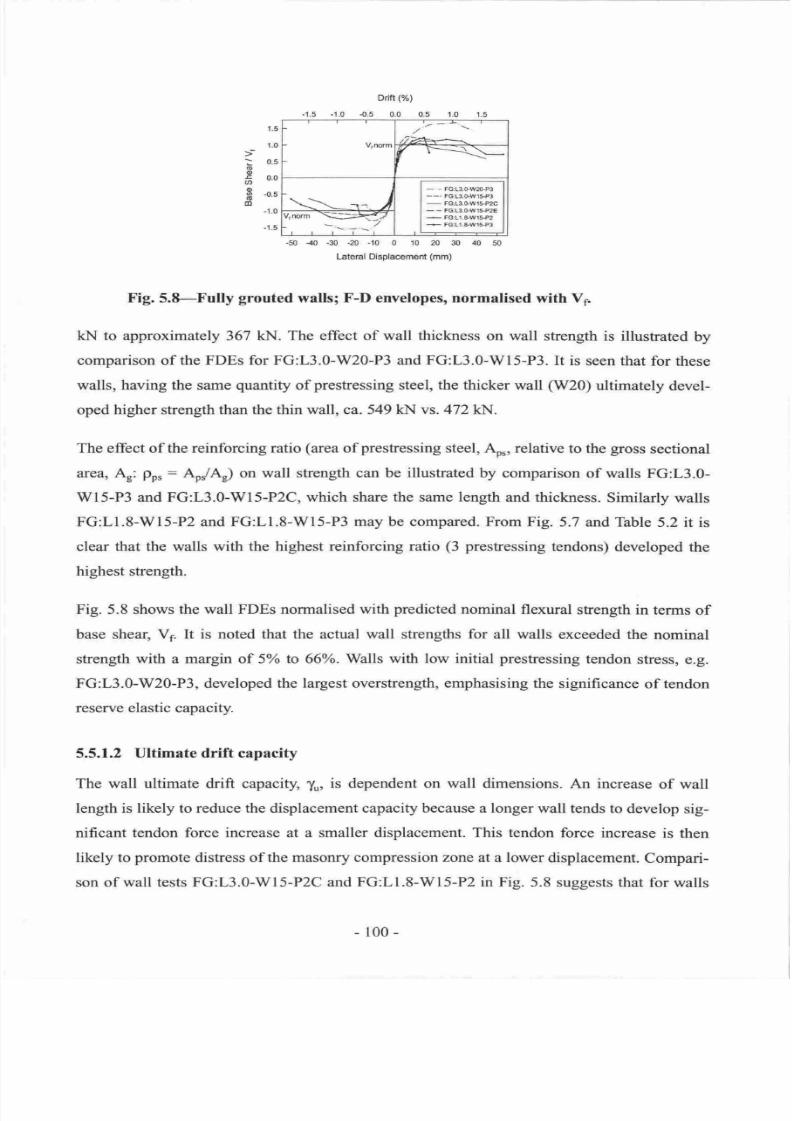
7/21/2019 PHD Laursen-masonry Prestressed Walls
http://slidepdf.com/reader/full/phd-laursen-masonry-prestressed-walls 126/308
Drift
(%)
-1.5 -1.0 -0.5
0.0
1.5
.0
t_5
1.0
0.5
0.0
{,J
-1.0
.1.5
-50
-40
.30
-z)
-10
0 10 2A 30 40
50
Lateral
Displacement
(mm)
Fig.
5.8-Fully
grouted
walls; F-D envelopes, normalised
with Vp
kl.l
to
approximately
367
kN.
The effect
of
wall
thickness
on
wall
strength
is
illustrated
by
comparison
of
the FDEs
for FG:L3.0-W20-P3
and
FG:L3.0-W15-P3.
It
is
seen that for
these
walls, having the same
quantity
of
prestressing
steel, the thicker wall
(W20)
ultimately
devel-
oped
higher
shength than the
thin
wall,
ca. 549 kN vs. 472kJ{.
The
effect of
the
reinforcing ratio
(area
of
presfessing
steel,
\,
relative to
the
gross
sectional
area, Ar:
pp,
:
Apr/Ar) on
wall
strength can
be illustrated
by comparison
of walls
FG:L3.0-
Wl5-P3
and
FG:L3.0-W15-P2C,
which
share
the
same
length
and thickness.
Similarly
walls
FG:L1.8-WL5-P2 and FG:L1.8-WI5-P3
may
be compared. From Fig.
5.7 and Table
5.2 it
is
clear
that the
walls
with the highest reinforcing ratio
(3
prestessing
tendons)
developed
the
highest strength.
Fig. 5.8 shows
the wall FDEs normalised
with
predicted
nominal
flexural
stength in
terms
of
base shear, Vr.
It
is noted
that
the
actual wall strengths for
all walls
exceeded the
nominal
strength
with
a margin
of
5o/o
to
66Yo.
Walls
with low initial
prestressing
tendon
stresso
e.g.
FG:L3.0-W20-P3,
developed
the largest overstrength,
emphasising
the
significance
of tendon
reserve
elastic
capacity.
5.5.1.2
Ultimate drift capacity
The wall ultimate drift capacity,
%,
is dependent on
wall
dimensions.
An increase
of wall
length is likely to reduce the displacement capacity because a
longer
wall tends
to develop
sig-
nificant
tendon
force
increase
at a
smaller
displacement.
This
tendon
force
increase
is
then
likely to
promote
distress of
the
masonry
compression zone
at a lower
displacement.
Compari-
son of
wall tests FG:L3.0-Wl5-P2C and
FG:L1.8-W15-P2
in
Fig.
5.8
suggests that
for walls
t
o
tu
E
a
s
o
TD
Vnom
,''---
fi*+-
r
\--\ rr )
-
-
FG:L3.GWm.P3
--.FG:L3-GW1 3
-
FG:L3.Gt/yt59zc
-
-
FG:l-3.0'Wt5+:lE
-
FG.Lt.6,W15+2
-
FGiLl.&W15f3
-100-
7/21/2019 PHD Laursen-masonry Prestressed Walls
http://slidepdf.com/reader/full/phd-laursen-masonry-prestressed-walls 127/308
with identical
po,
and location of
presfressing
steel, the shorter wall had considerably
larger
ultimate displacement capacity.
Increase
of
wall
height is
expected
to
increase
the wall ulti-
mate
displacement
capacity,
partially
due to the longer unbonded
length
of the
prestressing
tendons.
The ultimate
drift
capacity thus
increases
with
an increase
in wall
aspect
ratio,
.\
:
hJl*
An
increase
of reinforcing
ratio,
pp'
is expected
to
reduce
the wall
ultimate
drift
capacity
as a
consequence
of an
increase
of
the
flexural
compression
zone length,
which
imposes higher
strain
on
the
extreme
masonry
fibre at any
given
wall
displacement.
This behaviour
is illus-
trated by comparison
of
walls
FG:L3.0-Wl5-P3
and FG:L3.O-WI5-P2C, which share
the
same
masonry
dimensions.
The
initial
prestress
in
the
tendons
is not
expected
to influence
the
wall
ultimate
displacement
capacity
greatly
because
yu
is
rather
controlled
by
the
magnitude
of the
tendon
yield
force.
5.5.1.3 Tendon
yielding
Tendon
yielding
was
generally
expected
for
all
walls because of
the
relatively
short
unbonded
tendon lengths,
and
was
recorded in all
tests
except
FG:L1.8-W15-P3. The wall
drift
corre-
sponding
to tendon
yield
is largely affected
by
three parameters,
wall
aspect
ratio,
A , tendon
initial
stress and
tendon
location.
A longer
wall
typically
results
in a lower
tendon
yield
displacement
because
of comparatively
larger tendon
strains at a
given
lateral
displacement.
An
increase
in wall
height results
in
longer unbonded
tendon length
and
therefore
in
higher
tendon elongation
and
base
rotation
before
yield.
Thus an
increase
of the wall
aspect
ratio,
A,,
results
in
higher
wall
drift before
tendon
yield,
assuming that the
tendons remain
unbonded over
the entire
wall
height.
In order to effectively
avoid
yielding
of the
prestressing
tendons,
it is typically
necessary
to
keep
the tendons
unbonded
over several
storeys and
to
keep
the
initial
tendon
sfess relatively
low, say in the
range
of
40%-60%
of the
tendon
yield
stress.
In typical masonry
structures, it
may not
be
feasible to
require
elastic tendon
response
at high
displacements.
Still,
adequate
wall
performance
can be
achieved
despite
yielding
of tendons,
as has been
demonstrated
by
the
research
described herein.
It is
noted that
perhaps
50%
the restoring
moment for typical
struc-
tural
walls originates from the selfireight
of
the wall
and supported
floors.
A
parallel
can
be
drawn
to
research
by Kurama
et
al.
[5-5],
who
investigated unbonded
post-tensioned
concrete
-
101
7/21/2019 PHD Laursen-masonry Prestressed Walls
http://slidepdf.com/reader/full/phd-laursen-masonry-prestressed-walls 128/308
walls
and concluded
that
adequate seismic
performance
could be
achieved
despite
yielding
of
tendons.
Also,
the tendon distribution along the
length
of
the wall
significantly
affects the
tendon
yield
displacement.
Considering the
two
extreme
tendon
locations,
at
the wall
ends and
at the wall
centreline,
it
becomes evident
that the strain in
the
tendon
on the
wall
centreline
is
approxi-
mately half of
the
strain in the
tendon at the wall end
for
a
given
lateral
displacement,
assuming
wall
rocking about the comers.
It
may
not be feasible
for
masonry
walls to
have
all tendons
placed
near the wall centreline. Use of
distributed tendons may
be
necessary
due to considera-
tion of
e.g. wall
penetrations
and out-of-plane
forces.
5.5.1.4
Vertical masonry strain
Table 5.3
shows the vertical strain recorded
in the
walls
at different
stages of the tests.
It is
seen
that
the calculated masonry strains
corresponding
to the nominal
flexural
condition ranged
between
0.0025 and 0.0039. These
results suggest
that the
above equations
capture
the code-
defined
nominal flexural strength condition
in a realistic and reasonably
consistent fashion.
An
average
strain of 0.0030
was
found
when
discarding the two extreme
values. This result
can
be
compared
with
the strain
limit
at
nominal flexural
strength
(unconfined masonry)
given
by
the
New
Zealand masonry code, NZS
4230:1990, of 0.0025,
refer
to Chapter
3.
Masonry
strains associated
with
the first sign of
toe reglon
distress
may
be regarded
as
an alter-
native
definition of the ultimate
flexural condition.
It is seen from
Table 5.3 that
these
strain
values
vary between 0.0067 and 0.0104,
about
2 to 3 times higher
than those
associated
with
nominal
flexural strength.
Masonry
strains associated with
the maximum wall
strength were for walls
FG:L3.0-WI5-P2C
and
FG:L3.0-WI5-P2E
similar to
those associated
with
the first visual
sign of toe
distress.
Walls
FG:L3.0-W15-P3 and
FG:L1.8-W15-P2 showed
that the
masonry strains
at maximum
strength
were three to
four times as
high as those associated with the fust visual
sign
of toe dis-
tress.
Thble 5.3
indicates
that masonry extreme
fibre strains
ranged
between 1.1
and 2.5o/o
atthe
ultimate
displacement.
These values
are
of
course
of
theoretical
character
as
the toe
regions
were damaged
at
this
stage, so
that those
strains should not be regarded
as the reliable
ultimate
strain capacity
of concrete masonry.
The results do nevertheless suggest
that masonry
strains
t02
-
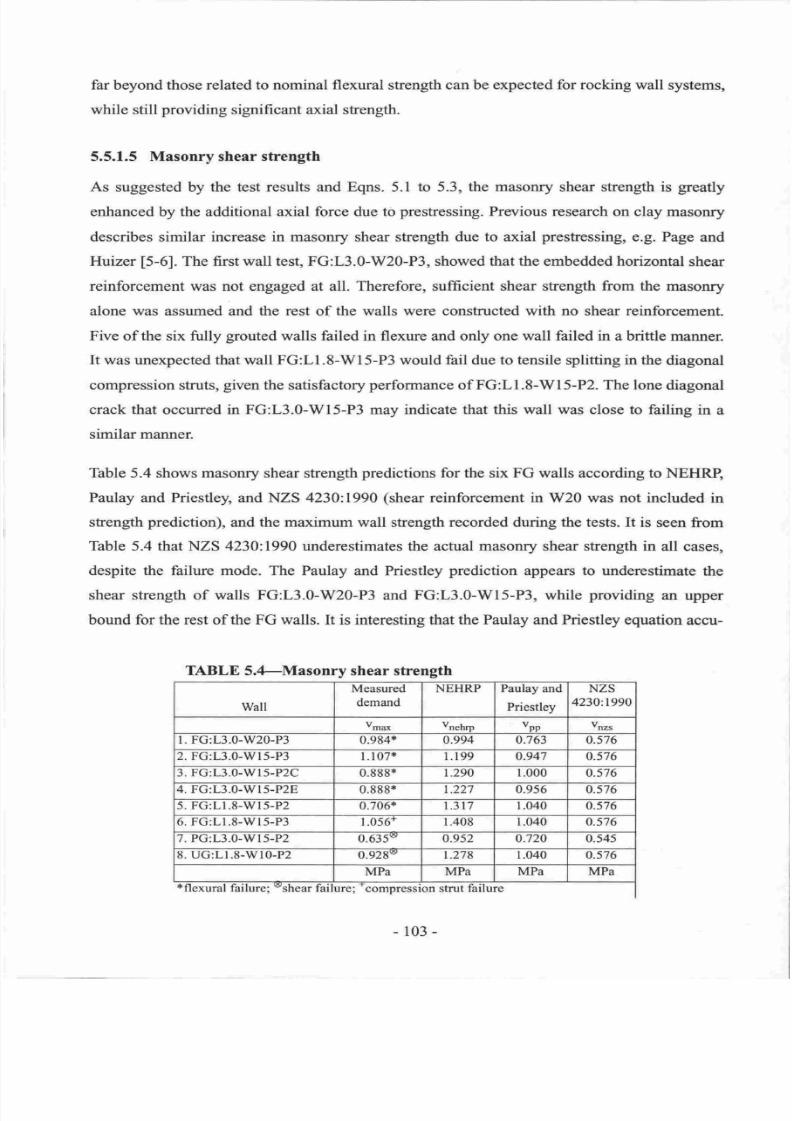
7/21/2019 PHD Laursen-masonry Prestressed Walls
http://slidepdf.com/reader/full/phd-laursen-masonry-prestressed-walls 129/308
far
beyond
those
related
to nominal flexural
strength
can be
expected
for
rocking
wall systems,
while still
providing
significant axial strength.
5.5.1.5 Masonry shear strength
As suggested
by
the lest
results
and
Eqns.
5.1
to 5.3, the
masonry
shear
strength is
greatly
enhanced
by
the
additional
axial
force
due
to
prestressing.
Previous
research
on
clay
masonry
describes
similar
increase
in masonry
shear
strength due
to axial
prestressing,
e.g.
Page
and
Huizer
t5-61.
The
first
wall
test, FG:L3.0-W20-P3,
showed
that the
embedded
horizontal
shear
reinforcement
was
not
engaged
at
all. Therefore,
suf,ficient shear strength
from the
masonry
alone
was
assumed
and the
rest
of
the
walls
were
constructed
with
no
shear
reinforcement.
Five of
the
six frrlly
grouted
walls failed
in
flexure
and
only
one
wall
failed in
a
brittle
manner.
It was
unexpected that
wall FG:LI.8-W15-P3 would fail due to
tensile
splitting
in the
diagonal
compression struts,
given
the satisfactory
performance
of
FG:LI.8-Wl5-P2.
The
lone
diagonal
crack that occurred in FG:L3.0-WI5-P3 may indicate that this wall
was
close to failing
in
a
similar
manner.
Table
5.4
shows
masonry
shear
strength
predictions
for
the
six
FG
walls
according to NEHRP,
Paulay and
Priestley, and
NZS
4230:1990
(shear
reinforcement
in
W20
was
not included
in
strength
prediction),
and
the
maximum wall
strength recorded
during
the
tests. It is
seen from
Table 5.4 that NZS 4230:1990
underestimates
the
actual
masonry
shear strength
in all
cases,
despite the failure mode. The Paulay
and
Priestley
prediction
appears
to
underestimate
the
shear strength of walls FG:L3.0-W20-P3
and
FG:L3.0-WI5-P3,
while
providing
an
upper
bound
for
the
rest of
the FG
walls.
It
is
interesting that
the Paulay
and
Priestley
equation
accu-
TABLE
S.4-Masonry
shear
strength
Wall
Measured
demand
NEHRP
Paulay
and
Priestley
NZS
4230:1990
Vmax Vnehm vnn vnzs
l. FG:L3.0-W20-P3 0.984{, 0.994 0.763
0.s76
2.
FG:L3.0-Wl5-P3
l.107* 1.199
o.947 0.576
3. FG:L3.0-Wl5-P2C
0.888'r
t.290
1.000
0.576
4.
FG:L3.0-Wl5-P2E 0.ggg* 1.227 0.956 0.s76
5. FG:L1.8-Wl5-P2
0.706{'
t.317 1.040
0.576
6.
FG:L1.8-Wl5-P3
1.056f 1.408
1.040
0.s76
7. PG:L3.0-Wl5-P2
0.635
0.952 0.720
0.545
8. UG:L1.8-WI0-P2
0.928
l,278 1.040
0.576
MPa MPa
MPa
MPa
*flexural
failure;
shear
fai
ure;
-compression
strut failure
-103-
7/21/2019 PHD Laursen-masonry Prestressed Walls
http://slidepdf.com/reader/full/phd-laursen-masonry-prestressed-walls 130/308
rately
predicts
the strength
at
which
FG:L1.8-Wl5-P3 failed.
The
NEHRP
expression does
in
all cases
predict
shear strengths
higher than
the
maximum
measured
strengths.
It is noted that
the
geometry
of the utilised
concrete
masonry units is
likely to
significantly
inlluence the masonry shear strength. For example, one can
compare
a wall
constructed
entirely from
masonry
open end units, resulting
in
horizontal
discontinuity
of
the
grout
core,
and
a wall
constructed
with H-units
that
allow
both
vertical
and
horizontal
grout
continuity.
It
is
clear that the
latter solution
provides
a
more
monolithic wall,
being likely
to
possess
higher
masoffy shear
strength.
Note however
that no
testing
was
conducted
specifically to validate
this conclusion.
5.5.1.6
Sliding
propensity
Wall sliding
was
generally
not a
problem.
However, for wall FG:L3.0-W15-P2E
significant
sliding
occurred.
This
phenomenon
may
(and
should)
be
eliminated by
ensuring
adequate
shear
friction
between
wall
and
foundation
by requiring
a
certain
magnitude
of
roughness
of
the
wall to foundation
interface, refer to Chapter
8
for
an
in-depth
discussion.
Alternatively,
the
wall
could
be recessed
for
example
100 mm into
the
foundation
beam,
or
dowel bars
could
be
incorporated
in
the construction
joint
to
arrest
any
sliding.
5.5.1.7
Axial load
ratio
The initial axial
load
ratio in
the
wall
highly
affects
the
wall
performance.
Realistic ratios
are
found in
the
interval
between,
say,
0.05
and 0.20. Self-weight
constitutes
a significant
compo-
nent
of
the
axial
load
ratio. In a multi-storey
masonry
building, self-weight of
the
above
floors
may cause
masonry
stress
at
the
foundation level of
1.0
MPa or more, i.e.
an
axial
load ratio
component
of
0.06
for
l8
MPa
concrete masonry.
The lower bound
is due
to
practical
considerations
in
terms
of
prestressing
losses
(i.e.
shrink-
age,
creep,
etc.)
and
due to serviceability
limit
state
considerations
such
as first cracking
and
lateral wall stiffness.
The lowest ratio for
this test
series
was
0.077 for wall
FG:L3.0-W15-
P2C,
which
performed
satisfactorily.
The upper bound
serves
to
keep the
axial reinforcing ratio
reasonably
low.
A
high ratio
also
reduces
the efficiency of
the wall in terms of flexural
strength, due
to
a
relatively
long
com-
pression
zone, and reduces
the
wall
displacement
capacity.
It
is
furthermore difficult
to
achieve
satisfactory
distribution of high
prestressing
anchorage forces
in
a
concrete
masonry wall,
e.g.
104
-
7/21/2019 PHD Laursen-masonry Prestressed Walls
http://slidepdf.com/reader/full/phd-laursen-masonry-prestressed-walls 131/308
Page
and
Shrive
[5-7].
Wall FG:LI.8-W15-P3, t]rat failed
due
to tensile
splitting
of
diagonal
compression struts, had
a
relatively high
axial force
ratio
of
0.167. The
concentration
of
pre-
stessing
tendons
in
the
middle of that wall may
have
caused
localised
stress
concentration in
the top
of
the
wall,
potentially
initiating
the diagonal cracking.
5.5.2 Partially and ungrouted
walls
5.5.2.1 Masonry shear strength
Prediction
of shear
strength
of
partially
grouted
and ungrouted
walls
follows
the
same
princi-
ples
as outlined
for
fully
grouted
walls,
using
the
initial total
tendon
force,
P.
Evaluation
of the
wall width for
the
purpose
of
calculating shear
strength
for
partially
and
ungrouted
masonry
should, however,
be
based
on the
sum of
the masonry
unit
flange thicknesses.
Singular
grouted
cells
or
masonry
unit
webs are
not included
in
the
shear
flow
through
the
panel
and therefore
cannot
be expected to
carry
shear
Paulay
and
Priestley
[5-a[.
For
walls PG:L3.0-WI5-P2
and
UG:L1.8-W10-P2, the
effective wall thickness for
shear
calculation
amounted
to 63
mm
and
6l mm respectively.
Partially
grouted
and
ungrouted
wall shear
demand
and masonry
shear
strength
comparison is
provided
in Thble
5.4.
The shear
demand
is
determined
from
the
maximum
shear
carried
by the
walls
before
shear failure.
Predicted
masonry
shear
strength
was
calculated
according
to
Eqns.
5.1
through
5.3 using
a
masonry
crushing
strength
of 13.3 MPa for PG:L3.0-WS-P2
and 15.0
MPa
for UG:LI.8-Wl0-P2. It is
noted
that
the
masonry crushing
strength
for PG:L3.0-WI5-
P2,
given
in
Table 5.1,
was
specific to a
grouted
cell, while the above
value
constitutes
an
aver-
age
for the
partially
grouted
wall.
It
is
seen
from
Table
5.4 that the masonry
shear
strength
predicted
by
NZS
4230:1990,
Eqn.
5.3,
gives
conservative
estimates
of
actual
masonry shear
strength. The
prediction
was
reason-
ably
close
for
the
squat wall
L3.0)
while
rather
low for
the
slender wall
L1.8).
Comparison
of
test
results
with the masonry
shear strengths
predicted
by the
NEHRP
provisions
and
that
advocated
by
Paulay
and
Priestley,
indicate that Eqns.5.l and 5.20
overestimate
the
actual
shear
strength considerably,
and
are
therefore unconservative
for
partially
and
ungrouted
walls.
-105-
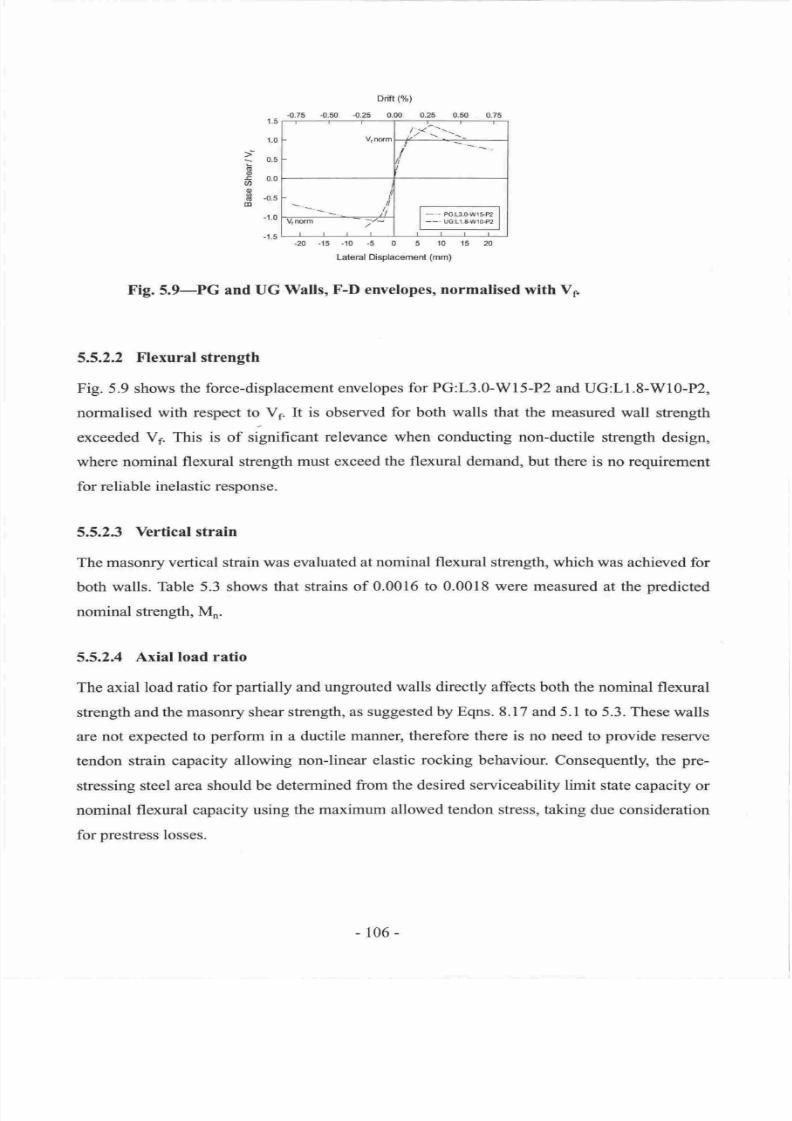
7/21/2019 PHD Laursen-masonry Prestressed Walls
http://slidepdf.com/reader/full/phd-laursen-masonry-prestressed-walls 132/308
-0.75
Ddfr
(yo)
4.25
0.00
Vnorm
1 *l----
t
/r
.15
-10
-5
0 5
10 15
Lateral Displacement
(mm)
Fig.5.9-PG and UG
Wallsn
F-I)
envelopes,
normalised
with
VF
5.5.2.2
Flexural
strength
Fig.
5.9 shows the force-displacement
envelopes
for PG:L3.0-WI5-P2
and UG:L1.8-Wl0-P2,
normalised
with
respect
to
Vs.
It
is
observed
for
both walls
that the
measured
wall
strength
exceeded
V1.
This
is
of significant
relevance
when
conducting non-ductile
strength
design,
where
nominal flexural
strength
must
exceed
the
flexural
demand,
but
there
is
no
requirement
for
reliable inelastic
response.
5.5.2.3
Verticalstrain
The
masonry
vertical
strain
was
evaluated
at nominal flexural
strength,
which was
achieved
for
both
walls. Table 5.3
shows
that
strains
of 0.0016
to
0.0018 were
measured
at the
predicted
nominal
shength,
Mn.
5.5.2.4
Axial load
ratio
The
axial
load
ratio for
partially
and
ungrouted
walls directly
affects
both
the nominal flexural
strength
and
the masonry
shear
strength,
as suggested
by Eqns. 8.17
and 5. I to
5.3.
These
walls
are
not
expected
to
perform
in a
ductile
manner,
therefore there
is
no
need
to
provide
reservc
tendon strain
capacity allowing
non-linear
elastic rocking
behaviour-
Consequently,
the
pre-
stressing
steel area
should
be
determined
from
the desired
serviceability
limit
state capacity
or
nominal
flexural
capacity using
the
maximum
allowed
tendon
stress, taking
due
consideration
for
prestress
losses.
1.5
1.0
b
o
600
o
E
o.s
d)
t.0
-1.5
106
-
7/21/2019 PHD Laursen-masonry Prestressed Walls
http://slidepdf.com/reader/full/phd-laursen-masonry-prestressed-walls 133/308
The
axial
load
ratio
that
partially
and
ungrouted
walls
can
sustain
is
probably
of
the
same
mag-
nitude as
that
suggested
for
fully
grouted
walls. It
is however
emphasised
that
proper
diffirsion
of
the concentrated
force under
the
prestressing
anchorages
is
critical.
5.6 CONCLUSIONS
A]\ID FUTURE RESEARCII
5.6.1
Fully
grouted
walls
It
is concluded that fully
grouted
unbonded
post-tensioned
concrete
masonry is a
competent
material combination for ductile
structural wall systems.
The PCM walls reported
herein
exhibited a nearly non-linear elastic behaviour dominated
by rocking
response.
Large
drift
capacity
of
more than
I.4
was measured and
still
larger
drift
capacity
can
be expected
from
higher
walls.
Only localised
damage
occurred,
as
shown in
Fig.
5.3, making
earttrquake damage
easy
to
repair. Possible tendon force
loss
could be compensated
for by
re-stressing
of the
tendons.
This
appears
feasible
because
tendon strains are expected
to
stay below
lVo
for typical
wall
dimen-
sions and
realistic
drift
ratio
demands
when
tendon
yielding
occurs over the entire
unbonded
lenglh.
Tendon
force
loss due
to
yielding
should, for
short
(squat)
walls,
be expected at
relatively
low
wall drift
ratios. Even after tendon
yielding,
reliable
and self-centring
wall
behaviour
is
expected.
Measurements
at
nominal flexural
strength, Mn,
suggest
an
extreme masonry
fibre
sfain
of
the
order
of
0.003. Strains
as high as
0.007 may
be
considered
for
design
if the
tme
ultimate
condi-
tion
is
assumed
as
being the
stage at
which
toe
distress
initiates.
Clearly, the additional axial
load from the
prestressing
enhanced
the
concrete
masonry
shear
stength. It
was
concluded that fully
grouted
PCM
walls of dimensions similar
to those
described
above,
in
most
cases did
not
need horizontal shear
reinforcement
in
order
to
develop
flexural/rocking response.
However,
one fully
grouted
wall with high
axial
presffessing
force
failed
by
tensile
splitting
of
diagonal
compression struts, suggesting
that this
issue
should
be
pursued
further.
The Paulay and Priestley
[5-4]
recofilmendation for masonry shear strength accurately
pre-
dicted the strength
of
FG:L1.8-WI5-P3,
however
this failure
was atfibuted not
atfibuted
-r07-
7/21/2019 PHD Laursen-masonry Prestressed Walls
http://slidepdf.com/reader/full/phd-laursen-masonry-prestressed-walls 134/308
directly
to
shear
but to tensile splitting
of
diagonal
compression
struts. The
NZS4230:1990
shear strength
provision
is
highly
conservative
and
seems
to unsatisfactorily
reflect
the
large
increase
in
masonry
shear
stength
due
to the axial
prestressing
force.
Relatively little
energy
dissipation
was observed
during wall cycling.
This
may
impact
the
use
of such
walls for
ductile
seismic design
in
the
sense
that
additional
damping may
be
required
to
control
the structural drift
demand
in
an earthquake event.
Further
research is
needed
to
inves-
tigate the
relationship
betrveen
PCM
wall
shength
and drift
demand
arising from
seismic exci-
tation.
5.6.2
Partially and ungrouted walls
Testing
clearly showed
that
partially
and
ungrouted PCM walls were
capable of
developing
significant
strength exceeding
the
predicted
nominal flexural
strength.
This
suggests
that
par-
tially
and
ungrouted
PCM walls
may
suitably
be
designed using
strength design.
The
wall
tests
initially displayed
flexural
behaviour
but ultimately
developed
shear
response.
Diagonal shear
cracking was the
failure
mode. Despite
this
brittle failure
mode
significant
dis-
placement
capacity was
recorded. These walls
did not
develop reliable
nonJinear
elastic
behaviour.
The additional axial force due
to
prestressing
clearly
enhanced
the
concrete masonry
shear
strength. Test
results
suggest
that none
of
the
shear strength equations
perfonned
well.
It
is
however
safe
to
use
the
NZS
4230:1990
code
requirements when
predicting
concrete
masonry
shear
strenglh
for
ungrouted
and
partially grouted
walls
basing masonry
shear
strength
on the
concrete
masonry
unit
flange
thickness.
-108-
7/21/2019 PHD Laursen-masonry Prestressed Walls
http://slidepdf.com/reader/full/phd-laursen-masonry-prestressed-walls 135/308
5.7
REFERENCES
[5-l]
Park, R., Evaluation of Ductility of Stnrctures and
Structural Assemblages
for
Labora-
tory Tbsting, Bulletin of
NZNSEE,
Vol. 22, No.
3, Sept. 1989,
pp.
155-166.
[5-2]
NZS
4230:1990, Code
of
Practice
for
the Design
of
Masonry
Structures,
Standards
Association
of
New Zealand, Wellington.
[5-3]
NEHRP, Recommended
Provisionsfor
Seismic
Regulationsfor
New
Buildings and Other
Structures,
Part
I
-
Provisions,
Building
Seismic Safety Council, Washington,
D.C.,
U.S.A.,
1997,
pp.
159-162.
[54]
Paulay, T.,
and
Priestley, M.J.N.,
Seismic
Design of
Reinforced
Concrete and Masonry
Buildings,
John
Wiley
Sons
Inc.,
L992.
[5-5]
Kurama, Y.,
Sause,
R., Pessiki,
S.,
and Lu,
L-W, Lateral Load
Behavior
and Seismic
Design of
Unbonded
Post-tensioned Precast Concrete
Walls,
ACI
Structural Journal,
July-August
1999,
pp.
622-632.
[5-6]
Page, A.W. and Huizer, A., Racking Tbsts on Prestressed
Hollow
Clay Masonry Walls,
Proceedings
of
the
8ft
International Brick/Block
Masonry
Conference,
September 1988,
Dublin
Ireland, pp. 538-547.
[5-7]
Page, A.W. and Shrive, N.G.,
Concentrated
Loads on Hollow Concrete Masonry,
ACI
Stnrctural Journal,
July-August
I
990,
pp.
43
6444.
-
109-

7/21/2019 PHD Laursen-masonry Prestressed Walls
http://slidepdf.com/reader/full/phd-laursen-masonry-prestressed-walls 136/308
ll
7/21/2019 PHD Laursen-masonry Prestressed Walls
http://slidepdf.com/reader/full/phd-laursen-masonry-prestressed-walls 137/308
Chapter 6
STRUCTURAL
TESTING
-
SERIES
2
6. ENHANCBD
SINGLE-STOREY
PCM WALLS
In-plane
response
of
post-tensioned
concrete masonry
walls
with unbonded
tendons,
incorpo-
rating strengthened
masonry and enhanced
energy dissipation,
is examined
by means
of stuc-
tural
testing.
An
introduction
to
the Series
2
wall testing
programme
is
followed
by a
presentation
of
the results
from structural testing of the five fully
grouted
walls. Discussion
of
the results is concerned with wall
structural
response
in terms of flexural
strength,
displace-
ment capaciry tendon
sfiess and masonry vertical strain, and makes
comparison
with
Series
I
testing.
6.1
INTRODUCTION
Previous testing
presented
in
Chapter
5 explored
post-tensioned
concrete masonry
(PCNO
walls made
with un-confined masonry. It
was found that such
walls
typically had
reliable
dis-
placement
capacity
(drift
capacrf) of up to
17o, however,
in
some
cases the limited
strain
capacity of un-confined
masonry
resulted
in masonry crushing and subsequent strength
degra-
dation, and
prohibited
development of further reliable drift
capacity.
One
of
the
principal
intents
of this
testing
series
was
to
irwestigate
means
of
masonry strength-
ening that
were
expected to allow for reliable drift capacity, say
of
the
order of 1.5 .
Drift
demands
of such magnitude
are
likely
to be
encountered
in structural
systems
utilising
unbonded
post-tensioned
walls when
subjected to seismic
loading
because of the inherent
lim-
ited structural damping,
see Chapter 9.
As
a consequence of limited hysteretic
energy dissipation,
additional structural damping
may
be
required
to control the wall displacement
demand during seismic activity.
As a
potentially
simple solution,
'dog-bone'-type
dampers were incorporated in
one wall test to
explore
the
efficiency
of such a device.
- lil
-
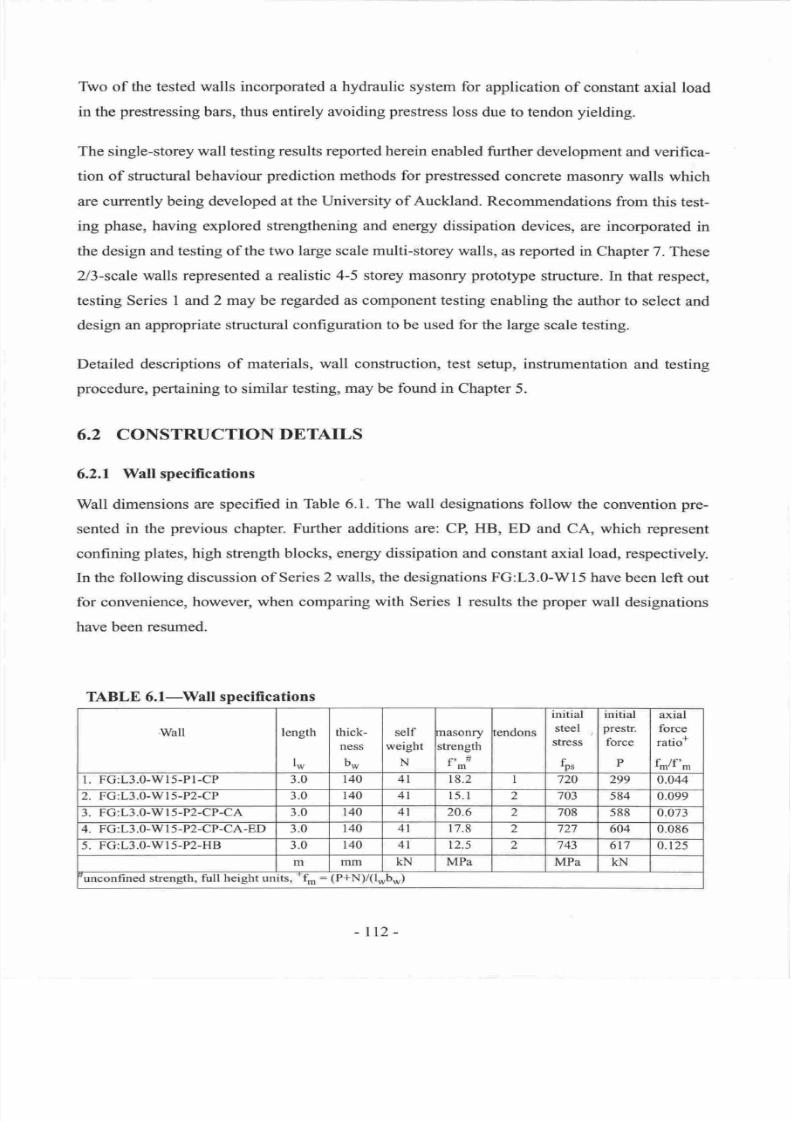
7/21/2019 PHD Laursen-masonry Prestressed Walls
http://slidepdf.com/reader/full/phd-laursen-masonry-prestressed-walls 138/308
Two of the tested walls incorporated a hydraulic system for
application of constant
axial
load
in the
prestressing
bars, thus entirely avoiding
prestress
loss
due to tendon
yielding.
The single-storey
wall testing results reported herein enabled
further
development and verifica-
tion of
structural behaviour
prediction
methods for
prestressed
concrete
masonry walls
which
are currently being developed
at the University of Auckland.
Recommendations
from this test-
ing
phase,
having explored strengthening
and energy dissipation
devices, are incorporated
in
the design and
testing
of the two
large scale multi-storey walls,
as reported
in Chapter 7.
These
213-scale
walls
represented a
realistic 4-5 storey masonry
prototype
structure.
ln
that respect,
testing
Series I
and
2
may be
regarded as component testing
enabling the
author to
select
and
design
an appropriate structural
configuration to be used for
the large scale
testing.
Detailed descriptions of
materials, wall construction, test setup,
instrumentation
and testing
procedure, pertaining
to similar testing,
may
be
found
in Chapter
5.
6.2
CONSTRUCTION
DETAILS
6.2.1
Wall specifications
Wall dimensions
are specified
in
Thble 6.1.
The
wall
designations
follow
the
convention
pre-
sented in the
previous
chapter. Further
additions are: CP,
HB, ED and
CA, which represent
confining
plates,
high
strength
blocks,
enerry dissipation
and constant
axial load, respectively.
In the
following discussion of Series
2 walls, the designations FG:L3.0-W15
have
been
left
out
for
convenience,
however, when comparing
with
Series
I
results
the
proper
wall
designations
have been
resumed.
TABLE
6.1-Wall
specifi cations
Wall
length
lw
thick-
lless
bw
self
weight
N
nasonry
strength
f -o
endons
initial
steel
stress
fo,
initial
presrr.
force
P
axtal
force
ratio-
fm/f m
l. FG:L3.0-Wl5-Pl-CP
3.0
40
4T
18.2
720 299
0.044
2. FG:L3.0-W15-P2-CP 3.0
40 4l r5.I
2 703 584
0.099
3. FG:L3.0-Wl5-P2-CP-CA
3.0
40
4l
20.6 2
708 588
0.073
4.
FG:L3.0-W15-P2-CP-CA-ED
3.0 40
4l
t7.8
2
727
604 0.086
5.
FG:L3.0-Wl5-P2-HB
3.0
40
4l
12.5
2
743 6t7
0.1
25
m mm
KN MPa
MPa
KN
unconfined
strength, full
height units,
-f.:
(P+Ny(lwbw)
-ttz-
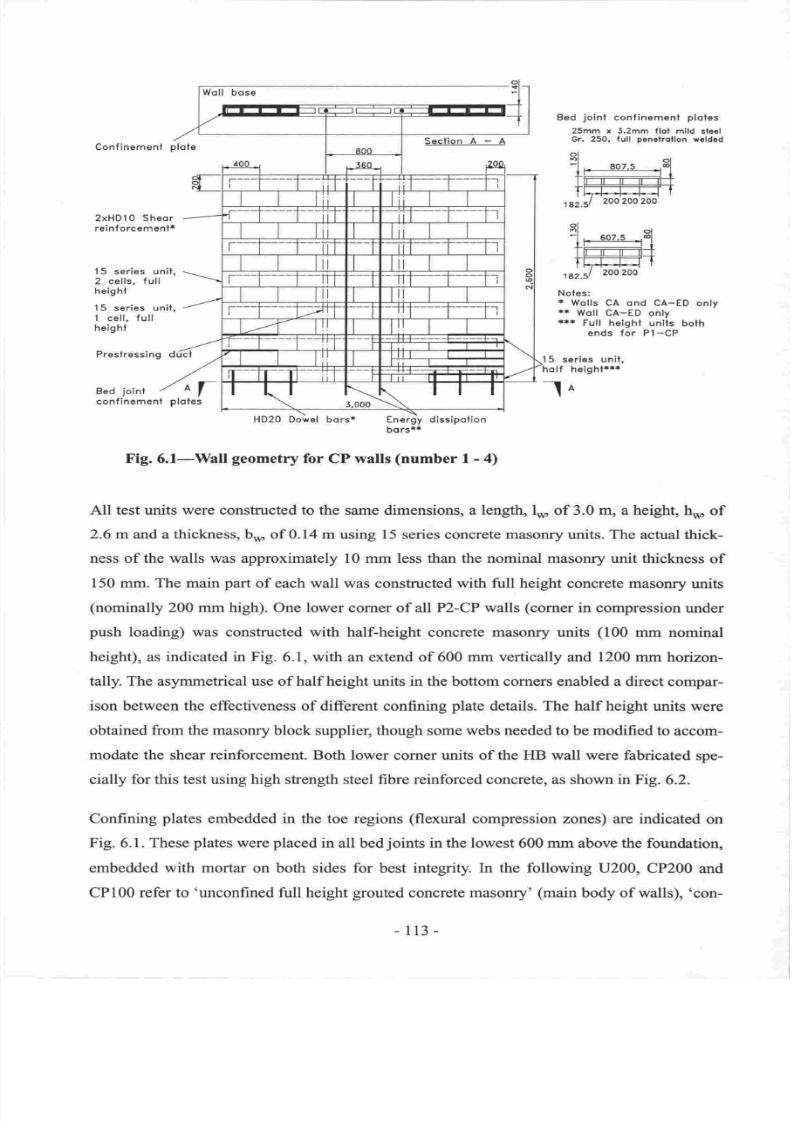
7/21/2019 PHD Laursen-masonry Prestressed Walls
http://slidepdf.com/reader/full/phd-laursen-masonry-prestressed-walls 139/308
Woll bose
Section
A
-
A
Bed
joint
confinement
plofes
25mm x 3.2mm
flof mlld sl.6l
Gr. 250, full
pcnctrollon
reldcd
*
Wolls
CA ond CA-ED
only
*t
Woll
CA-ED only
*r*
Full
helght
unils both
ends
for
PI-CP
15
serles unif.
helght*
Confinemenl olole
2xHD10
Sheor
reinf orcemenf
'
l5 series unif
,
2
cells, f ull
helght
15 series
unit,
1cell.
full
height
Preslressing d
Bed
joint
'oT
ploies
:f,
eor.u
-,fl
TF--J
rF;rEf
r
rs2.s/
2oo2oo
lr
conflnemenl
Energy
dissipolion
borsr*
Fig.6.l-Wall
geometry
for
CP walls
(number
I
-
4)
All
test
units
were constructed to the
same
dimensions, a
length,
l*
of
3.0 m,
a
height,
h*
of
2.6
m and a
thickness,
b* of
0.14
m using
l5 series
concrete masonry units. The
actual thick-
ness
of
the walls was approximately
10
mm less than the nominal masonry unit
thickness
of
150
mm. The main
part
of each wall
was
constructed
with
full
height
concrete
masonry
units
(nominally
200
mm high). One lower corner of
all
P2-CP walls
(corner
in
compression
under
push
loading) was constructed
with
half-height concrete masonry
units
(100
mm
nominal
height),
as
indicated in Fig.
6.1,
with
an extend
of
600 mm vertically and
1200
mm horizon-
tally. The
asymmetrical
use
of
half
height units in the bottom corners enabled
a
direct
compar-
ison between the effectiveness
of
different confining
plate
details. The half height
units
were
obtained from the masonry block
supplier, though
some
webs needed
to
be
modified to
accom-
modate the
shear
reinforcement.
Both
lower corner units
of the
HB
wall
were fabricated
spe-
cially for this
test
using
high
strength
steel fibre reinforced
concrete,
as
shown
in
Fig.
6.2.
Confining
plates
embedded
in
the toe
regions
(flexural
compression
zones) are indicated
on
Fig.
6.1.
These
plates
were
placed
in all
bed
joints
in the lowest
600
mm
above
the
foundation,
embedded
with
mortar
on
both sides
for
best
integrity.
In
the
following
U200, CP200
and
CP100
rofer
to
'unconfrned
full
height
$outed
concrete masonry'
(main
body of walls),
'con-
-113-
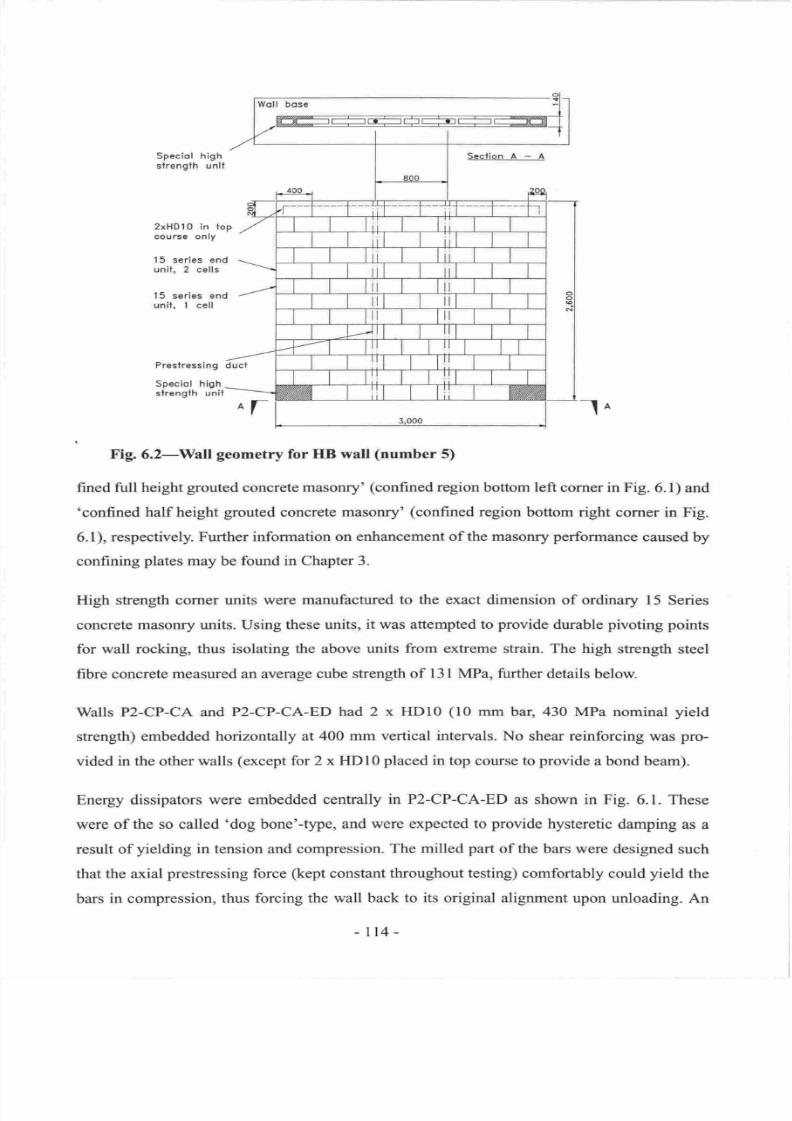
7/21/2019 PHD Laursen-masonry Prestressed Walls
http://slidepdf.com/reader/full/phd-laursen-masonry-prestressed-walls 140/308
Woll
bose
Speclol high
slrength
unll
Seclion A
-
A
2xHDlO in
top
courcc
only
1
5 serles
end
unit,
2
cells
1 5 series end
unit,
I
cell
Prestresslng duct
Speciol
high
strength unil
^r
la
Fig. 6.2-Wall
geometry
for HB wall
(number
5)
fined
full
height
grouted
concrete
masonry
(confined
region
bottom left
corner in Fig.
6.1) and
confined half height
grouted
concrete
masoffy
(confined
region bottom right
corner in Fig.
6.1),
respectively.
Further information on enhancement
of the masonry
performance
caused
by
confining
plates
may be found in Chapter
3.
High stength
comer
units
were
manufactured
to ttre exact
dimension
of
ordinary
15 Series
concrete
masonry units. Using
these units, it was attempted to
provide
durable
pivoting
points
for wall
rocking, thus isolating the above
units from extreme strain.
The high strength
steel
fibre concrete
measured
an
average cube srength
of
131 MPa,
further details below.
Walls P2-CP-CA and
P2-CP-CA-ED
had 2 x HD10
(10
mm bar, 430 MPa
nominal
yield
strength)
embedded
horizontally at
400 mm
vertical
intervals.
No
shear reinforcing
was
pro-
vided
in the other walls
(except
for
2x
HDl0
placed in
top course to
provide
a
bond beam).
Energy
dissipators
were embedded centrally
in P2-CP-CA-ED
as shown in Fig.
6.1.
These
were
of
the
so
called
dog
bone -Upe,
and
were expected
to
provide
hysteretic
damping
as
a
result
of
yielding
in
tension
and compression.
The milled
part
of
the
bars were designed such
that the axial
prestressing
force
(kept
constant
throughout testing) comfortably
could
yield
the
bars
in compression,
thus forcing the
wall back to its original alignment
upon
unloading. An
-114-
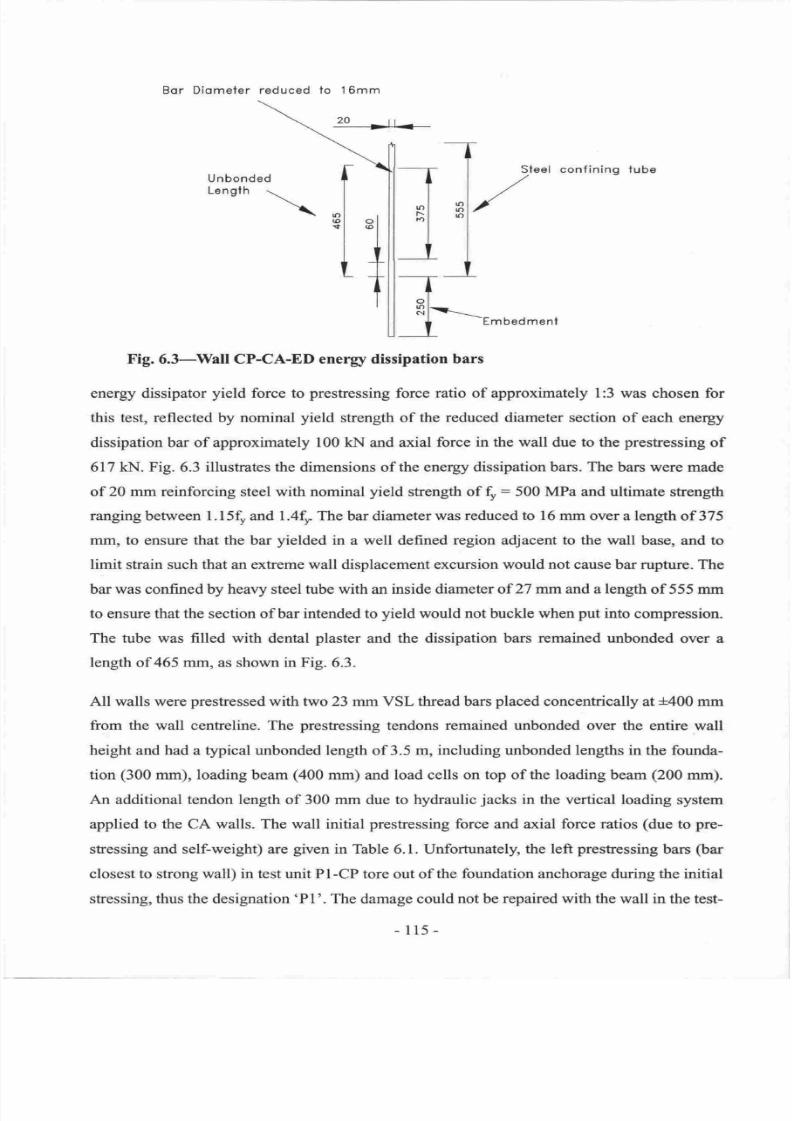
7/21/2019 PHD Laursen-masonry Prestressed Walls
http://slidepdf.com/reader/full/phd-laursen-masonry-prestressed-walls 141/308
reduced to 16mm
or
Diomeler
rl/
-T-
l
Rl-==--
I
-Embedmenf
Fig.
6.3-Wall
CP-CA-ED energSr dissipation
bars
energy dissipator
yield
force to
prestressing
force
ratio
of
approximately l:3
was chosen for
this test, reflected by nominal
yield
strength
of the
reduced diameter
section of each energy
dissipation bar of approximately 100
kN
and axial
force
in
the
wall
due
to
the
prestressing
of
617 kN. Fig.
6.3
illushates the
dimensions of
the energy dissipation bars. The
bars
were
made
of
20 mm reinforcing
steel
with nominal
yield
strength
of
:500
MPa and ultimate
strength
rangingbetween
l.l5 and 1.4t
Thebardiameterwasreducedto
16mmoveralength
of 375
mm, to ensure that the
bar
yielded
in a well defined region adjacent to the wall base,
and to
limit strain such that an extreme wall displacement excursion would not cause bar
rupture.
The
bar was confined
by
heavy
steel
tube
with
an
inside diameter
of
27
mmand
a
length
of
555
mm
to ensure that the section of bar intended to
yield
would
not buckle
when
put
into
compression.
The tube was
filled with
dental
plaster
and
the dissipation bars
remained
unbonded
over a
length of
465
mm,
as
shown
in Fig.
6.3.
All walls were
preshessed
with two 23
mm VSL
thread bars
placed
concentrically
at
+400
mm
from the wall centreline. The
prestressing
tendons
remained unbonded
over the entire wall
height
and
had
a
typical
unbonded length of 3.5 m,
including unbonded lengths
in the founda-
tion
(300
mm),
loading
beam
(400
mm) and load cells
on top
of
the loading
beam
(200
mm).
An
additional
tendon length of 300 mm due to hydraulic
jacks
in
the
vertical
loading system
applied to the CA walls. The wall initial
prestressing
force and axial force ratios
(due
to
pre-
stressing and self-weight) are
given
in
Table
6.1.
Unfortunately,
the
left
prestressing
bars
(bar
closest to
strong
wall)
in test unit Pl-CP
tore out of
the
foundation
anchorage during the
initial
stressing, thus the designation 'Pl'. The damage could
not
be
repaired
with the wall in the test-
Unbonded
Lengfh
\
\
20
--rl
Sfeel
confining
tube
ol
'l
I
+
T
-115-
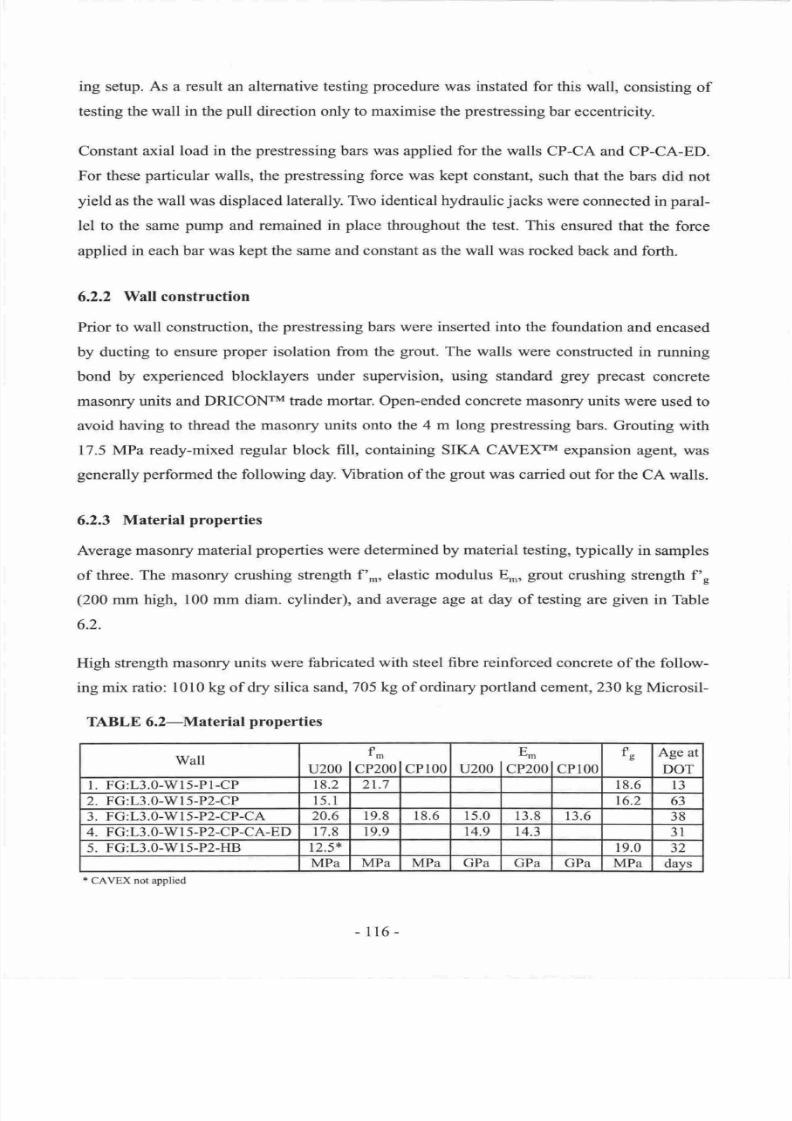
7/21/2019 PHD Laursen-masonry Prestressed Walls
http://slidepdf.com/reader/full/phd-laursen-masonry-prestressed-walls 142/308
ing setup.
As
a
result
an alternative testing
procedure
was
instated
for this
wall,
consisting
of
testing
the
wall in the
pull
direction only
to
maximise
the
prestressing
bar
eccentricity.
Constant axial load in the
prestressing
bars
was applied for the walls
CP-CA and
CP-CA-ED.
For these
particular
walls, the
prestressing
force was kept constant,
such that
the bars
did not
yield
as
the wall was displaced
laterally. Two identical hydraulic
jacks
were
connected
in
paral-
lel to the same
pump
and
remained in
place
throughout the test. This
ensured that
the
force
applied
in each bar was kept the same and
constant
as
the wall was rocked
back and
forth.
6.2.2
Wall construction
Prior to
wall
consffuction,
the prestressing
bars
were inserted
into
the
foundation
and
encased
by ducting
to
ensure
proper
isolation from
the
grout.
The walls were
constructed
in
running
bond by
experienced blocklayers under
supervision, using
standard
grey precast
concrete
masonry
units and DRICONTM
trade mortar. Open-ended concrete masoffy
units were
used to
avoid having
to
thread
the masonry units onto
the
4 m long
prestressing
bars.
Grouting
with
17.5 MPa
ready-mixed regular block
fill, containing SIKA CAVEXTM
expansion
agenf
was
generally
performed
the following day. Vibration of
the
grout
was carried
out
for
the
CA walls.
6.2.3
Material
properties
Average
masonry material
properties
were determined
by material
testing, typically in
samples
of three.
The
masonry
crushing strength
f ., elastic modulus
E.,
grout
crushing
strength
f ,
(200
mm high, 100 mm diam. cylinder),
and average age at day
of
testing
are
given
in Table
6.2.
High
strength masonry
units
were fabricated
with
steel
fibre reinforced
concrete
of
the
follow-
ing
mix ratio:
l0l0 kg of
dry
silica sand,
705 kg
of
ordinary
portland
cement, 230 kg
Microsil-
TABLE
6.2-Material
properties
Wall
f,n
u200
lcP200lcPl00
E,,,
u200
lcP200lcP100
fls
Age
at
DOT
l. FG:L3.0-WI5-Pl-CP
18.2 2r.7
18.6
l3
2.
FG:L3.0-Wl5-P2-CP
t5.l r6.2
63
3. FG:L3.0-W
I 5-P2-CP-CA
20.6
19.8 18.6 t5.0
r
3.8 r3.6
38
4.
FG:L3.0-W
I
5-P2-CP-CA-ED
t
7.8
19.9
t4.9
14.3
3l
5. FG:L3.0-Wl5-P2-HB
12.5*
19.0
32
MPa MPa MPa GPa
GPa GPa MPa
days
I
CAVEX
not applied
-116-
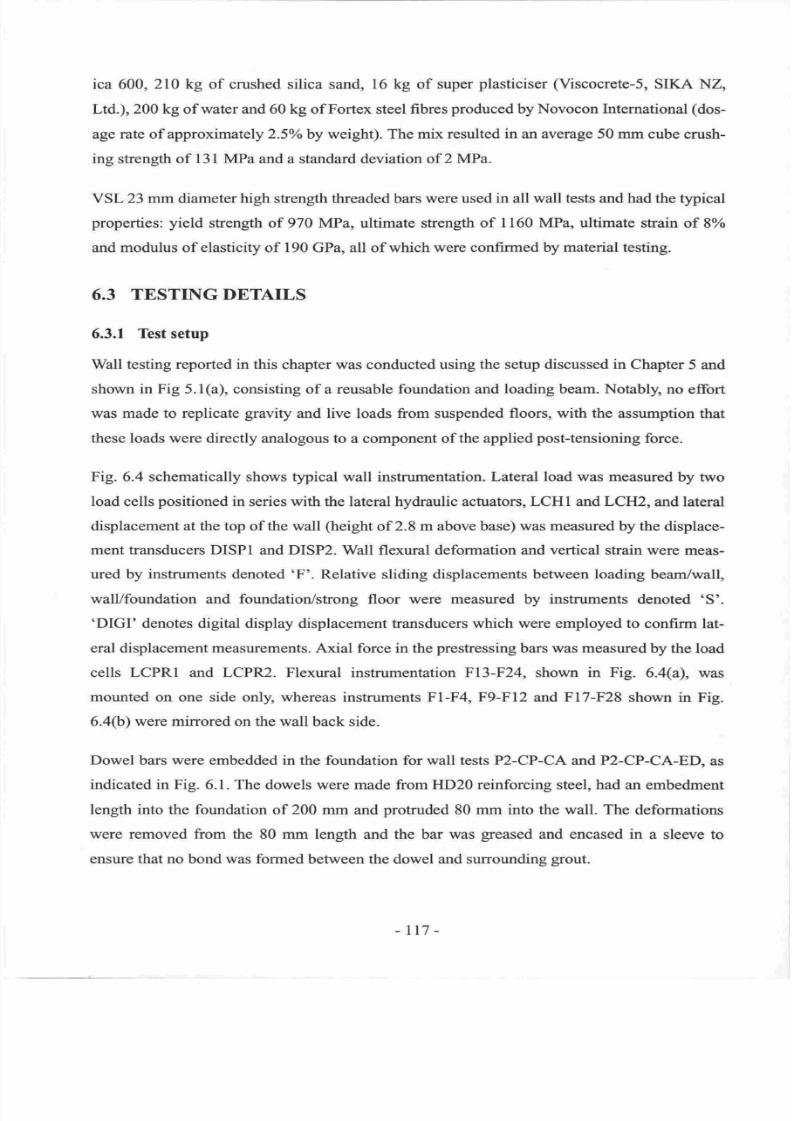
7/21/2019 PHD Laursen-masonry Prestressed Walls
http://slidepdf.com/reader/full/phd-laursen-masonry-prestressed-walls 143/308
ica 600,
210
kg
of
crushed
silica
sand, 16 kg
of
super
plasticiser (Viscocrete-5,
SIKA NZ,
Ltd.),200
kg
of
water
and 60 kg ofFortex steel
fibres
produced
by
Novocon International (dos-
age
rate
of approximately
2.5o/o
by weight). The
mix resulted
in
an average 50 mm cube
crush-
ing
strength
of
131 MPa
and a standard
deviation
of 2 MPa.
VSL 23 mm
diameter
high
stength threaded bars
were used in all wall
tests
and had the
typical
properties: yield
strength of 970 MPa, ultimate strength
of
1160 MPa,
ultimate
strain of
8o/o
and
modulus
of
elasticity of 190
GPa,
all
of
which
were confi.rmed by material testing.
6.3
TESTING DETAILS
6.3.1
Test
setup
Wall testing reported in this
chapter
was
conducted
using the setup discussed in Chapter
5 and
shown
in Fig 5.1(a), consisting
of
a reusable
foundation
and
loading beam. Notably,
no effort
was made to replicate
gravity
and live loads from suspended
floors,
with
the
assumption
that
these loads were directly
analogous to a component of
the applied
post-tensioning
force.
Fig.
6.4
schematically shows typical
wall instrumentation.
Lateral
load was
measured
by two
load cells
positioned in
series
with
the lateral
hydraulic
actuators,
LCHI
and
LCH2,
and
lateral
displacement at
the
top of the
wall
(height
of
2.8 m above base)
was
measured by the
displace-
ment transducers DISP1
and DISP2. Wall flexural deformation and
vertical
strain were
meas-
ured by
instruments
denoted
F .
Relative
sliding
displacements between loading
beam/wall,
walVfoundation
and
foundation/strong
floor were measured by instruments denoted S .
DIGI
denotes
digital
display
displacement tansducers
which
were employed
to confirm
lat-
eral displacement measurements. Axial force
in
the
prestressing
bars was measwed
by the
load
cells
LCPRI
and
LCPR2.
Flexural instrumentation F13-F24, shown
in
Fig.
6.4(a), was
mounted
on one side only, whereas instruments F1-F4, F9-Fl2 and Fl7-F28
shown in
Fig.
6.4(b)
were mirrored
on the wall back side.
Dowel
bars were
embedded in the foundation for
wall
tests P2-CP-CA and P2-CP-CA-ED,
as
indicated in Fig.
6.1.
The
dowels were made from HD20
reinforcing
steel, had an embedment
length into the foundation
of 200 mm and
protruded
80 mm
into
the
wall. The
deformations
were
removed
from
the 80 mm
Iength and
the bar
was
greased
and
encased
in
a
sleeve
to
ensure that no
bond
was formed
between the dowel and surrounding
grout.
rt7
-
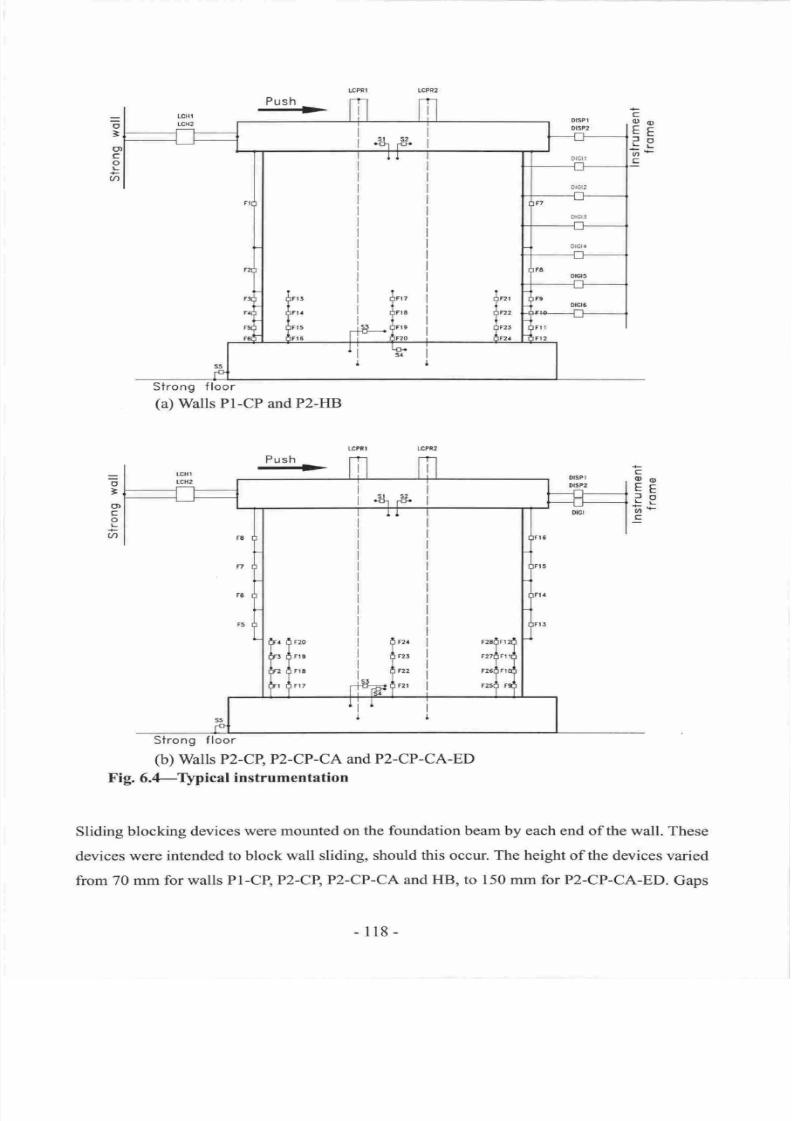
7/21/2019 PHD Laursen-masonry Prestressed Walls
http://slidepdf.com/reader/full/phd-laursen-masonry-prestressed-walls 144/308
E
9o
tsF
FA
f;*
(a)
Walls
PI-CP
andP2=IIB
Push
.d>
ng Troor
(b)
\Valls
m-CP PZ-CF-CA aad
P2-CP-CA-ED
X'ig. 6.#Ilplcal
instrumentation
Sliding
blocking
devices were
m€untcd
on
ths foundation
beam
by
each end
of
the
wall.
These
devices
were intendetl
to blsck
wall
sliding,
should
this
occur. The height
of the deviees
waried
from
7O
mm for walls Pl
-CR P2{B P2-CP-CA
and
HBj
to 150
mm
for P2-CP-CA-ED.
G,aps
o
=
g-}
c
o
rr
a
G
9o
55
fi.:
tr
-
118
-
7/21/2019 PHD Laursen-masonry Prestressed Walls
http://slidepdf.com/reader/full/phd-laursen-masonry-prestressed-walls 145/308
of 3
mm
(nominal)
were
present
between
the wall ends and
the sliding blocking devices in the
unloaded
state.
6.3.2
lbsting
procedure
Cyclic structural
testing
was
conducted according
to the
procedure
outlined
by Park
[6-l],
with
the
ductility one
displacement
here
termed
displacement level one or
Dl.
After
definition
of
Dl, the walls
were cycled
toD2,D4,D6,
etc. until
failure,
with Dn
being
defined as n times
Dl. Prior to executing
this loading
procedure,
serviceability
limit state level force cycles were
applied
to
some
walls in
order
to
investigate the uncracked stiffness,
the lateral
displacement
profile
and the
initial
crack
formation.
6.3.3
Predicted
nominal flexural strength
For
a
symmetric
distribution of
post-tensioning
and
gravity
actions,
the nominal flexural
stength,
Mn,
is
defined
by the New Zealand Masonry code NZS 4230:1990l6-21as
given
in
Eqns.8.17,8.18
and 8.29.
Details
on
these
equations
can be
found
in
Chapter
8. The
base
shear, Vs,
corresponding
to
Mn may be calculated using
Eqn. 8.17, where P represents the ini-
tial
prestress
force
(no
lateral load applied to wall), AP is
the total tendon force increase due to
wall
deformation
at Vs, lu,
is
the wall length, lL the
height of
the
wall
and
N is the
axial
load at
the base of
the wall due to live and dead load. The equivalent
rectangular
compression zone
length, a, is defined by
Eqn.
8.18 as
a
function
of the axial forces on the section, the masonry
compressive
strength, f ., the wall width b* and
cr
:
0.96
(confined
grouted
concrete
masonry). Eqn. 8.29 defines the effective tendon force eccentricity,
e., with respect to the initial
prestressing
force
and the tendon force increase based
on the assumption of uniformly dishib-
uted
prestressing
steel.
tn
the absence of suitable
procedures
for estimating AP at
the
time
of
testing,
the tendon force increase at nominal strength
was
estimated
to be 50 kN
for walls
P2-
CP and
P2-HB and zero for PI-CP.
Walls
P2-CP-CA and
P2-CP-CA-ED had
constant axial
load applied to the
prestressing
bars, i.e. AP:
0.
Flexural
strength
increase of wall P2-CP-CA-ED,
due
to
the
yielding
energy dissipators, was
taken into account
when
estimating Vr by assuming a steel stress
of f,
:
500
MPa.
-
l19-
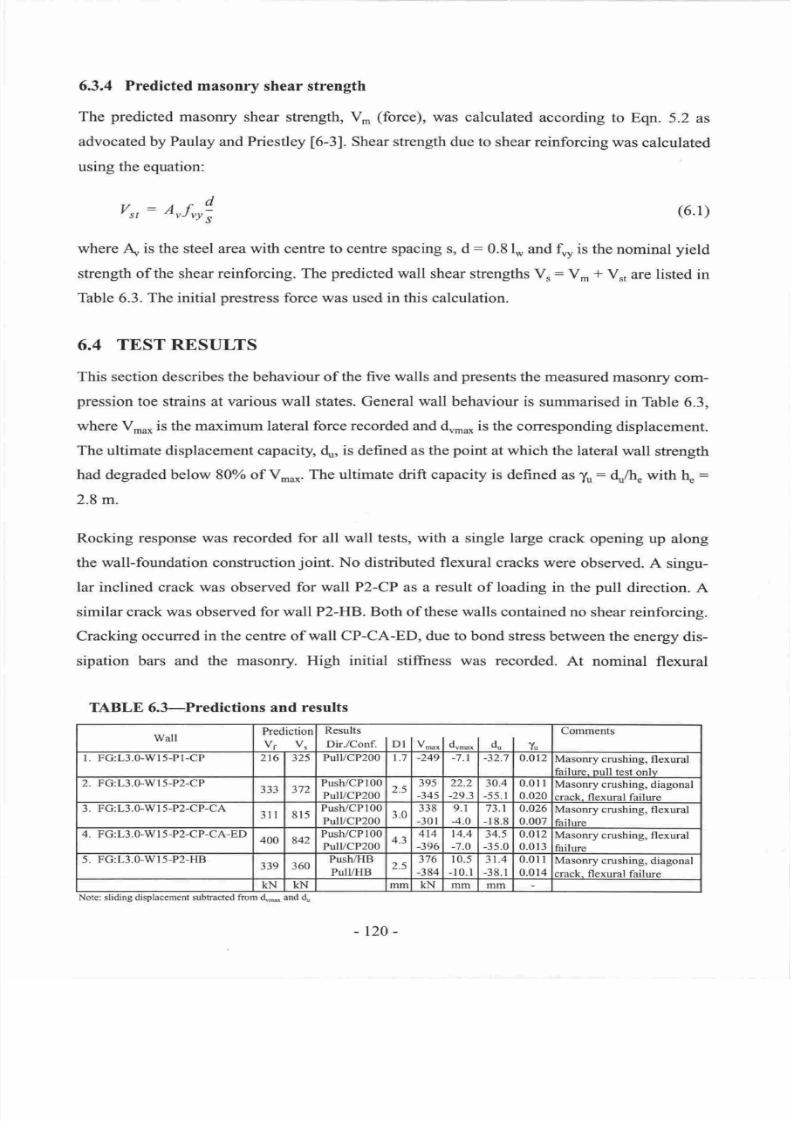
7/21/2019 PHD Laursen-masonry Prestressed Walls
http://slidepdf.com/reader/full/phd-laursen-masonry-prestressed-walls 146/308
6.3.4
Predicted masonry
shear strength
The
predicted
masonry
shear
strength,
V.
(force),
was calculated
according
to
Eqn.
5.2
as
advocated by Paulay
and
Priestley
[6-3].
Shear
strength
due
to
shear
reinforcing
was
calculated
using the equation:
Vrt
:
nrfrr4,
(6.1)
where
,\
is the
steel area
with
centre
to centre
spacing s,
d:
0.81* and fn, is the
nominal
yield
strength of
the
shear
reinforcing.
The
predicted
wall shear strengths V,
=
V.
*
V.,
are
listed
in
Thble
6.3.
The initial
prestress
force was used in this calculation.
6.4
TEST RESULTS
This section describes
the
behaviour of
the five walls and
presents
the measured
masonry
com-
pression
toe strains at various
wall
states. General
wall
behaviour is
summarised in
Table
6.3,
where
Vr ,
is the
maximum
lateral force
recorded
and du*r* is the corresponding
displacement.
The
ultimate
displacement capacity,
du,
is defined
as
the
point
at
which
the lateral
wall
strength
had degraded below 80% of V.u*. The ultimate drift capacity is defined
as
yu:4,/h
with
4:
2.8 m.
Rocking response
was
recorded for all
wall tests, with
a single large
crack opening
up
along
the wall-foundation construction
joint.
No
distributed
flexural
cracks were
observed. A
singu-
lar inclined crack was observed for wall
P2-CP
as a
result
of loading in
the
pull
direction.
A
similar crack
was
observed
for wall P2-HB. Both of these walls
contained no
shear
reinforcing.
Cracking occurred in
the
centre of wall
CP-CA-ED, due to
bond stress between
the
energy
dis-
sipation bars
and
the
masonry.
High initial
stiffiress
was
recorded.
At
nominal
flexural
TABLE
6.3-Predictions
and
results
Wall
Predictior
vf
v3
Results
Dir./conf.
I
ot
lv* 1
a *
|
d
|
y
Comments
l.
FG:L3.0-Wl5-Pl-CP 216 325
PulVCP200 1.7 -249 -7.1 -32.1
0.012
Masonry crushing,
flexural
failure^
null
test
onlv
2. FG:L3.&Wl5-P2-CP
372
Pusb/CPl00
PulVCP200
2.5
J95
-345
22.2
-29.3
30.4
-55. I
0.0r
I
0.020
Masonry
crushing,
diagonal
crack.
flexural failure
3. FG:L3.0-Wl5-P2-CP-CA
3ll 815
Push/CPl00
PulYCP200
3.0
338
-301
9.1
4.0
73.1
-
18.8
0.426
0.007
Masonry crushing,
flexural
flailrrre
4.
FG:L3.0-Wl
5-P2-CP-CA-ED
400
842
Push/CPl00
PulVCP200
4.3
4t4
-396
14.4
-7.0
34.5
-35.0
0.0
0.0
2
J
Masonry crushing,
fl
exural
failure
5. FGrL3.0-Wls-P2-llB
339 360
Push/HlJ
PUIVHB
2.5
5t6
-384
0. 5
-10.1
J 1.4
-38.1
0.0
0.0
I
4
Masonry
crushing,
diagonal
nrecL flevrrml failrrre
KN KN
mr
KN
mm
mm
Note:
sliding
displacement
subtacted
from
d,. ,
and
du
-120-
7/21/2019 PHD Laursen-masonry Prestressed Walls
http://slidepdf.com/reader/full/phd-laursen-masonry-prestressed-walls 147/308
stength,
Vr:
Mnft*
wall softening
occurred due
to the initiation of rocking. Tendon
yielding
was experienced
for walls
PI-CR P}-CP and
P2-HB, which all had tendons
permanently
anchored
in the foundation and loading beam.
The tendons in
walls
P2-CP-CA and
P2-CP-CA-
ED
remained elastic
during
testing.
The failure mode
was characterised by localised
masonry
crushing
in
the compression
toe
regions, resulting in
gradual
strength degradation.
Using CP200
masoffy, inelastic masonry
sffain were
found to be concentrated
in
the
lowest course
(200
mm), whereas when
using
CP100
masonry inelastic vertical strain
penetrated
into
the
second
and third
cotuse
above
the
foundation
(200-300
mm).
Failure
of
the compression
toes for wall
P2-HB
was
initiated by
crushing of the ordinary
masoffy
course
(U200)
just
above
the
high
strength
units.
Considerable sliding displacement between wall
and foundation was recorded
for
PI-CP, P2-
CP and P2-CP-CA.
Hysteretic energy dissipation was
increased
considerably
for P2-CP-CA-ED because of the
embedded dog-bone
energy
dissipation
bars, in comparison
with the
other
walls.
It is
pointed
out
for PI-CP that,
while
results have been included in this chapter, relatively little
attention has been
given
to this wall due
to its unrealistic dimensions and
prestressing
configu-
ration.
6.4.1
Force-displacement
response
Fig. 6.5, depicting the force-displacement response
for
all
fully
grouted
walls, demonstrates
the
nearly non-linear
elastic
behaviour
exhibited
by
the tested unbonded
post-tensioned
walls
prior
to
toe
crushing,
with
the
exception of P2-CP-CA-ED.
It
is
seen
that
all
walls
returned
to
their
original
alignment, even
after
large displacement excursions. This type of response may
be categorised as
origin
oriented . For
all
walls, except
P2-CP-CA-ED,
the individual curves
for each excursion appear
pinched,
implying little
hysteretic energy
dissipation. It is
noted
that
the term
elastic
in a rigorous
sense
indicates
reversibility
and no accumulation of damage.
In
reality the walls did accumulate damage from the
onset
of
tendon
yielding
and
masonry crush-
ing,
causing a
reduction in
wall stiffness. Thus the
behaviour
was
termed
nearly
non-linear
elastic.
-tzr-
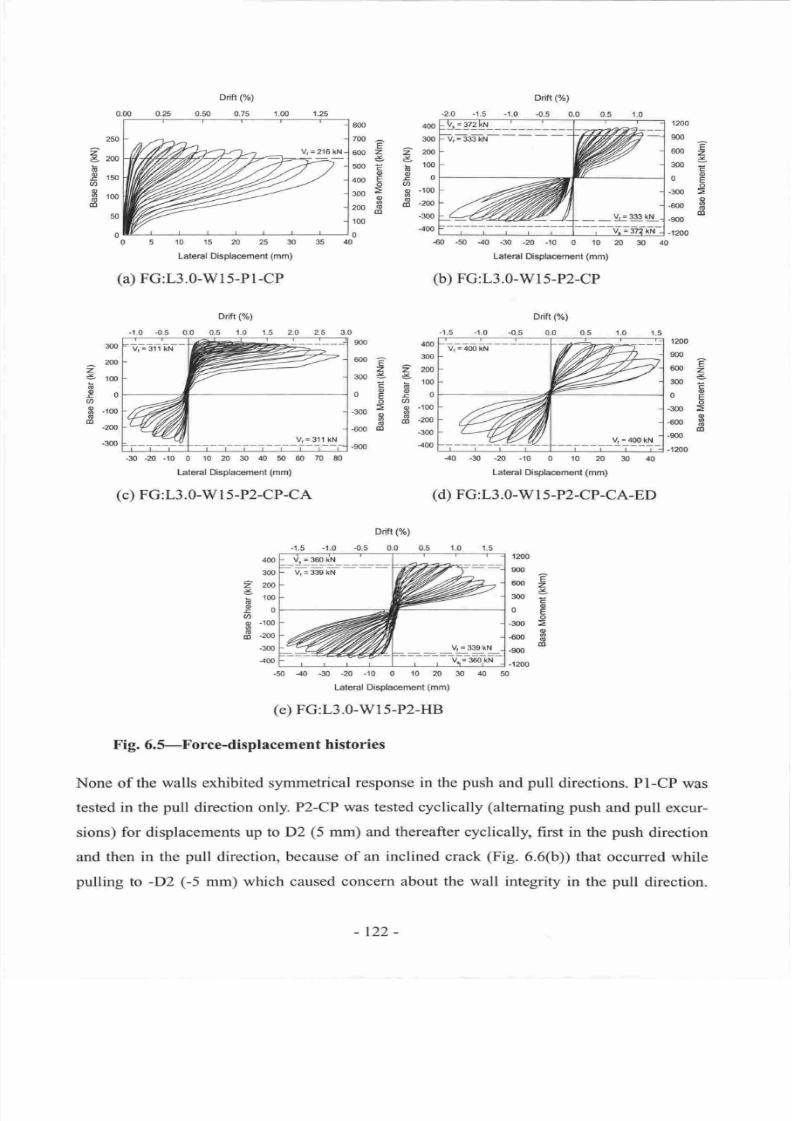
7/21/2019 PHD Laursen-masonry Prestressed Walls
http://slidepdf.com/reader/full/phd-laursen-masonry-prestressed-walls 148/308
'lr*
-lr*
l6m
l*
lo*
l*
l*
-l
t*
r0
05101520253035
Latenal Displacement
(mm)
(a)
FG:L3.0-W1s-Pl-CP
Ddft
e6)
-r.0
-o-5
0.0
0.5
1.0
r.5 L0
2-s
'
V'=311
kN
Vr= 311
kN
-30
-20 -10
0
10
20 30 40 50 60
70
Lateral
Dsphcement
(mm)
(c) FG:L3.0-W
I
5-P2-CP-CA
1.00
r.25
400
300
200
'100
0
-100
-200
-300
-400
Dritt(%)
-1.5
-r.0
{.5 0.0 0.5
1.0
4=s6oku
V'
=
3:19 kN
V=339kN
v"
=
36o.kN
Drift
(06)
-2.0
-1.s
-1.0 -0.5
0.0
clz3
V=333kN
-
-
U'333
l'l-
V.
=
17t
kN
{0
.50
-40
-3{t -20
-r0
0 l0
2t
Latsral
Displacement
(mm)
(b)
FG:L3.0-Wl5-P2-CP
Drift
(%)
-1.5 -'r.0 .0.5 0.0 0.5 1.0
1.5
40
-30
-20
-10
0 10 20
30
4,0
Lateral
Displacsment
(mm)
(d) FG:L3.0-W
I
5-P2-CP-CA-ED
Drift
(7o)
0.50
0.75
e
z2
5g
Eb
EE
60
-.q
HE
@
z
J
o
-g
a
o
6
o
dl
1mo
900
c
600
2
J
3oo
=
of
-300
=
600$
dt
-gfi)
-1200
E
z
J
c
o
E
o
$
co
9m
,$O
6me
^*
2200
3oo--
y,*
o
Fg
o
6a
-soo
?
E
'1oo
H
s'*
-600
d
-300
-900
400
$o
200
z
5
roo
(
C{r
at,
E
-roo
o
d)
-20iJ
-300
250
200
150
100
50
0
1200
900
600
300
0
-300
-600
-90o
-1200
1.5
z
s
()
v,
o
dl
400
300
200
100
0
-100
-mo
-100
1200
900
€o02
:
3m;
-o
U€
o
-300
o
-6{F
ft
c0
-900
.1200
-50
-40
-30
-20
-r0
0
r0
m 30 40
50
Laleral
Displacement
(mm)
(e)
FG:L3.0-Wl5-P2-HB
Fig. 6.S-Forcedisplacement
histories
None of
the
walls exhibited symmetrical
response
in
the
push
and
pull
directions.
PI-CP
was
tested
in
the
pull
direction only.
PZ-CP was
tested
cyclically
(alternating
push
and
pull
excur-
sions)
for
displacements
up
to D2 (5
mm)
and thereafter
cyclically, first in
the push
direction
and
then in the
pull
direction,
because of
an
inclined crack
(Fig.
6.6(b)) that occurred
while
pulling
to
-D2 (-5
mm) which
caused
concern about
the
wall integrity
in the
pull
direction.
-t22-
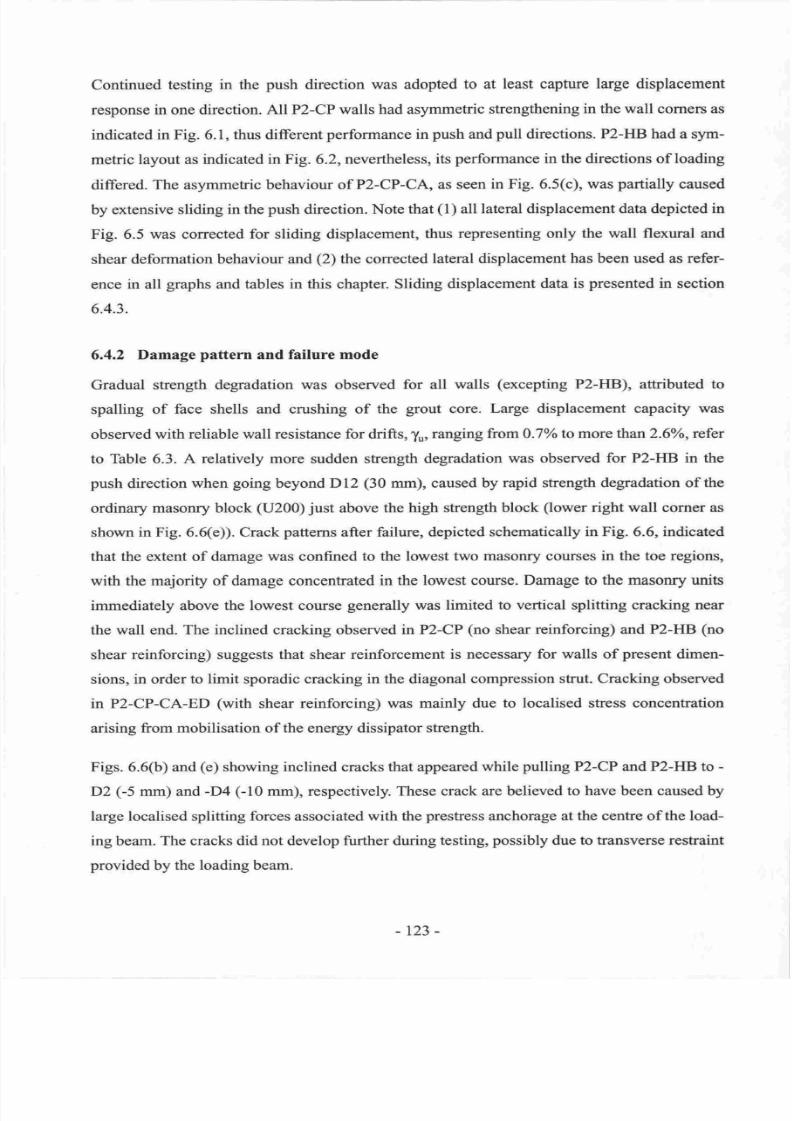
7/21/2019 PHD Laursen-masonry Prestressed Walls
http://slidepdf.com/reader/full/phd-laursen-masonry-prestressed-walls 149/308
Continued testing
in
the
push
direction
was adopted
to at
least
capture
large displacement
response
in
one direction.
All
P2-CP
walls had asymmetric
strengthening
in
the
wall corners as
indicated in Fig. 6.1, thus different
performance in
push
and
pull
directions.
P2-HB had
a sym-
metric layout
as
indicated
in Fig.
6.2, nevertheless,
its
performance
in
the
directions
of
loading
differed. The asymmetric behaviour
of P2-CP-CA,
as seen
in Fig. 6.5 c),
was
partially
caused
by extensive
sliding in
the
push
direction.
Note that
l)
all
lateral displacement
data depicted in
Fig.
6.5
was corrected
for
sliding
displacement, thus
representing
only the wall flexural and
shear deformation behaviour and
2)
the corrected
lateral
displacement has been used as refer-
ence in all
graphs
and
tables in this chapter. Sliding
displacement
data is
presented
in section
6.4.3.
6.4.2
Damage
pattern
and
failure mode
Gradual
strength degradation was observed
for
all
walls
excepting
P2-HB),
attributed
to
spalling
of
face shells
and crushing
of
the
grout
core.
Large displacement capacity
was
observed with reliable wall
resistance for drifts,1u,
ranging
from0.1o/o
to more than2.6o/o,refer
to Thble 6.3.
A
relatively more
sudden
sfength degradation
was
observed for P2-HB in the
push
direction
when
going
beyond D12
30
mm), caused
by rapid strength degradation of the
ordinary
masonry block
U200)
just
above the
high strength
block
lower
right
wall
corner as
shown
in Fig.
6.6 e)). Crack
pattems
after failure,
depicted schematically
in Fig.
6.6,
indicated
that the extent of damage
was
confined
to the lowest
two masonry courses
in the toe regions,
with
the
majority of damage concentrated
in the lowest courso.
Damage to
the masonry units
immediately above the lowest course
generally
was
limited
to vertical
splitting
cracking
near
the wall end. The
inclined
cracking observed
in P2-CP
no
shear reinforcing) and P2-HB
no
shear
reinforcing) suggests that shear reinforcement
is necessary
for walls of
present
dimen-
sions, in order
to limit sporadic cracking in the diagonal
compression strut.
Cracking
observed
in
P2-CP-CA-ED
with
shear
reinforcing)
was
mainly due
to localised shess concentration
arising
from mobilisation of the energy dissipator strength.
Figs.
6.6 b) and
e)
showing inclined cracks that appeared
while
pulling
P2-CP and P2-HB to
-
D2
-5
mm) and
-D4 -10
mm), respectively.
These crack are believed
to have been caused by
large localised splitting forces associated with the
prestress
anchorage at the
centre
of the load-
ing beam. The cracks did
not
develop
further
during
testing,
possibly
due to
transverse
restraint
provided
by the
loading
beam.
-t23-
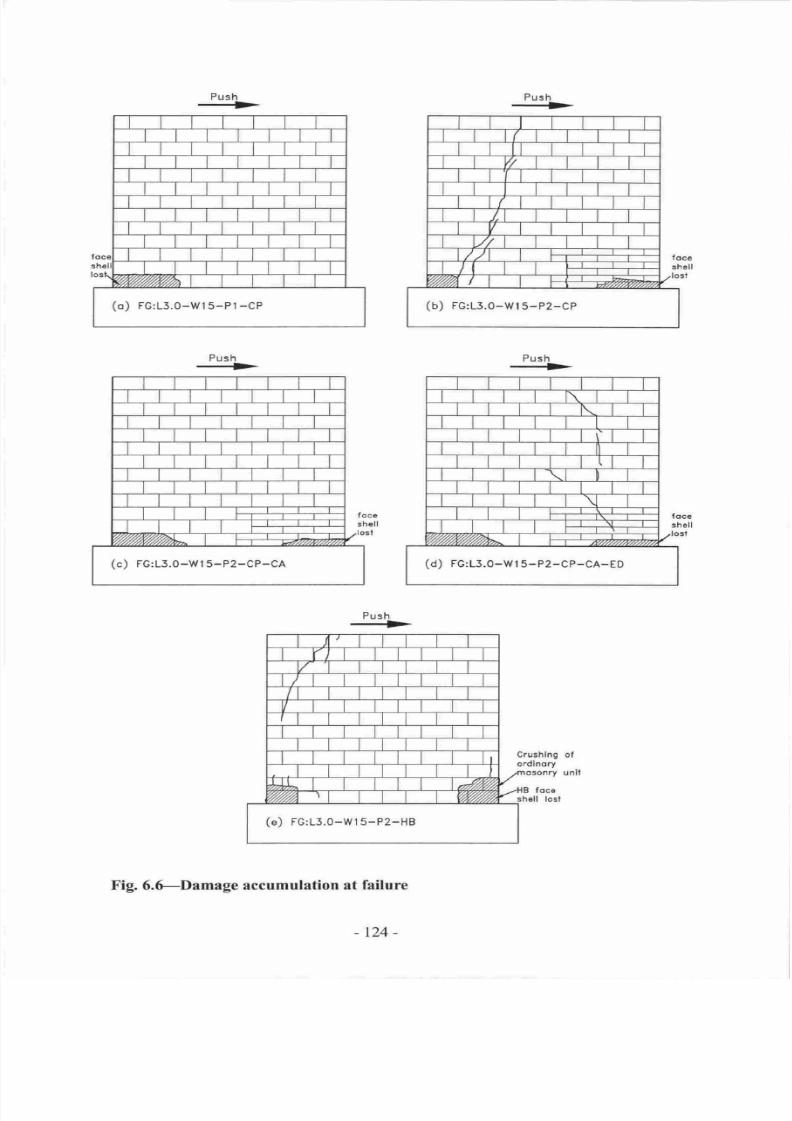
7/21/2019 PHD Laursen-masonry Prestressed Walls
http://slidepdf.com/reader/full/phd-laursen-masonry-prestressed-walls 150/308
Push
__>
Push
+
Push
->
Fig.
6.fDamage
accumulation at
failure
Push
+
Crushlng
of
ordlnory
foce
o)
Fc:13.0-w15-P1-CP
b)
FG:13.0-wt
5-P2-cP
Push
+
d)
FG:13.0-Wl
5-P2-cP-CA-ED
c)
FG:13.0-Wt 5-P2-CP-CA
e)
FG:15.0-W15-P2-HB
-r24-
lost
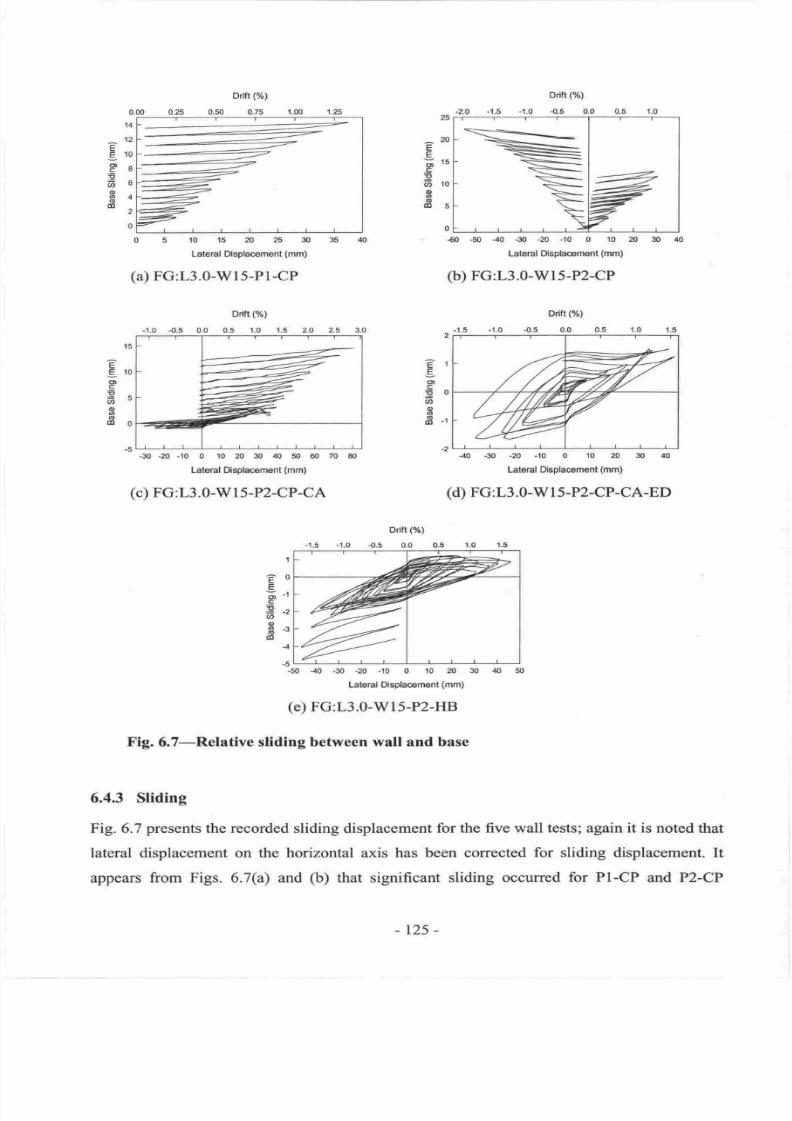
7/21/2019 PHD Laursen-masonry Prestressed Walls
http://slidepdf.com/reader/full/phd-laursen-masonry-prestressed-walls 151/308
uF
I
r
'o
l-
8l-
. l-l
t:
4r-
,l;
oF
4.0
.1.5
Drift(%)
-r.0
{r.5 0.0 0.5
E
E
oc
E
o
o
o
s
ao
051015?s253035
Lateral
Displaoement
(mm)
(a)
FG:L3.0-Wl5-Pl-CP
.30 .20
-t0
0
10 20 30 40
50
60 70
Lateral
Dsplacement
(mm)
(c)
FG:L3.0-W
I
5-P2-CP-CA
-60
-50
-ro
-$
-20
.10
0
l0
20
Lateral Displacement
(mm)
(b)
FG:L3.0-wl5-P2-CP
Orift(%)
-0.5
0.0
-10
-30 -20
-10
0
't0
8 3[,
&
Leteral Displacem€nt
(mm)
(d)
FG:L3.0-W
I
5-P2-CP-CA-ED
-'t.0
Drift(%)
.0.5
0.0
-rz
ffiP
.{0
-30
.20
-10 0 10 m
30
Lateral Dsplaoement
(mm)
(e)
FG:L3.0-W15-P2-HB
Fig.6.7-Relative
sliding
between
wall
and
base
6.4.3
Sliding
Fig.6.7
presents
the recorded
sliding
displacement
for
the
five
wall
tests;
again
it
is
noted that
lateral
displacement
on the horizontal axis
has been
corrected
for sliding
displacement.
It
appears
from Figs. 6.7(a)
and
(b)
that significant sliding
occurred
for PI-CP and
P2-CP
.'t.5
-1.0 t.5.0
:F
'f
f
I
4l-
.,L
€0
E
E
o
s
B
o
o
6
o
dt
-r25-
7/21/2019 PHD Laursen-masonry Prestressed Walls
http://slidepdf.com/reader/full/phd-laursen-masonry-prestressed-walls 152/308
throughout the tests,
and
that
sliding
increased
gradually
with lateral
displacement.
Both
tests
were conducted
in
one
direction only at
large
displacement levels
which
naturally
did tend
to
increase the
total
sliding displacement due
to the
absence of excursions
in the
opposite
loading
direction
that
could
reverse
the
sliding
that occurred.
Sliding
displacements were
negligible
for
P2-CP-CA for
all cyclic excursions,
see Fig.
6.7(c).
Once the wall had
failed in the
pull
direc-
tion
(CP200)
and the testing
in
the
pull
direction was terminated
at
-Dl0 (-30
mm),
the
wall
slid
further and further in the
push
direction. This
was
partially
due to
reduced
efficiency
of
the
dowel bars as the compression zone integrity deteriorated. There was
no
indication
of
signifi-
cant
wall sliding relative to the foundation
for P2-CP-CA-ED
as indicated
in Fig.
6.7(d),
attest-
ing to the
efficiency of
the
dowel
and energy dissipator bars to
block sliding.
Fig. 6.7(e)
shows
that
negligible sliding
occurred
for P2-HB
until
after
Dl6
(40
mm),
where
push
testing
was
ter-
minated.
Still
sliding displacement
was
relatively small.
Gradual
deterioration of
the
foundation
beam roughness had occurred
as the
testing
series
pro-
gressed
(foundation
beam also
used for Series I
testing), thus
reducing
the shear friction
along
the wall/base construction
joint.
6.4.4
Prestressing force
The
prestressing
tendon force histories
(sum
of
force of
all
tendons)
for
all walls
are
plotted
against
the lateral displacement in Fig. 6.8.
For reference,
it is noted that the nominal yield
strength
for
one
23 mm VSL
CT
stress bar
is
approximately 385 kN.
Walls
PI-CP,
P}-CP
and
P2-HB
had the tendons rigidly anchored in
the foundation
and
on top
of the
loading beam, and did exhibit
tendon
yielding
during testing, as indicated
in Figs.
6.8(a),
(b)
and
(e).
It
is
seen
that
the
first
significant total
tendon force
loss
(more than 5
of
the
initial
force)
for
these
walls occurred after
lateral
wall
displacements
to
about
*10
mm, in
all cases
roughly
corresponding to
first
yield
of the exheme
tendons
when considering
the
wall as
a
rigid body
rocking about the wall corners.
At the conclusion
of testing of walls PI-CR
P2-CP
and
P2-HB, between 20 o and 50 of
the
initial
total
prestressing
force remained.
It
is
noted
in
Fig. 6.8(e) that
the total
preshess
loss never
approached the nominal
yield
strength
of the two tendons of
approximately 770 kN
despite
recording
prestress
loss. This
was
due
to
uneven force
in
the tendons
due
to
flexural action
and
inaccuracy
in
the tendon
force
measurement.
-126-
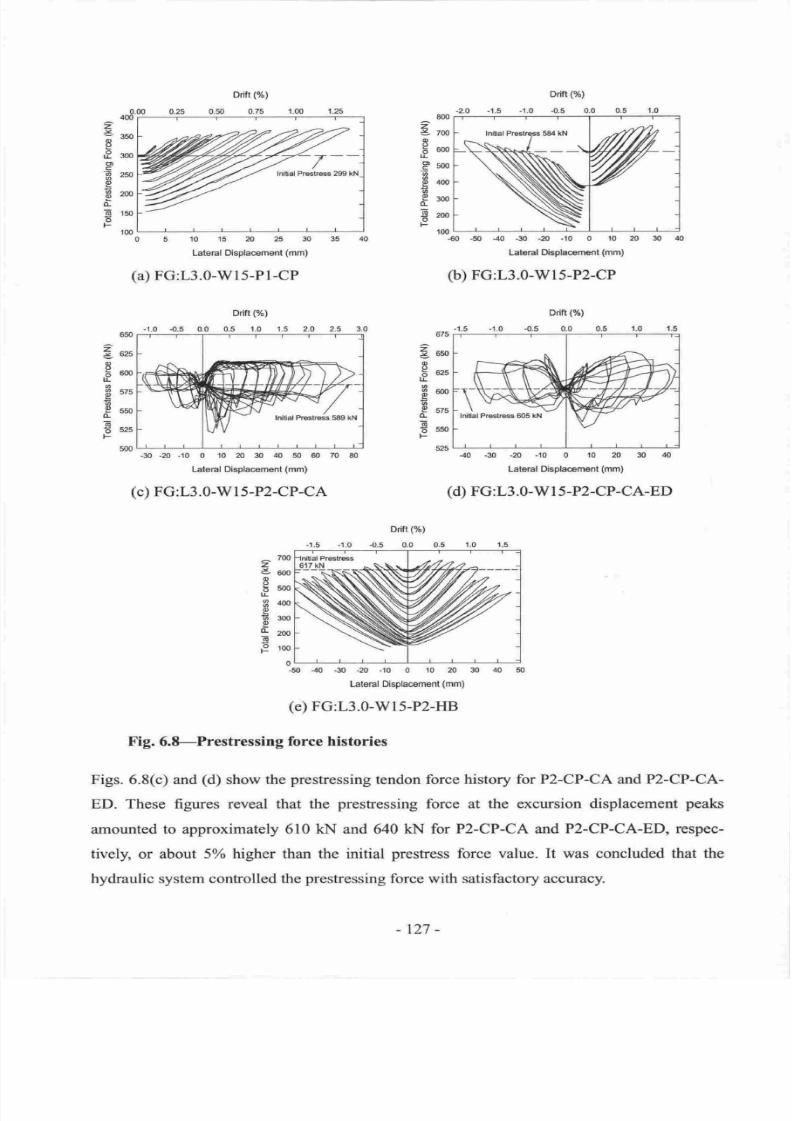
7/21/2019 PHD Laursen-masonry Prestressed Walls
http://slidepdf.com/reader/full/phd-laursen-masonry-prestressed-walls 153/308
.'8r
35o
i.
;F
-l-
150
l-
tmL
z
J
0,
o
o
lt
o
'6
o
o
E
4
([
o
F
05101520253035
Lateral Osplscement
(mm)
(a)
FG:L3.0-W15-P1-CP
Drift
(oi)
-1-0
4.5 0.0 0.5 1.0
1.s
-30
-20
-10
0 10 20 30
40
50 60
70
Lateral Displacement
(mm)
(c)
FG:L3.0-W
1
5-P2-CP-CA
Drift
( )
.1.0
-0.5
0.0 0.5
€0
-50
40
-30 -20
-10
0
l0
N
Lat€ral Disphc€ment
(mm)
(b)
FG:L3.0-w15-P2-CP
Drift
( )
-0.5
0.0
40
-30 -20
.10
0
10
20
30 &
Lateral Displacernent
(mm)
(d)
FG:L3.0-w
I
5-P2-CP-CA-ED
1.0
1.5
.1.0
675
3ut
o
,Ee.u
E
600
o
Iru
Eo*
F
525
650
3*u
8
b8(n
L
o
g
s75
q
f;
oso
E
6
s25
F
500
Drift( )
{.5 0.0
-50
40
-30 -20
-10
0
10
m
30
Lateral Displacement
(mm)
(e)
FG:L3.0-Wl5-P2-HB
Fig. 6.8-Prestressing force
histories
Figs.
6.8(c) and
(d)
show
the
prestressing
tendon
force history
for
P2-CP-CA and
P2-CP-CA-
ED. These figures
reveal that the
prestressing
force at the excursion displacement
peaks
amounted
to
approximately 610
kN
and 640
kN
for
P2-CP-CA
and
P2-CP-CA-ED,
respec-
tively,
or about
5 higher than the initial
prestress
force value.
It
was concluded
that the
hydraulic system controlled the
prestressing
force with satisfactory accuracy.
-1.0
*[
'*f
*F
500
r-
*f
*f
,*f
100
L
€0
ldialPBlrs
589
kN
'*|1
k
5o0
R
'*F
*[
*f
'*r
0L
-50
z
J
g
o
L
o
q
o
a
E
o-
o
o
F
-127
-
7/21/2019 PHD Laursen-masonry Prestressed Walls
http://slidepdf.com/reader/full/phd-laursen-masonry-prestressed-walls 154/308
6.4.5
Vertical
masonry
strain
Vertical
strain recorded along the
bottom
of
the walls
during testing is
shown in
Figs.
6.9
through 6.13.
Each figure
shows strain
plots
for instrument levels I
and 2
above the
base,
i.e.
average
strain
for
0-100 mm and
100-300
mm
above
the
foundation for
Pl-CP
and
P2-HB,
and
average
strain for 0-200 mm and 200-400 mm above the foundation
for
the other
walls.
For
walls
with flexural instrumentation on both sides, the
average
strain of both
sides
was
used.
The sign convention
in these figures defines compression
strain as negative. The
vertical
dashed
lines in the figures indicate the extremities of walls,
i.e. the extreme masonry
fibres
at
*1.5
m from the wall centre line. Figures
a)
and
c)
relate
to low displacement
response,
all
excursions up
to
and
including displacement level
D2,
and
b)
and
d)
relate to
response
beyond D2.
Regarding vertical strain measurements
for PI-CP and P2-HB,
it is suggested
in Fig.
6A@)
that the
instruments F6, F16, F20,F24 and
Fl2
were spanning
between the foundation
beam
and
the middle of
the
first
masonry course. Likewise, instruments F5,
Fl5,
Fl9, F23
and
Fll
spanned between
the
middle
of
first and second courses. This implies
that both level
I
and
level2
vertical strain measurements
for these walls included
a component of
vertical
deforma-
tion of
the
first
course, the course where
most inelastic
action
occurred.
Strain
measurements
for all other
walls
were recorded between bed
joints
of
one course
for HB
and CP200 configu-
rations and between bed
joints
of two courses
for
CP100.
No
plots
of
vertical stain above
level 2 have been included in this report
because the recorded
vertical strain
indicated elastic masoffy
response
at
these locations
vertical
strain
significantly
lower
than
0.001).
This
attests
that the vertical extent
of the
compression
zone
undergoing
plastic
deformation
remained rather short,
of
the order
of
200
mm to 400 mm. Furthermore, the
resolution
of
the
utilised
instruments of
perhaps
0.0005 strain excluded meaningful
interpreta-
tion of
data recorded
above level 3.
It
is acknowledged that vertical strain readings
at level
I
were
influenced
by
base sliding
to
some
degree. It is
remarked
that the data
plotted
in Figs-
6.9
through 6.13 are associated
with some
degree of
uncertainty,
especially
for displacement
levels
above
D2 where significant deterioration
of
the
masoffy units may have
affected instrument
reading.
r28 -
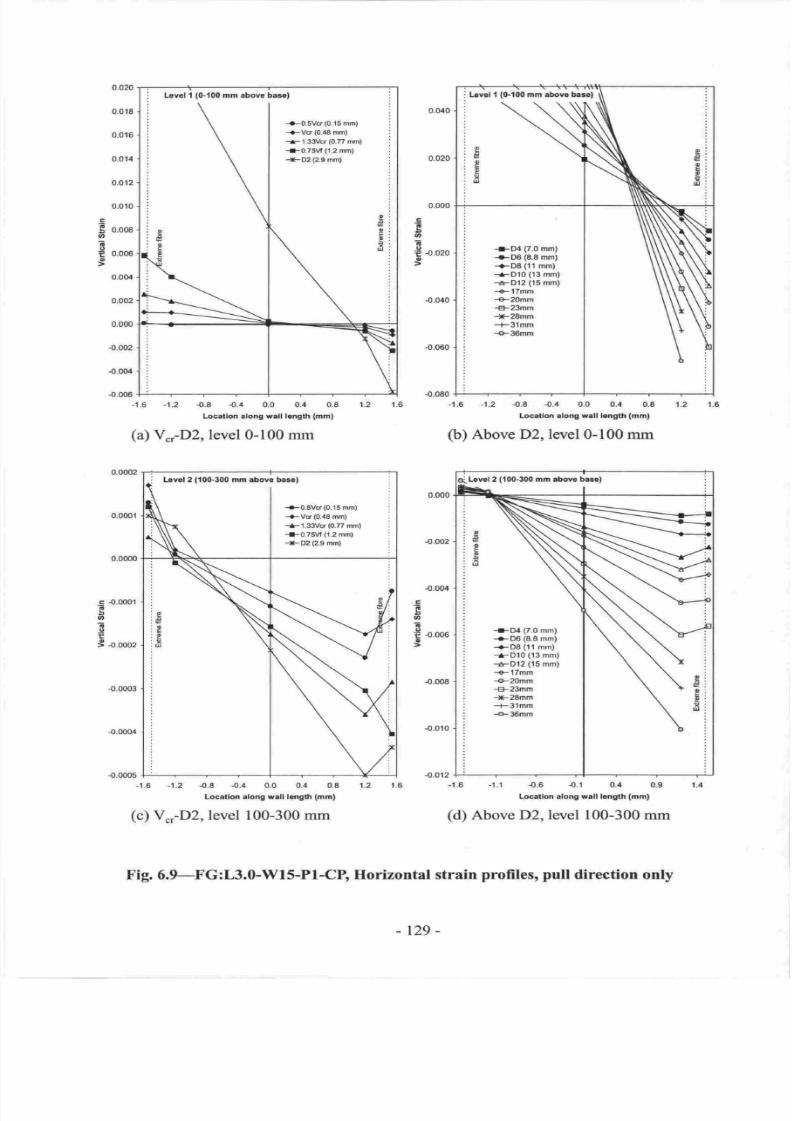
7/21/2019 PHD Laursen-masonry Prestressed Walls
http://slidepdf.com/reader/full/phd-laursen-masonry-prestressed-walls 155/308
Lovel I
(0.100
mm
abo{t
------------]
barl
|
+-0.5v6
(0.15
mm)
|
+vc(0.ram)
|
-r-
1,33/6
{0.77
mm)
|
-r-0.75\/|(1.2
m)
|
+O2
(2.9
mm)
p
E
I
F
'I
0.020
0.018
0.0
16
0.0r4
0.012
0.0r0
€
t
o.ooo
o
E
t
0.006
o
o.004
0.002
0.000
-0.002
{.001
.0.00€
-1.6 -1.2 4.8
-0.4
0.0
0.4
0.8
1.2
Lodtld along ull length
(mmt
(a)
V ,-D2,level
0-100 mm
-1.6
-1.2
{.0 4.4 0.0 0.4 0.8 1.2
Lootldr
elong wrll l.ngth
(mm)
(c)
Vo-D2,level
100-300 mm
-1.0
-1.2
{.8 {.4 0.0 0..1
0.8
Locrtlon dong
rlll
l.ogtn
(mm)
(b)
Above D2,lettel0-100 mm
-1.8
-1.r
{.6 {.1 0.4
0.9
Loc.tlon elone
wrll l.nglh
(mm)
(d)
Above
D2, level 100-300 mm
t.6
Fig.
6.9-FG:L3.0-WI
S-PI-CB
Ilorizontal strain
profiles,
pull
direction only
-r29-
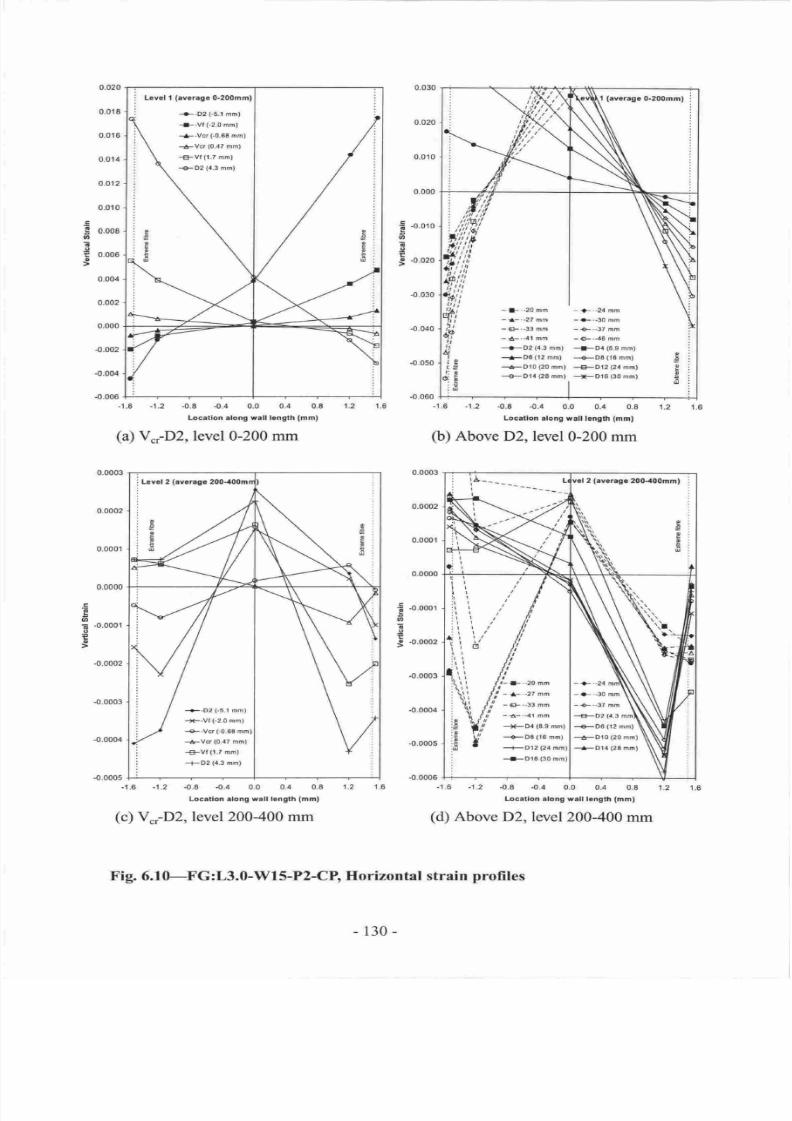
7/21/2019 PHD Laursen-masonry Prestressed Walls
http://slidepdf.com/reader/full/phd-laursen-masonry-prestressed-walls 156/308
0.020
0.018
0.016
0,ot4
o.o12
0.010
0.008
0.006
0.004
0.002
0.000
-0.002
.0.004
-0.006
0.000
€ o.oro
6
E
t
g
.0.020
-0.030
{.040
-o.050
.0.060
E
6
d
o
E
o
-t
.6
-1.2 -0.8 -0.4
0.0 0.4
0.8
Locatlon alon9 wall
llngth
(mm)
(a)
V ;D2,
level 0-200 mm
-1.6
-1.2
{.8
-0.4
0.0 0.4
0.8
Locltlor
rlong wall
lcngth
(mml
(b)
Above
D2, level0-200
mm
-1
.6 -1.2
.0.8
{.4
0.0
0.4
0.E 1.2
Locallon along
wall l.ngth
(mml
(d)
Above
D2, level
200-400
mm
1.2
,6,2
0.0003
0.0002
0.0001
0.0000
€
6
o
5
-0.0001
o
-0.0002
-1.6
-1.2 -0-8
-0.4
0.0 0.4 0.8
Locetlon .long
wllt
langlh
(mml
(c)
V ,-D2,level 200400 mm
Fig.
6.10-FG:L3.0-Wf
5-P2-CB
Horizontal strain
profiles
-130-
1.6
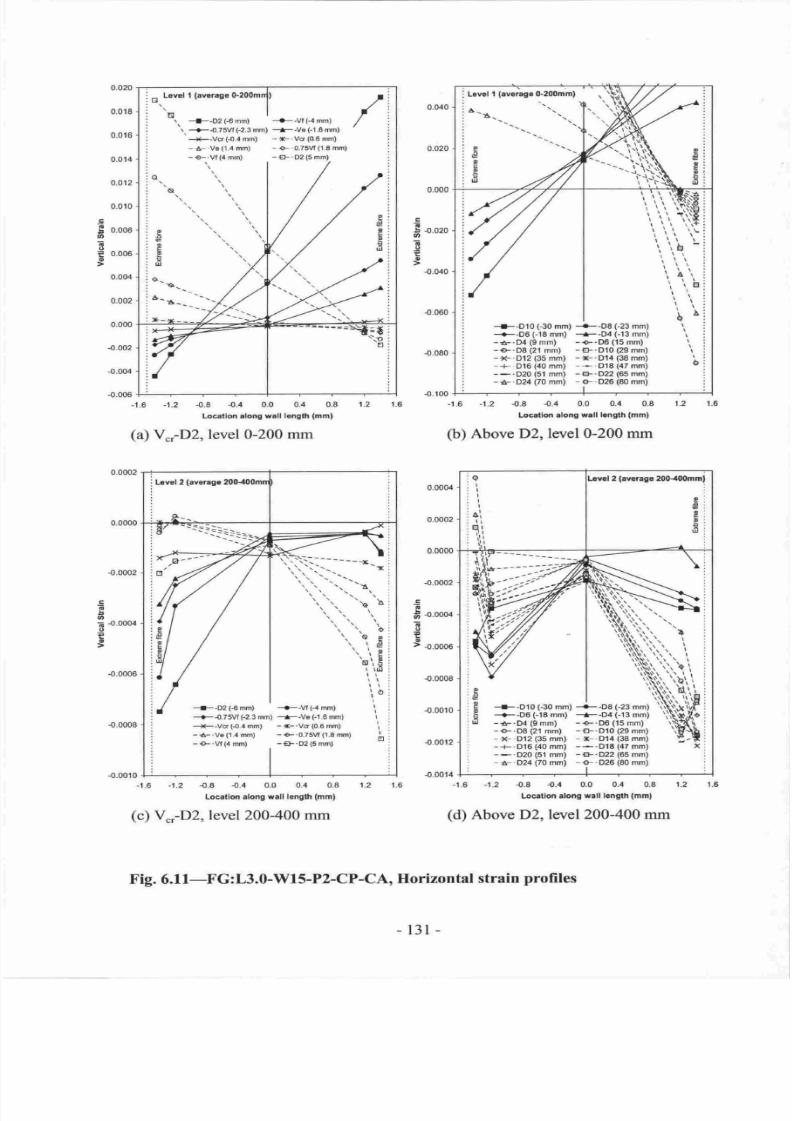
7/21/2019 PHD Laursen-masonry Prestressed Walls
http://slidepdf.com/reader/full/phd-laursen-masonry-prestressed-walls 157/308
0.020
0.016
0.016
0.014
0.012
0.010
E
I
o.ooa
TA
?
o
E
0.006
o
0.004
0.002
0.0@
-0.002
-0.@4
-0.006
-1.6 -1-2
-0.8
{.4 0.0 0.4 0,8
Lodllm
along vrall l.nglh
(mml
(a)
V ,-D2,
level 0-200
mm
-t.6
-1.2 -0.8
{.4 0.0 0.4
0.8
1.2
Locallon
elong
w.ll
length
(mml
(c)
V ,-D2, level 200400
mm
-r.6 -r.2
-0.8
.o.4
0.0
0.4 0.8 1.2 1.6
Locllon.lone
w.ll
l.ngilh
(mm)
(b)
Above
D2, lwel0-200
mm
-1.6
-1.2 {.8
4.4
0.0
0.4 0.8 1.2
Loc.tlon
alofiO
wlll
lcnglh
(mml
(d)
Above D2, level200-400 mm
0.0004
0.0002
0.0000
4.0002
s
#..*
o
o
E
o
>
{.0006
{.0008
{.0010
-0.0012
.0.0014
1.6
Fig.
6.1
1-FG:L3.0-W15-P2-CP-CA,
Horizontal
strain
profiles
-131-
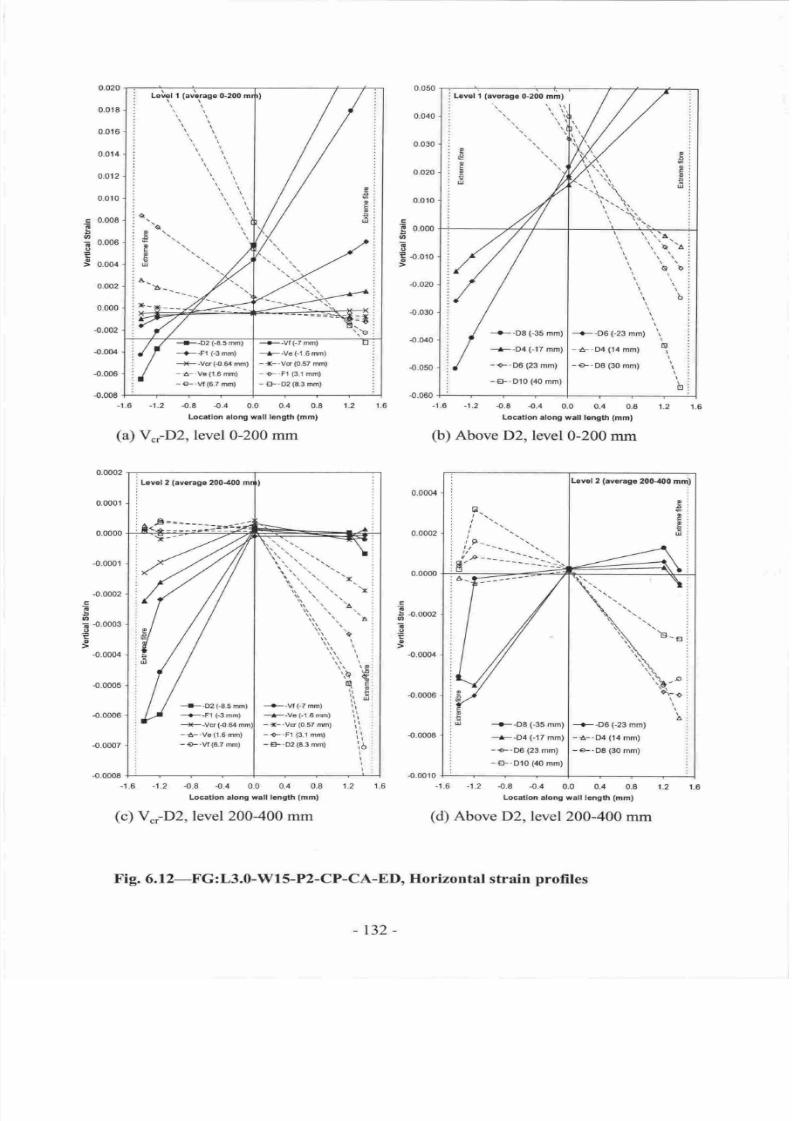
7/21/2019 PHD Laursen-masonry Prestressed Walls
http://slidepdf.com/reader/full/phd-laursen-masonry-prestressed-walls 158/308
0.020
0.018
0.0r6
0.014
0.012
0.010
c 0.008
G
o
i
0.006
e
i
I o.ool
0.002
0.000
'0.002
{.tx}4
{.006
-0.008
0.050
0.040
0.030
0.020
0.010
.E
t
0.000
o
t
o
E
o.oro
{.020
4.030
{.0,10
{.050
4-0€0
-1,6
-1.2
4.8
-0.,0
0.0 0.4 0.8
Locrtlon along wrll longth
(mm)
(a)
V..-D2, level0-200 mm
-1.6
-1.2
{.8 4.4
0.0
0.4
0.8
Locatlon
along
wall longth
(mml
(b)
Above
D2, level0-200
mm
0.0002
0.0001
0.0000
4.0001
4.0002
L.vel 2
(awrage200{10
ml
r"€ll:::;:==='-E
---
--.r--O2(-8.5m)
---il--F
G3
mm)
\s
\
'i.
-*r
\
':.
't
'a
\ \p
''b€
dE
rlI
il
l.l
ll
l
i\
rO
i
--a--\4(-7
m)
--{--Vo(-1.8m)
-*-.Vq
(0,57
m)
-+-.Fl
(3.1
mm)
-€F.O2(8.3
m)
---r(--Vq
(4.84
mm
-
{-.Vs
(1,6
mm)
-
€-.Vf
(6-7
mhl
-1.6
-1.2
-0.8 -0.4
0.0
0.4
0.8
1.2
1.6
L'o€atlqr
slong wrll lcngth
(mm)
(c)
V",-D2,
level 200400 mm
-r.6
-1.2
{.8
-0.4
0.0 0.4
0.8 1.2
Locatlm
along wsll lcngth
(mm)
(d)
Above
D2, level200-400
mm
$
".*0,
o
t
o
{.000,1
E
0
;
4.0O03
o
o
-0.0004
.0.0006
{.0008
-0.m10
Fig. 6.
l2-FG:L3.0-Wl
5-P2-CP-CA-ED' Ilorizontal
strain
profiles
F.
ie-
tr/
-'r'--------'--:'.
F
----
---r
LoYel2 (we.rg€
200.|| 0
m]|t)
:
D
5i
tr:
Fi
u
:
-..\
;
,--\:
A-
--.--O8
t35
mm)
-a--D4
(-17
mm)
-{-.D6
(23
mm)
-€F.Dlo
(40
mm)
\
'B-E
\-o
t
--.--DO
C23
mm)
-{--D4
(14
nm)
-e-.DO
(30
mm)
-r32-
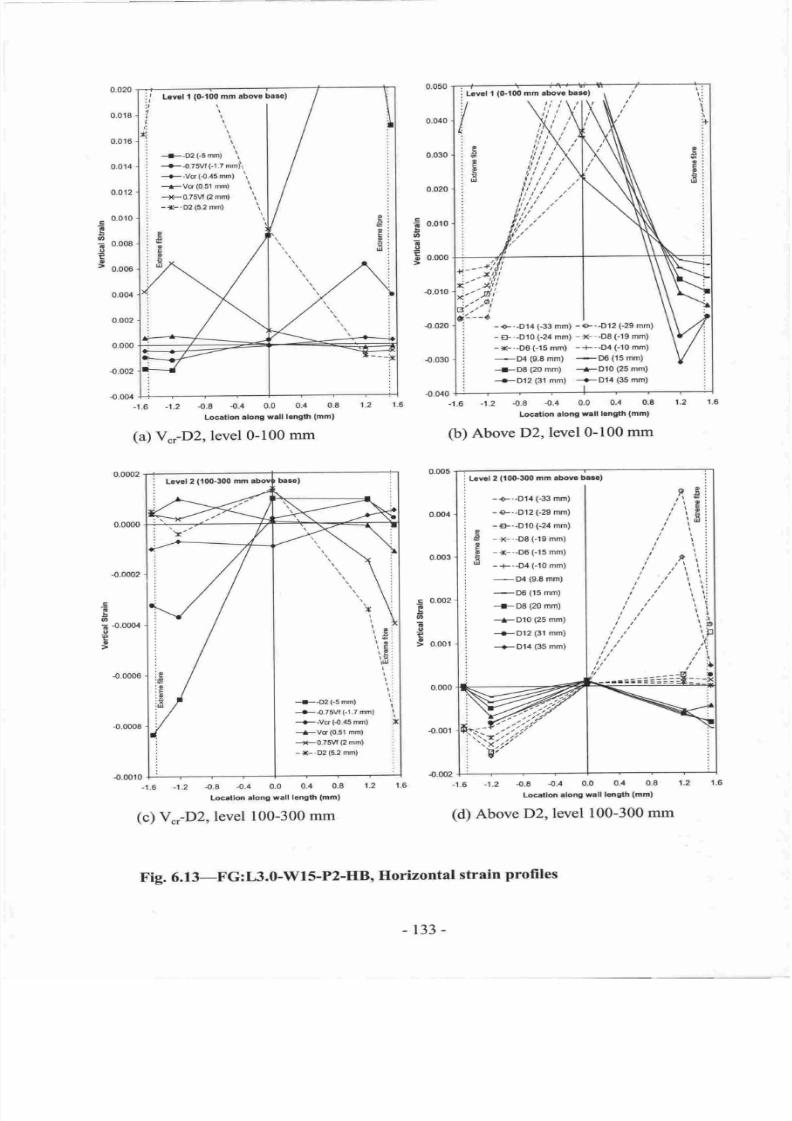
7/21/2019 PHD Laursen-masonry Prestressed Walls
http://slidepdf.com/reader/full/phd-laursen-masonry-prestressed-walls 159/308
0-020
0.018
0.0r6
0.014
0.012
c
0.010
G
ta
-E
0.008
r
I
o.oou
0.004
0.002
0.000
-0.002
{.fix
J.6
-1.2
{.8
{.4
0.0
0.4
0.8
Locrtlm
.long
wlll
lsngth
(mmt
(a)
V",-D2,
level
0-100
mm
-1.6
-1.2
-O.E
{.4
0.0
0.4
0.8
Loc.tlon tlong
w.ll
hngth
(mtnl
(b)
Above
D2,level0-100
mm
-1.6
-1.2
{.8
-0.4
0.0
0.4
0.8
1.?
Locltlm
slong
r.ll
longfh
(mm)
(d)
Above
D2,level
100-300
mm
1.6
.2
0.003
g
0.0O2
I
0
E
E
I
o.oor
0.000
-0.001
{.002
-1.6
-1.2
{.8
-0.4
0.0
0.4
0.8
1.2
Loc.llon dong
s.ll l.ngih
(mml
(c)
V.,-D2,level
100-300
mm
Fig.
6.13-FG:L3.0-W15-P2-HB,
Ilorizontal
strain
profiles
-133-
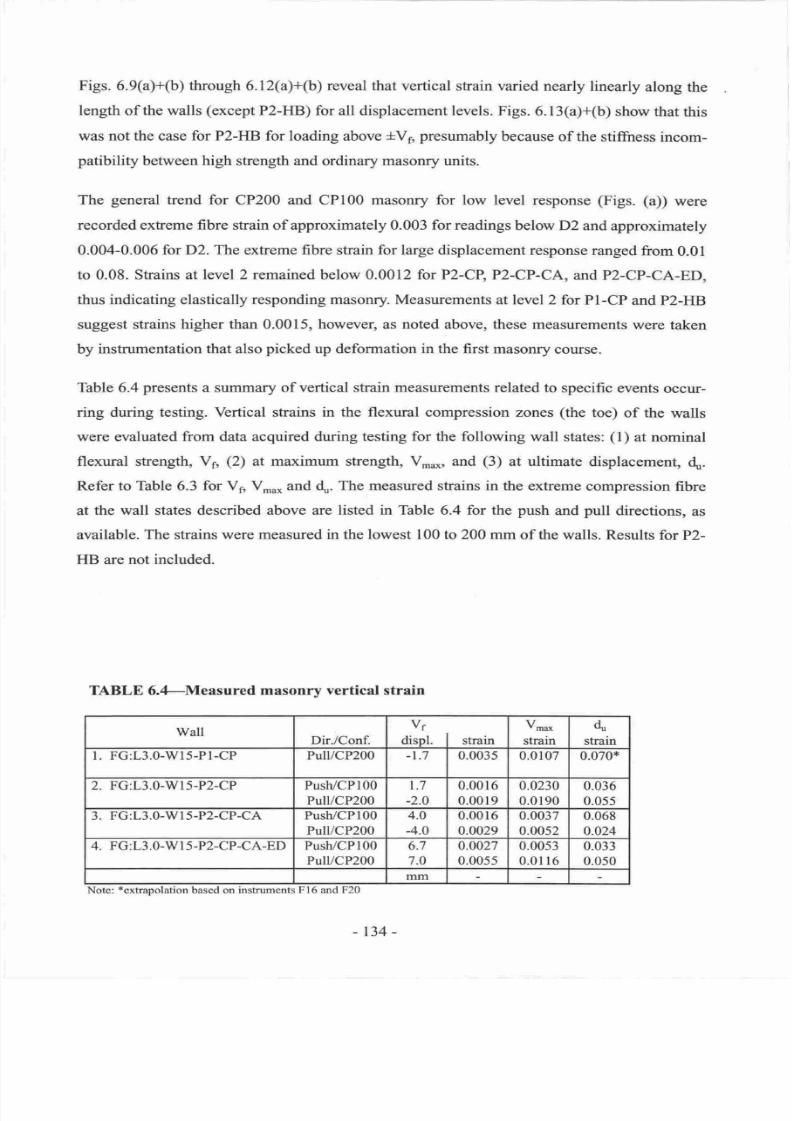
7/21/2019 PHD Laursen-masonry Prestressed Walls
http://slidepdf.com/reader/full/phd-laursen-masonry-prestressed-walls 160/308
Figs.
6.9(a)+(b)
through
6.12(a)+(b) reveal that
vertical
sfain
varied nearly
linearly
along
the
length of the walls
(except
P2-HB) for all displacement levels.
Figs.
6.13(a)+(b)
show
that
this
was not
the
case
for P2-HB
for loading above
*V6
presumably
because
of the stiffness
incom-
patibility
between
high
strengh
and
ordinary
masoffy
units.
The general
trend
for
CP200 and CP100 masonry
for low
level response (Figs.
(a))
were
recorded extreme
fibre
strain of approximately 0.003 for readings
below D2
and approximately
0.004-0.006 for
D2. The
extreme
fibre
sfrain for large displacement
response ranged
from
0.01
to 0.08. Strains at
level
2
remained below
0.0012 for
P2-CP,
P2-CP-CA,
and
P2-CP-CA-ED,
thus indicating elastically responding masonry. Measurements
at
level
2 for Pl-CP
and P2-HB
suggest strains
higher than 0.0015, however,
as
noted above,
these measurements
were taken
by instrumentation
that also
picked
up deformation in the first masonry
course.
Table 6.4
presents
a sunmary of vertical strain measurements related to
specific
events
occur-
ring
during testing. Vertical strains
in
the flexural compression
zones
(the
toe)
of
the
walls
were evaluated
from
data
acquired
during testing for the following
wall
states:
(l)
at nominal
flexural strength,
Vn
(2)
at
maximum strength, Vn
,
and
(3)
at
ultimate
displacement,
du.
Refer
to
Table
6.3
for
Vp
V* * and
dr. The measured stains in
the extreme
compression
fibre
at
the
wall
states described above are listed
in
Table
6.4
for
the
push
and
pull
directions,
as
available.
The
strains
were measured in the lowest
100
to 200 mm
of
the walls. Results
for
P2-
HB
are
not included.
TABLE 6.LMeasured
masonrv
vertical strain
Wall
Dir./Conf.
vf
disol.
I
strain
Vr-
strain
d
strain
L FG:L3.0-Wl5-Pl-CP
Pull/CP200 -1.7 0.003s
0.0107
0.070*
2. FG:L3.0-Wl5-P2-CP
Push/CPl00
PulliCP200
1.7
-2.0
0.0016
0.0019
0.0230
0.0190
0.036
0.055
3. FG:L3.0-Wl
5-P2-CP-CA
Push/CPl00
Pull/CP200
4.0
-4.0
0.00r6
0.0029
0.0037
0.0052
0.068
0.024
4. FG:L3.0-Wl5-P2-CP-CA-ED
Push/CPl00
Pull/CP200
6.7
7.0
0.0027
0.0055
0.0053
0.01l6
0.033
0.050
nrm
Note:
+extrapolation
based
on instruments
Fl6 and F20
-r34-
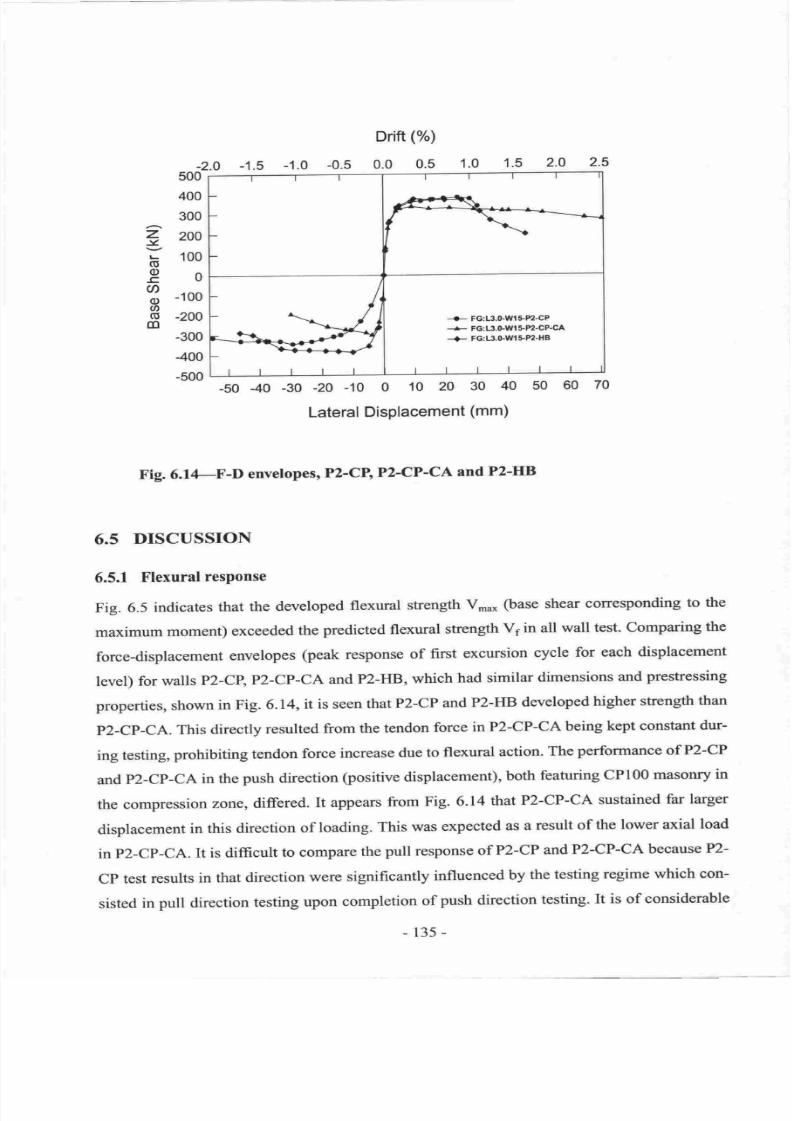
7/21/2019 PHD Laursen-masonry Prestressed Walls
http://slidepdf.com/reader/full/phd-laursen-masonry-prestressed-walls 161/308
-2.0
-1.5
Drift
(%)
-0.5 0.0
0.5 2.0
.5
.0
2.5
z
.Y
G
o
-c,
U)
o
(t,
o
m
500
400
300
200
100
0
-100
-200
-300
400
-500
-.]-
FG:L3.0-W$P2-CP
--.-
FG:L3.o.nrt
$ P2-CP-CA
+
FG:L3.Gu|I+P2-HB
-50
-40
-30
-20
-10
o
10
20 30
40
50
60
70
Lateral
Displacement
(mm)
Fig.6.14-F-D
envelopes,
P2-CP,
P2-CP-CA
and
P2-HB
6.5
DISCUSSION
6.5.1
Flexural
response
Fig.
6.5
indicates
that
the
developed
flexural
strength
Vn' ,
(base
shear
corresponding
to the
maximum
moment)
exceeded
the
predicted flexural
strength
Vs
in all
wall test. Comparing
the
force-displacement
envelopes
(pea,k
response
of
first
excursion
cycle
for
each displacement
level)
for
walls
p2-cp,p2-cp-cA
and
P2-HB,
which
had similar
dimensions
and
prestressing
properries, shown
in Fig.
6.14,
it
is seen
that
P2-CP
and
P2-}IB
developed
higher
strength
than
p2-Cp-CA.
This
directly
resulted
from
the
tendon
force
in
P2-CP-CA
being
kept
constant
dur-
ing
testing,
prohibiting
tendon
force
increase
due
to
flexural
action.
The
performance
of
P2-CP
and
p2-CP-CA
in
the
push
direction
(positive displacement),
both
featuring
CPt00
masonry
in
the
compression
zone,
differed.
It
appears
from
Fig. 6.14
that
P2-CP-CA
sustained
far larger
displacement
in
this direction
of
loading.
This
was
expected
as
a
result
of
the
lower axial
load
in
p2-Cp-CA.
It
is difficult
to compare
the
pull response
of
P2-CP
and
P2-CP-CA
because
P2-
Cp
test
results
in that
direction
were
significantly
influenced
by
the
testing
regime
which con-
sisted
in
pull
direction
testing
upon
completion
of
push
direction
testing.
It is
of considerable
-135-
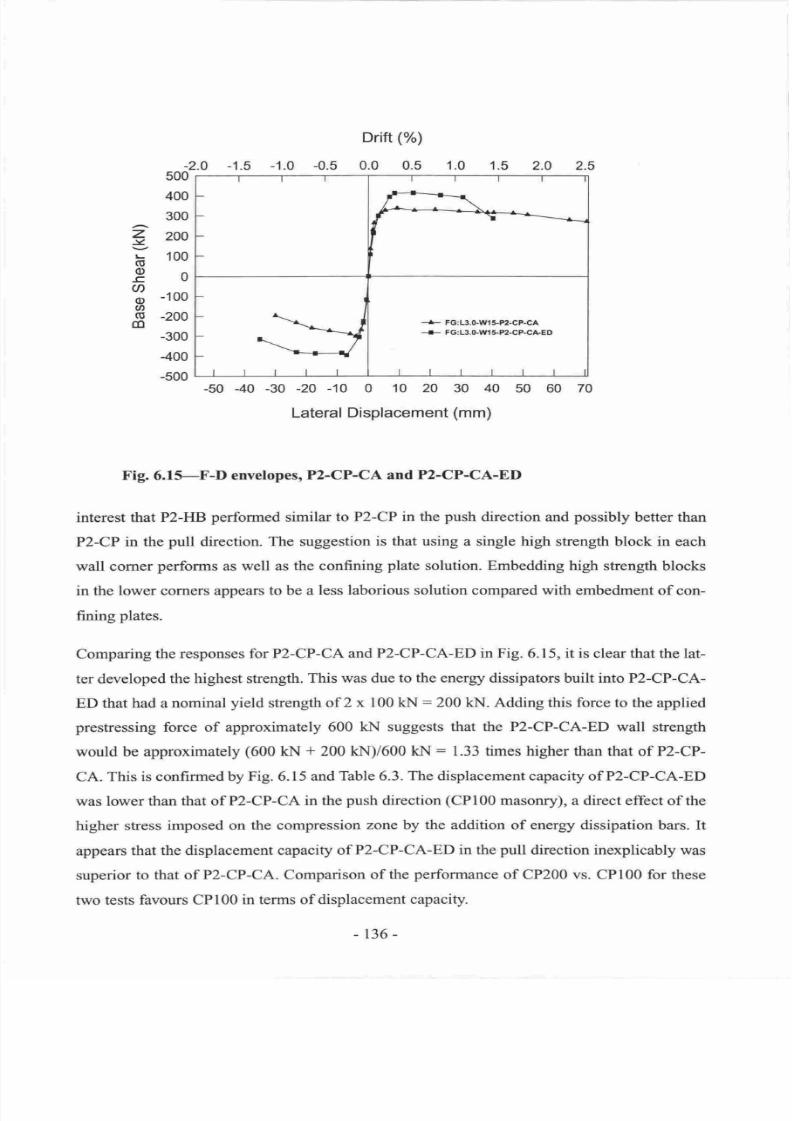
7/21/2019 PHD Laursen-masonry Prestressed Walls
http://slidepdf.com/reader/full/phd-laursen-masonry-prestressed-walls 162/308
-2.0
-1.0
-0.5
Drift
(%)
0.0
0.5
1.0 1.5
2.0
2.5
500
400
300
200
100
0
-100
-200
-300
400
-500
-50
-40
-30
-20
-10
0 10
20 30 40
50
Lateral Displacement
(mm)
Fig.
6.11-F-D
envelopes,
P2-CP-CA
and P2-CP-CA-ED
interest
that
P2-FIB
perfonned
similar
to P2-CP
in the
push
direction
and
possibly
better
than
P2-CP in
the
pull
direction. The
suggestion
is that using a single high
strength block in
each
wall
comer
performs
as
well
as
the confining
plate
solution. Embedding high strength
blocks
in the
lower corners appears
to be
a less laborious solution compared with embedment
of con-
fining
plates.
Comparing
the
responses
for
P2-CP-CA
and
P2-CP-CA-ED in
Fig. 6.15, it is clear that the lat-
ter developed
the
highest
strength.
This
was due
to the energy dissipators built into P2-CP-CA-
ED that
had
a
nominal
yield
strength
of
2 x 100 kN
:200
kN. Adding
this force to the applied
prestressing
force
of
approximately
600
kN
suggests
that the P2-CP-CA-ED wall
strength
would
be approximately
(600
kN
+
200 kNy600
kN
=
1.33 times
higher than that
of
P2-CP-
CA.
This
is
confrmed by
Fig. 6.15
and Table
6.3. The displacement
capacity of P2-CP-CA-ED
was lower
than that of
P2-CP-CA
in the
push
direction
(CPl00
masonry), a direct effect
of the
higher
stress
imposed on the compression
zone by
the
addition of energy dissipation
bars. It
appears
that
the displacement
capacity of
P2-CP-CA-ED in the
pull
direction inexplicably
was
superior
to that of P2-CP-CA. Comparison
of
the
perfiormance
of CP200
vs.
CPl00 for these
two tests
favours CPl00
in
terms
of displacement
capacity.
z
-Y
o
o
-c,
a
o
U'
ct
(D
70
[l-l--rr
{R
--+-
FG:L3.0-Wl
+P2-CP-CA
--.-
FG:L3.GWI P2-GP-CA.ED
136 -
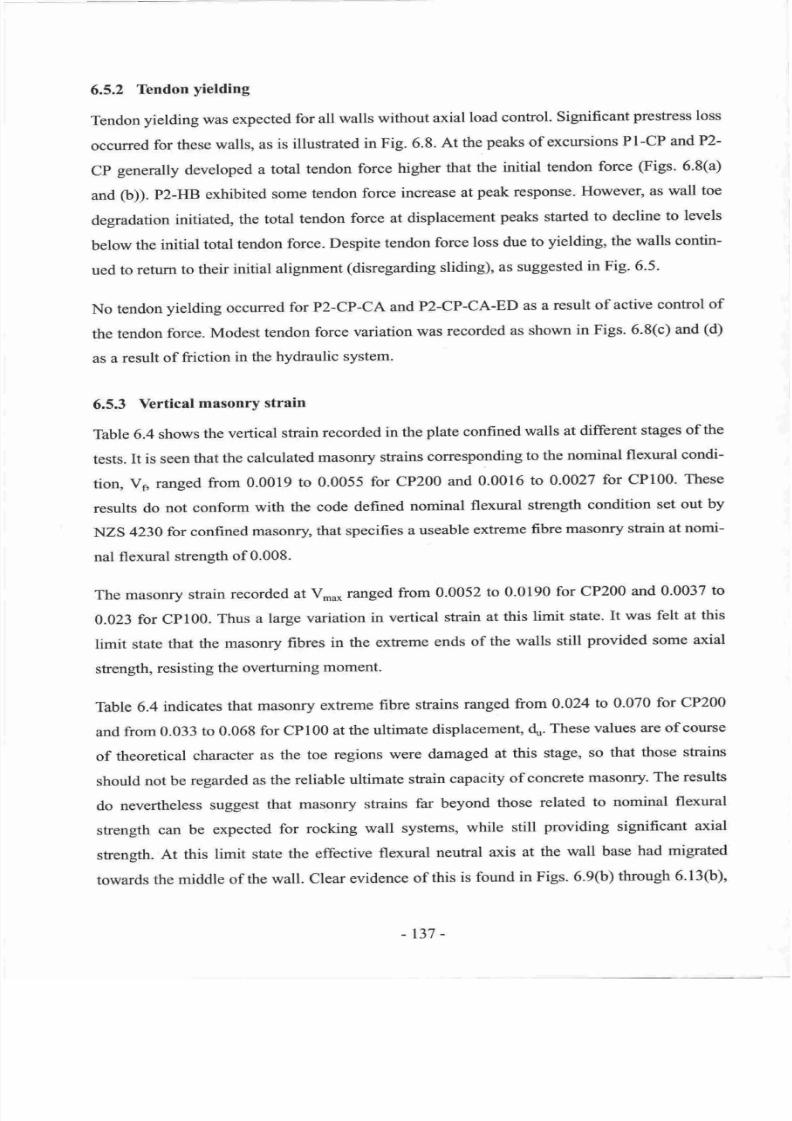
7/21/2019 PHD Laursen-masonry Prestressed Walls
http://slidepdf.com/reader/full/phd-laursen-masonry-prestressed-walls 163/308
6.5.2
Tendon
yielding
Tendon
yielding
was
expected
for all
walls
without
axial
load
control.
Significant
prestress
loss
occurred
for these
walls,
as
is illustrated
in Fig.
6.8.
At
the
peaks
of excursions
Pl-CP
and
P2-
Cp
generally
developed a
total
tendon
force
higher that the
initial
tendon
force
(Figs.
6.8(a)
and
(b)).
P2-HB
exhibited
some
tendon force
increase
at
peak
response.
Howevero
as
wall
toe
degradation
initiated,
the
total
tendon
force at
displacement
peaks
started
to
decline
to
levels
below
the
initial
total
tendon
force.
Despite
tendon
force
loss
due
to
yielding, the
walls
contin-
ued
to retum
to
their
initial
alignment
(disregarding
sliding),
as
suggested
in Fig. 6.5
No
tendon
yielding
occurred
for P2-CP-CA
and
P2-CP-CA-ED
as
a result
of active
control
of
the tendon
force.
Modest tendon
force variation
was recorded
as
shown
in
Figs.
6.8(c)
and
(d)
as a result
of
friction
in
the hydraulic
system.
6.5.3
Vertical
masonry
strain
Table
6.4 shows
the
vertical
strain
recorded
in the
plate
confined
walls at
different
stages
of the
tests.
It is
seen
that
the
calculated
mason-ry
strains
corresponding
to the
nominal
flexural
condi-
tion,
Vs,
ranged
from
0.0019
to
0.0055
for
CP200 and
0.0016
to
0.0027
for
CPl00. These
results
do
not
conform
with
the
code
defined
nominal flexural
strength
condition
set
out
by
NZS
4230
for confined
masonry,
that specifies
a useable
extreme
fibre masonry
strain
at
nomi-
nal
flexural
strength
of 0.008.
The
masonry
strain
recorded
at V*u*
ranged
from
0.0052
to
0.0190
for
CP200
and 0.0037
to
0.023
for
CP100.
Thus
a
large
variation
in
vertical
strain
at
this limit
state.
It
was
felt
at
this
limit state
that the
masonry
fibres
in
the
exheme
ends
of
the walls
still
provided some
axial
stength,
resisting the
overtuming moment
Table
6.4
indicates
that masonry
extreme
fibre
stains
ranged
from
0.024
to
0.070
for
CP200
and
from
0.033
to 0.068
for CP100
at
the ultimate
displacement,
4.,.These
values
are of
course
of
theoretical
character
as the
toe
regions
were damaged
at
this stage,
so
that those
strains
should
not
be
regarded
as the
reliable
ultimate
strain
capacity
of
concrete
masonry.
The
results
do
nevertheless
suggest
that
masonry
strains
far
beyond
those
related
to
nominal
flexural
strength
can
be
expected
for
rocking
wall systems,
while
still
providing
significant
axial
stength.
At
this
limit state
the effective
flexural
neufial
axis
at
the
wall
base
had migrated
towards
the
middle
of the
wall.
Clear
evidence
of this
is found
in Figs.
6.9(b)
through 6-13(b)
t37
-
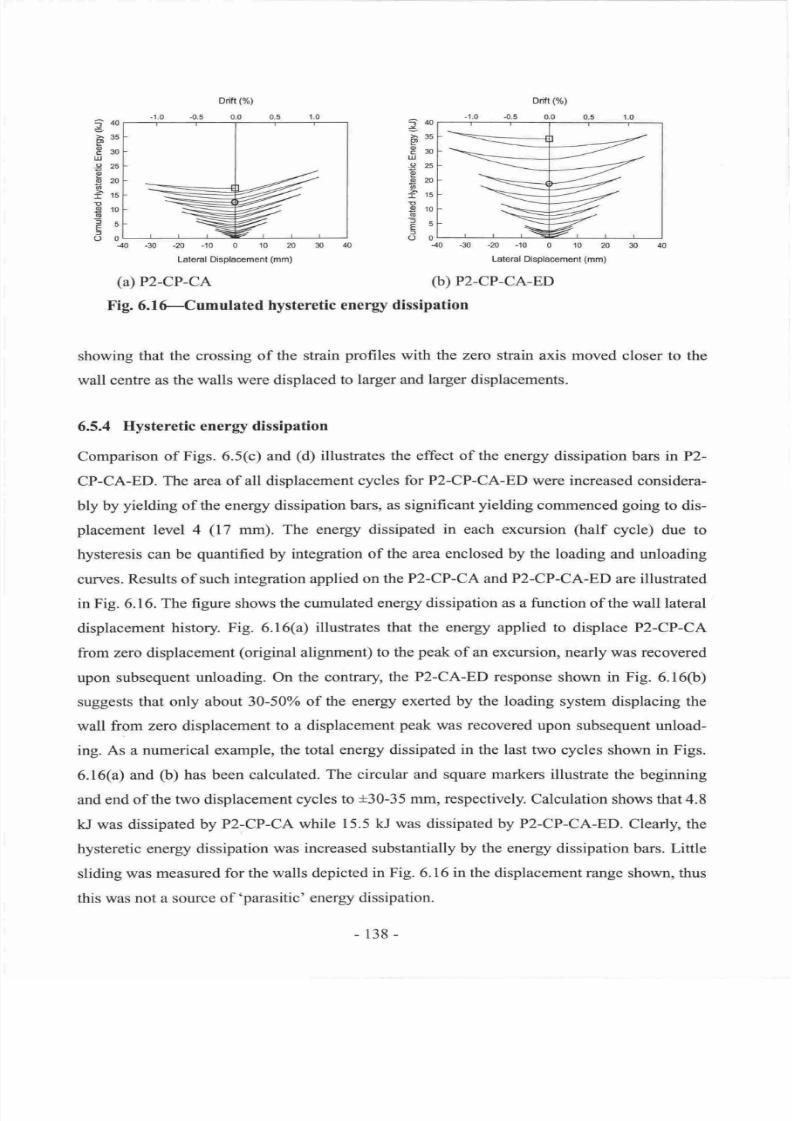
7/21/2019 PHD Laursen-masonry Prestressed Walls
http://slidepdf.com/reader/full/phd-laursen-masonry-prestressed-walls 164/308
ooI
or
*f
*r
'r
5
t--
f
ur
0L
Drift
(%)
{.5
0.0
-40
-30
-m
-10
0 10 m 30
Lateral Displacemenl
(mm)
(a)
P2-CP-CA
-40
.30
-20
-10
0 r0
30
Lateral Displacement
(mm)
(b)
P2-CP-CA-ED
Fig.
6.lG-Cumulated
hysteretic
enerry
dissipation
showing
that the crossing
of
the strain
profiles
with
the zero strain
axis moved
closer to the
wall
centre as the walls
were
displaced
to larger and
larger
displacements.
6.5.4 Hysteretic
enerry
dissipation
Comparison
of
Figs. 6.5(c)
and
(d)
illustrates the effect
of
the energy
dissipation bars
in
P2-
CP-CA-ED.
The
area of
all displacement
cycles
for P2-CP-CA-ED
were increased
considera-
bly
by
yielding of
the energy dissipation bars,
as
significant
yielding
commenced
going to dis-
placement level
4
(17
mm). The
energy
dissipated
in
each
excursion
(half
cycle)
due to
hysteresis can be
quantified
by
integration
of the area
enclosed
by the loading
and unloading
curves.
Results of
such
integration applied
on the P2-CP-CA and P2-CP-CA-ED
are illustrated
in Fig. 6.16.
The figure shows the cumulated
energy
dissipation
as a function
of
the
wall latoral
displacement
history.
Fig.
6.16(a)
illustrates
that
the
energy applied
to
displace
P2-CP-CA
from
zero
displacement
(original
alignment) to
the
peak
of an excursion,
nearly was
recovered
upon
subsequent
unloading. On
the contrary,
the P2-CA-ED response
shown
in Fig.
6.16(b)
suggests
that
only
about 30-50%
of
the
energy exerted by the loading
system displacing the
wall
from
zero displacement
to a displacement
peak
was
recovered
upon subsequent unload-
ing.
As
a
numerical example, the
total energy dissipated
in the last
two cycles shown in Figs.
6.16(a)
and
(b)
has been
calculated.
The circular and square markers illustrate the
beginning
and end
of the
two
displacement
cycles
to
t30-35
mm, respectively.
Calculation
shows that
4.8
kJ was dissipated
by
P2-CP-CA
while
15.5 kJ
was
dissipated by
P2-CP-CA-ED. Clearly, the
hysteretic
energy dissipation was
increased substantially
by the
energy
dissipation
bars.
Little
sliding
was measured
for
the walls depicted
in Fig. 6.16
in
the displacement range
shown, thus
this was
not a source
of
'parasitic'
energy
dissipation.
-1.0
?
P
d)
u,l
o
(D
a
?
o
-o
f
E
f
o
f
I
0)
llJ
E
0)
o
T
E'
o
c,
E
E
J
uof
*f
*r
'u
l-
,or
tuf
ro
l-
ur
gL
-40
-
138-
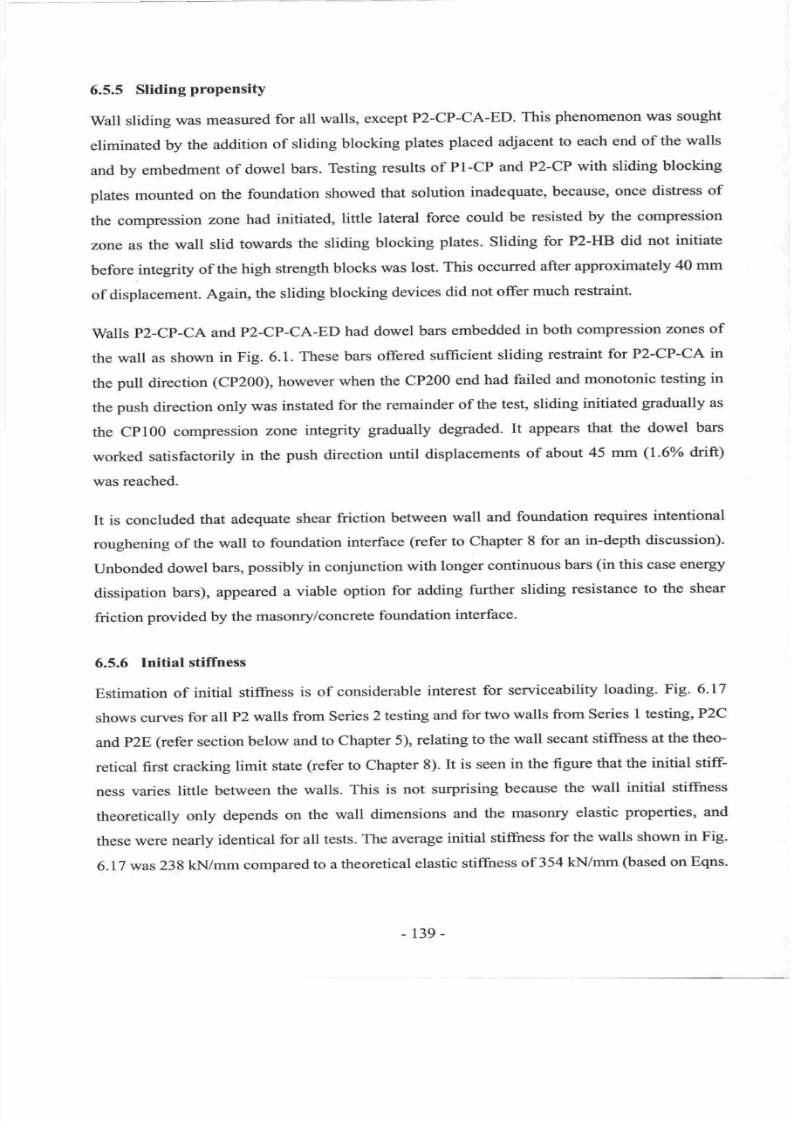
7/21/2019 PHD Laursen-masonry Prestressed Walls
http://slidepdf.com/reader/full/phd-laursen-masonry-prestressed-walls 165/308
6.5.5
SlidingpropensitY
Wall
sliding
was
measured
for
all walls,
except
P2-CP-CA-ED.
This
phenomenon was sought
eliminated
by
the
addition
of
sliding
blocking
plates
placed
adjacent
to
each
end
of the
walls
and
by
embedment
of
dowel
bars. Testing results
of
PI-CP
and P2-CP
with
sliding blocking
plates
mounted
on
the
foundation
showed
that
solution
inadequate,
because,
once
distress
of
the compression
zone
had
initiated,
little
lateral
force
could
be
resisted
by
the compression
zone as
the
wall
slid
towards
the sliding
blocking
plates.
Sliding
for
P2-HB
did not
initiate
before
integrity
of
the high
strength
blocks
was lost.
This
occurred
after
approximately
40 mm
of
displacement.
Again,
the sliding
blocking
devices
did
not
offer
much
restraint.
Walls
p2-Cp-CA
and
P2-CP-CA-ED
had
dowel
bars embedded
in
both
compression zones
of
the
wall as
shown
in
Fig.
6.1.
These
bars
offered
sufficient
sliding
restraint
for
P2-CP-CA
in
the
pull
direction
(CP200), however
when
the CP200
end
had
failed
and
monotonic
testing
in
the
push
direction
only
was
instated
for
the remainder
of the
test, sliding
initiated
gradually
as
the
CPl00
compression
zone
integrity
gradually degraded.
It appears
that
the dowel bars
worked satisfactorily
in
the
push
direction
until
displacements
of
about
45 mm
(1.6
drift)
was
reached.
It is
concluded
that
adequate
shear
friction
between
wall
and
foundation
requires
intentional
roughening
of
the
wall
to
foundation
interface
(refer to
Chapter
8
for an
in-depth discussion)-
Unbonded
dowel
bars,
possibly in conjunction
with
longer
continuous
bars
(in
this
case energy
dissipation
bars),
appeared
a
viable option
for
adding
further
sliding
resistance
to
the
shear
friction
provided
by the
masonry/concrete
foundation
interface.
6.5.6 Initial
stiffness
Estimation
of
initial
stiffness
is of
considerable
interest
for
serviceability
loading.
Fig.
6.17
shows
curves
for
all
P2 walls
from Series
2 testing
and
for two
walls
from
Series
I
testing,
P2C
and
p2E
(refer
section
below
and
to
Chapter 5),
relating
to the
wall
secant
stiffiress
at the
theo-
retical
first cracking
limit
state
(refer to Chapter
8).
It
is seen
in
the
figure
that
the
initial
stiF
ness
varies
littte
bet'ween
the walls.
This
is
not
surprising
because
the
wall initial stiffiress
theoretically
only
depends
on
the
wall
dimensions
and
the
masonry
elastic
properties,
and
these
were
nearly identical
for
all
tests.
The
average
initial
stiftress for
the
walls
shown
in
Fig.
6.17
was
238
kN/mm
compared
to a
theoretical
elastic
stiffiress
of 354
kN/mm
(based
on
Eqns'
139
-
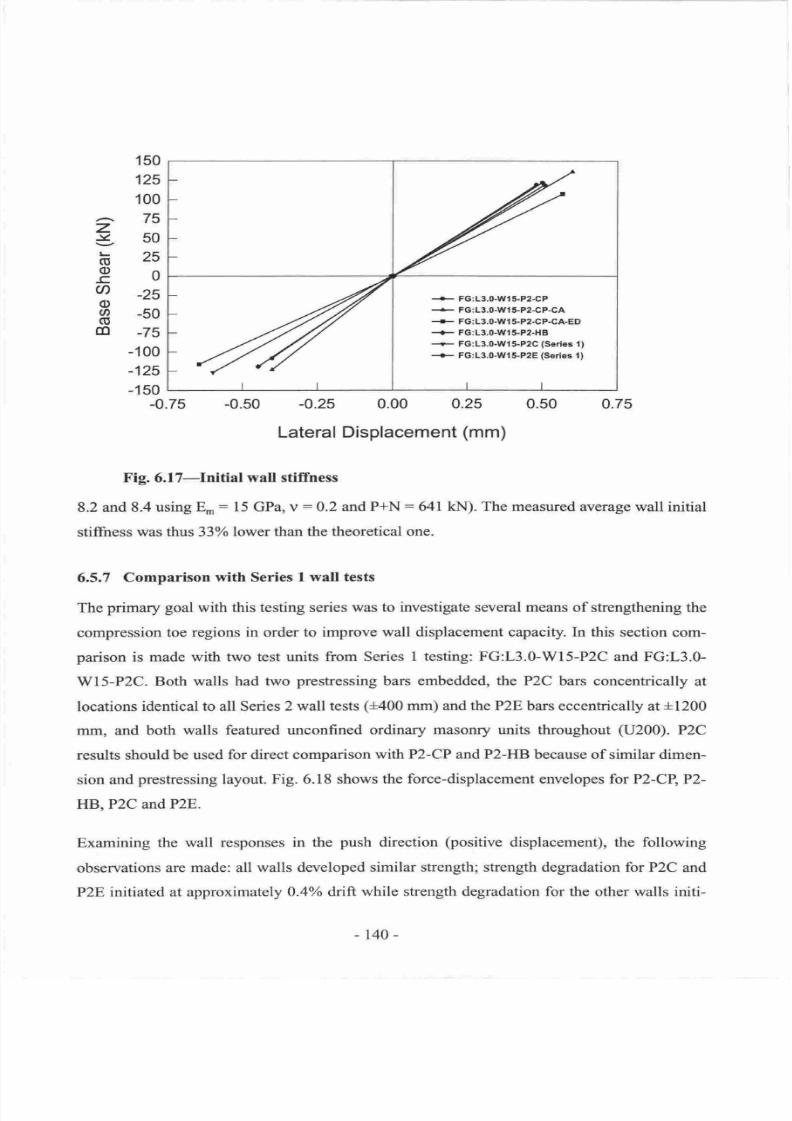
7/21/2019 PHD Laursen-masonry Prestressed Walls
http://slidepdf.com/reader/full/phd-laursen-masonry-prestressed-walls 166/308
z
lz
(E
o
-c
@
o
a
o
(D
150
125
100
75
50
25
0
-25
-50
-75
-100
-',25
-150
-+-
FG:L3.0-Wl5-P2.CP
+
FG:L3.0-W1 5-Pz-CP-CA
+
FG:L3.O-Wi
5-P2{P.CA-ED
+
FG:L3.0-Wi5-P2+|B
-
FG:L3.0-Wi5-P2G
(Serles
l)
+
FG:L3.0-Wi5.P2E
(Serle8
1)
-0.75
-0.50
-0.25 0.00 0.25
0.50
Lateral
Displacement
(mm)
0.75
Fig.
6.17-Initial
wall
stiffness
8.2
and
8.4
using
Er:
15 GPa,
v
:0.2
and
P*N:641
kN). The measured
average
wall
initial
stiffness
was
thus
33
lower than
the theoretical one.
6.5.7
Comparison
with
Series
I wall
tests
The
primary goal
with
this testing
series
was to investigate several means
of strengthening
the
compression
toe
regions in
order to
improve
wall
displacement capacity.
In
this
section
com-
parison
is made
with
two
1ss1
rrnifs
from
Series
I testing: FG:L3.0-WI5-P2C
and FG:L3.0-
WI5-P2C.
Both walls had
two
prestressing
bars embedded,
the
P2C bars concentrically
at
locations
identical
to
all
Series 2 wall
tests
(*400
mm) and the P2E bars
eccenhically at
+1200
mmo and both
walls
featured unconfined
ordinary masonry
units throughout
(U200).
P2C
results
should
be
used
for direct comparison
with
P2-CP
and P2-HB because
of
similar dimen-
sion and
prestressing
layout.
Fig. 6.18 shows
the force-displacement
envelopes for P2-CR
P2-
HB, P2C
and P2E.
Examining
the
wall
responses
in
the
push
direction
(positive
displacement),
the
following
observations
are
made: all
walls developed
similar strength; strength
degradation for P2C
and
P2E
initiated at approximately
0.4 drifr
while
strength
degradation
for the
other
walls
initi-
-
140-

7/21/2019 PHD Laursen-masonry Prestressed Walls
http://slidepdf.com/reader/full/phd-laursen-masonry-prestressed-walls 167/308
-0.8vmax
r
,n-\
/
_
-:-</"Yt--"'/
l
<l-
FG:13.0-lt'l5.HI-CP
-r-
FG:Lil.GWl$Pil-HB
--?-
FG:L3.&wlsP2c
(Sstl.
1l
-*-
F9:L3.0-W1$P1
E
(S.dot
tl
- ----}t-tt+'-h-;z
-0.Evmax
rrtll
r
cPm0
I
-2.0
Drift
(%)
-0.5 0.0
0.5
500
400
300
200
100
0
-100
-200
-300
400
-s00
-50
40
-30 -20
-10
0
10
20 30
40 50
Lateral
Displacement
(mm)
Fig.
6.f 8-F-D envelopes,
P2-CB P2-HB'
P2C and
P2E
ated
at
about 0.9%
drift;
the
ultimate
displacement capacity (at strength degradation
to
0.8Vn'",
shown
as dashed lines)
for
P2-CP,
P2-HB and P2E
were
similar at approximately
l.2yo,Pzc
had a
displacement capacity
of about
0.5%.It
is
therefore
concluded
that CP100 and HB solu-
tions
performed
significantly
better
than U200
for both
P2C and
P2E
in
terms
of
initiation of
strength
degradation,
and CP100 and
HB
performed
better
in
terms
of
ultimate
displacement
capacity in comparison
with U200
for P2C.
Examining the
wall
responses
in
the
pull
direction
(negative
displacement),
similar
observa-
tions are
made: all walls developed
similar strength
(except
for P2-CP
that was influenced sig-
nificantly by
base sliding
rendering the
results difficult
to compare
with
those from the other
wall tests);
rapid strength
degradation
for
P2E initiated
at approximately
0.3%
drift while
strength degradation
of P2-HB and
P2C
was
rather
gradual;
the
ultimate displacement
capaci-
ties
(at
strength
degradation
to
0.8V,.*
shown
as dashed
lines) for
P2-llB,
P2C and P2E were
approximately
l.4o/o,l.lo/o,
and 0.5%,
respectively.
It is therefore
concluded
that the HB solu-
tion
performed
significantly
better
than
U200 for
both P2C
and
P2E
in
terms
of
initiation
of
strength degradation
and
ultimate displacement
capacity.
It cannot
be
directly
concluded from
Fig. 6.18
that
CP200
performed
better
than U200,
however,
the large displacement
capacity in
2.0
.5.0
1.01.5
z
J
G
o
E
@
o
o
o
m
-l4r-
7/21/2019 PHD Laursen-masonry Prestressed Walls
http://slidepdf.com/reader/full/phd-laursen-masonry-prestressed-walls 168/308
the
pull
direction
for P2-CP suggest
that also
CP200
masoffy
outperforms
U200 masonry
with
a
significant margin.
6.6
CONCLUSIONS
It
is concluded
that strengthening of
the flexural compression zones
of
fully
grouted
unbonded
post-tensioned
concrete masonry
walls
successfully
improved the
wall
displacement
capacity
and delayed
the
onset of
stength
degradation
in
comparison
with
a PCM wall
of similar
dimensions
made
with
unconfined
masonry.
The maximum
wall stength remained insensitive
to strengthening
of
the
compression
zone.
The
PCM
walls
reported on
in
this
chapter behaved
similarly
to
the behaviour
observed
for
testing
Series
l,
notably they exhibited
a nearly
non-linear
elastic
behaviour
dominated
by
rocking
response. The exception
was P2-CP-CA-ED that exhibited rocking response
with non-
linear
elasto-plastic
behaviour
due
to the
presence
of
energy
dissipation devices.
Large
drift
capacities
were measured,
0.7o/o to 2o/o for directions
with
CP200 comers
engaged,
l
-Io/o
to
2.60/o
with
CP100 corners
engaged and I.IVo
to
l.4o/o with
high strength block
corners
engaged.
This clearly
attests
to
consistent
improvement
of
wall displacement
capacity using
confining
plates
or high strength
corner units.
The
highest
performing
solution was
CP100.
Only
localised damage
occurred,
as shown
in
Fig.
6.6, making earthquake
damage easy to
repair.
It
is
seen
that
nearly
all
damage
occurred
to the lowest
masonry course for CP200
and
CPl00.
This is supported by the
vertical strain
plots
shown in Figs.6.9 to
6.12,that
suggest
that
little
inelastic
masonry response
was
measwed above the lowest 200 mm of the walls.
The
high strength
masonry
units appear
to have shifted
masonry
crushing
to the second
masonry
course
U200)
above
the foundation because
of
the very
high
strength of the high
strength
units.
Use of confining
plates
is
recommended
for
PCM
wall
construction based
on
the
general
observations
of
increase
of
wall
displacement
capacity and
reduction
of wall
damage when
compared
with
the
performance
of unconfined
PCM
walls.
The
use
of
high
strength blocks in
the
lower
wall
corners
appears
to
improve the
wall
performance.
Still
brittle
masonry failure
occurs
in the masonry blocks
just
above
the
HB
blocks which
does
not
suggest
increased
wall
toughness.
The use of HB
corners is not
recommended for ductile design
if
HB blocks
only are
used to
replace
single masonry unit
in the
wall
corners.
-r42-
7/21/2019 PHD Laursen-masonry Prestressed Walls
http://slidepdf.com/reader/full/phd-laursen-masonry-prestressed-walls 169/308
Relatively little energy
dissipation was observed
during
cycling
of
all
walls,
except
for P2-CP-
CA-ED.
This may impact
the use
of
such
walls
for
ductile
seismic
design in the
sense
that
additional damping
may
be
required
to
control
the structural
drift
demand
in
an earthquake
event.
Therefore
one
wall
had
dog-bone
energy dissipation
dwices
embedded.
This
simple
device
proved
successful and
worked as expected.
A
threefold
increase of
hysteretic
damping
was
achieved
at large displacement
levels. The inherent
simplicity
and
insensitivity
to
con-
struction
tolerance of
the
dog-bone
type device
makes it a desirable
option
for
real
life con-
struction.
Buckling restraint
achieved by
casing of
the reduced
diameter section
of
the
dog-
bone energy
dissipation
bars
with
heavy
pipe
allows
for
placing
of
the energy dissipation bars
inside the
wall
without risk of out-of-plane bursting
of the masonry
because of bar buckling.
Tendon force
loss due to
yielding
should
be
expected
at
relatively
low wall
drift
ratios,
for
squat
walls. Even after
tendon
yielding,
reliable and
self-centring
wall behaviour is expected.
The hydraulic system
used
for
control
of the
prestessing force for P2-CP-CA and P2-CP-CA-
ED
performed
successfu
lly.
Measurements
at nominal
flexural strength suggest
that an exfeme
masonry
fibre
strain in
the
order of 0.0035
was found for CP200
and
0.0020
was found
for CPl00.
Both values
are sub-
stantially
lower than 0.008
as
stipulated by NZS
4230:1990
for confined
masonry.
At ultimate
displacement,
sffains as high as
0.046-0.050 were
measured
for both CP200 and CPl00.
At
this stage
the extreme masonry fibres
no longer carried
axial
load as face shell
spalling
had
occurred.
It was
concluded
that adequate shear
friction
between
wall and
foundation
requires
intentional
roughening of
the
wall to
foundation interface. Dowel
bars are
effective for adding
firther
slid-
ing
resistance.
Shear reinforcing should
be embedded
in
PCM
walls
to
reassure
integnty
of
the masonry
panel,
though not necessarily needed
for
strength.
-r43-
7/21/2019 PHD Laursen-masonry Prestressed Walls
http://slidepdf.com/reader/full/phd-laursen-masonry-prestressed-walls 170/308
6.7
REX'ERENCES
[6-U
P,ark,
k,
Evaluation
of
Ductility
af
Stru,eturcs
and
Stnrefrrd
As;emblages
for
Labora-
tory Testing,BulletinofNZX.ISEE
Yol.22,No.3n Sqt
1989,
pp
155-165.
[6-2]
NZS
4230:1990 Cade o{ Pracfice
for
the
Detign
qf
Masonry
Stmrctitws,
Standards
Assoeiation
of
Neii'
Zealaad, Wellinglon.
[6.3]
Paulay;
T.,
and
hiestley,
I\{.JN.,
Selrrlnlc Design af Reinforced Cona'zte
and Mosonry
Buildings,John Wiley
& Sons
Inc.,1992,744p.
-t44-
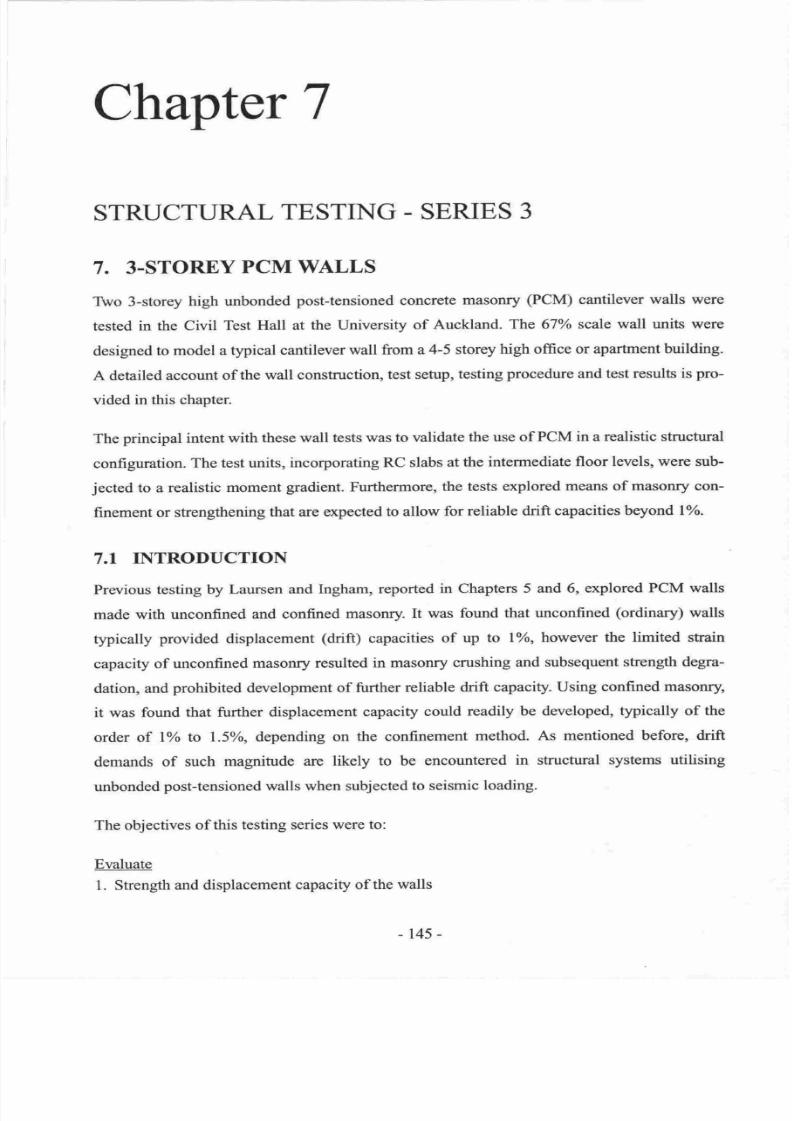
7/21/2019 PHD Laursen-masonry Prestressed Walls
http://slidepdf.com/reader/full/phd-laursen-masonry-prestressed-walls 171/308
Chapter
7
STRUCTURAL
TESTING
-
SERIES
3
7.
3-STOREY
PCM
WALLS
Two
3-storey
high unbonded
post-tensioned
concrete
masonry
(PCM)
cantilever
walls
were
tested
in
the
Civil
Test
Hall
at the University
of
Auckland.
The 67 o scale
wall
units were
designed
to
model a
typical cantilever
wall
from
a
4-5
storey
high office or
apartment
building.
A detailed
account of
the
wall construction,
test setup,
testing
procedure
and
test results is
pro-
vided in this chapter.
The
principal intent with
these
wall tests was
to validate
the use of
PCM
in a realistic structural
configuration.
The test units,
incorporating RC slabs
at
the
intermediate
floor levels, were sub-
jected
to a
realistic
moment
gradient.
Furthermore,
the
tests
explored
means of
masonry
con-
finement or
strengthening
that are
expected
to allow
for
reliable drift
capacities
beyond'
l .
7.I
INTRODUCTION
Previous
testing by
Laursen and
Ingham,
reported
in Chapters
5 and 6,
explored PCM walls
made
with unconfined
and confined
masonry.
It
was found
that unconfined
(ordinary)
walls
typically
provided
displacement
(drift)
capacities
of up
to lVo,
however
the
limited
strain
capacity
of
unconfined masonry
resulted
in
masonry crushing
and
subsequent
sfrength degra-
dation, and
prohibited
development of further
reliable
drift
capacity.
Using confined
masonry,
it was found
that
further displacement
capacity
could
readily be
developed, typically
of
the
order
of
lYo to l.5o/o,
depending on
the confinement
method. As
mentioned
before,
drift
demands
of such
magnitude
are
likely
to
be
encountered
in
structural
systems
utilising
unbonded
post-tensioned
walls when subjected
to seismic
loading.
The
objectives
of
this testing series
were to:
Evaluate
1. Strength
and displacement
capacity of the walls
-
145-
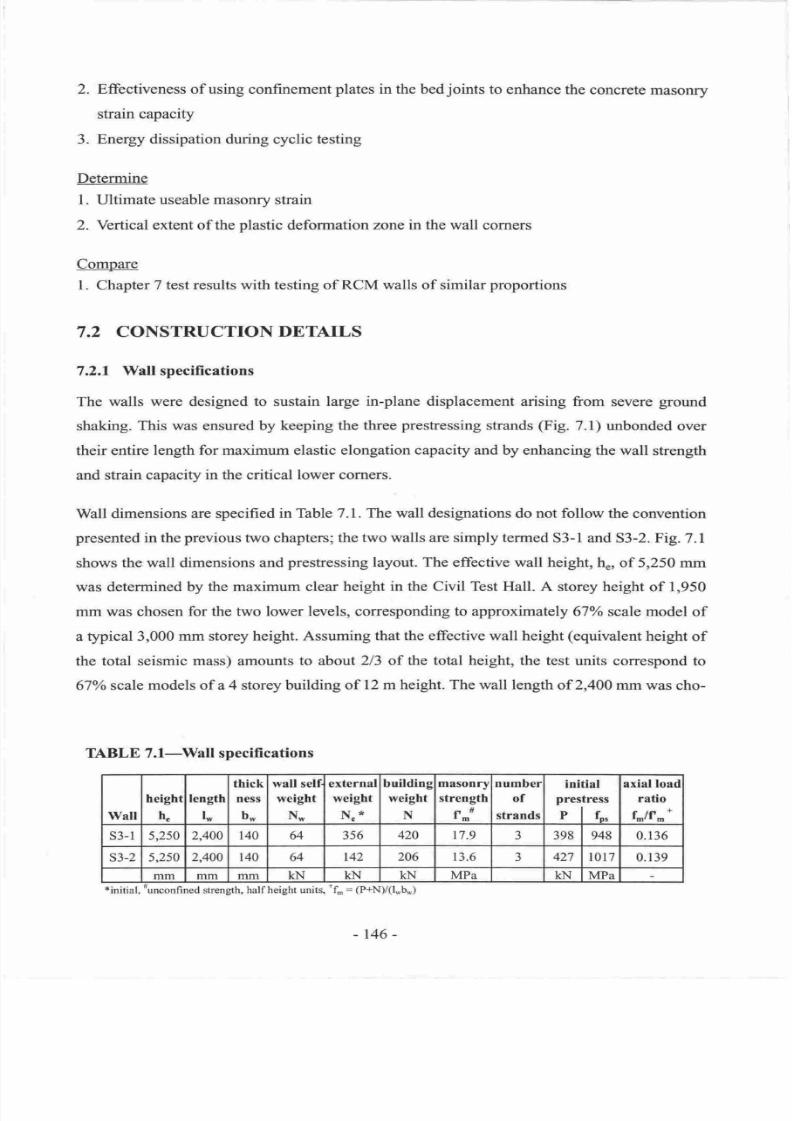
7/21/2019 PHD Laursen-masonry Prestressed Walls
http://slidepdf.com/reader/full/phd-laursen-masonry-prestressed-walls 172/308
2.
3.
Effectiveness of using confinement
plates
in the bed
joints
to
enhance the
concrete
masoffy
strain
capacity
Energy
dissipation
during cyclic
testing
Determine
l. Ultimate
useable masoffy
strain
2.
Vertical extent of
the
plastic
deformation
zone in the wall
corners
Compare
I . Chapter 7 test results with testing of RCM
walls of
similar
proportions
7.2
CONSTRUCTION DETAILS
7.2.1 Wall specifications
The
walls were designed
to
sustain
large in-plane displacement
arising from
severe
ground
shaking.
This was ensured by
keeping the three
prestressing
strands
(Fig.
7.1) unbonded
over
their entire
length for maximum elastic elongation
capacity and by enhancing
the wall
strength
and
strain capacity
in the
critical
lower corners.
Wall
dimensions are specified
in Table 7.1.
The wall designations
do not follow the
convention
presented
in the
previous
t'wo chapters;
the two walls are simply termed
53-1 and
S3-2.
Fig.
7.1
shows
the
wall
dimensions and
prestressing layout. The
effective wall
height,
h.,
of
5,250
mm
was determined
by
the
maximum
clear height
in
the Civil
Test
Hall. A storey height
of
1,950
nrm was chosen
for the two lower
levels, corresponding to approximately
670/o scale model
of
a
typical
3,000 mm storey
height. Assuming
that the
effective wall height
(equivalent
height
of
the
total
seismic
mass) amounts
to
about
213
of
the
total
height, the test units
correspond to
67Yo scale
models
of
a 4 storey building
of l2
m height. The wall length
of
2,400
mm was
cho-
TABLE
7.l-Wall
specifications
*initial.
unconfined
strength,
halfheight units,
-f-:
(P+N)/(l*b*)
Wall
height
h€
length
l*
thick
ness
b*
wall self
weight
N-
external
weight
N.*
building
weight
N
masonry
strength
f,nu
number
of
strands
initial
prestress
Plf
axial loati
ratio
f./ft.
-
s3-l
5,250 2,400 t40
64
356
420
17.9
3
398 948
0.136
s3-2 5,250
2,400 140 64
142 206
r
3.6 3 427
l0l7
0.1 39
mm mm rnm
KN KN KN MPa KN MPa
-t46-
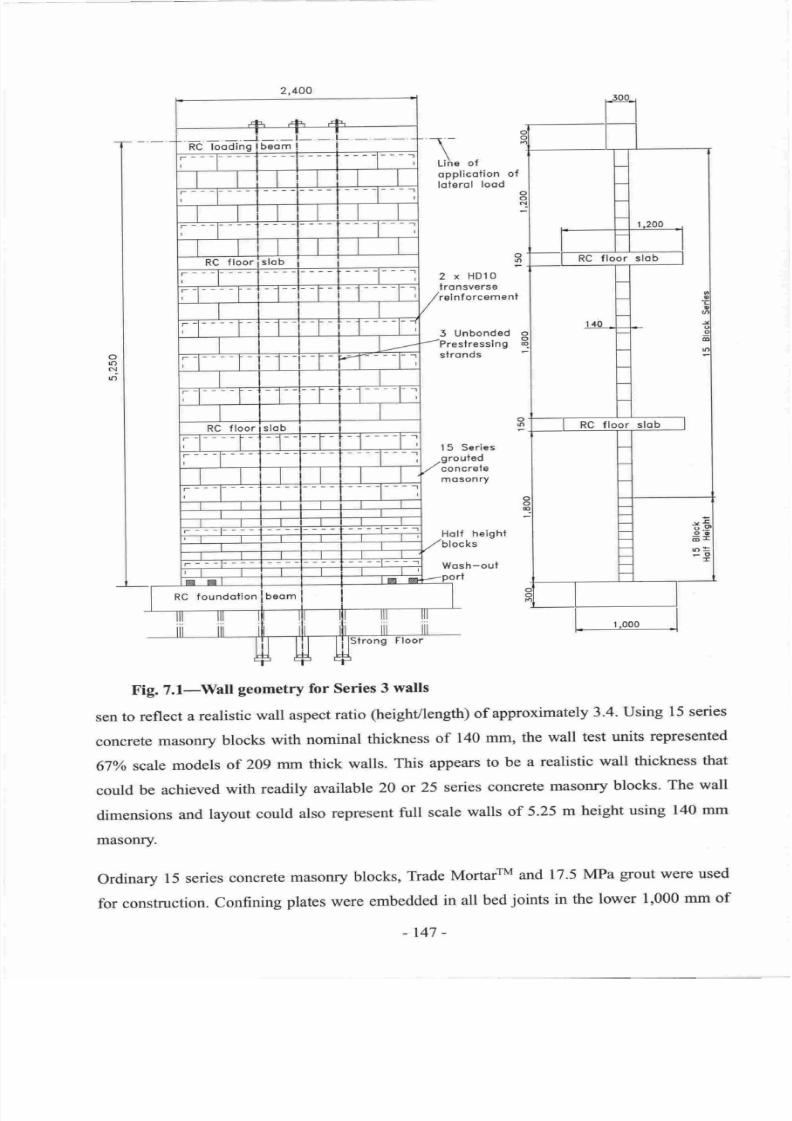
7/21/2019 PHD Laursen-masonry Prestressed Walls
http://slidepdf.com/reader/full/phd-laursen-masonry-prestressed-walls 173/308
1 ,
opplicofion
o{
lolerol
lood
2
x
HD1O
ironsverse
relnforcemenl
3
Unbonded
'Preslressing
slronds
15
Serles
grouied
concrefe
mosonry
Holf
height
ocks
Wosh-oul
Fig.7.l-Wall
geometry
for
Series
3
walls
sen
to
reflect
a
realistic
wall aspect
ratio
(heighVlength)
of approximately
3.4.
Using
15 series
concrete
masonry
blocks
with
nominal
thickness
of
140
mm,
the
wall
test units
represented
67yo
scale
models
of
ZOg
mm
thick
walls.
This
appears
to
be
a realistic
wall
thickness
that
could
be
achieved
with
read^ily
available
20
or
25
series
concrete
masonry
blocks.
The
wall
dimensions
and
layout
could
also
represent
full
scale
walls
of
5.25
m
heiglrt
using
140
mm
masonry.
Ordinary
15 series
concrete
masoffy
blocks,
Trade
MortaflM
and
17.5
MPa
grout
were
used
for
construction.
Confining
plates
were
embedded
in
all
bed
joints
in
the
lower
1,000
mm
of
-t47-
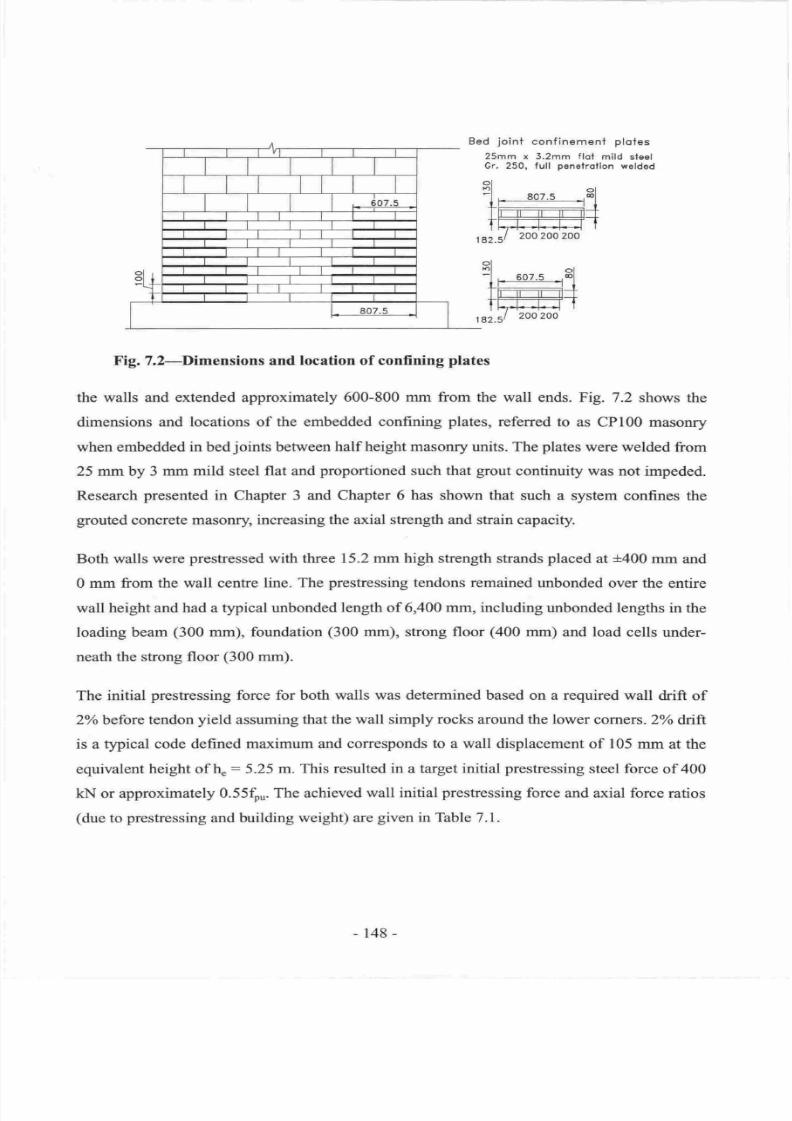
7/21/2019 PHD Laursen-masonry Prestressed Walls
http://slidepdf.com/reader/full/phd-laursen-masonry-prestressed-walls 174/308
Bed
joint
25mm
x
Gr.
250,
conf in€menl
ploles
3.2mm flol mild
sleel
full
penelrolion
welded
Fig.
7.2-Dimensions
and
locafion of confining
plates
the walls and extended approximately
600-800 mm
from
the
wall
ends.
Fig.
7.2
shows
the
dimensions and locations of
the embedded confining
plates,
referred
to
as CPl00 masonry
when embedded
in bed
joints
between
half height masonry units. The
plates
were
welded
from
25
mm by
3
mm
mild
steel
flat
and
proportioned
such that
grout
continuity was
not
impeded.
Research presented
in
Chapter
3
and Chapter
6
has shown
that
such
a
system confines
the
grouted
concrete masonry, increasing
the axial strength and
strain capacity.
Both walls
were
prestressed
with
three 15.2 mm high strength
strands
placed
at
+400
mm
and
0
mm from the
wall
centre
line. The
prestressing
tendons remained
unbonded over the entire
wall height and
had a typical unbonded
lengh
of 6,400 mm, including
unbonded lengths
in the
loading beam
(300
mm), foundation
(300
mm), strong
floor
(400
mm)
and
load
cells under-
neath
the
strong floor
(300
mm).
The
initial
prestressing
force
for both
walls was determined based on
a
required
wall
drift
of
2Tobefore
tendon
yield
assuming
that the wall simply
rocks
around the lower corners.
2%
dift
is
a
typical code defined
maximum and corresponds
to
a wall displacement
of
105
mm
at the
equivalent
height of
h :
5.25 m.
This resulted in a target
initial
prestressing
steel force
of
400
kN or approximately
0.55f0,.
The achieved
wall
initial
prestressing
force
and
axial
force
ratios
(due
to
prestressing
and
building
weight) are
given
in Table 7.1-
-148-
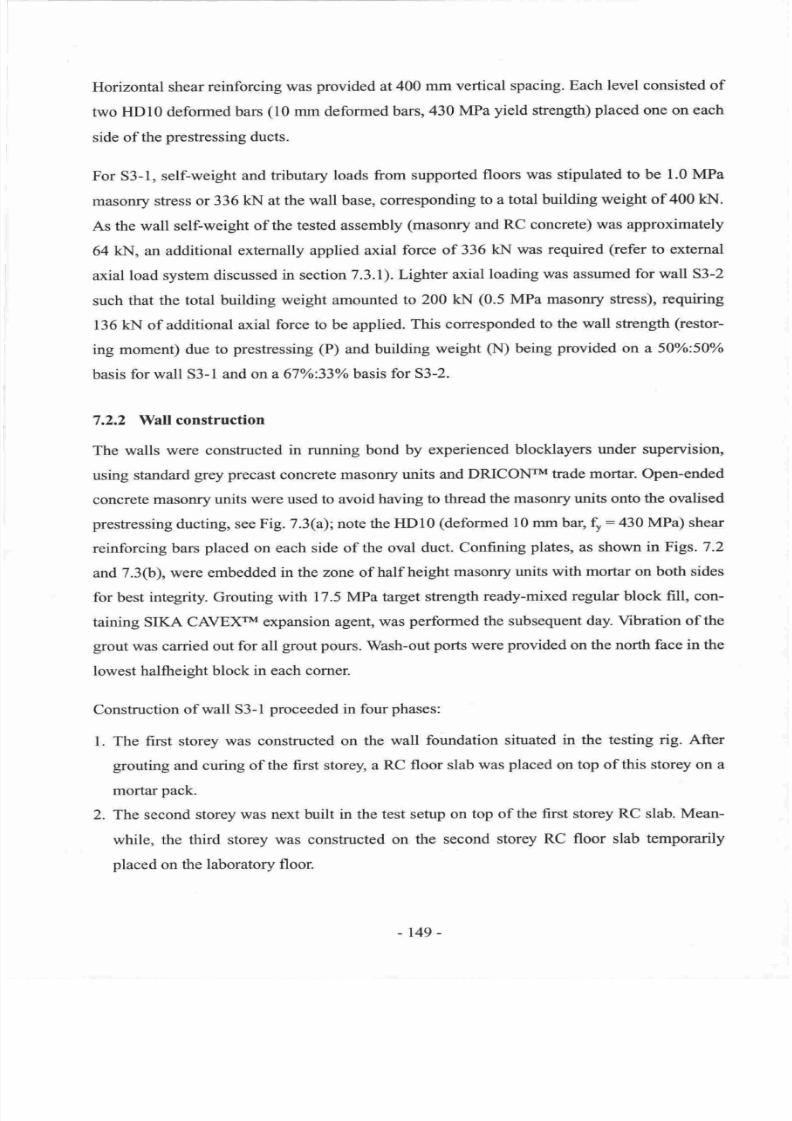
7/21/2019 PHD Laursen-masonry Prestressed Walls
http://slidepdf.com/reader/full/phd-laursen-masonry-prestressed-walls 175/308
Horizontal
shear
reinforcing was
provided
at
400
mm vertical
spacing.
Each level consisted
of
two
HDl0 deformed
bars
(10
mm deformed
bars,430
MPa
yield
shength)
placed
one on each
side
of the
prestressing
ducts.
For S3-1, self-weight
and
tributary loads from
supported
floors was
stipulated to be 1.0 MPa
masoffy
stress
or 336
kN
at
the wall base,
corresponding
to
a
total building
weight of 400 kI.I.
As the wall
self-weight
of the tested assembly
(masonry and
RC
concrete)
was approximately
64
ld{, an additional
externally
applied axial
force
of 336
k}.,1
was
required
(refer
to external
axial load system
discussed
in
section
7.3.1).
Lighter
axial loading
was assumed
for
wall
S3-2
such
that the total
building weight amounted
to
200
kN
(0.5
MPa
masonry
stress),
requiring
136
kN of additional
axial force to be applied.
This corresponded
to
the
wall
strength
(restor-
ing moment)
due
to
prestressing
(P)
and building
weight
(N)
being
provided
on a 50Yo:50o/o
basis for
wall S3-l
and
on
a 67o/o:33Yo
basis for
S3-2.
7.2.2 Wall construction
The
walls
were constructed
in
running
bond by experienced
blocklayers
under
supervision,
using
standard
grey
precast
concrete
masonry units
and
DRICONTM
trade mortar. Open-ended
concrete masonry units were
used
to avoid having to
thread the
masonry
units
onto the ovalised
prestressing
ducting,
see
Fig. 7.3(a);
note the
HDl0
(deformed
l0
mm bar,
:430
MPa) shear
reinforcing
bars
placed
on each side of
the
oval
duct. Confining
plates,
as shown
in
Figs.
7.2
and 7.3(b),
were embedded
in
the
zone
of
half
height masonry
units
with mortar on both sides
for best
integrity.
Grouting with
17.5 MPa target strength
ready-mixed
regular block
fill,
con-
taining SIKA
CAVEXTM expansion
agent, was
performed the subsequent day.
Vibration of
the
grout
was carried
out
for
all
grout
pours.
Wash-out
ports
were
provided
on the
north
face
in
the
lowest
halfheight block in
each corner.
Construction
of wall
S3-1
proceeded
in four
phases:
1. The
first
storey
was constructed on
the
wall
foundation situated
in
the testing
rig.
After
grouting
and curing
of the first
storey, a
RC floor slab
was
placed
on
top of this storey on a
mortar
pack.
2.
The second
storey was
next built in the test
setup on
top of
the first
storey
RC slab.
Mean-
while,
the
third
storey
was
constructed
on the
second storey
RC
floor
slab temporarily
placed
on the laboratory
floor.
-r49-
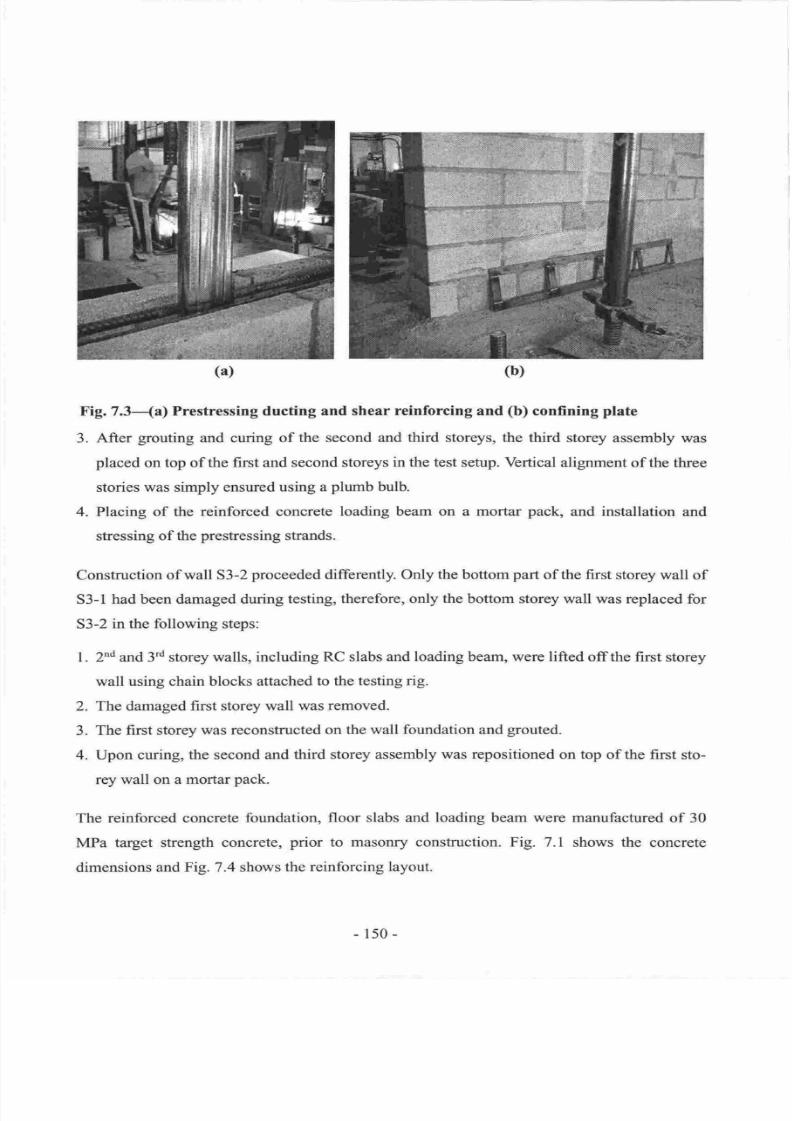
7/21/2019 PHD Laursen-masonry Prestressed Walls
http://slidepdf.com/reader/full/phd-laursen-masonry-prestressed-walls 176/308
Fig.7.fia)
Prestressing ducting and shear reinforcing and
(b)
confining
plate
3. After
grouting
and curing of the second
and third storeys, the third
storey assembly
was
placed
on top of the
first
and
second storeys
in the
test
setup. Vertical alignment
of
the
three
stories was simply ensured using
a
plumb
bulb.
4.
Placing
of
the reinforced
concrete
loading beam on
a mortar
pack,
and installation
and
stressing
of
the
prestressing
strands.
Construction
of wall S3-2
proceeded
differently.
Only
the bottom
part
of the first storey
wall of
S3-l
had been damaged
during
testing, therefore, only
the bottom
storey wall was replaced for
S3-2 in the following steps:
l.
2od and 3 d storey
walls,
including RC slabs
and loading
beam,
were lifted
offthe first
storey
wall
using chain blocks attached
to
the
testing rig.
2.
The damaged first storey wall
was removed.
3.
The first
storey
was reconstnrcted on
the wall foundation
and
grouted.
4. Upon
curing,
the
second
and third storey assembly
was
repositioned
on
top
of the first sto-
rey wall on a mortarpack.
The reinforced concrete
foundationo
floor
slabs and
loading
bearn were manufactued
of 30
MPa target
strength concrete,
prior
to
masonry constnrction. Fig.
7.1 shows the
concrete
dimensions
and
Fig.
7.4
shows
the reinforcing layout.
-150-
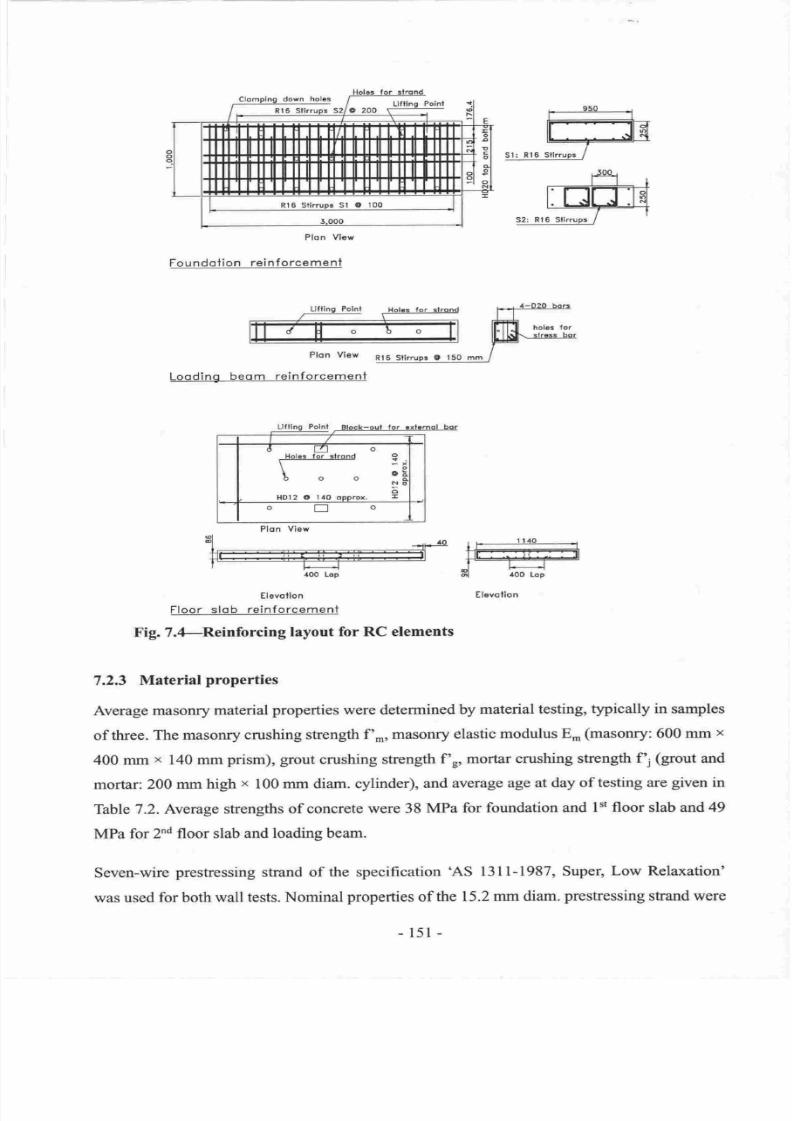
7/21/2019 PHD Laursen-masonry Prestressed Walls
http://slidepdf.com/reader/full/phd-laursen-masonry-prestressed-walls 177/308
Rl6 SllrupE
Sl O
100
Plon
Vlcw
Foundolion
reinforcement
Plon
Vlew
Loqding
beom
reinf orcemeni
Elevolion
Floor
slob reinforcement
Fig.
7.4-Reinforcing
layout for RC elements
7.2.3
Material
properties
Average
masonry
material
properties
were determined
by
material testing,
typically in
samples
of
three. The
masonry crushing
strength
f'-,
masonry
elastic
modulus
E,o
(masonry:
600 mm
x
400
mm
x
140 mm
prism), grout
crushing
strength
f'r,
mortar crushing strength
fi
(gout
and
mortar:
200
mm high
"
100
mm diam. cylinder),
and average
age
at day
of testing are
given
in
Table 7.2. Average
strengths
of concrete
were 38
MPa for
foundation
and
l't floor slab and 49
MPa for
2nd
floor
slab and
loading
beam.
Seven-wire
prestressing
strand
of
the specification
'AS 13ll-1987, Super,
Low
Relaxation'
was
used
for
both
wall
tests. Nominal
properties
of
the 15.2
mm diam.
prestressing
stand were
@l
tl
-*Flg
t
40O LoD
o
o
c
oo
N
o
lD'12
O
l4O
opprox.
r
Plon
View
-151-
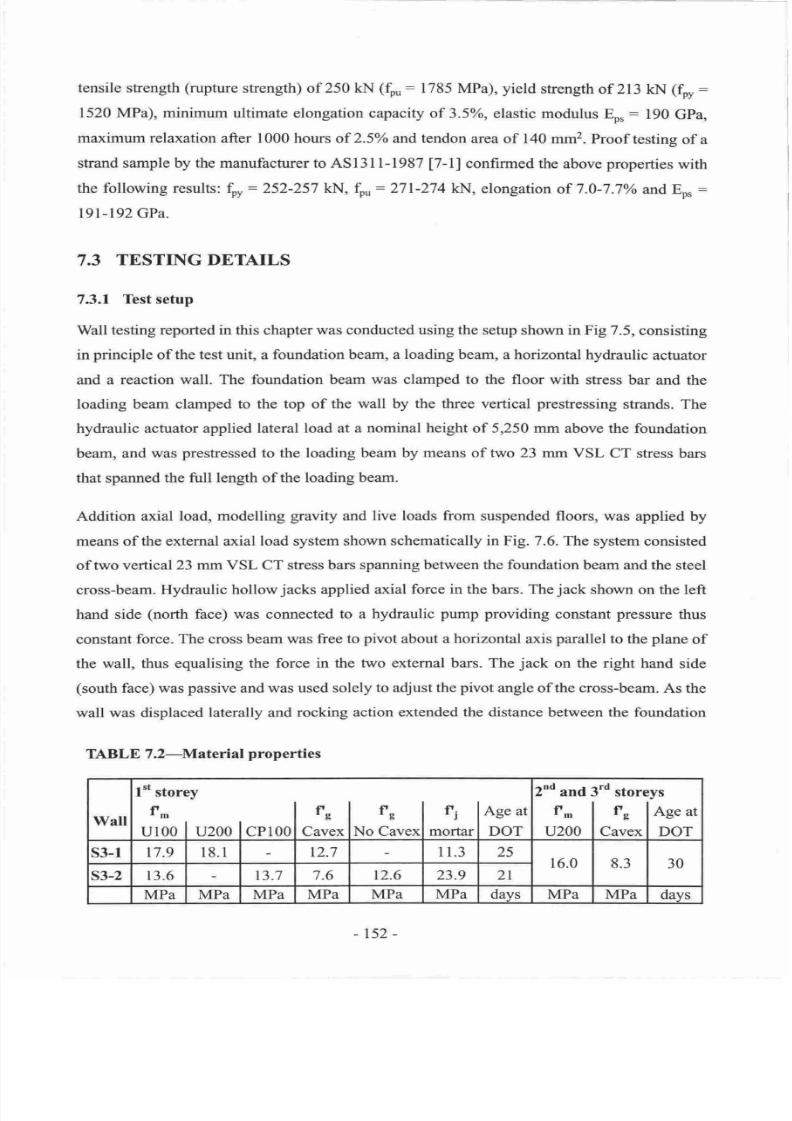
7/21/2019 PHD Laursen-masonry Prestressed Walls
http://slidepdf.com/reader/full/phd-laursen-masonry-prestressed-walls 178/308
tensile sffength
(rupture
strength)
of 250 klrf
(fpr:
1785 MPa),
yield
strength
of
213
kl.l
(f;r:
1520 MPa), minimum
ultimate
elongation
capacity
of
3.5Yo,
elastic modulus
Eo.:
190
GPa,
maximum relaxation after
1000 hours of
2.5%
and tendon
area
of
140 mm2.
Proof
testing
of a
strand sample
by
the manufacturer
to
ASl3l
l-1987
[7-l]
confirmed
the
above
properties
with
the following results:
fr,
=
252-257
kN,
fp -- 271-274
ld{,
elongation
of 7.0-7
.7%
and Eo.
:
l9l-192
GPa.
7.3
TESTING DETAILS
7.3.1
Test setup
Wall
testing reported
in
this chapter
was
conducted using the
setup
shown
in Fig
7.5,
consisting
in
principle
of the test unit,
a
foundation beam, a
loading
beam, a horizontal hydraulic
actuator
and a
reaction wall. The foundation
beam was clamped to the floor
with
stress bar
and the
loading beam clamped to the top
of
the
wall
by
the three
vertical
prestressing
strands.
The
hydraulic actuator applied
lateral load at a nominal
height
of
5,250 mm
above the
foundation
beam,
and was
prestressed
to
the
loading beam by means of two 23 mm
VSL CT
stress bars
that spanned
the full
length
of the
loading beam.
Addition axial
load,
modelling
gravity
and
live loads from
suspended floors,
was applied by
means of the external axial
load
system
shown schematically in Fig. 7.6. The
system consisted
of
trvo
vertical
23
mm VSL CT
stress
bars spanning
between the foundation
beam and the
steel
cross-beam.
Hydraulic hollow
jacks
applied
axial force in
the
bars. The
jack
shown
on the
left
hand side
(north
face) was connected
to a hydraulic
pump
providing
constant
pressure
thus
constant
force. The cross beam
was free to
pivot
about a horizontal
axis
parallel
to
the
plane
of
the
wall,
thus equalising
the force
in
the
two
external
bars.
The
jack
on the
right
hand
side
(south
face)
was
passive
and
was used solely
to
adjust
the
pivot
angle of the cross-beam.
As the
wall
was displaced
laterally and
rocking action
extended the distance
between the foundation
TABLE
7
.Z-Material
properties
Wall
I't
storey
fn,
uloo
I
uzoo
lcproo
fs
Cavex
fs
I
t,
lAee
at
No Cavexl
mortar
I
DOT
2nd
and
f-
u200
td
store
fsl
Cavex
I
ys
Age
at
DOT
s3-l
t7.9
18.I
t2.7
l
1.3 25
r6.0
8.3
30
s3-2
r3.6 t3.7
7.6
12.6 23.9
2l
MPa MPa MPa
MPa
MPa
MPa
davs
MPa MPa
days
-152-
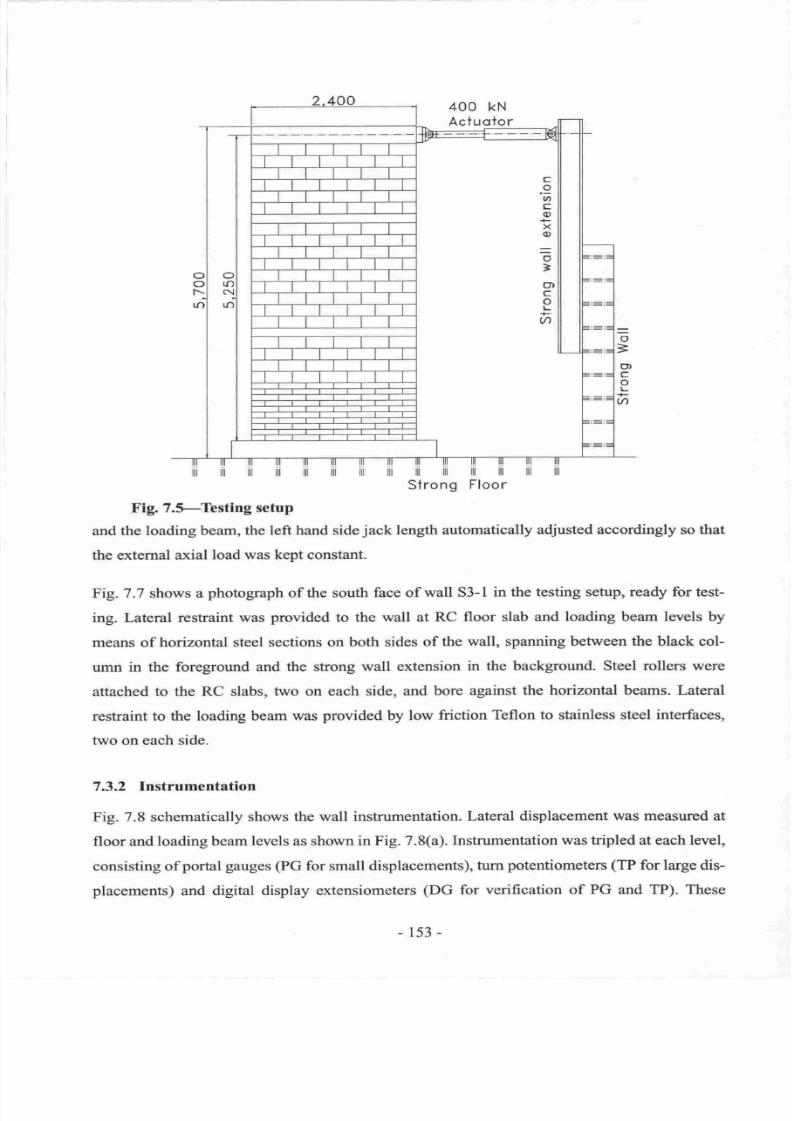
7/21/2019 PHD Laursen-masonry Prestressed Walls
http://slidepdf.com/reader/full/phd-laursen-masonry-prestressed-walls 179/308
400 kN
Actuotor
iiiiiiiiiiiiiiiiiiiiiiittiiiiiitiiiillllil
Strong
Floor
Fig.7. -Testing
setup
and the
loading beam,
the left hand side
jack
length automatically
adjusted accordingly so that
the external
axial
load was kept
constant.
Fig.
7 .7 shows a
photograph
of the south
face of
wall 33-
I
in
the
testing
setup, ready
for
test-
ing. Lateral
restraint was
provided
to the
wall
at
RC
floor
slab and loading beam levels by
means of horizontal
steel sections on both
sides of
the wall, spanning between
the
black col-
umn
in
the
foreground and
the
strong
wall
extension
in
the
background. Steel
rollers
were
attached
to
the RC slabs,
two
on
each
side, and
bore against
the horizontal beams. Lateral
restraint to
the loading beam
was
provided
by low
friction
Teflon to stainless
steel interfaces,
two on each side.
7,3.2
Instrumentation
Fig. 7.8 schematically
shows
the wall instnrmentation.
Lateral displacement was measured
at
floor and
loading beam
levels
as shown
in Fig. 7.8(a).
Instrumentation was
tripled
at each level,
consisting of
portal gauges
(PG
for small displacements),
turn
potentiometers
(TP
for large dis-
placements)
and digital display
extensiometers
(DG
for
verification
of
PG
and
TP). These
-153-
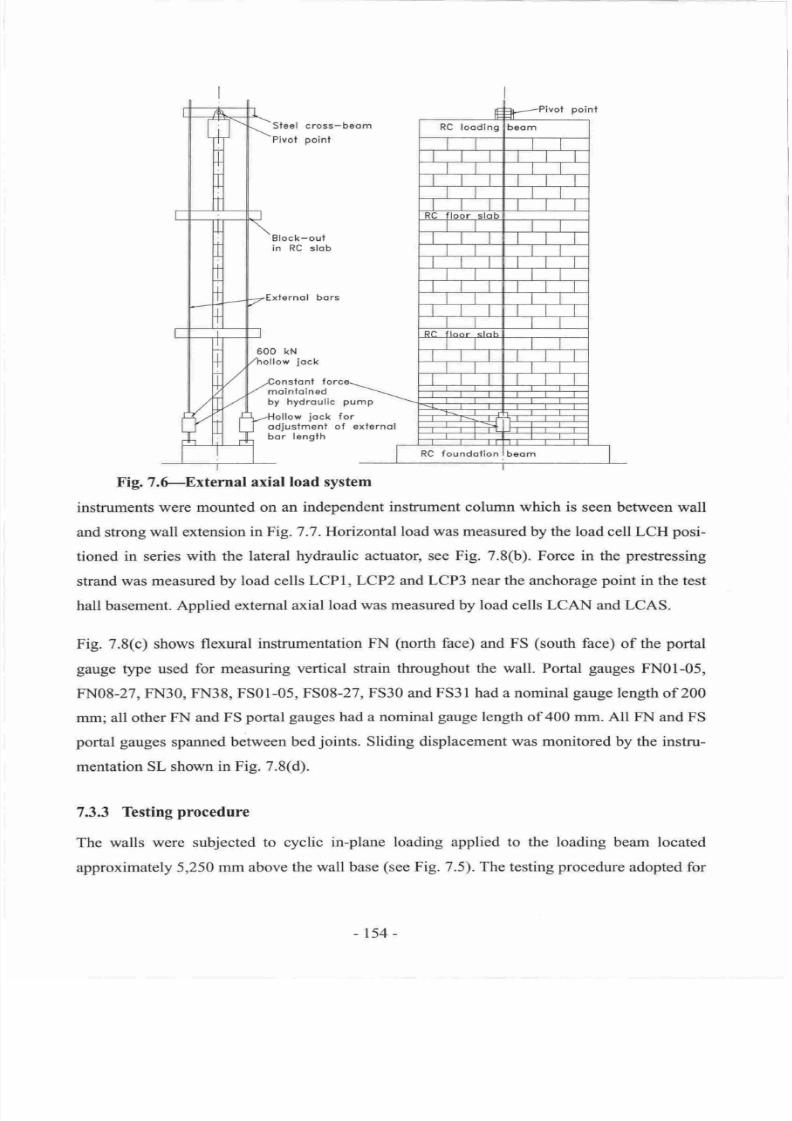
7/21/2019 PHD Laursen-masonry Prestressed Walls
http://slidepdf.com/reader/full/phd-laursen-masonry-prestressed-walls 180/308
Block-oul
in
RC slob
500
kN
llow
jock
sfonl
moinloined
by
hydroulic
odjuslmenl
bor
lenglh
Pump
for
of exlarnol
Fig.
7.6-External
axial
load
system
instnrments
were
mounted on an independent instrument column which is seen between
wall
and strong
wall
extension
in Fig.7.7. Horizontal
load was measured by the load
cell LCH
posi-
tioned
in
series with
the lateral hydraulic
actuator,
see
Fig. 7.8 b). Force
in
the
prestressing
strand was
measured by load cells
LCPl,LCP?
and LCP3
lear
the
anchorage
point
in the test
hall basement.
Applied extemal
axial
load
was
measured
by
load
cells
LCAN
and
LCAS.
Fig. 7.8 c) shows flexural
instrumentation
FN
north
face)
and
FS
south
face)
of
the
portal
gauge
type
used
for
measuring
vertical
strain throughout
the
wall.
Portal
gauges
FN0l-05,
FN08-27, FN30, FN38,
FS01-05,
FS08-27,
FS30 and FS31 had
a
nominal
gauge
length
of 200
mm; all other
FN
and FS
portal gauges
had a nominal
gauge
length of 400 mm,
All
FN
and FS
portal gauges
spanned between
bed
joints.
Sliding
displacement was
monitored by
the
instru-
mentation
SL
shown
in Fig. 7.8 d).
7.3.3
Testing
procedure
The walls
were subjected
to
cyclic
in-plane
loading
applied
to
the
loading
beam located
approximately
5,250 mm above
the
wall
base
see
Fig. 7.5). The testing
procedure
adopted
for
-t54-
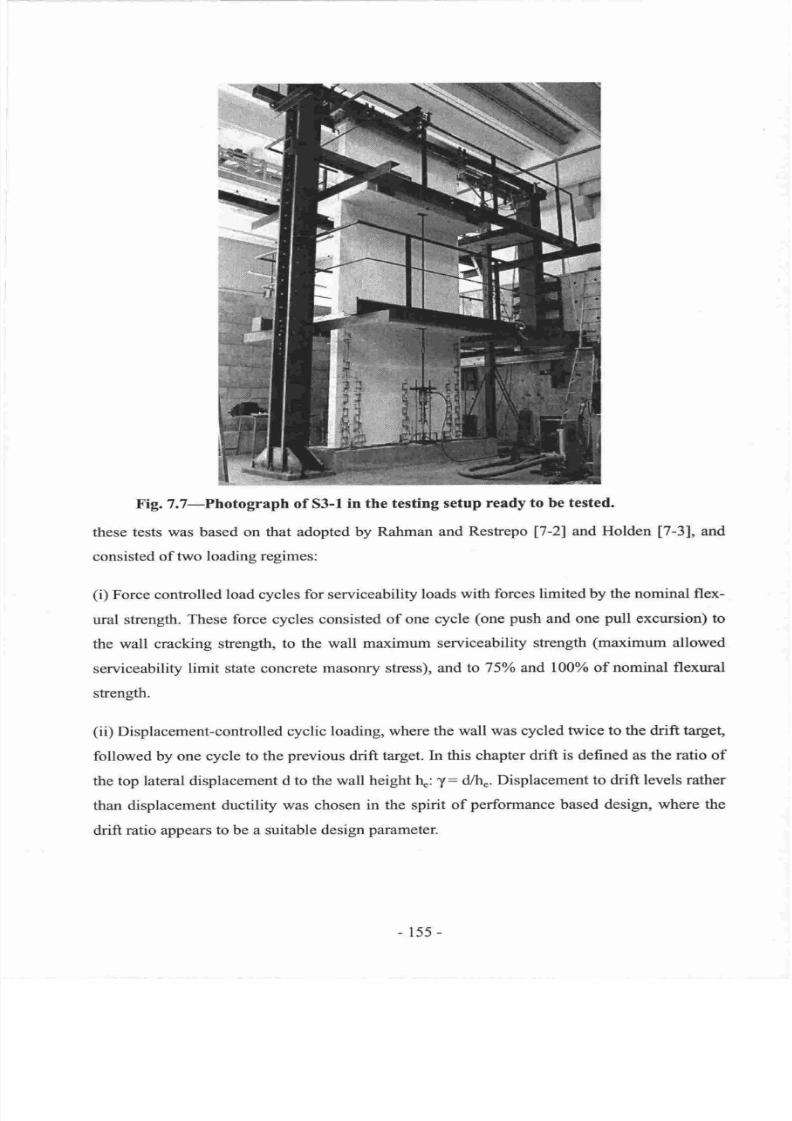
7/21/2019 PHD Laursen-masonry Prestressed Walls
http://slidepdf.com/reader/full/phd-laursen-masonry-prestressed-walls 181/308
Fig.7.7-Photograph
of
S3-1
in
the
testing setup ready
to
be
tested.
these tests was based
on that
adopted
by Rahman
and
Restepo
17-21and
Holden
[7-3],
and
consisted
of
t'wo loading regimes:
(i)
Force controlled
load
cycles
for serviceability
loads
with forces limited by the nominal flex-
ural
strength.
These
force cycles consisted
of
one cycle
(one
push
and
one
pull
excursion) to
the
wall
cracking strength,
to
the
wall
maximum
serviceability
strength
(maximum
allowed
serviceability
limit
state concrete masonry stress), and
to
75%
and 100%
of
nominal
flexural
strength.
(ii)
Displacement-controlled cyclic
loading,
where the
wall was cycled
twice
to
the
drift
target,
followed by one
cycle to the
previous
drift
target. ln
this
chapter drift
is defined
as
the ratio
of
the top lateral displacement
d to the
wall height
4:
y:
d/h .
Displacement
to
drift levels rather
than displacement
ductility
was chosen
in the spirit
of
performance
based
design, where
the
drift
ratio
appears
to
be a
suitable design
parameter.
-155-
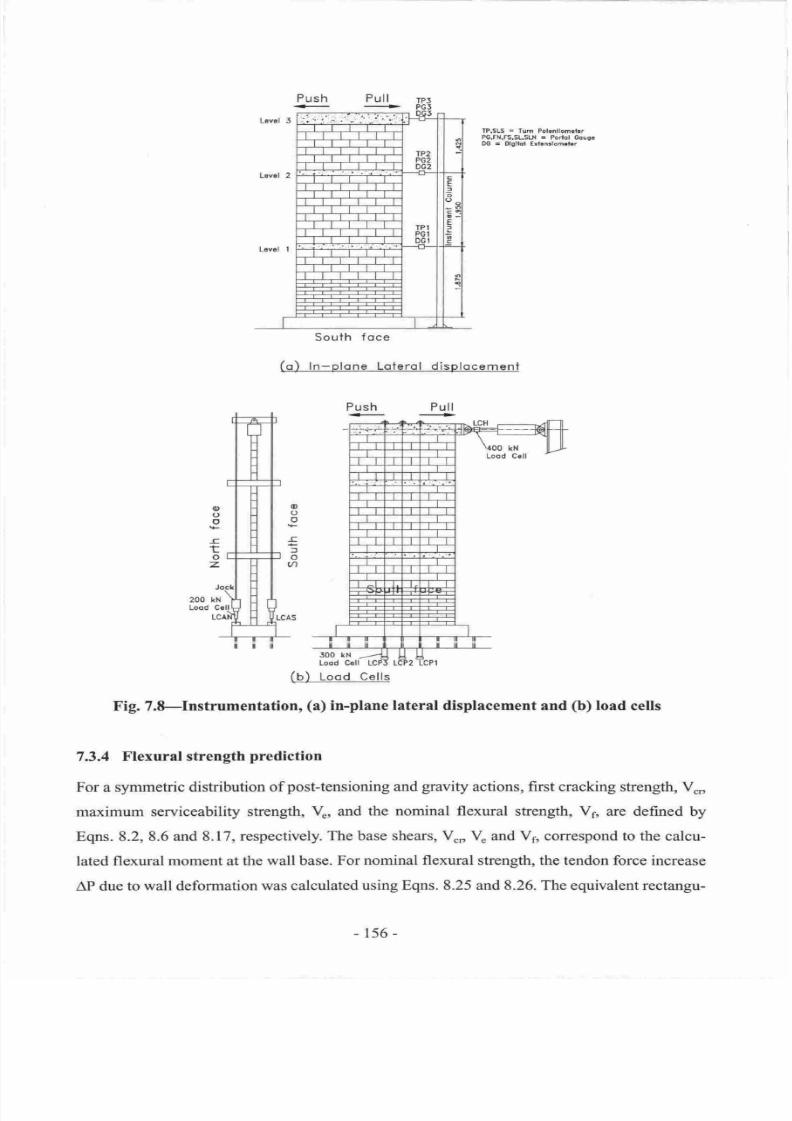
7/21/2019 PHD Laursen-masonry Prestressed Walls
http://slidepdf.com/reader/full/phd-laursen-masonry-prestressed-walls 182/308
TP,SLS
=
Tum
Pol.nllom 1.,
PG.FI{,6.S1-SLI{
-
Porlol
Goug.
OC
.
olgBcl Erl ndom|.r
(o)
In-plone Loterol
displqcemeni
Push
Pull
+ +
(b)
Lood
Cells
Fig.
7.8-Instrumentation,
(a)
in-plane lateral displacement and
(b)
load
cells
7.3.4
Flexural strength
prediction
For a
symmetric
distribution
of
post-tensioning
and
gravity
actions, first cracking
strength, V",,
maximum
serviceability strength,
%,
and
the nominal flexural
strength, V6,
ore defined by
Eqns. 8.2, 8.6 and 8.17, respectively. The
base shears,
V",
V*
and Vs,
correspond
to
the
calcu-
lated flexural
moment at
the wall base.
For nominal flexural strength, the tendon
force increase
AP due
to wall
deformation
was
calculated using
Eqns. 8.25 and 8.26.
The equivalent rectangu-
South
foce
o
o
.c
l
o
UI
o
C'
o
5
o
z.
156
-
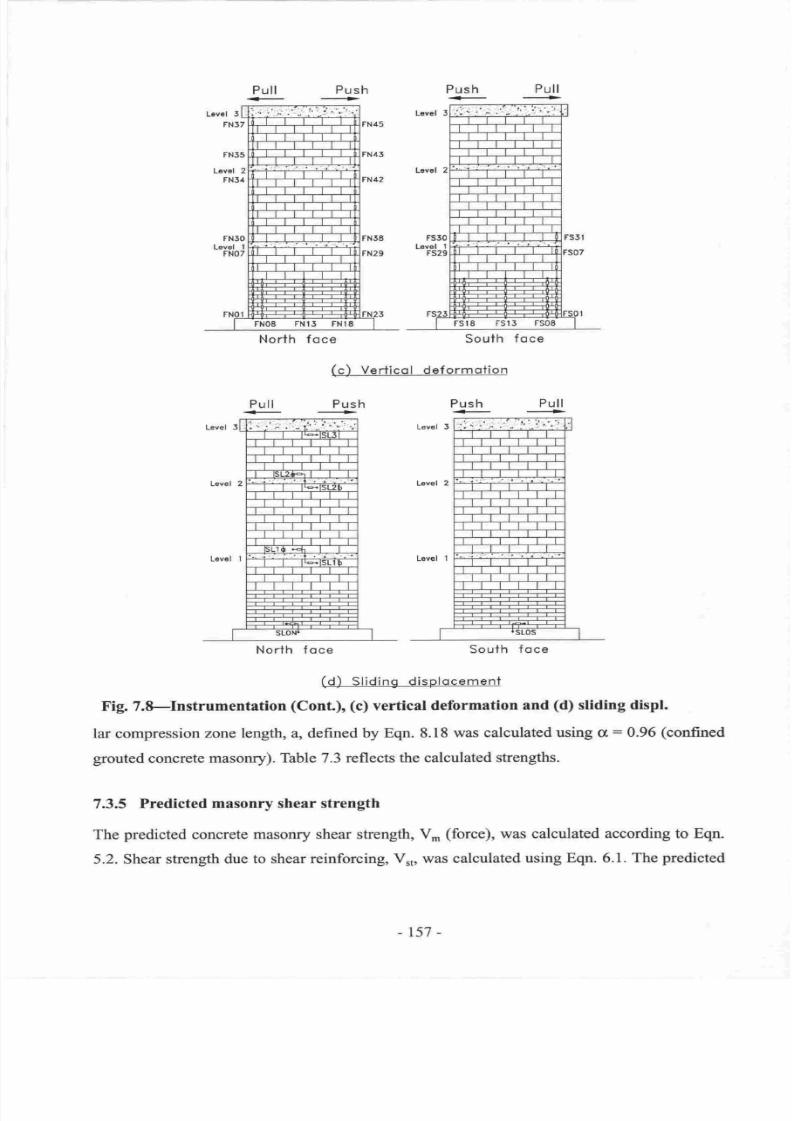
7/21/2019 PHD Laursen-masonry Prestressed Walls
http://slidepdf.com/reader/full/phd-laursen-masonry-prestressed-walls 183/308
Lcvrl
5
Pull
+.
Push
+
Push
Norlh
foce
(c)
Verticol deformotion
Push
(d)
Sliding displocement
Fig.7. -Instrumentation
(Cont.),
(c)
vertical
deformation
and
(d)
sliding displ.
lar
compression
zone
length, a, defined by Eqn. 8.18
was calculated using cr:
0.96
(confined
grouted
concrete
masonry). Table 7.3
reflects the calculated
strengths.
7.3.5
Predicted
masonry shear strength
The predicted
concrete masonry shear strength, V,,,
(force),
was
calculated according
to
Eqn.
5.2. Shear strength
due to shear reinforcing,
Vr,, was
calculated
using
Eqn. 6.1. The
predicted
Push
+
Pull
+
South
foce
North f
oce
Pull
+
South
foce
-t57-
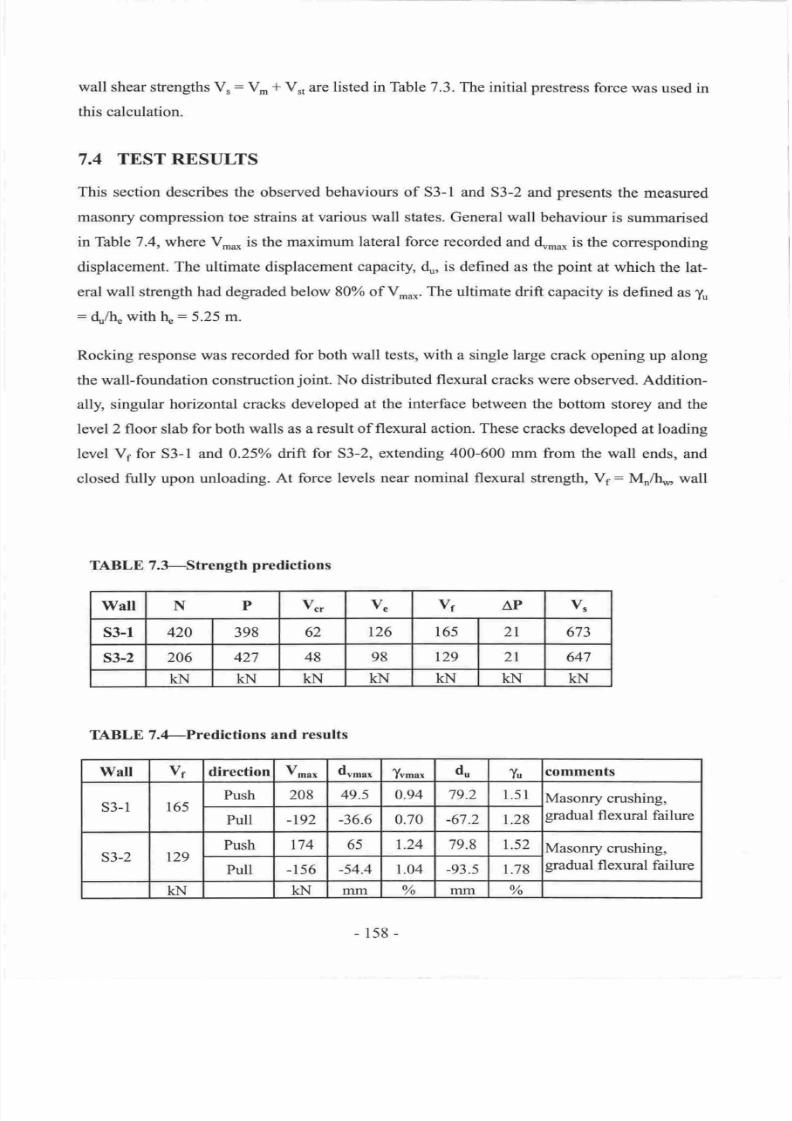
7/21/2019 PHD Laursen-masonry Prestressed Walls
http://slidepdf.com/reader/full/phd-laursen-masonry-prestressed-walls 184/308
wall
shear strengths V,:
V^
*
V,,
are
listed in Table
7.3.
The
initial
prestress
force
was used in
this calculation.
7.4
TEST RESULTS
This section describes the
observed
behaviours of S3-l
and S3-2 and
presents
the
measured
masonry compression toe
stains
at various
wall
states. General
wall
behaviour
is summarised
in
Thble 7.4, where
V,n*
is the maximum
lateral force
recorded
and du.u* is
the
corresponding
displacement. The ultimate displacement
capacity, d , is
defined as the
point
at which the
lat-
eral
wall
strength
had
degraded
below 80% of
Vn., ,..
The ultimate
drift capacity is defined
as
yu
=
4/h
with tq
:5.25
m.
Rocking
response
was recorded
for both
wall
tests,
with
a single
large
crack opening
up along
the wall-foundation construction
joint.
No
distributed flexural cracks were
observed.
Addition-
ally, singular horizontal cracks
developed
at the interface between
the bottom
storey and the
level2 floor
slab
for
both
walls
as a result
of flexural action. These cracks
developed at loading
level Vs
for S3-l
and 0.25%
drift
for
S3-2,
extending 400-600 mm
from the
wall
ends, and
closed
fully
upon unloading.
At
force levels near
nominal
flexural strength,
Vs: Mo/h*
wall
TABLE
7.3-Strength
predictions
IABLE 7.4-Predictions
and results
\ilall N
P
v ,
%
vf
AP
%
s3-1 420 398 62
r26 165 2l
673
s3-2
206
427
48 98
t29 2l
647
KN
KN
KN KN KN KN KN
Wall
vf
direction
Vt * d . *
T . t
du
Y
comments
s3-l
r65
Push
208 49.5 0.94 79.2 l.5l
Masonry crushing,
gradual
flexural
failure
Pull
-t92
-36.6
0.70
-67.2
1.28
s3-2
r29
Push
t74 65
1.24 79.8 1.52
Masonry crushing,
gradual
flexural failure
Pull
-156
-54.4
1.04
-93.s
1.78
KN
KN fitm
o/o
mm
%
-158-
7/21/2019 PHD Laursen-masonry Prestressed Walls
http://slidepdf.com/reader/full/phd-laursen-masonry-prestressed-walls 185/308
softening
occurred
due
to
extensive
opening
of
the
base
crack and the
initiation
of
rocking.
Tendon
yielding
was
not experienced.
The failure
mode
was characterised
by
localised
masonry
crushing
in
the
compression
toe
regions,
resulting
in
gradual
strength degradation.
Visual
inspection showed
that using CPl00,
inelastic vertical
masoffy
strain
had
penetrated
into
the third course
above
the foundation
(0-
300
mm).
The cycles
to
drifts
of
0.25
to
0.5oh
revealed
little
evidence
of
distress
of
the
masonry
compression
zones. First
visual indication
of
fine
vertical
splitting cracks in the
face
shells
of
the first masonry
course was
observed
at
0.5
drift.
During
cycles
to drifts of
0.75o/o
and
1.0 some
spalling
of
mortar
in
the
lower bed
joints
was obseryed
and
vertical
cracks
occurred
in
the masonry face
shell at each
wall end
in the first course
(100
mm). No strenglh
degradation
was observed
at
this
stage.
Negligible
sliding
displacements
were measured and
there
was
no
indication of friction created
by the
lateral restraint
devices
due to out-of-plane
wall displacement.
7.4.1
Force-displacement
response
Fig.7.9, depicting
the force-displacement
response
for 53-1 and S3-2, demonstrates
the
nearly
non-linear
elastic behaviour
exhibited
by the
tested unbonded
post-tensioned
walls
prior
to toe
crushing.
It is seen
that the
walls
returned
to their original
alignment,
even after large displace-
ment excursions.
This
type of
response may be categorised
as 'origin oriented'.
The individual
curves
for each excursion
appear
pinched,
implying
little
hysteretic energy
dissipation.
It
is
noted that
the term 'elastic'
in a
rigorous sense indicates
reversibility and
no
accumulation of
damage.
In reality
the walls did accumulate
damage
from the onset of
masonry crushing, caus-
ing
a
reduction
in
wall stiffiress and
some hysteretic
energy dissipation.
Thus the behaviour
was temred
'nearly'
non-linear elastic.
Significant
strength
degradation
for
both
walls occurred
in the first
excursion
cycle
to
+I.5o/o
drift.
With the
intent
of
displacing S3-2
to
-l.SYo
drift,
the
wall was accidentally
displaced
much further
to
-z.l o drift, resulting in extensive
crushing
of the compression
zone and subse-
quent
severe strength
loss for the
pull
direction.
Notably, neither
wall
exhibited symmetrical
response
in
the push
and
pull
directions,
with
the
maximum
push
strength
being 8-10
higher
than
the maximum
pull
strength.
This
discrep-
ancy
was
recorded despite
symmetric strengthening
of the
wall
comers
as
indicatednFig.T.2.
-159-
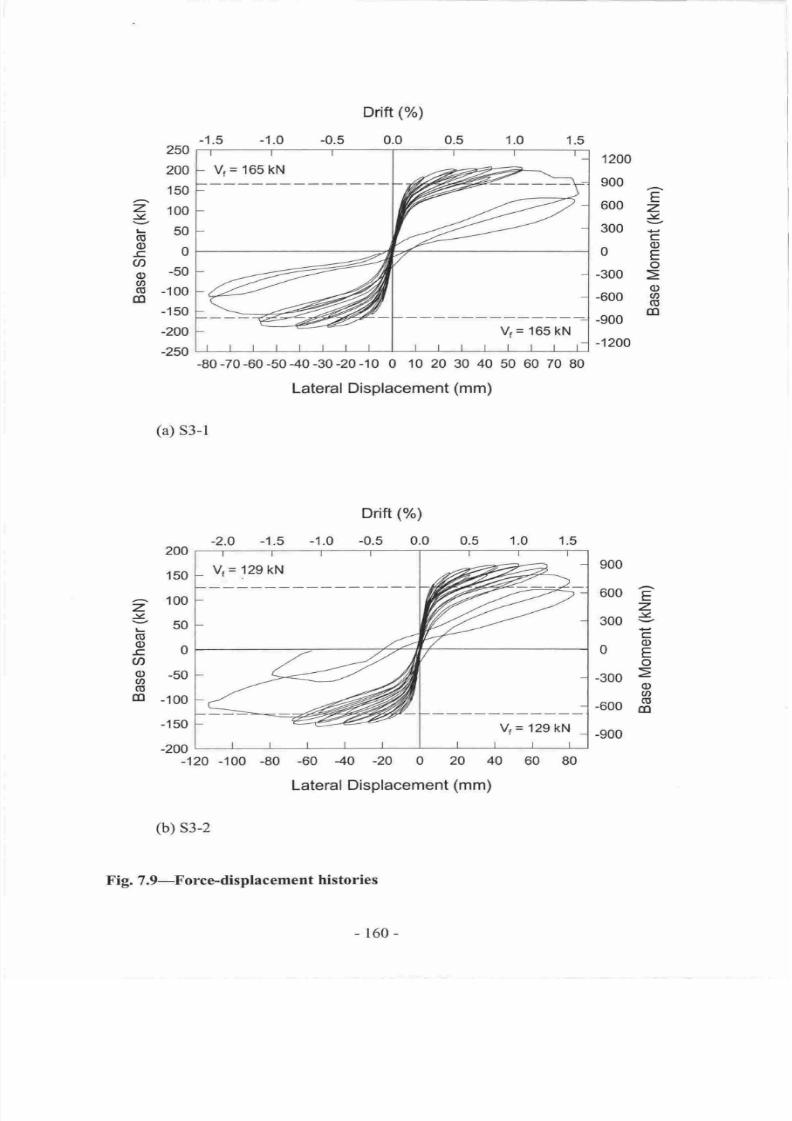
7/21/2019 PHD Laursen-masonry Prestressed Walls
http://slidepdf.com/reader/full/phd-laursen-masonry-prestressed-walls 186/308
E
z
c
o
E
o
o
@
(g
co
z
v
o
o
.c.
U)
o
tl,
G
dl
250
200
150
100
50
0
-50
-100
-150
-200
-250
-80-70-60-5040-30-20-10
0 10 20 30
40
50 60 70
80
Lateral
Displacement
(mm)
(a)
S3-l
1200
900
600
300
0
-300
-600
-900
-1200
Drift
(%)
-0.5
0.0 1.5.0
2.O
-1.5
200
150
100
50
0
-50
-100
-150
-200
-120
-100
(b) s3-2
Fig.
7.9-Force.displacement
histories
-80
-60
-40
-20
0 20
40
60 80
Lateral Displacement
(mm)
600
e
z
300
5
c
og
o
-3oo
=
(t)
-600
s
-900
z
.Y
G
o
-g
U)
o
U'
o
(n
V=165kN
V.
=
165 kN
V
=
129 kttl
V=129kN
-160-
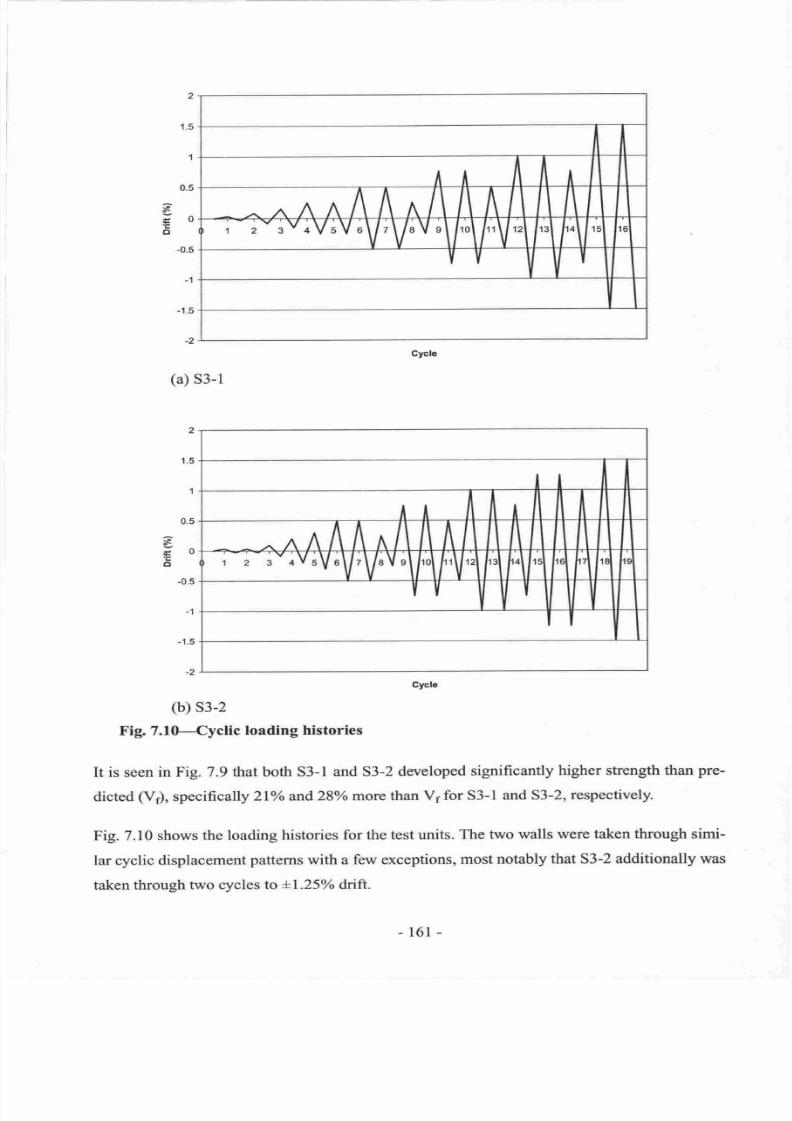
7/21/2019 PHD Laursen-masonry Prestressed Walls
http://slidepdf.com/reader/full/phd-laursen-masonry-prestressed-walls 187/308
(a)
S3-l
2
1.5
I
0.5
s
;o
o
-0.5
-1
-1.5
-2
2
1.5
,|
0.5
:g
Eo
o
-0.5
-1
-1.5
-2
(b)
s3-2
Fig. 7.I0-Cyclic
loading
histories
It
is
seen
in
Fig. 7.9 that
both
S3-l
and S3-2
developed
significantly
higher
strength than
pre-
dicted
(V1),
specifi
cally
2lVo
and.28o/o
more than
Vl for S3-l
and S3-2,
respectively.
Fig.
7.10
shows
the
loading
histories
for
the test
units.
The
two walls
were taken
through
simi-
lar cyclic
displacement
patterns
with
a few
exceptions,
most
notably
that S3-2 additionally was
taken
through
two cycles to
+1.25
drift.
ll
tt
I
,n AA/\/\
A/
/\ A/ t\t
1 2
.-oVuVu
/'V'v'
,'\l,v',
'1
It
'1
1t
It
IY
I
tl
Cyclo
,1
i
I
nA^/\/\^
/\ A
I/
',- r- rvoVrVt\/t\/eVs
',\
/,,\
't2
'ol
r6
YY
I
Cycle
-16l-
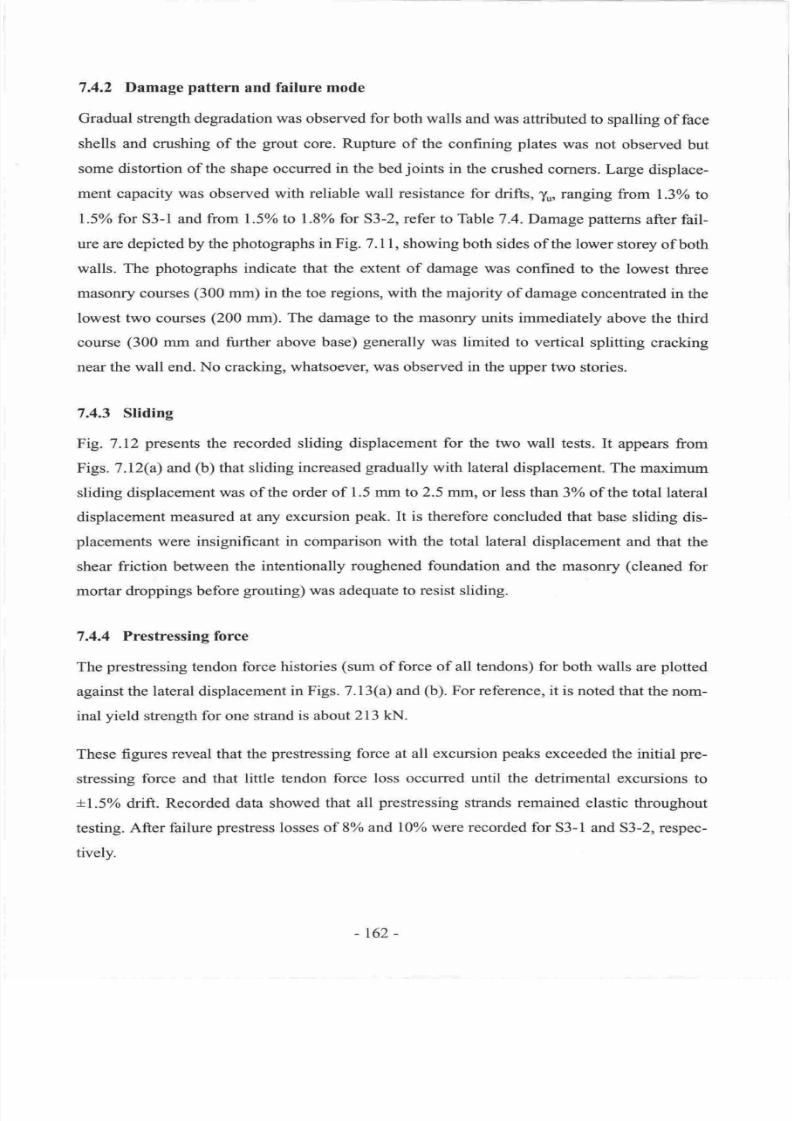
7/21/2019 PHD Laursen-masonry Prestressed Walls
http://slidepdf.com/reader/full/phd-laursen-masonry-prestressed-walls 188/308
7.4.2
Damage
pattern
and
failure
mode
Gradual strength degradation was
observed
for
both walls and was
atfibuted to
spalling
of
face
shells and crushing
of
the
grout
core. Rupture
of
the
confining
plates
was
not observed
but
some
distortion
of
the
shape
occurred
in
the
bed
joints
in
the crushed comers. Large displace-
ment capacity was observed with reliable wall resistance for
drifts,
yu,
ranging
from
1.3
to
l.5o/o for
S3-l
and
from
I .5 oto l.8Vo
for
S3-2, refer to Thble
7.4.Damage
patterns
after
fail-
ure are depicted by the
photographs
in Fig. 7.1 1, showing
both sides of the
lower storey
of
both
walls. The
photographs
indicate that
the extent
of
damage was confined
to
the
lowest
three
masonry courses
(300
mm) in the
toe regions,
with
the
majority
of damage
concentrated
in the
lowest two courses
(200
mm). The
damage
to the masonry
units immediately
above the
third
course
(300
mm and
further
above base)
generally
was
limited to vertical
splitting
cracking
near
the
wall end. No
cracking,
whatsoever,
was
observed in the
upper two stories.
7.4.3 Sliding
Fig.
7.12
presents
the
recorded sliding
displacement
for
the
two wall
tests.
It
appears
from
Figs. 7.12(a) and
(b)
that
sliding
increased
gradually
with
lateral
displacement. The
maximum
sliding
displacement
was of the order
of
1.5
mm to 2.5 mm,
or less than
3
of
the
total
lateral
displacement
measured at any
excursion
peak.
It
is therefore concluded
that
base
sliding dis-
placements
were
insignificant
in
comparison
with the total lateral
displacement
and that the
shear
friction
between
the
intentionally roughened foundation and the masonry
(cleaned
for
mortar droppings before
grouting)
was adequate
to resist
sliding.
7.4.4
Prestressing force
The prestressing tendon
force histories
(sum
of
force
of all
tendons)
for
both walls
are
plotted
against
the lateral displacement
in Figs- 7-13(a)
and
ft).
For reference,
it
is noted
that the
nom-
inal
yield
strength
for
one strand
is
about 213 kN.
These figures reveal that
the
prestressing
force
at all excursion
peaks
exceeded the initial
pre-
stressing
force and
that little tendon
force
loss occured until
the
detrimental
excursions to
*I.5o/o
drift.
Recorded data
showed that
all
prestressing
strands remained
elastic throughout
testing.
After
failure
prestress losses
of
8o/o
and
l0
were recorded
for
S3-1 and S3-2,
respec-
tivelv.
162
-
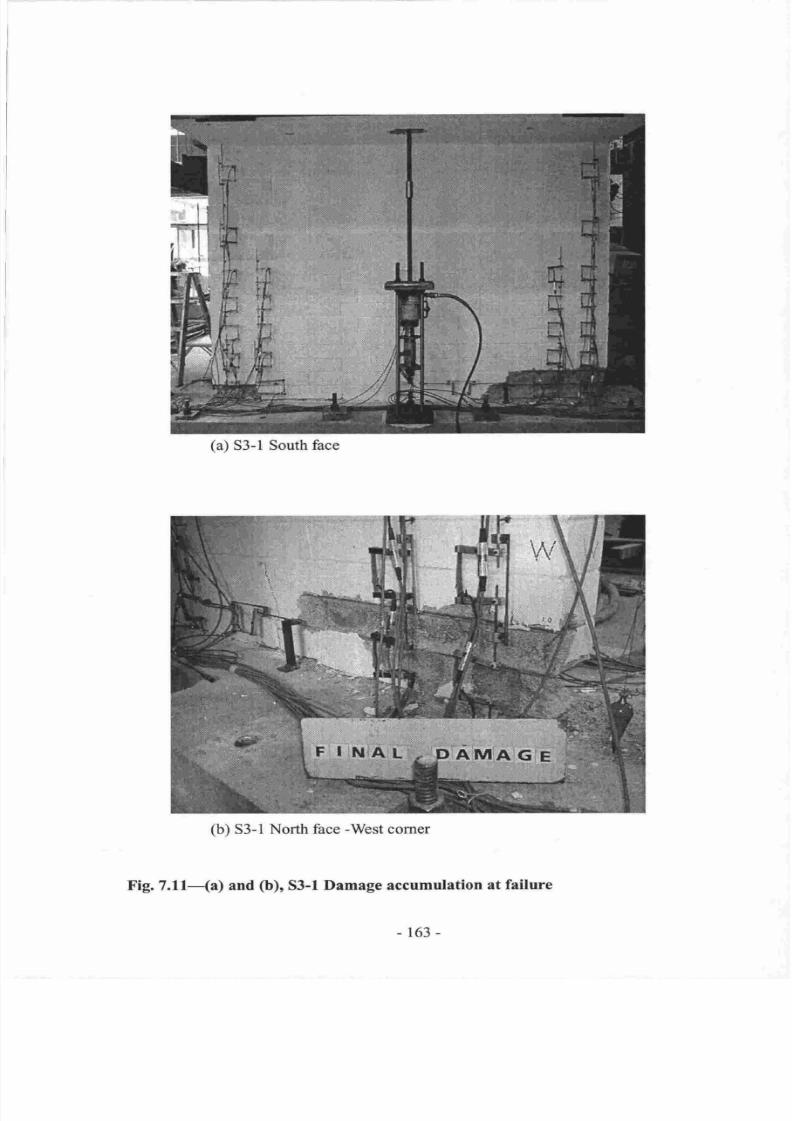
7/21/2019 PHD Laursen-masonry Prestressed Walls
http://slidepdf.com/reader/full/phd-laursen-masonry-prestressed-walls 189/308
a)
S3-l
Southface
b)
S3-1
North
face -West
comer
Fig.
7.f
f{a) and
O),
S3-1
Damage
accumulation
at
failure
-163-
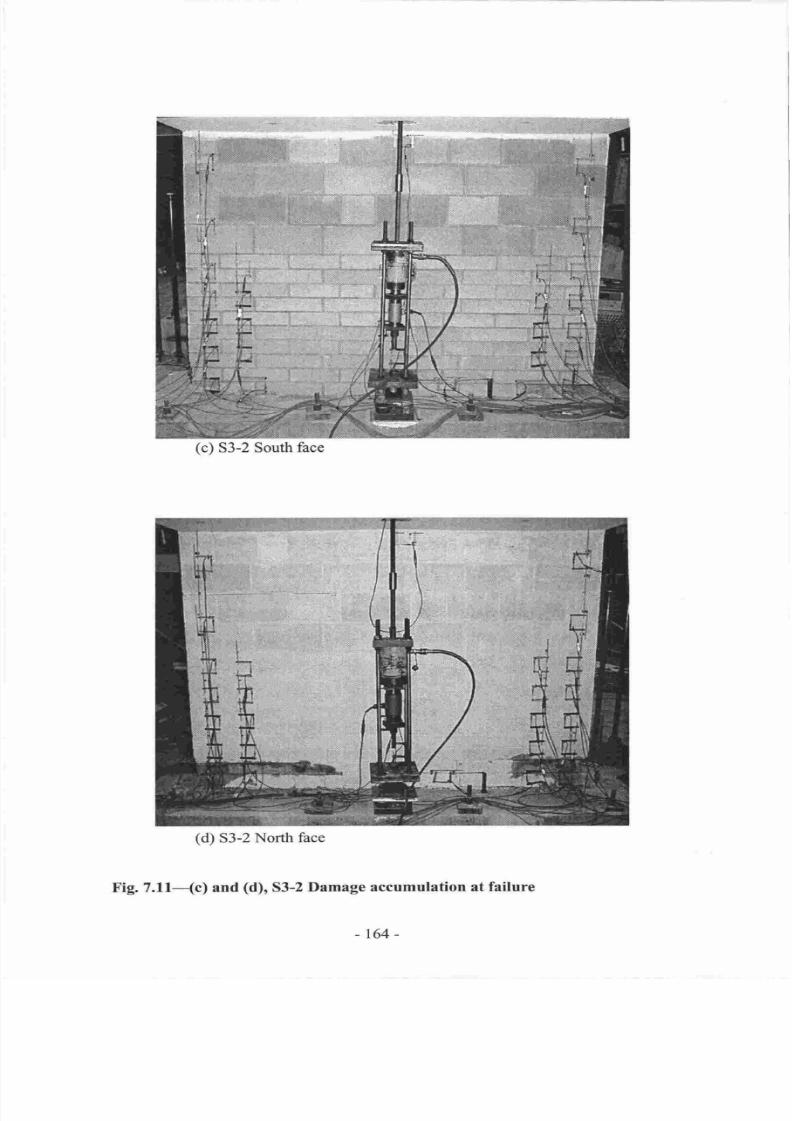
7/21/2019 PHD Laursen-masonry Prestressed Walls
http://slidepdf.com/reader/full/phd-laursen-masonry-prestressed-walls 190/308
(c)
S3-2 South
face
i
I
i -
|
Fig. 7.11-(c)
and
(d),
S3-2
Damage
accumulation at
lailure
(d)
53-2
North
face
-164-
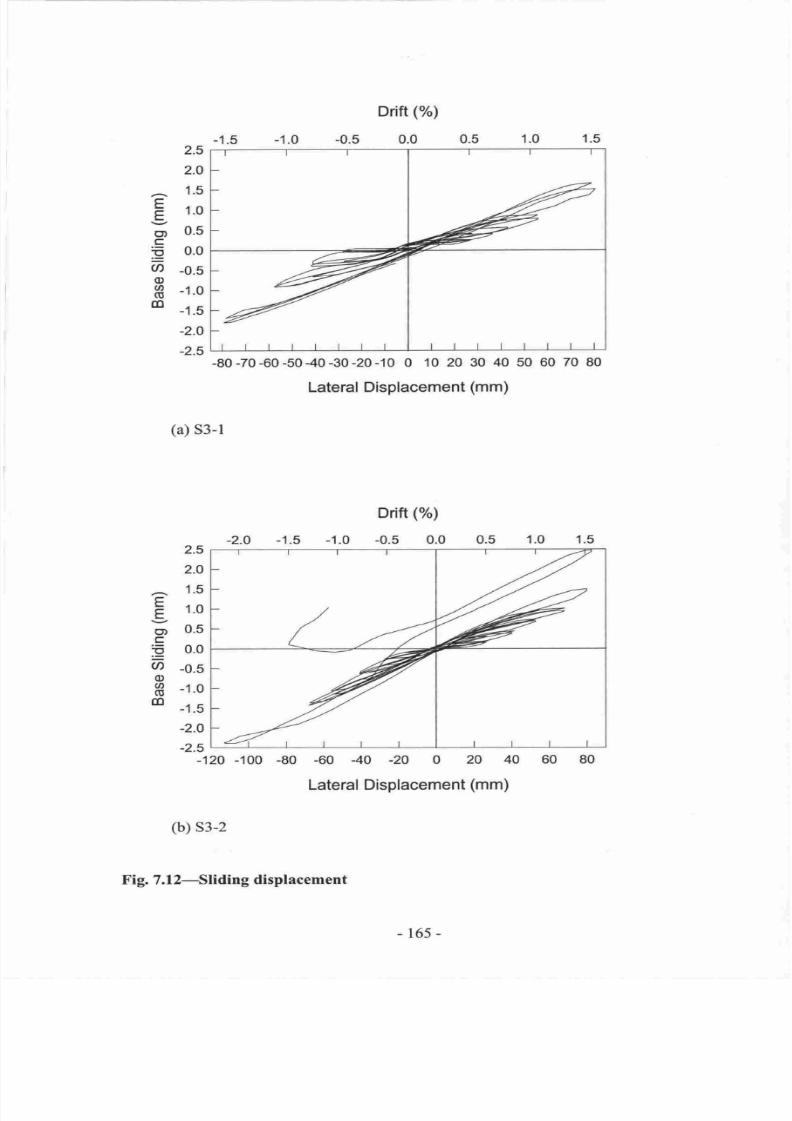
7/21/2019 PHD Laursen-masonry Prestressed Walls
http://slidepdf.com/reader/full/phd-laursen-masonry-prestressed-walls 191/308
1.5
.0
1.0
1.5
Drift
( )
-0.5
0.0
Lateral Displacement
(mm)
Drift
( )
-2.O
-1.5
-1.0 -0.5 0.0
E
E
g)
.E
p
U'
o
(D
(E
m
2.5
2.0
1.5
1.0
0.5
0.0
-0.5
-1.0
-1.5
-2.O
-2.5
(a)
S3-1
1.5
.0
2.5
2.O
1.5
1.0
0.5
0.0
-0.5
-1.0
-1.5
-2.O
-2.5
-'120
-100
(b)
s3-2
Fig.
7.l2-Sliding displacement
-80
-60
-40
-20
0
20 40 60
80
Lateral Displacement
(mm)
E
E
o)
.c
p
@
o
o
(u
dl
-80-70-60-50-40-30-20-10
0
10 20 30
40 50 60
70
80
-165-
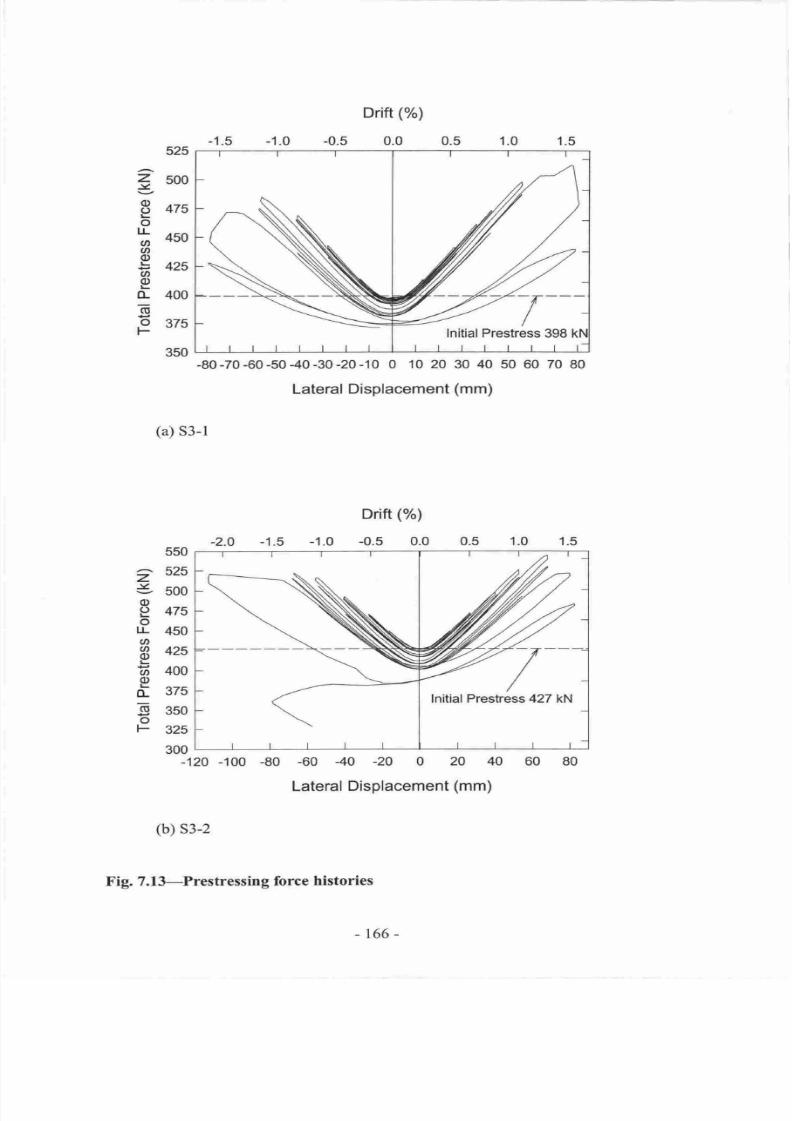
7/21/2019 PHD Laursen-masonry Prestressed Walls
http://slidepdf.com/reader/full/phd-laursen-masonry-prestressed-walls 192/308
z
L
o
I
o
II
o
(r,
o
o
E
(L
6
o
F
525
s00
475
450
425
400
375
350
-80-70-60-5040-30-20-10
0 10 20
30
40
50
60
70
80
Lateral
Displacement
(mm)
(a)
S3-l
Drift
( )
-1.5
-1.0 -0.5
0.0
0.5
-80
-60
40 -20
0 20 40 60
Lateral
Displacement
(mm)
550
[
525
[l
500
[
475
4
450
r
425
r
400
I
375
l-
350
[
325
[
300
L-
-120
z
-g
o
e
o
ll-
(t,
@
E
a
E
TL
(E
o
F
-100
(b) s3-2
Fig.
7.l3-Prestressing
force histories
InitialPrestress
398
lnitial Prestress
427
kN
-166-
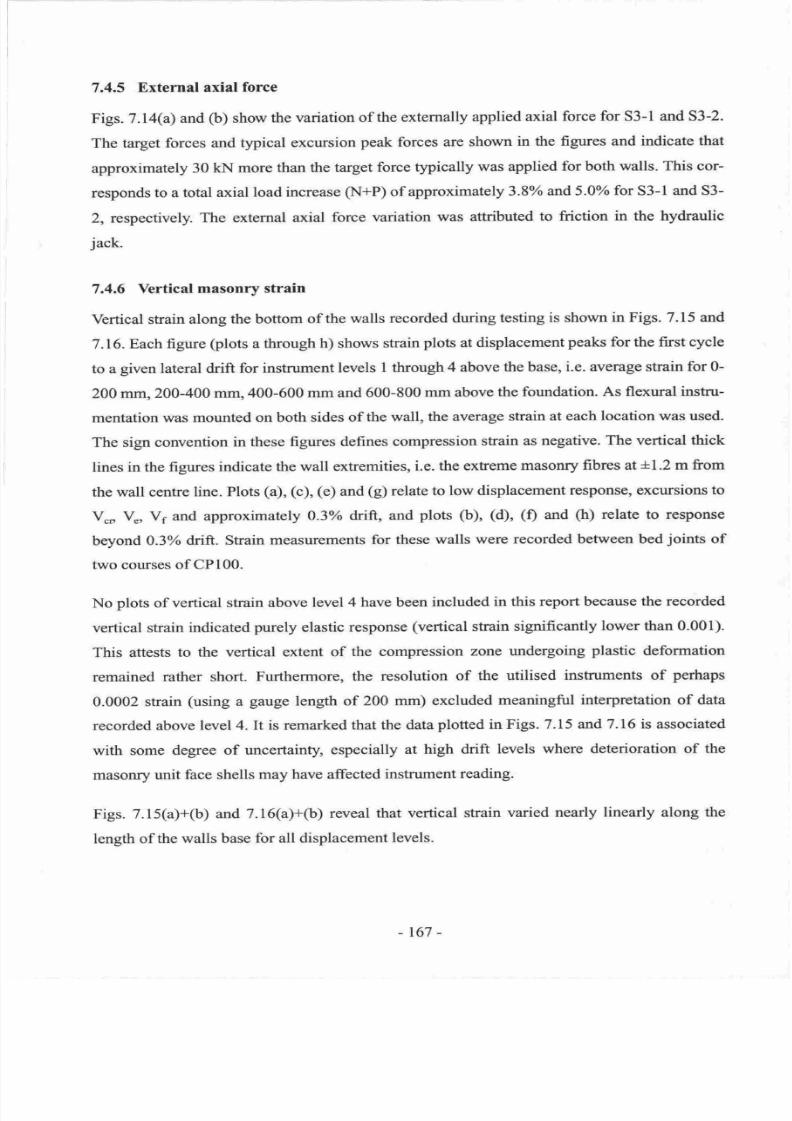
7/21/2019 PHD Laursen-masonry Prestressed Walls
http://slidepdf.com/reader/full/phd-laursen-masonry-prestressed-walls 193/308
7.4.5
External axial
force
Figs.
7.14(a)
and
(b)
show
the
variation of
the externally
applied
axial force
for S3-l and S3-2.
The
target forces
and typical
excursion
peak
forces
are
shown
in the figures
and indicate
that
approximately
30
kN
more than the target force
typically
was applied
for both walls. This cor-
responds
to
a
total
axial
load increase
(N+P)
of approximately
3.8%o and
5.0%
for
S3-l
and 53-
2, respectively.
The external
axial
force
variation
was attributed
to
friction
in
the
hydraulic
jack.
7.4.6
Vertical
masonry
strain
Vertical sffain along
the bottom
of
the walls
recorded
during
testing
is shown
in Figs. 7.15
and
7.16.
Each
figure
(plots
a
through
h) shows
strain
plots
at
displacement
peaks
for the first cycle
to
a
given
lateral drift for
instrument
levels
1
through
4 above the
base,
i.e. average strain for 0-
200
mm,200-400
mm,400-600
mm
and 600-800
mm above
the
foundation.
As flexural instnr-
mentation
was mounted
on both sides
of the
wall,
the average
strain at
each
location
was used.
The
sign convention
in
these figures
defines compression
strain as negative.
The
vertical
thick
lines in the figures
indicate the
wall extremities,
i.e.
the
exteme
masonry
fibres at+1.2 m from
the
wall
centre
line. Plots
(a), (c), (e)
and
(g)
relate
to
low displacement
response, excursions
to
V o
V , Vs and approximately
0.3o/o
drift,
and
plots
(b), (d),
(0
and
(h)
relate
to
response
beyond
0.3%
drift.
Strain
measurements
for
these walls
were recorded between bed
joints
of
two courses of
CPl00.
No
plots
of
vertical strain
above
level 4 have
been
included
in this report because
the recorded
vertical strain
indicated
purely
elastic
response
(vertical
strain
significantly
lower
than 0.001).
This attests
to the
vertical extent
of
the compression
zone undergoing
plastic
deformation
remained
rather short.
Furthermore,
the
resolution
of
the utilised
instruments
of
perhaps
0.0002
strain
(using
a
gauge
length of
200
mm)
excluded
meaningful
interpretation
of
data
recorded above
level4.
It is remarked
that the data
plotted
in
Figs. 7.15 and
7.16 is
associated
with
some degree
of
uncertainty, especially
at high
drift
levels where
deterioration
of
the
masoffy
unit
face shells may
have affected instrument
reading.
Figs. 7.15(a)+(b)
and 7.16(a)+(b)
reveal
that vertical
strain
varied nearly
linearly
along
the
length of
the
walls
base
for
all
displacement levels.
-167-
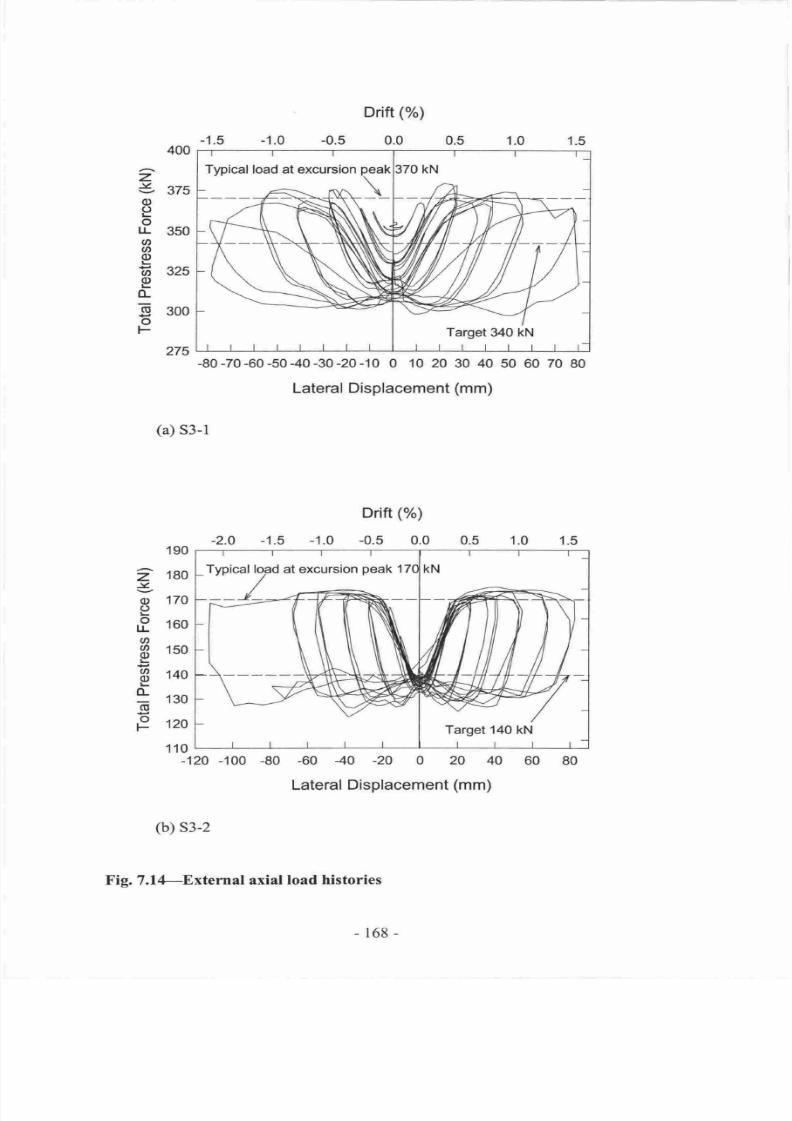
7/21/2019 PHD Laursen-masonry Prestressed Walls
http://slidepdf.com/reader/full/phd-laursen-masonry-prestressed-walls 194/308
Typical
load at
excursion
peak
z
J
o
g
o
lr
@
(r,
E
a
E
[L
E
o
400
375
350
325
300
275
-80-70-60-5040-30-20-10
0
10 20 30 40 50
60 70 80
Lateral
Displacement
(mm)
(a)
S3-l
Drift
( )
-2.0 -1.5
-1.0
-0.5
0.0
190
180
170
160
150
140
130
120
110
-120
-100
-80
-60
-40
-20
0 20 40
60
Lateral
Displacement
(mm)
1.5
.0
z
.V
o
e
o
TL
o
a
E
U,
E
(L
6
o
F
(b)
s3-2
Fig.
7.l4-External
axial load
histories
Typical
loVd
at excursion
peak
17(
/
_
--r,--=G--
Target 140
kN
-168-
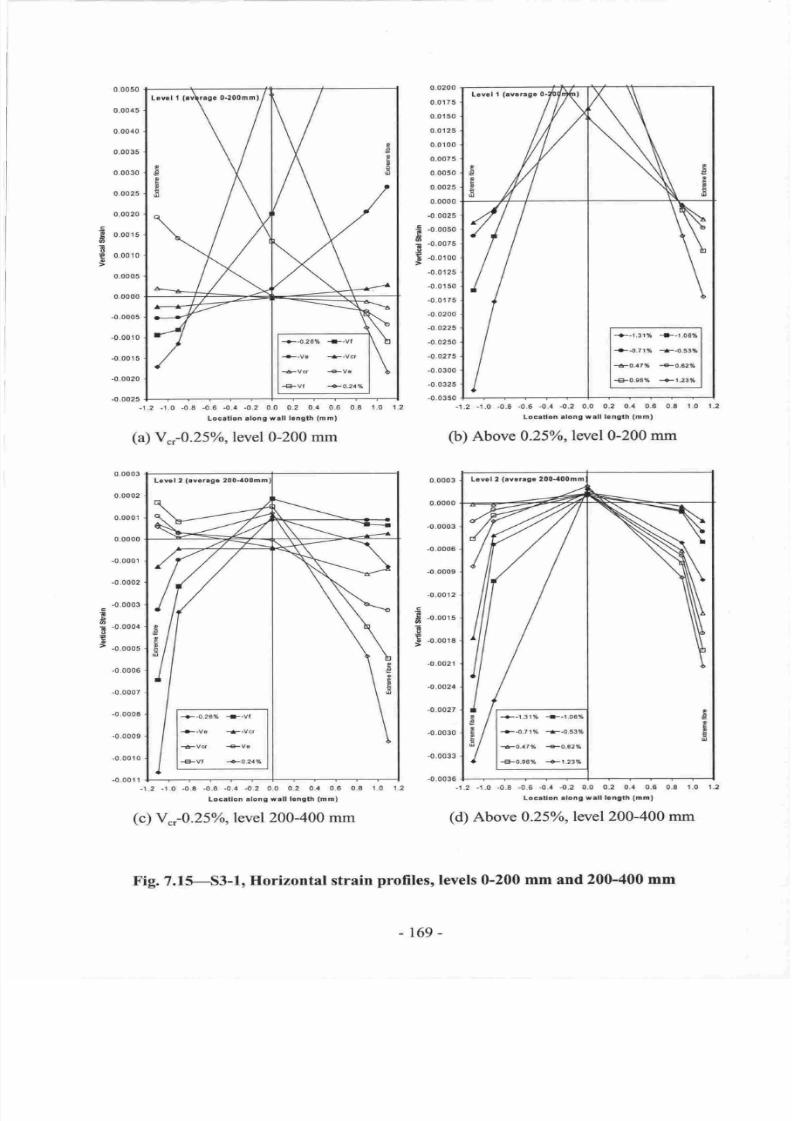
7/21/2019 PHD Laursen-masonry Prestressed Walls
http://slidepdf.com/reader/full/phd-laursen-masonry-prestressed-walls 195/308
0.0050
0.00.15
0.0040
0.00 35
0.0030
0.0025
0_0020
0.0015
0.0010
0_0005
0,0000
.0.0005
-0.00r0
-0.00'15
.0.0020
-0.0025
;
T
€
I
c
I
6
E
I
B
E
I
?
c
@
0.0200
0.0175
0.0150
0.01
25
0.0100
0.0075
0,0050
0.0025
0.0000
-0.0025
-0.0050
-0.0075
-0.0100
-0.0125
-0.0150
.0.0
r
75
-0.0200
-0.0225
-0.0250
.0.0275
-0.0300
-0.0325
-0.0350
0.0003
0.0000
-0,0003
-0,0006
-0.0009
{.0012
-0.0015
-0.0018
-0.0021
-0.002,1
-0.0027
-{r.0030
-0.0033
-0.0036
-1.0
-0.8
-0.6
-0."
-0.2
0.0 0.2 0.4
0.6 0.8
Loc.tlon
|otr9
wrll
lcngth
(mml
-1.2
-1.0
-0.8
-0.8
-0.i1
-0.2
0.0
0.2
0.'l 0.6 0.6
1,0
1.2
Loc.don llong
f,rll
l.nglh
(mn)
(b)
Above 0.250
,level0-200
mm
1.2
n
(a)
V.,-0.257o,level
0-200 mm
0.0003
0,0002
0.0001
0_0000
.0.0001
.0.0002
.0.0003
.0,000,1
.0.0005
-0.0006
-0.0007
.0.0008
-0.0009
-0.0010
-0.001'l
L.Y.l 2
(rvrrag.
200{00nn
w
F=
-'t.2
-1-O
-0.8 -0.6 -0.4
-0.2 0.0 0.2 0.4 0.6 0.8
1.0 1.2
Loc.llor
slong
r.ll
hnglh
(mml
(c)
V",-0.2
5
o/o,
level 200400
mm
-r.2
-1.0.0.8
-0.6
-0.t -0.2
0.0
0.2 0.4 0.8 0.8
1.0
'1.2
Loc.llon rloFg wall
letrgth
(nG)
(d)
Above 0.250
,level200-400
mm
profiles,levels
0-200
mm
and
200-400
mm
-t69-
L.vcl l
(rvrnga
L vol
2
(.v.rugt
200-'l00nn
+.1.3rt
-l-.t.ot a
+-0.71%
+-0.53 6
+o,at*
+0,62 a
-{F0.s6ta
+1.23*
Fig.
7.15-53-1,
Ilorizontal strain
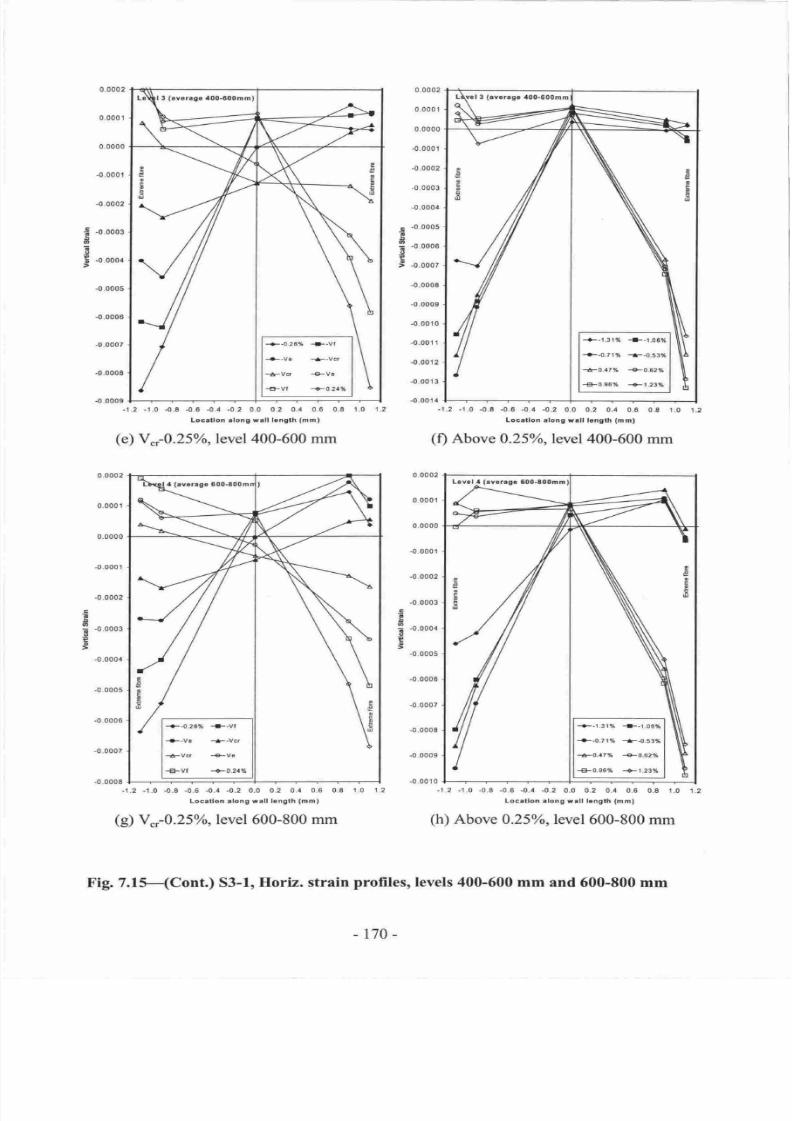
7/21/2019 PHD Laursen-masonry Prestressed Walls
http://slidepdf.com/reader/full/phd-laursen-masonry-prestressed-walls 196/308
0.0002
0-000'1
0.0000
-0.000'1
-0.0002
f;
-o.ooor
a
I
b
-0.0004
-0.0005
-0.000e
-0.0007
.0.0008
0.0002
0.000r
0.0000
-0.000
1
.0.0002
0.0002
0.000 1
0.0000
-0.0001
{.0002
.0.0003
-0.0004
c
-0.0005
I
-o,oooo
E
t
S
-o.oooz
-0.000s
-0.0009
-0.00r0
-0.001
1
-0_0012
.0.0013
-0.0014
.0.8
-0.6 -0.i| -0-2
0.0 0.2
0.4 0,8 0.8 1.0
1.2
Locrtlon .long
wrll langrh
(mm)
-1.2
-1.0
-0_8
-0.6
-O_1
-O-2
0.0
0,2
0.4
0.8
0,8 1.0 1.2
Locltlon .lon9 wrll
langth
(n
ml
(f)
Above
0.25o/o,level400-600
mm
6
E
E
;
-0.0003
o
?
t
(e)
V".-0.25Vo,
level 400-600
mm
0.0002
0.000
1
0_0000
-0.000r
-0,0002
-0.0003
-0.0004
-0.0005
-0_0006
-0.0007
-0-0008
-0.0009
-0.0010
(d
%,-0.25olo,
level
600-800 mm
-1
.2
-1.O -0.8
-0.6
-0.1 -0,?
0.0
0.2
0.4 0.6
0.8
1 .0
Loc.alon.long
wlll
length
(mml
(h)
Above O.2s%o,level
600-800
mm
Fig. 7.lf(Cont.) S3-1,
Horiz. strain
profiles,levels
400-600
mm and
600-800
mm
-0.0004
-0.0005
.0.0006
-0.0007
-1
.0
-0.8
-0.6 -0.'l -0.2 0.0 0.2 0.4 0.6 0.8
1.0
Loc.alon rlong
rell
length
(mml
-170-
1,2
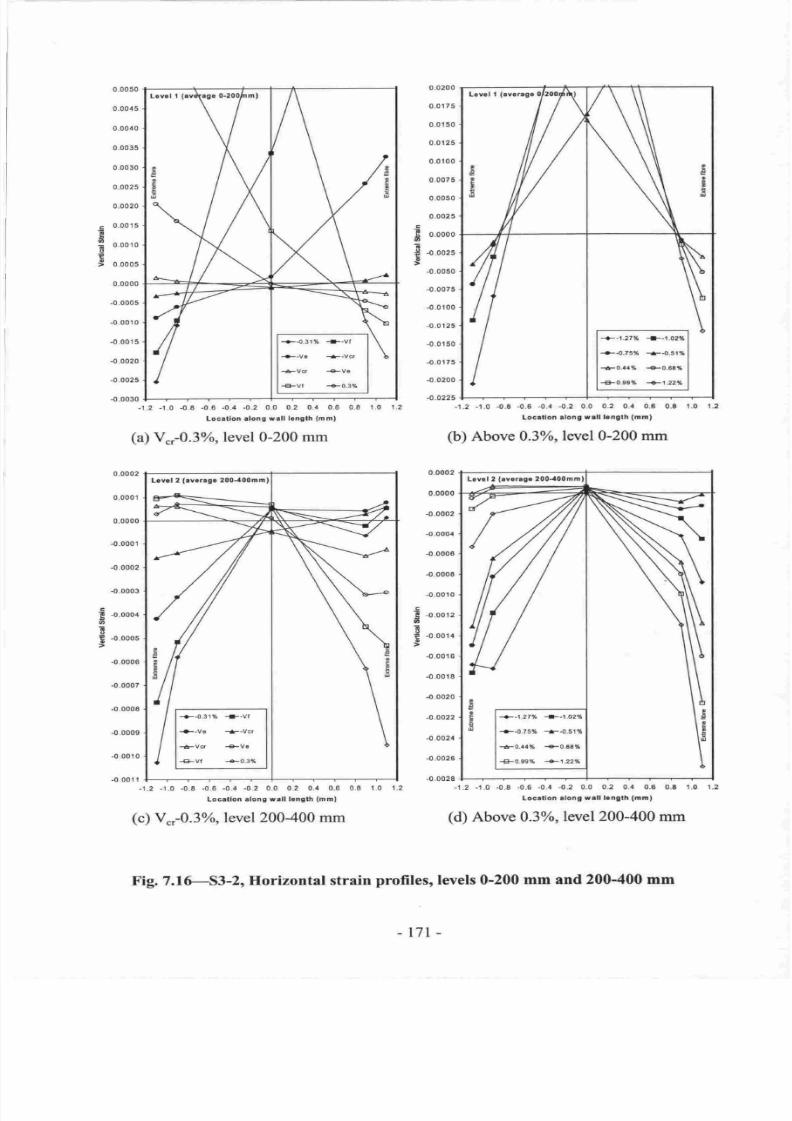
7/21/2019 PHD Laursen-masonry Prestressed Walls
http://slidepdf.com/reader/full/phd-laursen-masonry-prestressed-walls 197/308
0.0050
0.0045
0-00,+0
0.0035
0.00t0
0.0025
0.0020
0.00 r5
0.00r0
0.0005
0.0000
-0.0005
-0.0010
-0_001
5
-0.0020
-0.0025
4.0030
t
a
E
I
t
s
G
?
6
T
?
I
I
i
C
0.0200
0.0175
0.0150
0.0125
0.0100
0.0075
0-0050
0.0025
0.0000
-0.0025
-0.0050
{.0075
4.0100
-0.0
I 25
-0.0'150
-0.0175
-0.0200
.0.0225
0.0002
0.0000
-0.0002
-0.0004
-0.0004
-{,.0008
-0.001
0
-0.0012
-0.0014
-0.0018
-0.00
18
-0.0020
.0.0022
-0.002if
-0,0028
-0.0028
-1-2
-1.0
-0.8
-0.8 -0..1
-0.2 0-0
0.2
0.1 0.8 0.8
Locrtlon.lon wrll lcngth
(mm)
(a)
V..-0.3%,
level 0-200
mm
-r.2
-1.0
{.8 4.6
-0.,1
{.2
0.0 0.2 0..f 0.6
0.8
1.0
Loc.llon tlong
rrll l.nglh
(mnl
O)
Above
0.3%o,lwel
0-200
mm
12
.2
.0
0,0002
0.0001
0.0000
-0.0001
-0.0002
-0.0003
c
E
-o.ooo/.
6
i
?
-o.ooos
-0.0006
-0.0007
.0.0008
-0.000s
-0.0010
-0,0011
-.t.2.1.0,0.8.0.6
-0.4
-0.2
0.0 0.2
0.,1
0,6 0.8
1.0
1.2
-1.2
-t.0
-0.8
-0.6 -0.4 -O.2
0.0
0.2
0.,1
0.8 0.8
1.0
1.2
Loc.llon
.long
r.ll
hngth
(mml
LoEltlon rlong
wlll
l.ngrh
(nml
(c)
V",-0.3%,level
200400 mm
(d)
Above O.3Yo,level200-400
mm
Fig.
7.16-S3-2,Horizontal
strain
profiles,levels
0-200
mm and
200-400 mm
Lowl
t
(rv.ngo
+-1-27
-4.--1.02t{
+.0.75*
--..-.{t.sfi(
+o,aa*
+0,8t*
-+F0_9t (
+1.22*
-t7t-

7/21/2019 PHD Laursen-masonry Prestressed Walls
http://slidepdf.com/reader/full/phd-laursen-masonry-prestressed-walls 198/308
I
o
€
a
a
6
?
I
6
E
I
F
o
f
I
0.0002
0.000
I
0_0000
-0.0001
-0.0002
{.0003
-0.0004
-0.0005
-0.0004
-0.0007
-0.0008
-0.0009
-0-001 0
-0.00r
1
0.0002
0.0000
.0.0002
-0.0004
{}.0006
-0.0008
-0.0010
-0.00
r
2
-0.0014
-0.00
r
6
-0.0018
.r.2
-1_0.0,8
-0.6 -0.a
-o.2
0.0 0.2 0.4
0_6 0,8
Lo3.llon .long
rall
lcngth
(mm)
(e)
V",-0.3%, level400-600 mm
(f)
Above
0.3Yo,level400-600
mm
1.0
0.0002
0.0001
0.0000
-0.0001
-0,0002
0.0002
0.0001
0.0000
,0.0001
-0.0002
-0.0003
-0.0004
-0.0005
-0.0006
-0,0007
-0,0008
-0.0009
-0.001 0
-0.001
1
-0.0012
-0.0013
-0.001,1
-0.0015
,0.0003
-0,0004
.0.0005
-0,0006
-0,0007
-0.0008
.0,0009
-0.0010
(g)
V",-0.3%,level 600-800
mm
-1.2
-1.0
-0.8
-0.6
-{t.ia
-0.2
0.0 0.2 0.4 0.6
0.8
1.0
Locatlon
llong
wrll
lgngth
(mml
(h)
Above
0.3o
,level
600-800 mm
Fig.7.16-(Cont.)
S3-2,
Horiz. strain
profiles,levels
400-600 mm
and
600-800
mm
-1,2
-r.0
-0.8
{.5.0.,1
-0.2
0.0 0.2 0.4 0.6
0.8
Locrllon
rlong
wrll
llngth
(mm)
1.2
|.0
L v.l
t
(rvorrlc
a00-600mn,
-1.2
-1.0
-0.8
-0.6
-0.4
-0.2
0.0 0.2
0.4 0.6
0.8 1.0
1.2
Loc.llqn
.long
{ ll 16notlt
(mm)
Lrv.l
4
(rv .rgr
600-800nm)
-172-
1.2
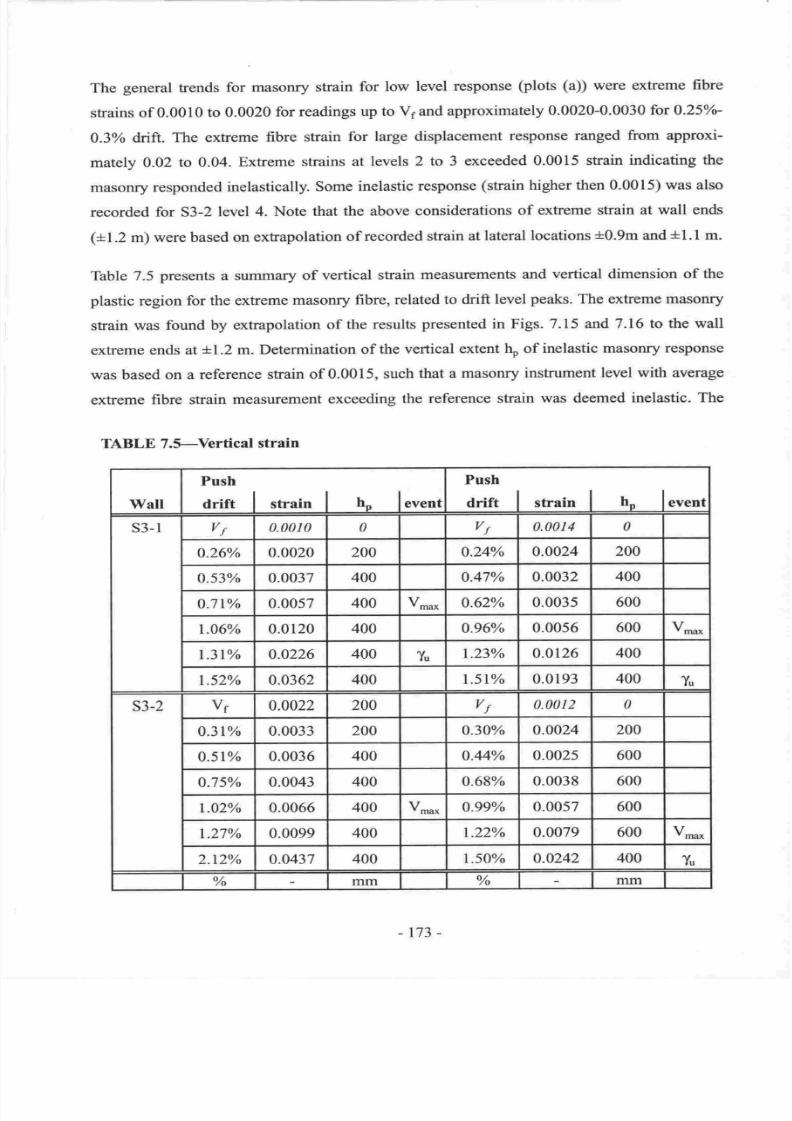
7/21/2019 PHD Laursen-masonry Prestressed Walls
http://slidepdf.com/reader/full/phd-laursen-masonry-prestressed-walls 199/308
The
general
tends
for
masonry
strain
for
low level
response
(plots
(a))
were
extreme
fibre
stains of 0.0010
to 0.0020
for readings
up
to Vr
and approximately
0.0020-0.0030
for
0.25o/o-
0.3%
drift.
The exffeme
fibre strain
for
large displacement
response ranged
from approxi-
mately
0.02
to
0.04.
Extreme strains
at
levels
2 to 3
exceeded
0.0015 strain
indicating
the
masonry
responded
inelastically.
Some
inelastic
response
(strain
higher
then 0.0015)
was also
recorded
for
S3-2
level
4. Note that the
above
considerations
of
extreme strain
at
wall
ends
(t
I
.2
m) were based
on
exfapolation
of recorded
strain at
lateral
locations
+0.9m
and
+
I .
I
m.
Table 7.5
presents
a
summary
of
vertical
strain
measurements
and
vertical
dimension
of
the
plastic
region for
the extreme
masonry
fibre,
related
to drift
level
peaks.
The
extreme masonry
sfrain
was
foundby extrapolation
of
the results
presented
in Figs.7.l5
and
7.16to
the wall
extreme
ends at
+1.2
m.
Determination
of the
vertical
extent
ho of inelastic
masonry response
was
based
on
a
reference
strain of
0.0015, such
that
a masonry
instrument
level with average
extreme
fibre
strain
measurement
exceeding
the reference strain
was
deemed
inelastic.
The
TABLE
7.S-Vertical
strain
WaIl
Push
drift |
,o io
I n'
levent
Push
drift |
,o in
I rt
levent
s3-l
vl
0.0010
0
l/f
0.00t4
0
0.26%
0.0020
200
0.24%
0.0024
200
0.53%
0.0037
400
0.47%
0.0032
400
0.7r%
0.0057
400
V**
0.62%
0.0035
600
r.06%
0.0120
400
0.96%
0.0056 600
Vrn t
t3t%
0.0226
400
Tu
r.23%
0.0126
400
152%
0.0362
400
t5l%
0.0193
400
%
s3-2
vf
0.0022
200
vJ'
0.00r2
0
0.3r%
0.0033
200
0.30%
0.0024
200
0.5r%
0.0036
400
4.44%
0.002s
600
0.7s%
0.0043
400
0.68%
0.0038 600
r.02% 0.0066
400
V-*
0.99%
0.0057 600
1.27% 0.0099 400
r.22%
0.0079
600
Vr-
2.r2% 0.0437
400
|50%
0.0242
400
%
%
mm
%
mm
-t73-
7/21/2019 PHD Laursen-masonry Prestressed Walls
http://slidepdf.com/reader/full/phd-laursen-masonry-prestressed-walls 200/308
extreme strain
presented
in Thble
7.5
reflects
the average
of the strains
measured
by the
instru-
ments
within
the vertical
extent of ho. The following
was observed
from
Thble
7.5:
(1)
vertical
strain at nominal flexural
strength Vs indicates
elastic masonry response
(in
italic
font)
at
this
load level
(with
the exception
of
S3-2
pull),
(2)
shain at
V,'*
ranged
from
0.0056
to
0.0079,
(3)
sfrain at
yu
ranged from I .9o/o to 2.4o/o,
(a)
ho at
V,no
measured
400
mm for
pull
excursions
and 600
mm for
push
excursions and
(5)
lb at
%
measured 400
mm
for both walls.
7.4.7
Lateral wall
displacement
profile
Figs. 7. l7 and 7.18 show the lateral displacements at
the
RC
floor slab
and
loading
beam levels
recorded
at
peaks
of first excursions to the specified drift levels.
Studying
the low level response
plots (a),
it
is
seen that both walls
exhibited
distinct flexural
action for
loading between
V ,
and Vr.
These
displacement
profiles
are
'curved'
with
distinct
'kinks'at
the first
RC
floor slab
level,
suggesting
that
a significant
amount of the lateral
dis-
placement
arose from flexural action
throughout the wall. The
curvature
became less
distinct
as the walls
were
loaded
to
higher force.
Looking at
the
plots
of
high
drift
level
lateral
displacement
profi.les
in Figs.7.17(b)
and
7.18(b),
it
is clear that rocking action at
the base became the
dominant source
of
lateral
dis-
placement.
The
lateral
displacement
profiles
became straight lines
and
the
'kink'
previously
observed at
the
first RC floor
slab
level
disappeared.
7.5
DISCUSSION
7.5.1
Flexural
response
Fig.
7.9
indicates
that
the developed
flexural strength
V*u*
(base
shear
corresponding
to the
maximum moment) exceeded the
predicted
flexural strength Vl in
both wall tesl
specifically
53-1
developed2lo/o
higher strength
(average
of
push
and
pull)
than
V6, while
S3-2 developed
28% higher strength
than Vs. These
measured strengths were
surprisingly high
because
calcu-
lating
the wall strength
(base
shear
corresponding
to
the
restoring
moment
due to P+N)
using
the measured
peak
values
of
P
and
N
and cr
:
0.96 could not account for
the measured
strength
in
either
of
the
wall
tests.
The author
is
confident that the lateral
load
(LCH)
was measured
within 5olo of accuracy and
that little horizontal
resistance
was caused
by
the lateral
restraining
devices.
The load cells measuring the additional
axial force
(LCAN
and LCAS) recorded
simi-
n4-
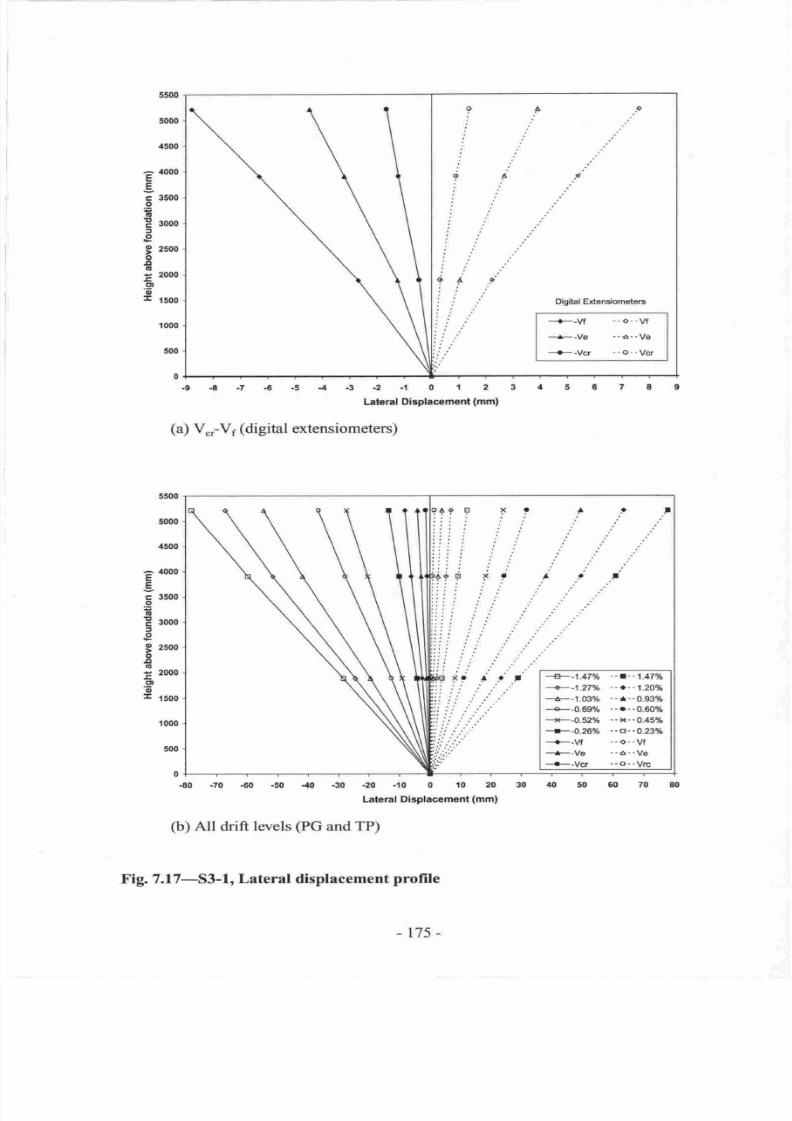
7/21/2019 PHD Laursen-masonry Prestressed Walls
http://slidepdf.com/reader/full/phd-laursen-masonry-prestressed-walls 201/308
.C{-7{.5.aa.2.l0lzE
Labral Dl.Fl.tsrmnl
(mtn)
(a)
Vo-V1
(digfial
ortensiometers)
{o -70 {0 s {o
.to
-n
'ro
0
10 N,
a0
l-alrral
Dhptacament
(mml
(b)
All
drift lwels
(Pc
and
TP)
Fig.
7.17-rS&1,
Lateral displacement
profle
6S0
sdm
4 100
E
{CIe
E
c 3500
.9
E
E
ooo
t
e
g
2roo
t
5
looo
q
,o
't
tcoo
fm0
500
0
00
lo0
1€00
6
tooo
E
g
loo
I
E
rgoo
f
e
I
2500
t
g
lo00
It
o
E
rroo
10oo
00
0
*
o||Ctaf Bdeodomo@
+-w
+--v,
+'V.cr
-"o..W
.-6...Vo
"Q
.'
Ver
-
175-
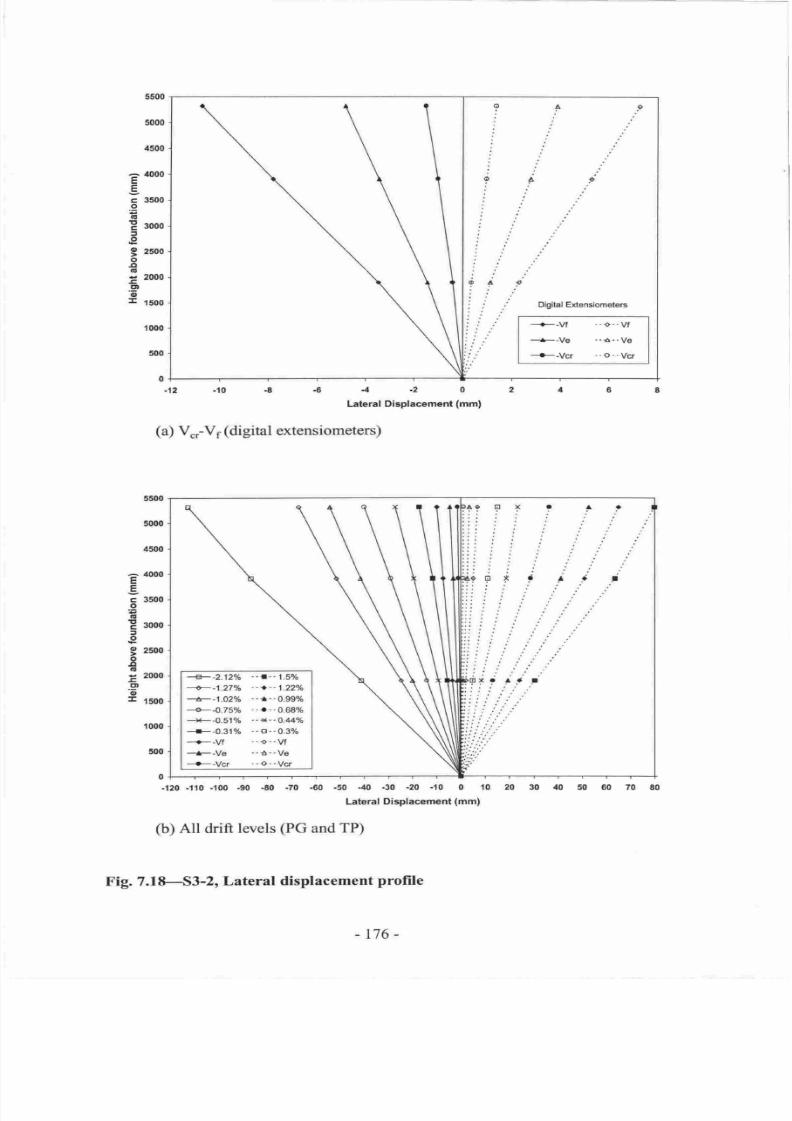
7/21/2019 PHD Laursen-masonry Prestressed Walls
http://slidepdf.com/reader/full/phd-laursen-masonry-prestressed-walls 202/308
55oo
5000
tE00
F
1000
g
E
3000
E
E
aom
t
c
I
estto
o
t
il
E,
z00o
r
o'
I
ttoo
t0m
00
0:
t*r
,*1
1600
1
..,
I
*J
'*l
*1
"-ll
'*l
I
"*ll
ill
4m
E
E
c
o
c
E
c
=
e
o
t
.8
c
E
E
ld
E
42.10{.t{.20
Lalerel lDlrplacermnt
(nml
(a)
V*-%
(digital
exronsiometo,ts)
+4.1W
.-r'-1,5"6
---r--1.27%
-
-
+
- -
| ft|o$
+-1.03%
-:t-.:0,9&16
-e-{7596,
r:c:r0;68 i6
+4-5ilt
.-r--0,"f4%
+4.3ti6
-.s--0r396
-+-.w
.-,f
,,w
-F-llc
-{-.Ve
->-ll0r
..o-"Vq'
.t0
d10
-m
160
4n
.10
.t0
-20
-tO 0
d0'
gr
Leleral
Dlsolacadtltnf
(
trlDtl
ll|rl0 rl0o
O)
All
drift
lwels
FG
and
TP)
Flg- ?.1E-53'2r
Lateral dfuplacement
profile
.o
Otgitd EensioroBtars
-+jvl
-+--vs
+-v9f
..{'-"vf
"$..v6
..-
u,-
\fcf
-176-
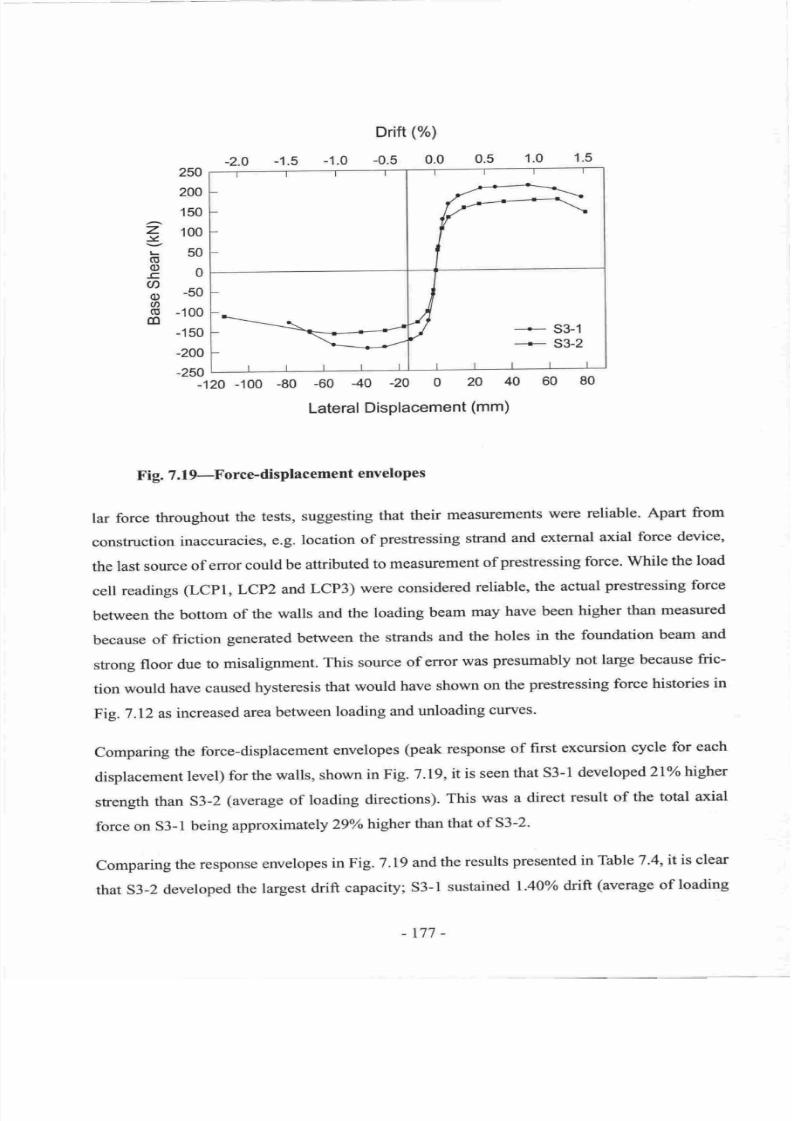
7/21/2019 PHD Laursen-masonry Prestressed Walls
http://slidepdf.com/reader/full/phd-laursen-masonry-prestressed-walls 203/308
-2.0
Drift
(%)
-1.0 -0.5
0.0
250
200
150
100
50
0
-50
-100
-150
-200
-250
-120
-100
-80
-60
-40
-20
0
20
40
60
Lateral
Displacement
(mm)
Fig.
7.19-Force-displacement
envelopes
lar
force
throughout
the
tests,
suggesting
that
their
measurements
were reliable.
Apart
from
constnrction
inaccuracies,
e.g.
location
of
prestressing
strand
and
external
axial
force
device,
the
last
source
of error
could
be
attributed
to
measwement
of
prestressing
force.
While
the load
cell
readings
(LCpl,
LCp2
and
LcP3)
were
considered
reliable,
the
actual
prestressing
force
between
the
bottom
of
the
walls
and
the
loading
beam
may
have
been
higher
than
measured
because
of
friction
generated
between
the
strands
and
the
holes
in
the
foundation
beam
and
strong
floor
due
to misalignment.
This
source
of
error
was
presumably
not
large
because
fric-
tion
would
have
caused
hysteresis
that
would have
shown
on
the
prestressing
force
histories
in
Fig.7.l2
as
increased
area
between
loading
and
unloading
curves.
Comparing
the
force-displacement
envelopes
(peak
response
of
first
excursion
cycle
for
each
displacement
level)
for
the
walls,
shown
in
Fig.
7
.19,
it
is
seen
that
S3-l
developed
Zl%olttgher
strength
than
S3-2
(average
of
loading
directions).
This
was
a
direct
result of
the total axial
force
on
S3-l being
approximately
29Yo
higher
than
that
of
S3-2.
Comparing
the
response
envelopes
in Fig.
7.19
and
the
results
presented
in
Table
7.4,it
is
clear
that
S3-2
developed
the
largest
drift
capacity;
S3-1
sustained
1.40%
drift
(average
of
loading
L
V
\\-------
T
I
a
I
II
n
JI
I +
S3-1
/
, , ,*,t'-t,
-1.5
1.5
.0
z
lz
o
.E
a
0)
.h
(u
m
-r77
-
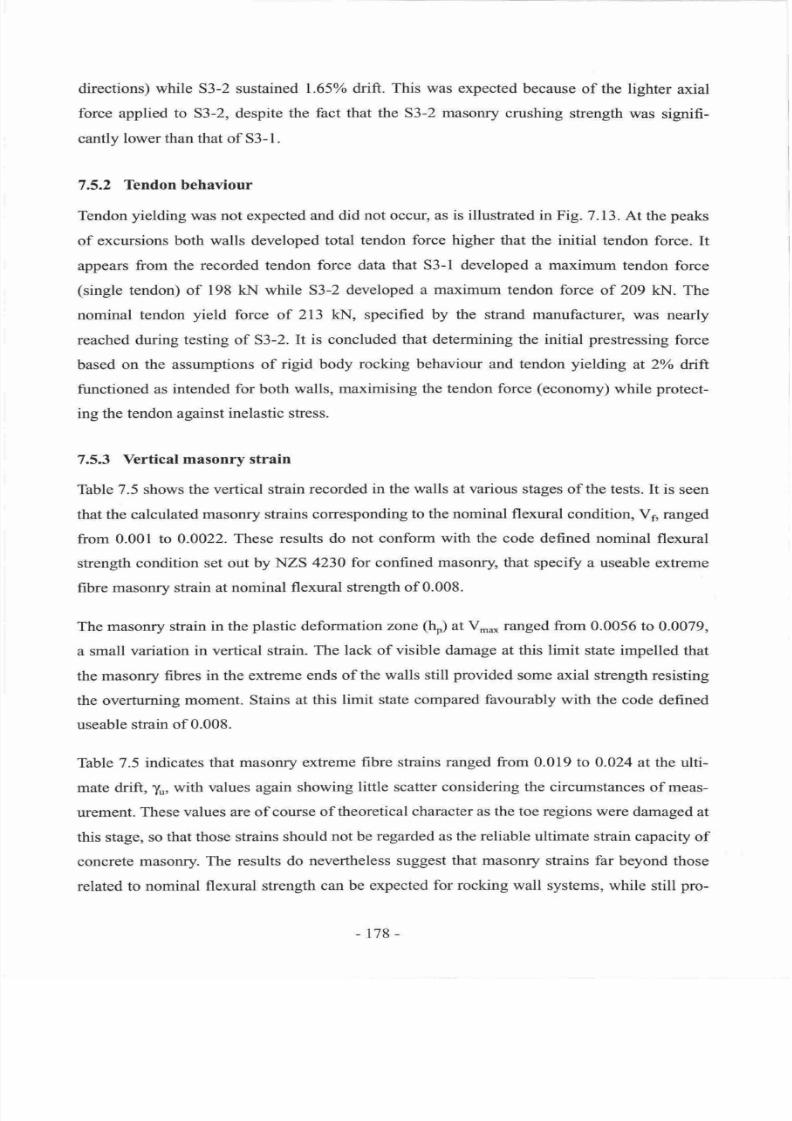
7/21/2019 PHD Laursen-masonry Prestressed Walls
http://slidepdf.com/reader/full/phd-laursen-masonry-prestressed-walls 204/308
directions)
while
S3-2 sustained
l.65Vo
drift.
This
was
expected
because
of
the
lighter
axial
force
applied
to
S3-2,
despite
the fact that the
S3-2 masonry
crushing
strength
was
signifi-
cantlv lower
than that
of 53-
l.
7,5.2
Tendon behaviour
Tendon
yielding was
not expected
and did not occur, as
is
illustrated in
Fig.7.l3.
At
the
peaks
of
excursions both walls
developed
total
tendon force higher that the
initial
tendon
force. It
appears
from the
recorded tendon
force
data
that
S3-l developed
a maximum
tendon
force
(single
tendon)
of
198
kN while
S3-2 developed
a
maximum
tendon force
of
209
kN.
The
nominal
tendon
yield
force
of
213
kN, specified
by the strand
manufacturer,
was
nearly
reached during
testing
of
S3-2.
It
is
concluded that
determining
the
initial
prestressing
force
based on
the assumptions
of
rigid
body
rocking behaviour
and tendon
yielding
at
2
dirft.
frrnctioned
as
intended for both
walls, maximising
the tendon force
(economy)
while
protect-
ing the tendon against
inelastic stress.
7.5.3
Vertical
masonry
strain
Table 7.5 shows the
vertical
strain
recorded
in the
walls
at
various
stages
of the tests.
It
is seen
that the calculated
masoffy strains corresponding
to the
nominal flexural condition,
V1, ranged
from
0.001
to
0.0022.
These results
do not conform
with
the code defined
nominal
flexural
strength
condition
set out by
NZS
4230
for confined masonry, that specifu
a useable extreme
fibre
masonry strain at
nominal flexural
strength of
0.008.
The masonry strain
in
the
plastic
deformation
zone
(ho)
at
V**
ranged
from
0.0056 to
0.0079,
a small
variation
in vertical strain.
The lack
of
visible damage
at
this
limit
state
impelled
that
the masonry fibres
in the extreme ends
of
the
walls still
provided
some
axial stength
resisting
the overturning
moment.
Stains at
this
limit state
compared
favourably
with
the
code defined
useable strain
of 0.008.
Table 7.5
indicates
that
masoffy
extreme
fibre
strains
ranged
from
0.019
to
0.024 at
the
ulti-
mate drift,
yu,
with
values
again showing
little scatter considering the circumstances
of meas-
urement.
These
values
are of
course of
theoretical
character as the toe regions
were
damaged at
this
stage,
so
that
those strains should not
be regarded
as
the
reliable ultimate
strain capacity
of
concrete
masonry. The results
do
nevertheless suggest
that
masonry strains far beyond
those
related
to nominal
flexural strength can
be expected
for rocking
wall
systems,
while
still
pro-
-178-
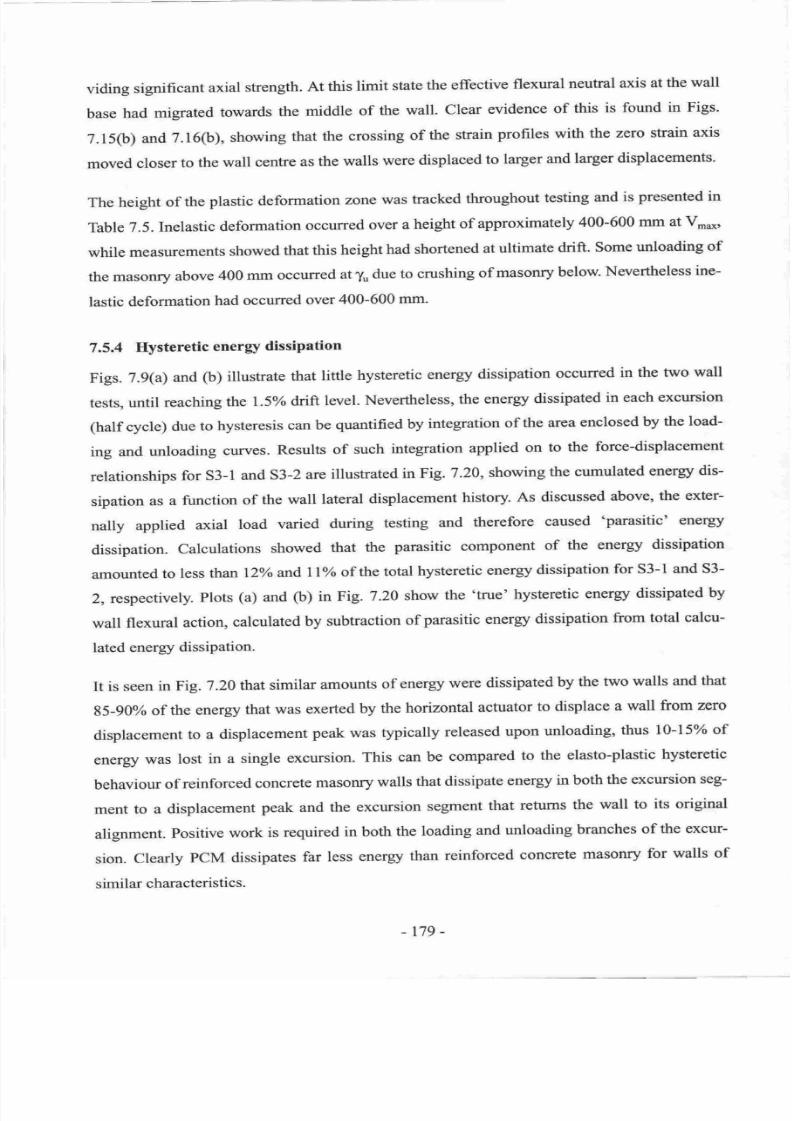
7/21/2019 PHD Laursen-masonry Prestressed Walls
http://slidepdf.com/reader/full/phd-laursen-masonry-prestressed-walls 205/308
viding
significant
axial
strength.
At
this
limit
state
the effective
flexural
neutral
axis at the
wall
base
had
migrated
towards
the
middle
of
the
wall.
Clear
evidence
of
this
is found
in Figs.
7.150)
and
7.16(b),
showing
that
the
crossing
of
the
strain
profiles with
the
zero strain
axis
moved closer
to
the
wall
centre
as
the
walls
were displaced
to
larger
and
larger
displacements.
The
height
of
the
plastic
deforrration
zone
was
tracked
throughout
testing
and
is
presented
in
Table
7.5.
Inelastic
deformation
occurred
over
a
height
of approximately
400-600
mm at
V66,*,
while
measgrements
showed
that
this
height
had
shortened
at ultimate
drift.
Some
unloading
of
the
masonry
above
400
mm
occurred
at
yu
due
to crushing
of
masonry
below
Nevertheless
ine-
lastic
deformation
had
occurred
over
400-600
mm-
7.5.4
Hysteretic
enerry
dissipation
Figs. 7.9(a)
and
(b)
illustrate
that
little
hysteretic
energy
dissipation
occurred
in the two
wall
tests,
until
reaching
the
1.5
drift
level.
Nevertheless,
the
energy
dissipated
in
each excursion
(half
cycle)
due
to
hysteresis
can
be
quantified by
integration
of
the
area
enclosed
by
the
load-
ing
and
unloading
curves.
Results
of
such
integration
applied
on
to
the
force-displacement
relationships
for
S3-l
and
S3-2 are
illustrated
in
Fig.
7.20,
showing
the
cumulated
energy
dis-
sipation
as
a
function
of
the
wall
lateral
displacement
history.
As
discussed above,
the
exter-
nally
applied
axial
load
varied
during
testing
and
therefore
caused
'parasitic'
energy
dissipation.
Calculations
showed
that
the
parasitic
component
of
the
energy
dissipation
amounted
to
less than
l}vo
and
LlVo
of
the
total
hysteretic
energy
dissipation
for 33-l
and
53-
2, respectively.
plots
(a)
and
O)
in
Fig.
7.20
show
the
'true'
hysteretic
energy
dissipated
by
wall
flexural
action,
calculated
by
subtraction
of
parasitic
energy
dissipation
from
total
calcu-
lated energy
dissipation.
It
is
seen
in
Fig. 7
.20
that similar
amounts
of
energy
were
dissipated
by the
two
walls
and
that
gs-g1 of
the energy
that
was
exerted
by
the
horizontal
actuator
to displace
a
wall from
zero
displacement
to a
displacement
peak was
typically
released
upon
unloading,
thus 10-15
of
energy
was
lost
in
a
single
excursion.
This
can
be
compared
to
the
elasto-plastic
hysteretic
behaviour
of
reinforced
concrete
masonry
walls
that dissipate
energy
in both
the
excursion
seg-
ment
to a
displacement
peak
and
the excursion
segment
that
returns
the
wall
to its
original
alignment. positive
work
is required in both
the
loading
and
unloading
branches
of
the excur-
sion.
Clearly
PCM
dissipates
far
less
energy
than
reinforced
concrete
masonry
for
walls
of
similar
characteristics.
r79
-
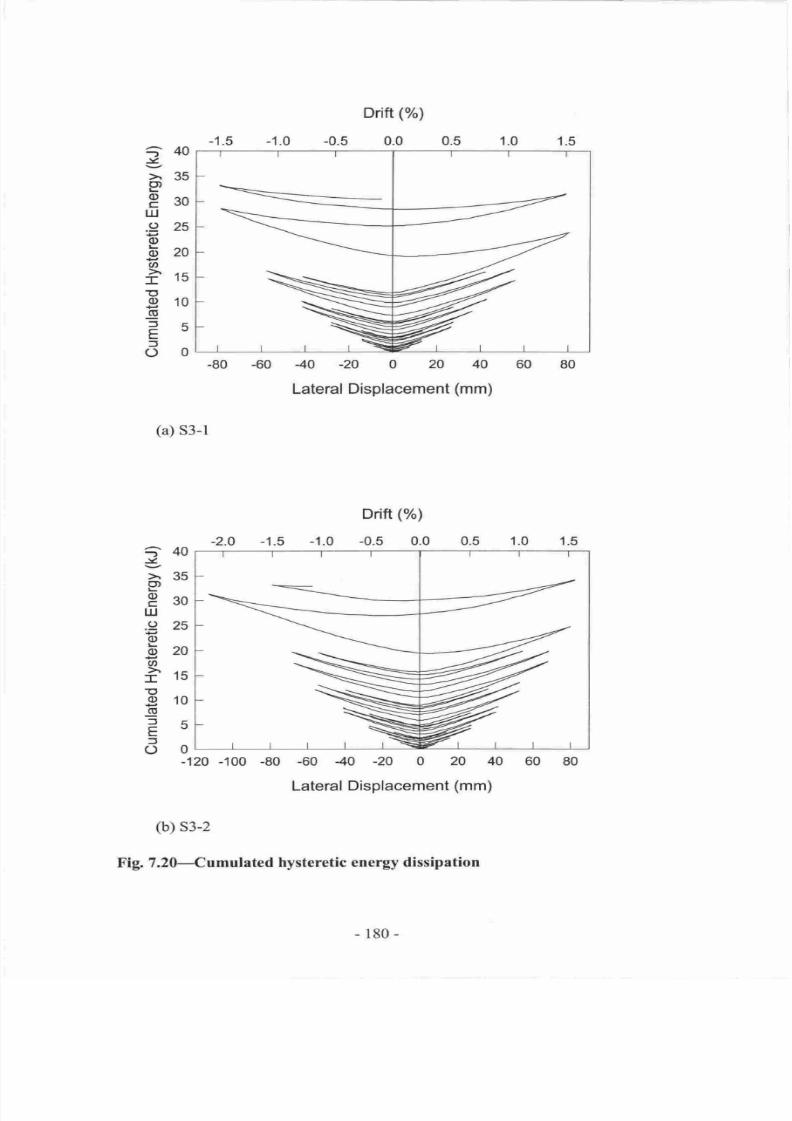
7/21/2019 PHD Laursen-masonry Prestressed Walls
http://slidepdf.com/reader/full/phd-laursen-masonry-prestressed-walls 206/308
-
P
o
C
UJ
o
o
o
q,
I
E
0)
(U
=
E
=
)
40
35
30
25
20
15
10
5
0
-80
-60
40
-20
0
20 40
60
Lateral Displacement
(mm)
(a)
S3-l
-
z
P
o
C
LU
-9
o
q)
o
T
E
o
(E
=
E
=
o
40
35
30
25
20
15
10
5
0
Drift
( )
-2.0
-1.5
-1.0
-0.5
0.0 0.5 1.0 1.5
-80
-60
40
-20
0 20 40 60
Lateral
Displacement
(mm)
-120 -100
(b) s3-2
F ig. 7.2G-Cumulated
hysteretic energy
dissipation
-180-
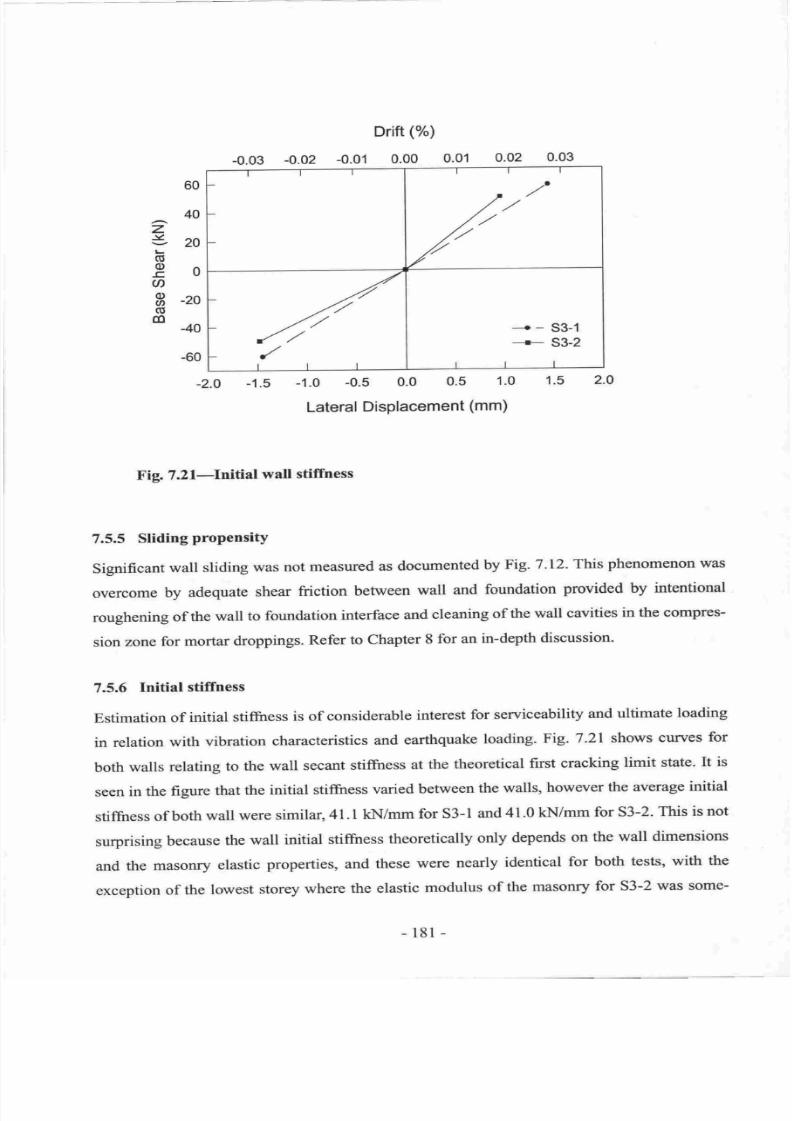
7/21/2019 PHD Laursen-masonry Prestressed Walls
http://slidepdf.com/reader/full/phd-laursen-masonry-prestressed-walls 207/308
Drift
( )
-0.03 -0.02
-0.01
0.00 0.01
0.02
-60
---+
-
S3-1
*
S3-2
I
-2.O
-1.5
-1.0
-0.5
0.0
0.5
1.0
Lateral
Displacement
(mm)
Fig. 7
.Zl-Ilitial
wall
stiffness
7.5.5
Sliding
proPensitY
Significant
wall sliding
was
not
measured
as
documented
by
Fig.7.l2.
This
phenomenon
was
overcome
by
adequate
shear
friction
befiveen
wall
and
foundation
provided
by
intentional
roughening
of
the
wall
to
foundation
interface
and
cleaning
of
the
wall
cavities
in the compres-
sion
zone
for
mortar
droppings.
Refer
to chapter
8
for
an
in-depth
discussion.
7.5.6
Initial
stiffness
Estimation
of
initial
stiffiress
is
of considerable
interest
for serviceability
and
ultimate
loading
in
relation
with
vibration
characteristics
and
earthquake
loading.
Fig. 7.21
shows
curves
for
both
walls
relating
to
the
wall
secant
stiffness
at
the
theoretical
first
cracking
limit
state.
It
is
seen
in
the
figure
that
the
initial stiftress
varied
between
the
walls,
however
the average
initial
stiffiress
of
both
wall were
similar,
4l
.
I
kN/mm
for
53- I
and
4
I .0
kN/mm
for S3-2.
This
is not
surprising
because
the
wall
initial
stiffness
theoretically
only
depends
on
the
wall
dimensions
and
the
masonry
elastic
properties, and
these
were
nearly
identical
for
both
tests,
with
the
exception
of
the
lowest
storey
where
the
elastic
modulus
of
the
masonry
for
S3-2
was
some-
0.03
60
40
2
gzo
(U
eo
a
S
-2o
(u
m
-40
2.0
.5
t8l
-
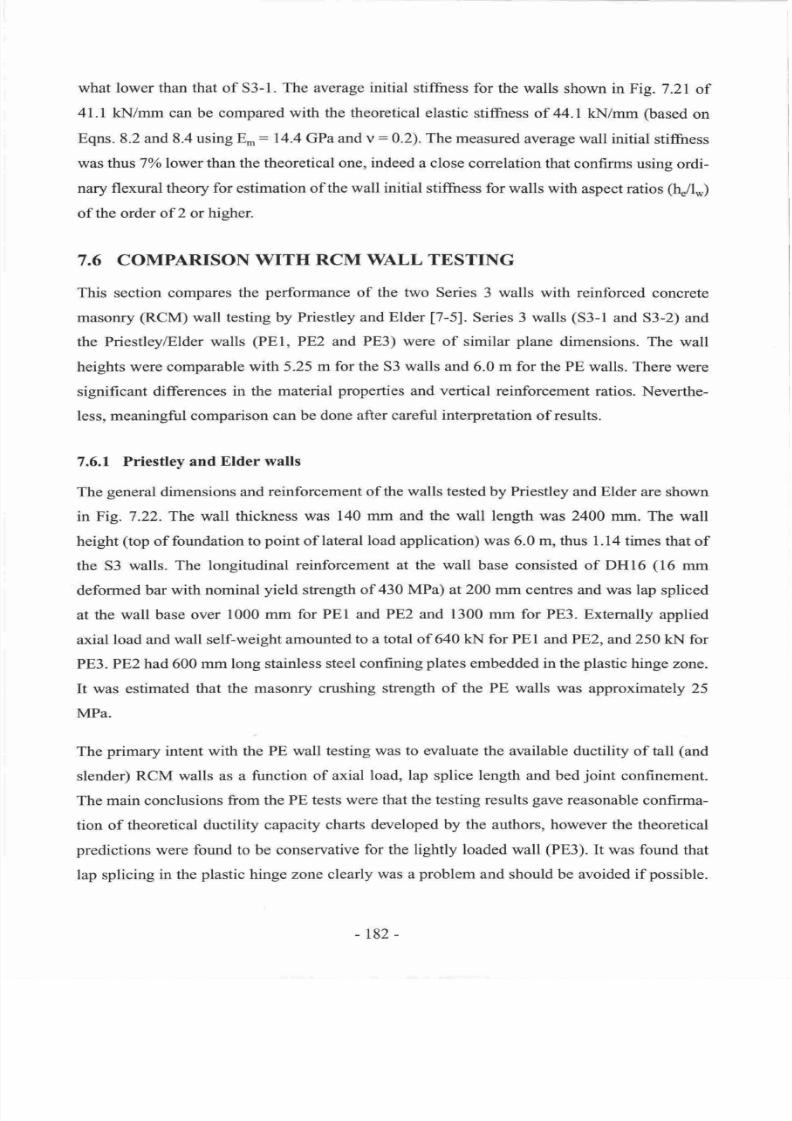
7/21/2019 PHD Laursen-masonry Prestressed Walls
http://slidepdf.com/reader/full/phd-laursen-masonry-prestressed-walls 208/308
what lower than that
of
S3-1. The average initial stiffiress
for the
walls shown
in Fig.
7 .21 of
41.1 kN/mm can be compared with the theoretical elastic
stiftress
of
44.1
kN/mm
(based
on
Eqns. 8.2 and
8.4
using
E^: 14.4 GPa and v
:
0.2). The
measured
average
wall initial stiffness
was
thus
7%olower
than
the
theoretical
one, indeed
a
close
correlation
that
confirms
using
ordi-
nary flexural theory for estimation of
the
wall
initial
stiffiress for
walls with
aspect
ratios (hJl, )
ofthe order
of2or
higher.
7.6
COMPARISON
WITH RCM WALL TESTING
This
section
compares
the
perfonnance
of
the two Series
3
walls
with reinforced
concrete
masonry
RCM)
wall testing by
Priestley
and
Elder
[7-5].
Series 3 walls
(S3-l
and S3-2)
and
the Priestley/Elder
walls
(PEl,
PEZ and
PE3)
were
of
similar
plane
dimensions. The
wall
heights were
comparable
with 5.25 m for
the
53
walls
and
6.0
m for the
PE walls. There
were
significant
differences
in the material
properties
and vertical reinforcement ratios.
Neverthe-
less,
meaningful comparison can be
done after careful interpretation
of results.
7.6.1
Priestley
and Elder
walls
The
general
dimensions and
reinforcement of the
walls
tested by Priestley and Elder
are shown
in
Fig. 7.22.
The wall thickness
was 140
mm
and
the wall
length was 2400
mm. The
wall
height
(top
of
foundation to
point
of
lateral load application) was 6.0 m, thus
l.14 times that
of
the 53 walls.
The longitudinal
reinforcement
at the wall
base consisted of
DHl6
(16
mm
deformed
bar
with nominal
yield
stength
of 430 MPa) at 200 mm centres
and was lap spliced
at
the wall base over
1000 mm
for PEI
and PE2 and
1300
mm
for
PE3. Externally
applied
axial
load and
wall
self-weight
amounted
to a
total
of
640
kN for
PEI
and PE2,
and 250 kN
for
PE3.
PE2
had 600
mm long
stainless
steel
confining
plates
embedded
in
the
plastic hinge
zone.
It
was estimated
that the
masonry
crushing
strength
of
the
PE walls was approximately
25
MPa.
The
primary
intent with the PE
wall testing
was to evaluate the
available ductility
of
tall
(and
slender)
RCM
walls
as a
function of
axial
load,
lap splice length and bed
joint
confinement.
The main conclusions
from the PE tests were that
the testing
results
gave
reasonable confirma-
tion of theoretical
ductility
capacity charts
developed by the
authors,
however
the theoretical
predictions
were found to be conservative
for the lightly loaded wall
(PE3).
It was found
that
lap splicing
in the
plastic
hinge zone clearly
was
a
problem
and
should
be avoided
if
possible.
-182-
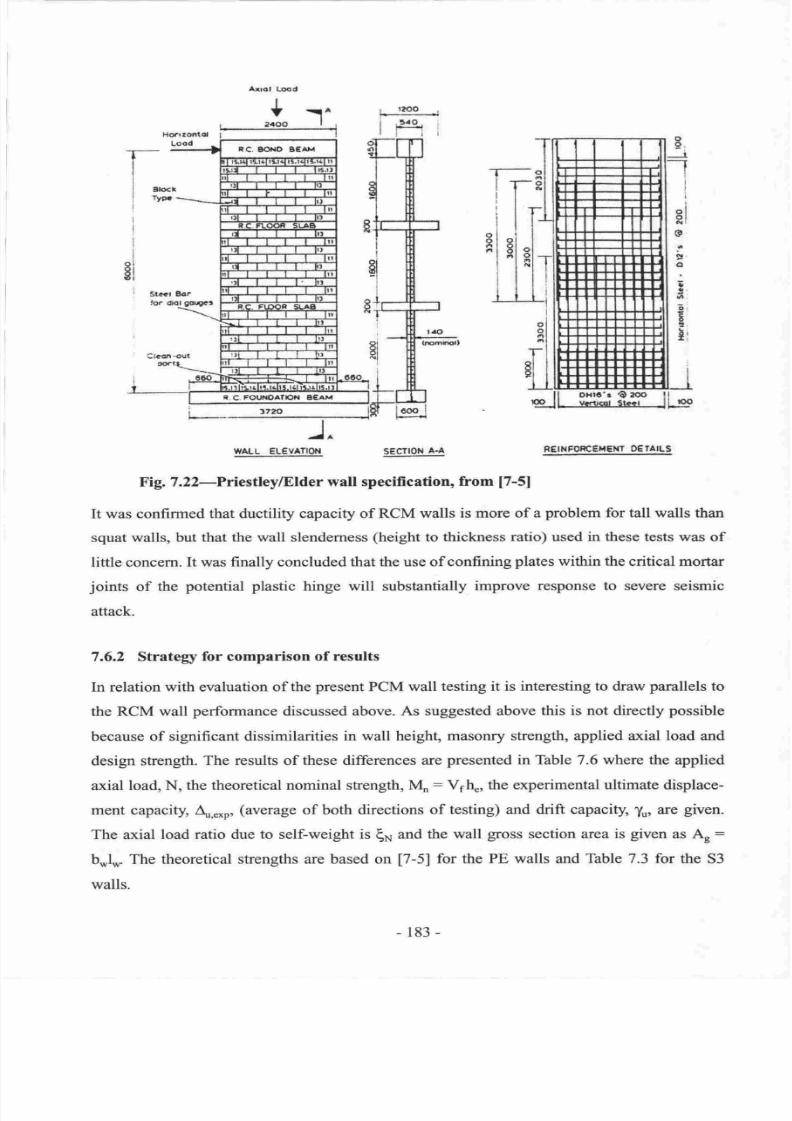
7/21/2019 PHD Laursen-masonry Prestressed Walls
http://slidepdf.com/reader/full/phd-laursen-masonry-prestressed-walls 209/308
I
i
i
ol
oi
o
b
o
a
O'
|/'
c
Ir
I
I
ZA
WALL
EI€VATIO{
SECtlOf.l
A'A
R€I}IFORCE'IENT
DE TAILS
B ig. 7 .Z2-PriestleylElder
wall specifi c ation, from
[7-51
It
was confirmed
that
ductility
capacity
of RCM
walls is more of a
problem
for
tall walls
than
squat
walls, but
that the
wall
slendemess
(height
to thickness ratio) used
in these tests
was
of
little concern.
It was finally concluded
that the
use
of confining
plates
within
the
critical mortar
joints
of
the
potential plastic
hinge will substantially
improve
response
to
severe
seismic
attack.
7.6.2
Stratery
for comparison of
results
In relation with evaluation of
the
present
PCM
wall testing
it
is
irueresting
to
draw
parallels
to
the
RCM wall
performance
discussed above.
As suggested above
this is not directly
possible
because of significant
dissimilarities
in wall height, masonry strength,
applied
axial
load
and
design
strength. The
results
of
these
differences
are
presented
in
Table 7.6
where
the applied
axial
load, N, the theoretical nominal
strength,
Mn:
Vr\, the experimental ultimate displace-
ment capacity,
4,.*0,
(average
of both directions
of
testing) and
drift
capacity,
%,
il€
given.
The axial
load
ratio
due
to
self-weight
is
thr and the
wall
gross section area
is given
as
Ar:
b*l*
The theoretical
strengths are based on
[7-5]
for
the
PE walls and Table 7.3 for the 53
walls.
-
183
-
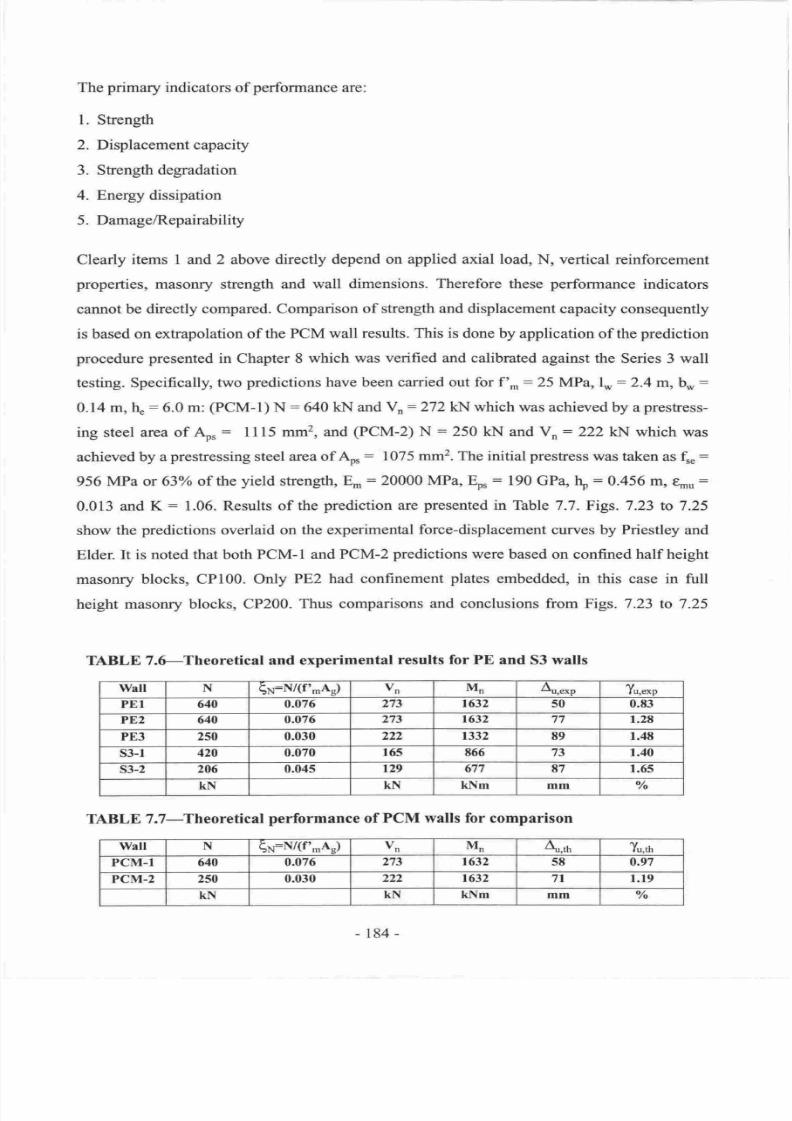
7/21/2019 PHD Laursen-masonry Prestressed Walls
http://slidepdf.com/reader/full/phd-laursen-masonry-prestressed-walls 210/308
The
primary
indicators
of
performance
are:
L
Strength
2. Displacement capacity
3.
Strength degradation
4. Energy dissipation
5.
Damage/Repairability
Clearly
items I and 2 above directly
depend on applied axial load, N,
vertical reinforcement
properties,
masonry
strength
and wall
dimensions.
Therefore
these
perforrnance
indicators
cannot be
directly compared. Comparison
of
strength
and displacement
capacity
consequently
is
based
on extrapolation
of
the
PCM
wall
results.
This
is done
by
application of
the
prediction
procedure presented
in Chapter 8 which
was
verified and calibrated
against
the Series 3 wall
testing. Specifically,
two
predictions have been carried out
for
f'
^:
25 MPa,
l*
:
2.4
m, br:
0.14
m,
tr :6.0
m:
(PCM-I)
N: 640
kN
and Yn:272
kN which
was
achieved
by a
prestress-
ing
steel
area
of
Ao,
:
l115 mm2, and
(PCM-2)
N
:
250
kN
and
Yn:
222
kN which
was
achieved
by
a
prestressing
steel
area of
A*
:
1075 mm2. The initial prestress
was
taken
Bs
t
:
956 MPa or
630/o of the
yield
strength,
E-:
20000 MPa, Eo,
:
190
GP4
\:
0.456 ffi,
t
,:
0.013
and
K:
1.06. Results of the
prediction
are
presented
in
Table
7.7. Figs. 7.23
to7.25
show
the
predictions
overlaid on the
experimental
force-displacement
curves
by
Priestley
and
Elder.
It
is noted that both
PCM-1
and
PCM-2
predictions
were based on confined
half height
masonry blocks,
CPl00. Only
PE2 had
confinement
plates
embedded,
in
this case in
full
height
masonry blocks, CP200.
Thus
comparisons
and
conclusions from Figs. 7.23
to 7.25
TABLE
7.6-Theoretical
and
experimental
results
for
PE and
53
walls
Wall N
lN:N/(f'mAg)
vn
Mn Au, *p
Y,r, *p
PEI 640
0.076
273 1632
50 0.E3
PE2
640
o.o76
273
1632
77 1.28
PE3
250
0.030
222 1332 89 r.48
s3-l
420 0.070
165
866 73 1.40
s3-2
206 0.045
t29
677
87
r.65
kfl
KN
kllm mm
o/o
TABLE
7.7-Theoretical
performance
of PCM walls for comparison
Wall
N
lp=N/(P.Ag)
vn Mn
Artn
Tu,*t
PCM.I
640
0.076
273 1632
58 0.97
PCM-2
250 0.030
222 1632
7l l.19
KN
KN klrlm mm
Vo
-184-
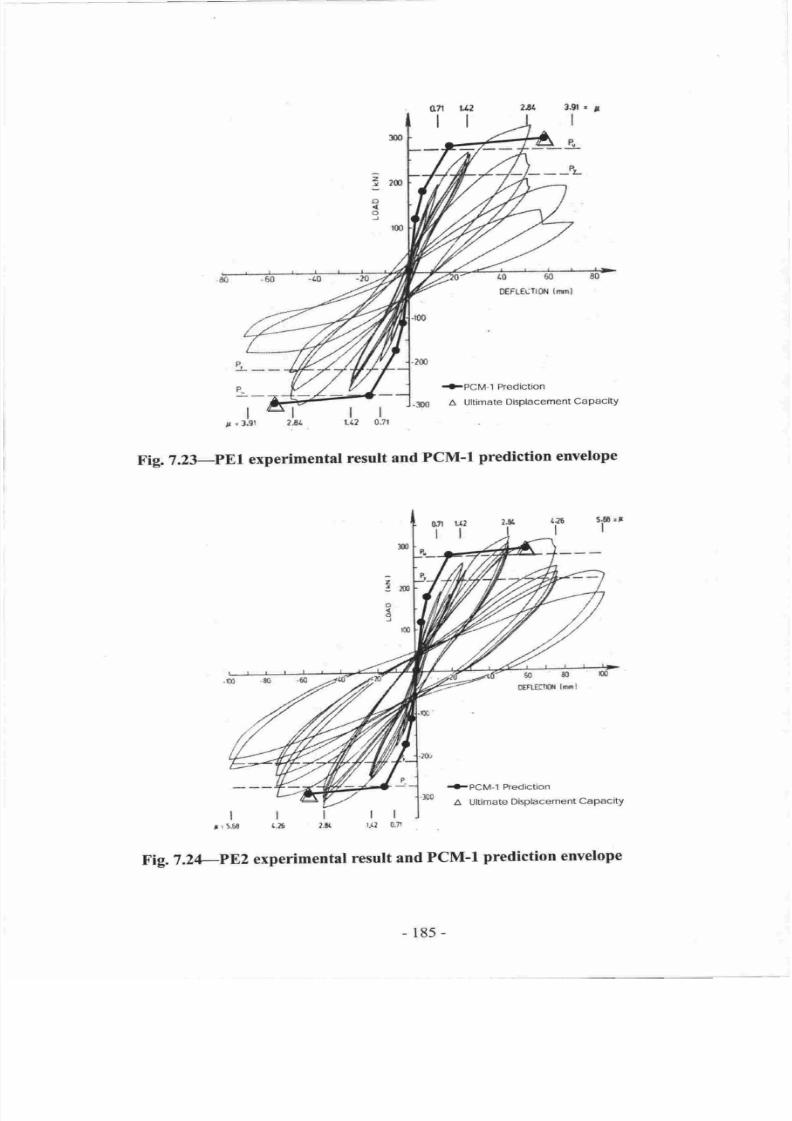
7/21/2019 PHD Laursen-masonry Prestressed Walls
http://slidepdf.com/reader/full/phd-laursen-masonry-prestressed-walls 211/308
l^l
,r
.l3l
?&
I
t(2
Fig.1.23-.PEl
experimental
result
and
PCM-I
prediction envelope
0rr
u2
ll
.+PCM-l
Prediction
A
Ultimate
Displacement
CaPaclty
lllll
r
.5.50 a.li l. a
t.LZ
0'n
Fig.7.2EPE2
experimental
result
and
PCM-I
prediction
envelope
I
o.7r
r0 60
DEFLEUII0.I
ln
nl
.m
-2m
+PCM-I
Prediction
-m
A
Ultimate
Displacement
Capacity
-185-
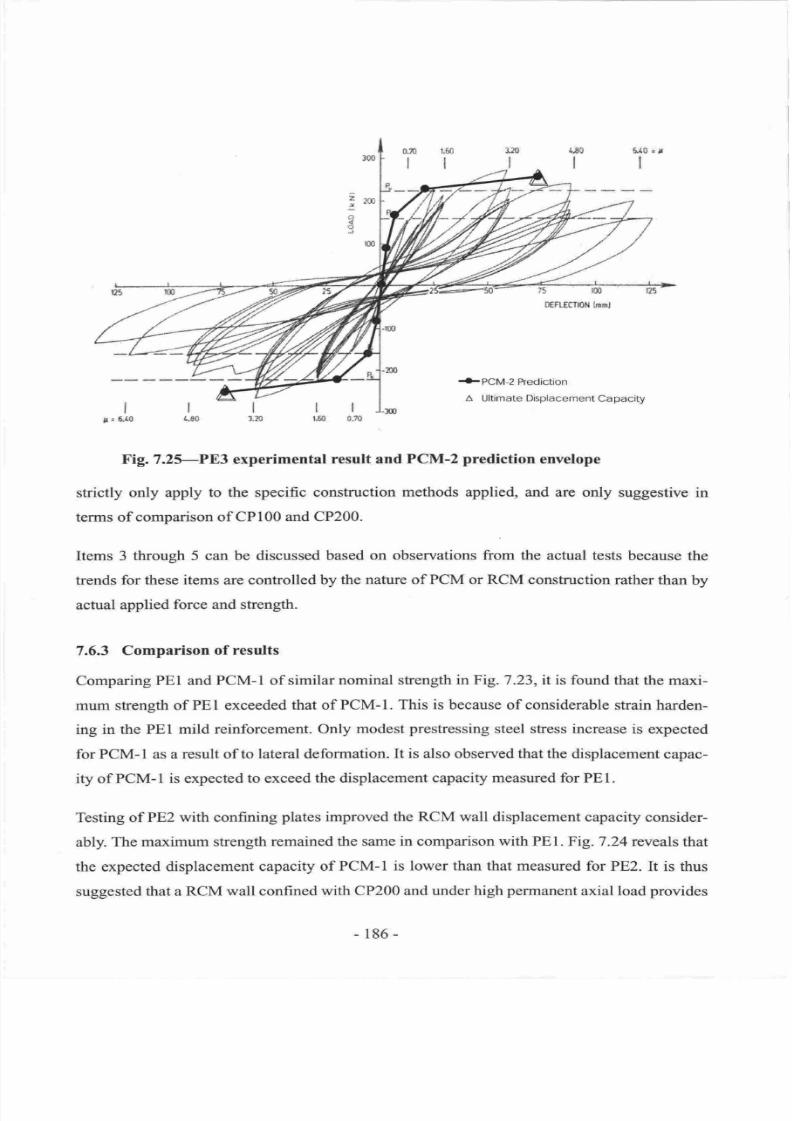
7/21/2019 PHD Laursen-masonry Prestressed Walls
http://slidepdf.com/reader/full/phd-laursen-masonry-prestressed-walls 212/308
on
l.m
rl
{-PCM-2
ftediction
A
Ultimate Displacement
Capacity
Fig.7.2 PE3 experimental
result and PCM-2
prediction
envelope
strictly only
apply
to
the specific
construction
methods applied,
and are
only
suggestive
in
tenns
of
comparison of
CPl00 and CP200.
Items 3
through 5 can be discussed based
on observations
from the
actual tests
because
the
trends
for these items are
controlled by
the nature
of PCM or RCM
construction
rather
than by
actual applied
force
and
strength.
7.6.3
Comparison
of results
Comparing PEI and
PCM-1 of similar
nominal strength
in
Fig.
7.23,it is found that
the maxi-
mum sfength of PEI exceeded
that of
PCM-1.
This
is
because
of
considerable
strain
harden-
ing
in
the
PEI mild reinforcement.
Only
modest
prestressing
steel stress increase
is
expected
for PCM-l
as
a
result of
to lateral deformation.
It is also observed that the
displacement
capac-
ity of
PCM-l is expected
to exceed
the displacement capacity measured for PE1.
Testing
of PE2
with
confining
plates
improved
the RCM wall displacement
capacity
consider-
ably.
The maximum
strength
remained the same
in
comparison
with
PE1.
Fig. 7.24
reveals that
the expected
displacement
capacity of
PCM-I
is
lower
than
that measured
for
PE2. It is thus
suggested
that
a
RCM
wall
confined
with
CP200 and under high
permanent
axial load
provides
ll
160
0m
-
186 -
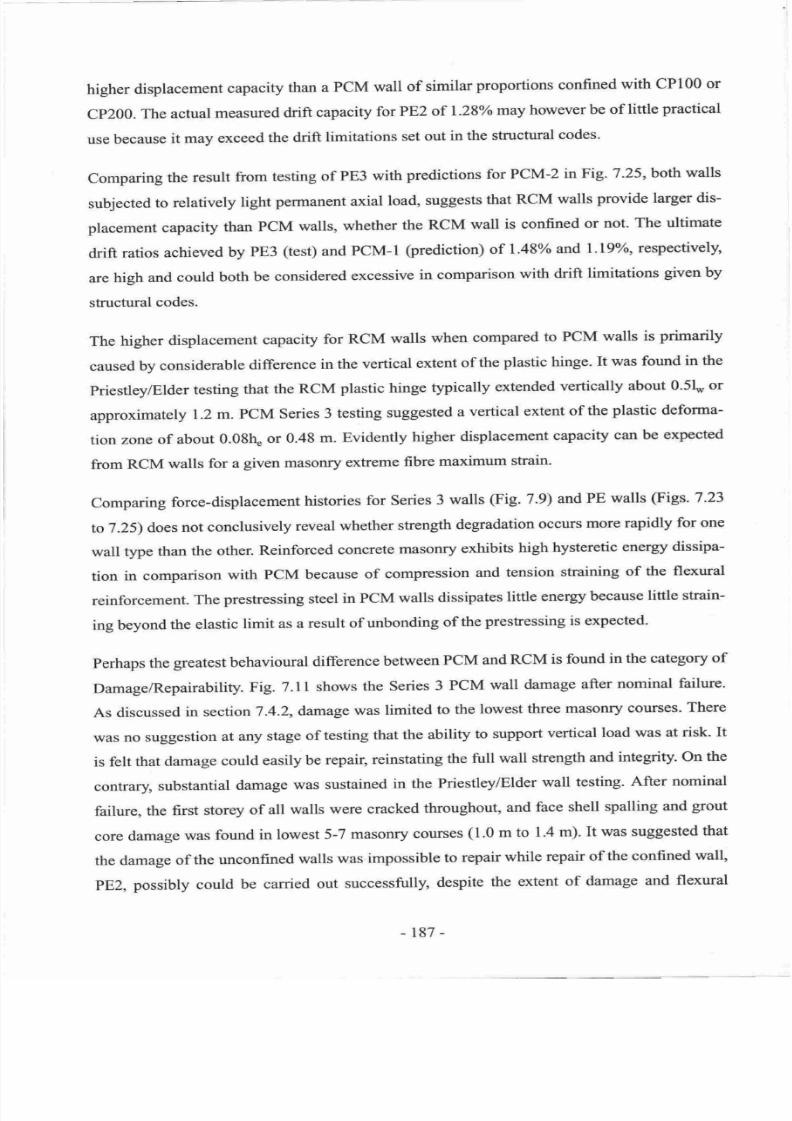
7/21/2019 PHD Laursen-masonry Prestressed Walls
http://slidepdf.com/reader/full/phd-laursen-masonry-prestressed-walls 213/308
higher
displacement
capacity
than a
PCM
wall
of
similar
proportions confined
with CPl00
or
Cp200.
The
actual
measured
drift
capacity
for
PE2
of
1.28
may
however
be
of
little
practical
use because
it may
exceed
the drift
limitations
set
out
in the
structural
codes.
Comparing
the result
from
testing
of
PE3
with
predictions
for
PCM-2
in
Fig.
7.25, both
walls
subjected
to
relatively
light
permanent
axial
load,
suggests
that
RCM
walls
provide larger
dis-
placement
capacity
than
pCM
walls,
whether
the
RCM
wall
is confined
or
not.
The ultimate
drift
ratios
achieved
by
pE3
(test)
and
PCM-I
(prediction)
of
1.48
and
Ll9olo,
respectively,
are
high
and
could
both
be
considered
excessive
in comparison
with
drift
limitations
given by
structural
codes.
The
higher
displacement
capacity
for
RCM
walls
when
compared
to PCM walls
is
primarily
caused
by
considerable
difference
in the
vertical
extent
of
the
plastic hinge.
It was
found
in
the
priestley/Elder
testing
that the
RCM
plastic hinge
typically
extended
vertically
about 0.51*
or
approximately
l.Zm.
pCM
Series
3 testing
suggested
a
vertical
extent
of
the
plastic
deforma-
tion
zone of
about
0.0Stt
or
0.48
m.
Evidently
higher
displacement
capacity
can be
expected
from
RCM
walls
for a
given
masonry
extreme
fibre
maximum
strain.
Comparing force-displacement histories
for
Series
3
walls (Fig.
7.9)
and
PE
walls
(Figs.
7.23
to7.Z1)does
not conclusively
reveal
whether
strength
degradation
occurs
more
rapidly
for one
wall
type
than
the other.
Reinforced
concrete
masonry
exhibits
high
hysteretic
energy
dissipa-
tion
in
comparison
with
pCM
because
of compression
and
tension
straining
of
the
flexural
reinforcement.
The
prestressing steel
in
PCM
walls
dissipates
little
energy
because
little
strain-
ing
beyond
the elastic
limit
as
a result
of
unbonding
of
the
preshessing
is
expected.
perhaps the greatest
behavioural
difference between
PCM
and
RCM
is found
in
the category
of
Damage/Repairability.
Fig.
7.1I
shows
the Series
3
PCM
wall
damage
after
nominal
failure.
As
discussed
in
section7.4.2,damage
was limited
to the
lowest
three
masonry
courses.
There
was
no suggestion
at
any
stage
of
testing
that the
ability
to
support
vertical
load
was at
risk.
It
is
felt that
damage
could
easily
be
repair,
reinstating
the
full
wall
strength
and
integriry.
On
the
contrary,
substantial
damage
was
sustained
in the
Priestley/Elder
wall
testing.
After
nominal
failure,
the
first storey
of
all walls
were
cracked
throughout,
and
face
shell
spalling
and
grout
core
damage
was
found
in
lowest 5-7
masonry
courses
(1.0 m
to
1.4
m).
It
was
suggested
that
the
damage
of
the unconfined
walls
was
impossible
to repair
while
repair
of
the confined
wall,
pE2,
possibly could
be carried
out
successfully,
despite
the
extent
of
damage
and
flexural
-t87-
7/21/2019 PHD Laursen-masonry Prestressed Walls
http://slidepdf.com/reader/full/phd-laursen-masonry-prestressed-walls 214/308
cracking. Clearly
post-earthquake
damage repair is much simpler for
PCM because of the
lim-
ited
damage
extent
and virtually non-existing flexural cracking.
7.6.4
Conclusions
from
comparison of
PCM
with
RCM
testing
Conclusions
of the PCM vs.
RCM
comparison
can
for
masonry
walls of similar
dimensions,
masonry
material
properties
and strength be summarised
in:
(l)
RCM
walls are expected
to
exhibit
larger
displacement
capacity
than PCM
walls because of
longer plastic
hinge length.
(2)
PCM walls are expected
to sustain
much less and more localised
damage during
strong
ground
motion
than RCM walls, thus
simpler and
more
economical
post-earthquake
repair.
(3)
Both
PCM and
RCM walls with confining
plates
are likely
to exhibit drift capacities in excess
of drift
limitations
for masonry walls
given
by
structural codes.
It
is reiterated that the above
conclusions
are based on experiments with significant differences
in the
material
properties
and structural dimensions, underlining
the
suggestive nature
of the
above
comparison.
7.7
CONCLUSIONS
It
is
concluded
that PCM walls
of
realistic
proportions,
strengthened
in
the
flexural
compres-
sion
zones
with
confining
plates,
can successfully
withstand severe
cyclic
loading imposed
by
an earthquake.
Ductile response was measured
with reliable
drift
capacity
of
I.5 .
Only
localised damage
occurred,
as shown in Fig. 7.11,
making
earthquake damage simple
to
repair.
All
visual damage
occurred to the
lowest
300400
mm in the flexural
compression zone.
This is supportedbythevertical
strainplots
shown
in Figs.7.l5
and
7.16and
Table
7-5,that
suggest
inelastic
masoffy
response
in
the lowest
400-600
mm
of
the
walls.
Relatively
little energy dissipation
was
observed
during cycling of the walls.
Tendon
force loss
was
not
recorded.
Measurements
at nominal flexural
strength
suggest an extreme masonry fibre
strain in
the
order
of 0.0010
to 0.0020, values substantially
lower than 0.008 stipulated
by NZS
4230:1990
lT4lfor
confined
masonry.
At
maximum
wall
strength,
average
strains
of
0.0066-0.0080 were
measured.
At
ultimate displacement,
average
measured
strains
in the
extreme fibre were
as
-
188
-
7/21/2019 PHD Laursen-masonry Prestressed Walls
http://slidepdf.com/reader/full/phd-laursen-masonry-prestressed-walls 215/308
high
as 0.019-0.024.
At
this
stage
the
exheme
masonry
fibres
no
longer
carried
axial
load as
face
shetl
spalling
had occurred.
It
was
concluded
that
adequate
shear
friction
between
walt
and
foundation
was
provided
by
intentional
roughening
of the
wall to
foundation
interface
Comparison
between
pCM
and RCM
walls
suggested
that
RCM
walls are
expected
to
exhibit
larger
displacement
capacity
than
PCM
walls
because
of
longer
plastic
hinge
length,
that PCM
walls
are
expected
to sustain
much
less
and
more
localised
damage
during
strong
ground
motion
than
RCM
walls,
thus simpler
and
cheaper
post-earthquake
repalr, and
finally
that bottl
pCM
and
RCM
walls
with
confining
plates
are
likely
to
exhibit
large
drift
capacities
which
may
be
in
excess
of drift
limitations
for
masonry
walls
given
by snuctural
codes.
- 189-
7/21/2019 PHD Laursen-masonry Prestressed Walls
http://slidepdf.com/reader/full/phd-laursen-masonry-prestressed-walls 216/308
7.8
REFERENCES
[7-l]
AS 1311-1987, Steel tendons
for
prestressed
concrete
-
7-wire
stress-relieved
steel
strandfor
tendons
in
prestressed concrete, Standards
Aushalia,
Homebush,
NSW, Aus-
tralia.
[7-2]
Rahman,
A.M.
and
Restepo, J.I.
2000),
Earthquake
Resistant
Concrete Buildings:
Seismic
Performance of
Cantilever
Walls
Prestressed
Using
Unbonded Tendons,
Research Report
2000-05, Department of Civil
Engineering,
University of Canterbury,
Christchurch, New Zealand.
[7-3]
Holden,
T.J.,
A
Comparison
of the Seismic Performance
of
Precast
Wall Construction:
Emulation
and
Hybrid
Approaches, Research
Report 2001-04,
Deparhnent
of
Civil
Engineering,
University of Canterbury,
Christchurch, New Zealand,.
[74]
NZS
4230:1990, Code of Practice
for
the Design
of Masonry Structures,
Standards
Association of
New
Zealand,1990,
Wellington.
[7-5]
Priestley, M.J.N. and
Elder, D.
McG.,
Cyclic Loading Tests
of Slender Concrete
Masonry
Shear
Walls, Bulletin of the
New Zealand
Society for Earthquake Engineering,
Vol.
15,
No.
l, March 1982,pp.3-21.
-190-
7/21/2019 PHD Laursen-masonry Prestressed Walls
http://slidepdf.com/reader/full/phd-laursen-masonry-prestressed-walls 217/308
Chapter
8
ANALYSIS
AND
DESIGN
8.
PREDICTION
OF
WALL
IN-PLAIIE
BEHAVIOUR
This
chapter
considers
the
in-plane
flexural
response
of
post-tensioned
concrete
masonry
can-
tilever walls
with
un-bonded
prestressing
tendons,
where
the
lateral
force
is assumed
to
be
act-
ing at
the
top of
the
wall
or
at some
effective
height
tr .
For
other structural
shapes
and
loading
configurations,
the
formulae
should
be
mod ified
accordingly.
Note
that
the
term
'tendon'
in the
following
refers
to both
prestressing
strands
and
bars.
The
present chapter
is concerned
with
analytical
methods
for
prediction
of
the
in-plane
force-
displacement
relationship
for
unbonded
post-tensioned
concrete
masonry.
The scope
of
such
methods
is
to
describe
the
wall
behaviour
throughout
the entire
loading
range,
including
non-
linear
large
displacement
response
that can
be anticipated
in
a seismic
event.
Two
approaches
of
various
complexities
have been
investigated:
(
I
)
Flexure/Rocking
model
(2)
Finite
Element
model
Method
(l)
represents
a simple
approach based
on ordinary flexural theory
@lane sections)
where
integration
of
curvature
along
the
wall
height
can
be
applied
to determine
the
wall
lat-
eral
displacement
and
vertical
deformation.
In
the
large
displacement
range
a
rigid body
rock-
ing
analogy
is
used
to
describe
the
behaviour.
This
method
largely
focuses
on
establishing
analytical
expressions
based
on equilibrium
and
first
engineering
principles
that can capture
pCM
response
with
reasonable
accuracy.
The
prediction formulae
can
be
used
for
limit state
design
as
well
as
for establishing
the
most likely
force-displacement
relationship
(continuous)
for
use
in
non-linear
numerical
analysis.
This
approach
is
the
primary
focus
in
this
chapter.
Method
(2):
The
Finite
Element
Model
(FEM)
technique
supplements
method
(l)
and
is
partic-
ularly
useful
for
modelling
of
the
wall
internal
force
flow
in
the regions
of
force
concenfra-
l9l
-
7/21/2019 PHD Laursen-masonry Prestressed Walls
http://slidepdf.com/reader/full/phd-laursen-masonry-prestressed-walls 218/308
tions,
notably in the wall compression
toe. The suitability
of using FEM
fibre
elements
for
modelling of PCM
in-plane
response
is investigated in Chapter
9
in
conjunction
with
dynamic
analysis.
A
third
method is
the
strut
and
tie
methodology, with which the wall intemal
force
flow
can be
analysed.
This method is in
particular
useful for analysis of walls
with openings
and
walls
of
unusual
shape where the force flow
cannot easily be described
by
method
l).
As
all
walls
investigated
in this
document
were rectangular and
without
openings,
pursuing
this method
for
analysis
was not
considered
merited
in this document.
8.1
FLEXURAL
RESPONSE
OF
CANTILEVER WALLS
It is assumed for
flexural
calculations
that
plane
sections remain
plane,
i.e.
there is
a
linear
strain distribution
across the wall
lenglh. This assumption enables, using
first engineering
prin-
ciples, calculation
of
strength, stiffrress
and displacement, and
implies distributed
cracking
up
the wall
height. From laboratory
wall tests
Chapters
5, 6 and 7) it
was observed
that the PCM
wall flexural
response was
primarily
due
to rocking
where
a crack opened
at the base,
and that
distributed
flexural cracking was non-existing.
This type
of
rocking
behaviour is attributed
to
prestressing
with
unbonded tendons. Despite this discrepancy between
theory
and
observation,
it
appears
that the assumption of
plane
section
response with distributed
wall cracks
provides
sufficiently
accurate design rules.
8.1.1
Limit
states
The flexural design
procedure
should be
based on
Limit
State
Design,
as outlined
by NZS
4203:1992
[8-1],
which
identifies nvo
limit
states,
namely the
Serviceability Limit State
SLS)
and
the Ultimate
Limit
State
ULS).
The serviceability
limit
state
generally
deals
with
function
of the structure subjected
to normal
occupancy
loads
service
loads).
It
enswes
durability
and
comfonable
occupancy of
the structure,
by e.g. crack
limitation
or limitation
of deflection- The
criteria
for the ultimate
limit
state
relate to the strength and stability
of
a
structure. This limit
state is
reached when the structure or
a
part
of
it
reaches
its
ultimate
capacity
and
fails
to sup-
port
further
loading. These
limit
states
generally
need to
be evaluated immediately
after
pre-
stressing
transfer
and
after
long term losses
refer
to Chapter
4).
Moreover, structures designed
to
withstand earthquake
loading
in
a
ductile
manner should
be
designed
according
to the capacity design
principle,
an extension
of ultimate
limit state design.
-r92-
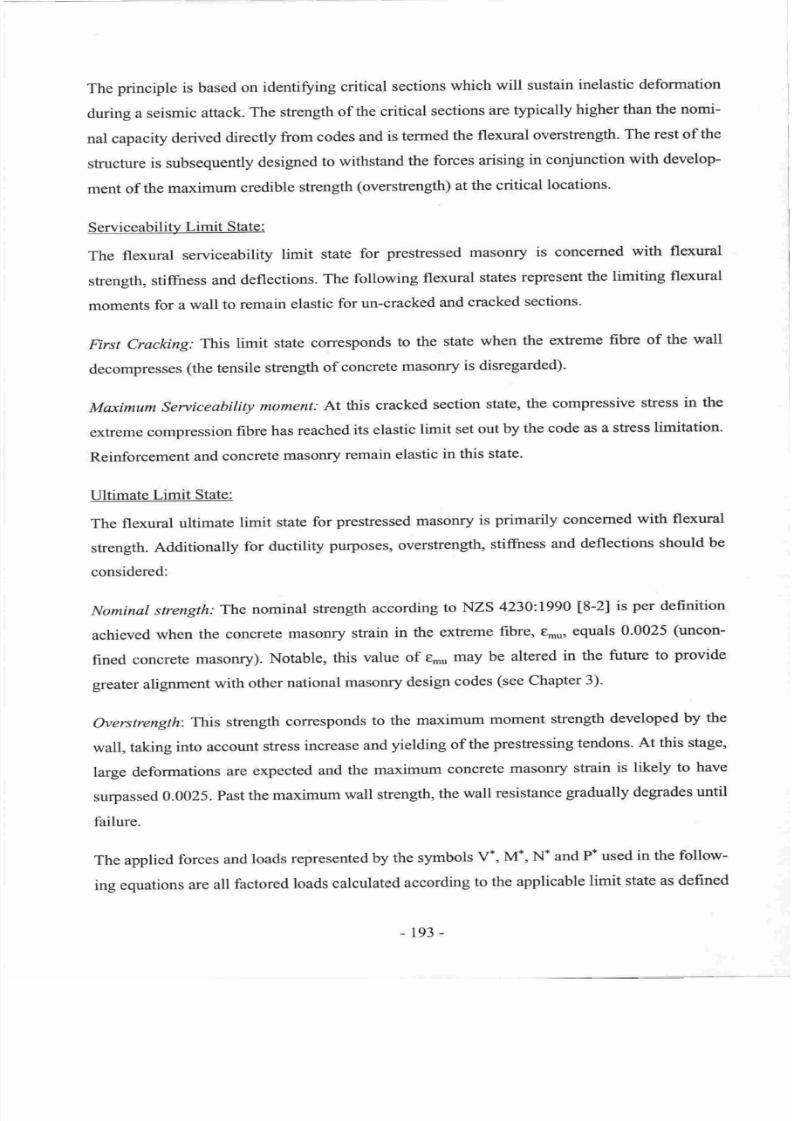
7/21/2019 PHD Laursen-masonry Prestressed Walls
http://slidepdf.com/reader/full/phd-laursen-masonry-prestressed-walls 219/308
The
principle
is based
on identiffing
critical
sections
which
will sustain
inelastic
deformation
during
a seismic
attack.
The strength
of
the critical
sections
are
typically
higher
than the nomi-
nal capacity
derived
directly
from codes
and
is termed
the
flexural
overstrength.
The rest of the
sfucture
is subsequently designed
to withstand
the forces
arising
in
conjunction
with
develop-
ment of
the
maximum
credible
strength
(oversfiength) at
the
critical
locations.
Serviceability
Limit
State
:
The
flexural
serviceability
limit state
for
prestressed
masonry
is
concerned
with flexural
strength,
stiftress
and
deflections.
The
following
flexural
states
represent
the
limiting
flexural
moments
for
a
wall
to remain
elastic
for un-cracked
and
cracked
sections
First
Cracking:
This
limit state
corresponds
to
the
state
when
the extreme
fibre
of the
wall
decompresses
(the
tensile
strength
of
concrete
masonry
is disregarded).
Maximum
Serviceability
momenf..At
this cracked
section
state,
the
compressive
stress
in the
extreme
compression
fibre
has
reached
its elastic
limit
set out
by
the
code
as a sffess
limitation.
Reinforcement
and
concrete
masonry
remain
elastic
in
this
state.
Ultimate
Limit
State:
The
flexural
ultimate
limit state
for
prestressed masonry
is
primarily concemed
with flexural
strength.
Additionally
for
ductility
purposes, overstrength,
stiffitess
and
deflections
should be
considered:
Nominal
strength:
The
nominal
strength
according
to NZS
4230;1990
[8-2J
is
per
definition
achieved
when
the
concrete
masonry
strain
in
the
extreme
fibre,
e*u,
equals
0.0025
(uncon-
fined
concrete
masonry).
Notable,
this
value of
rn.,u
may
be
altered
in
the
future
to
provide
greater alignment
with
other
national
masonry
design
codes
(see
Chapter
3)
Overstrengf1:
This
strength
corresponds
to the
maximum
moment
strength
developed
by
the
wall,
taking
into
account
shess
increase
and
yielding
of
the
prestressing
tendons.
At this
stage,
large
deformations
are
expected
and
the maximum
concrete
masonry
strain
is likely to
have
surpassed
0.0025.
past
the
maximum
wall
strength,
the
wall
resistance
gradually
degrades
until
failure.
The applied
forces
and
loads
represented
by the
symbols
V*,
M*,
N and
P used
in the
follow-
ing
equations
are
all
factored
loads
calculated
according
to the
applicable
limit
state as defined
-r93-
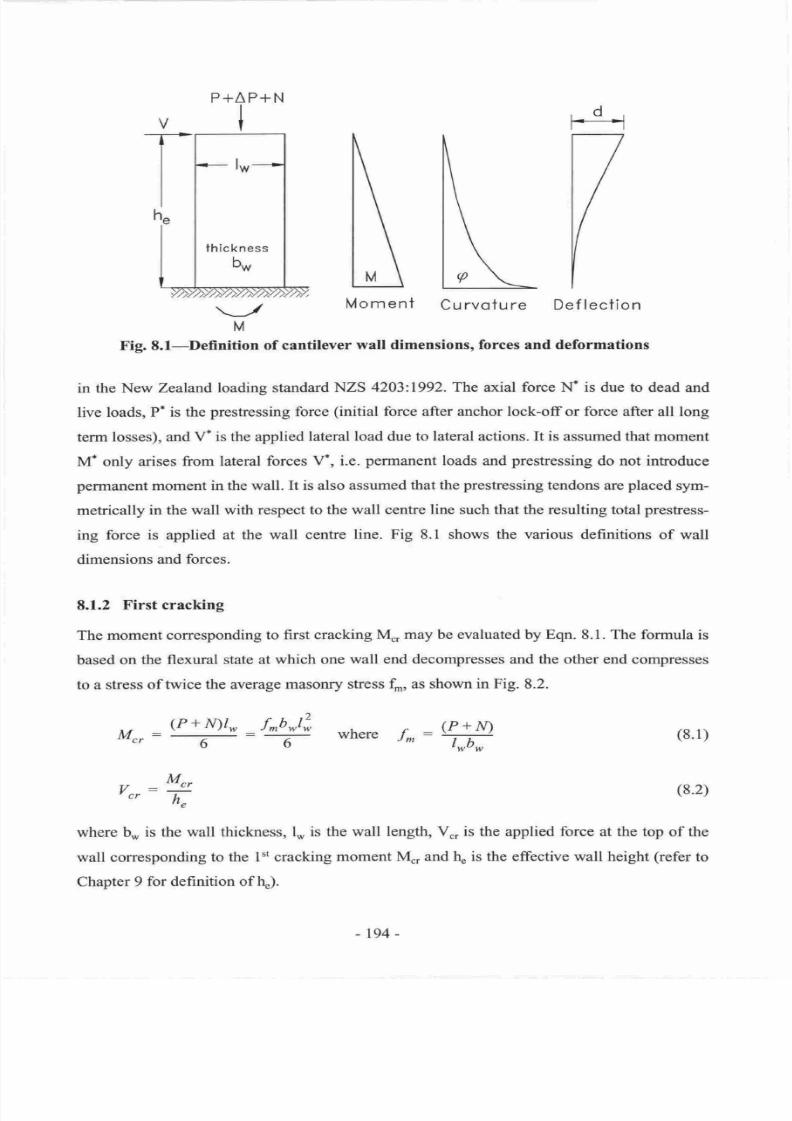
7/21/2019 PHD Laursen-masonry Prestressed Walls
http://slidepdf.com/reader/full/phd-laursen-masonry-prestressed-walls 220/308
,dl
7
t/
V
I
Def lection
\
N
u rvoiu re
\
t\
[, \
Moment
M
Fig. 8.I-Definition
of
cantilever
wall
dimensions,
forces
and deformations
in
the
New
Zealand
loading standard
NZS
4203:1992.The
axial
force N'is
due to dead
and
live
loads, P' is
the
prestressing
force
(initial
force after anchor lock-offor force after
all long
term losses), and
V'
is the
applied
lateral
load due to lateral actions.
It
is
assumed
that
moment
M.
only
arises
from lateral forces
V', i.e.
pennanent
loads
and
prestressing
do not introduce
permanent
moment
in the wall.
It is
also
assumed
that the
prestressing
tendons
are
placed
sym-
metrically
in
the
wall with respect
to the
wall
centre
line
such
that
the resulting total
prestress-
ing
force
is
applied at the
wall
centre
line.
Fig 8.1 shows the various definitions
of
wall
dimensions
and forces.
8.1.2
First cracking
The
moment corresponding
to first
cracking
N4, may be evaluated
by
Eqn.
8.1. The formula
is
based
on
the
flexural
state
at
which
one
wall
end
decompresses
and the
other
end compresses
to a
stress
of
nvice the average
masonry
stress
t,
as shown in Fig. 8.2.
=M
where
f*:
(P+
/\r)
l*b.
(8.1)
(8.2)
where
b*
is
the
wall
thickness,
1,,
is the
wall
length,
V.,
is the applied force at
the
top
of
the
wall
corresponding
to the l't cracking
moment
M , and tq is the effective wall
height
(refer
to
Chapter
9
for definition of
h.).
thickness
bw
-r94-
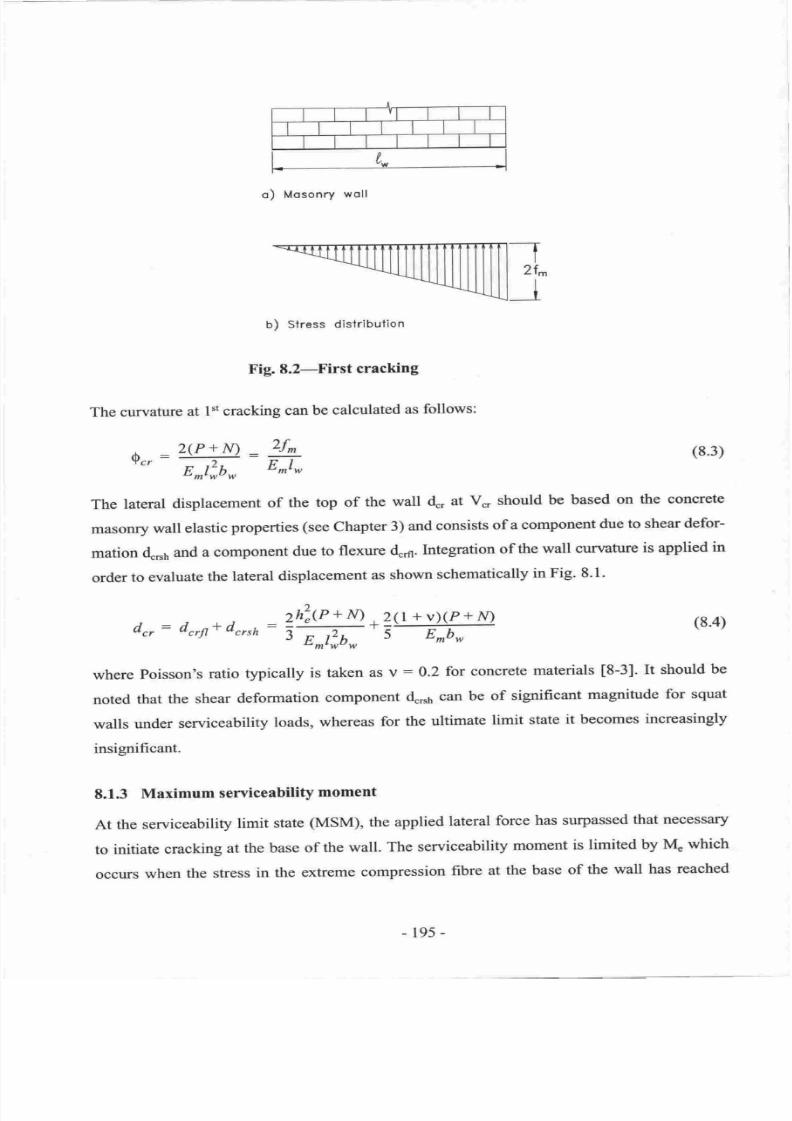
7/21/2019 PHD Laursen-masonry Prestressed Walls
http://slidepdf.com/reader/full/phd-laursen-masonry-prestressed-walls 221/308
o)
Mosonry
woll
b)
Stress
dislribulion
Fig.
8.2-First
cracking
The
curvature
at
I't cracking
can
be
calculated
as
follows:
r _
2(P+1\r)
_
2f^
Ycr)Dl
E^l;b*
Lm'w
(8.3)
The lateral
displacement
of
the
top
of
the
wall
d",
at
V.,
should
be
based
on the
concrete
masoffy
wall
elastic
properties
(see
Chapter
3)
and
consists
of
a
component
due
to shear
defor-
mation
4*n
and
a component
due
to
flexure
d..n.
Integration
of
the
wall
curvature
is applied
in
order
to
evaluate
the
lateral
displacement
as
shown
schematically
in
Fig' 8'1'
d,,
:
d,,lt*
d",,h
=
i4:;
*
2(r
+:) r
+
ro
3
rpjU*
5
E^b*
(8.4)
where
poisson's
ratio
typically
is taken
as
v
:
0.2
for
concrete
materials
t8-31-
It
should
be
noted
that
the
shear
deformation
component
d",r1,
can
be
of significant
magnitude
for squat
walls
under
serviceability
loads,
whereas
for
the
ultimate
limit
state
it becomes
increasingly
insignificant.
8.1.3
Maximum
serviceability
moment
At
the serviceability
limit
state
(MSM),
the
applied
lateral
force
has
surpassed
that
necessary
to
initiate
cracking
at
the base
of
the
wall.
The
serviceability
moment
is
limited
by
M" which
occgrs
when
the
stress
in the
extreme
compression
fibre
at
the base
of
the wall
has
reached
-t95-
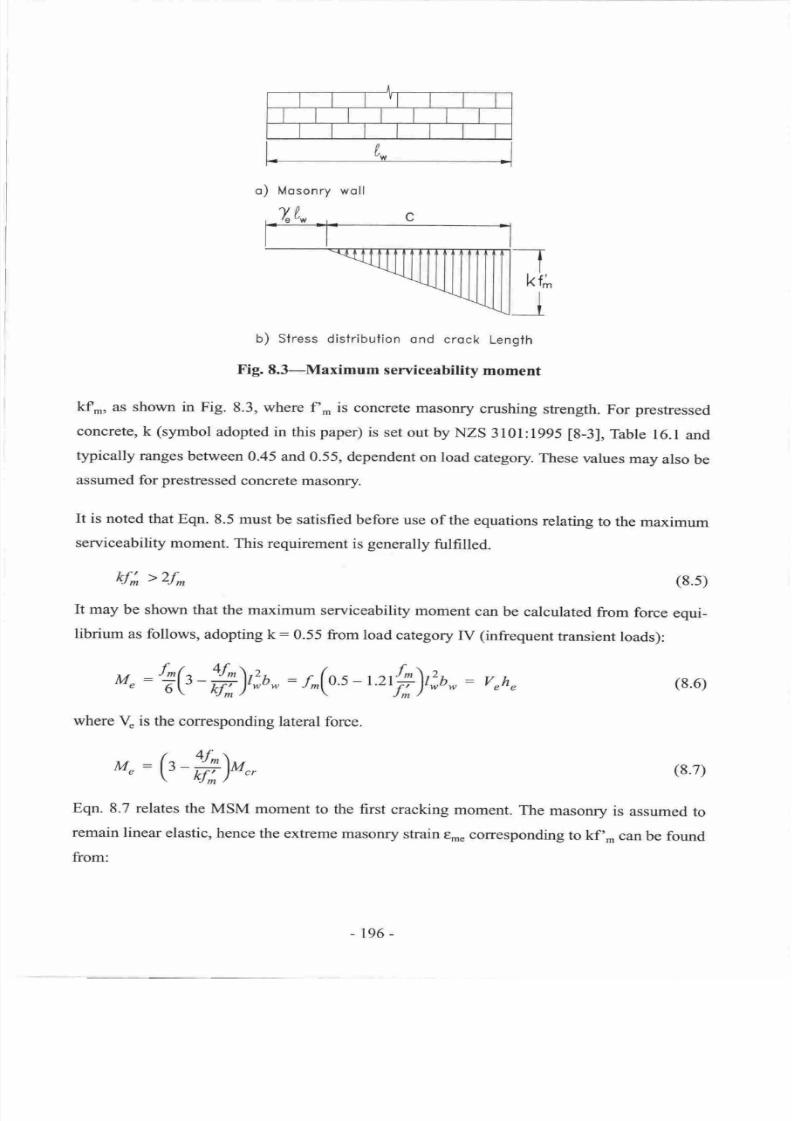
7/21/2019 PHD Laursen-masonry Prestressed Walls
http://slidepdf.com/reader/full/phd-laursen-masonry-prestressed-walls 222/308
o)
Mosonry
woll
b)
Slress
distribution
ond
crock
Lengfh
Fig.
8.}-Maximum
serviceability
moment
kf*
as
shown
in
Fig.
8.3, where
f,n
is concrete
masonry
crushing
stength.
For
prestressed
concrete,
k
(symbol
adopted in this
paper)
is
set
out by
NZS
3101:1995
[8-3],
Table
16.l
and
typically
ranges
between
0.45
and 0.55, dependent
on load
category.
These
values
may
also be
assumed for
prestressed
concrete masonry.
It
is noted
that
Eqn. 8.5
must
be satisfied
before
use of
the
equations
relating
to the
maximum
serviceability
moment.
This requirement
is
generally
fulfilled.
kf;
>2f^
It
may be
shown that
the
maximum
serviceability
moment
can
be calculated
from
force
equi-
librium
as follows,
adopting
k: 0.55
from
load
category
tV
(infrequent
transient
loads):
(8.5)
(8.6)
(8.7)
M
:+(t
-#),ir-
:
r^(os
-r
ufi)tlb*
:
rt h
where
V is the
corresponding
lateral force.
M,:
(t-#)r ,
Eqn.
8.7 relates
the MSM
moment
to the
first cracking
moment.
The
masonry
is
assumed
to
remain
linear
elastic,
hence
the extreme masomy strain
€me
corresponding to
kf',n
can
be
found
from:
196
-
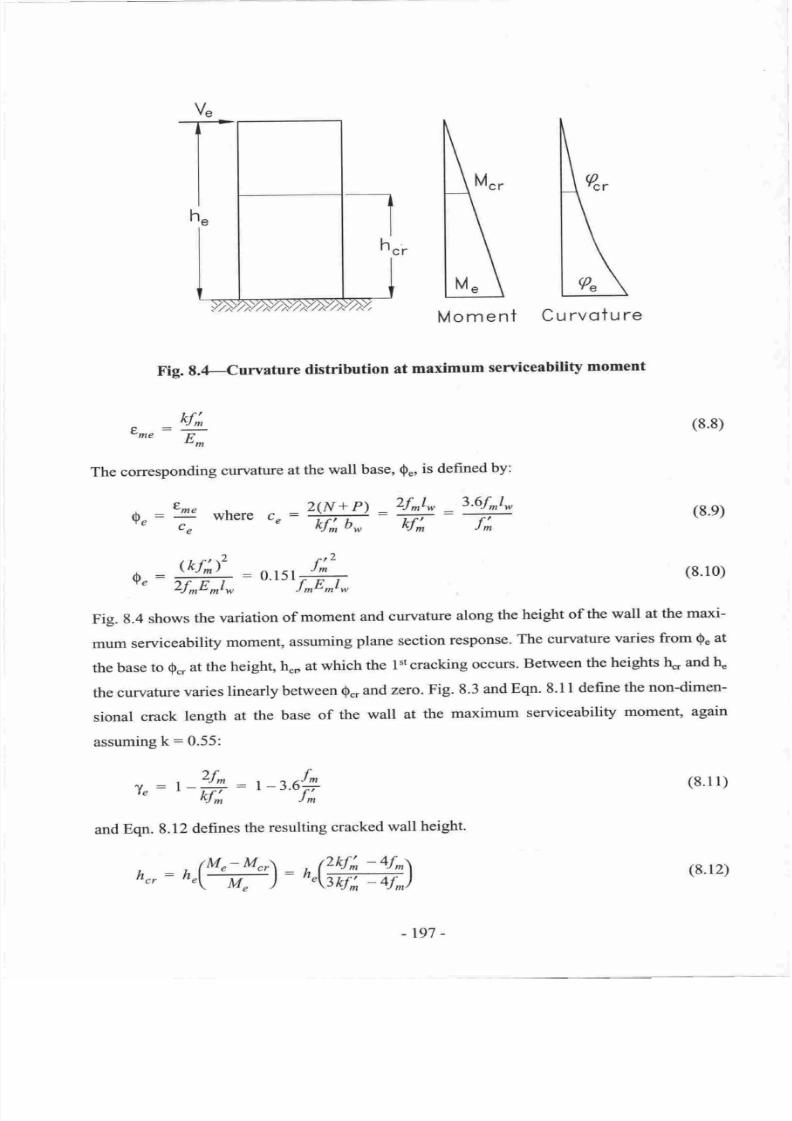
7/21/2019 PHD Laursen-masonry Prestressed Walls
http://slidepdf.com/reader/full/phd-laursen-masonry-prestressed-walls 223/308
Mo
me
nt
Cu
rvotu
re
Fig.
8,4-Curvature
distribution
st
maximum
serviceability
moment
kf;
::-
-me
F
"m
The corresponding
curvature
at
the
wall
base,
$",
is defined
by:
A"
=
T
where
c"
=
z(N+P)
_2f^lo
_
kf;
b*
kf;
3.6fnlw
T
M
(8.8)
(8.e)
(8.10)
(8.11)
Fig.
g.4
shows
the
variation
of
moment
and
curvature
along
the
height
of
the
wall
at
the malci-
mum
serviceability
moment,
assuming
plane
section
response.
The
curr'"ature
varies
from
$u
at
the
base
to
Q",
at
the height, h.o
at
which the
lst
cracking
occurs, Between
the
heights
h*
and
4
the
curvature
varies
linearly
between
0.,
md
zero.
Fig.
8.3
and
Eqn.
8.1
I
define
the
nondimen-
sional
crack
length
at
the
base
of
the
wall at
the maximum
serviceabilit5r
moment,
again
assuming
k:0.55:
q"=#,r-:o-^h
T":r'#=l-t*
and
Eqn.
8.12 defines the
resulting
cracked
wall
height.
h",:
o"W)=
r"(r
)
-t97
-
(8.12)
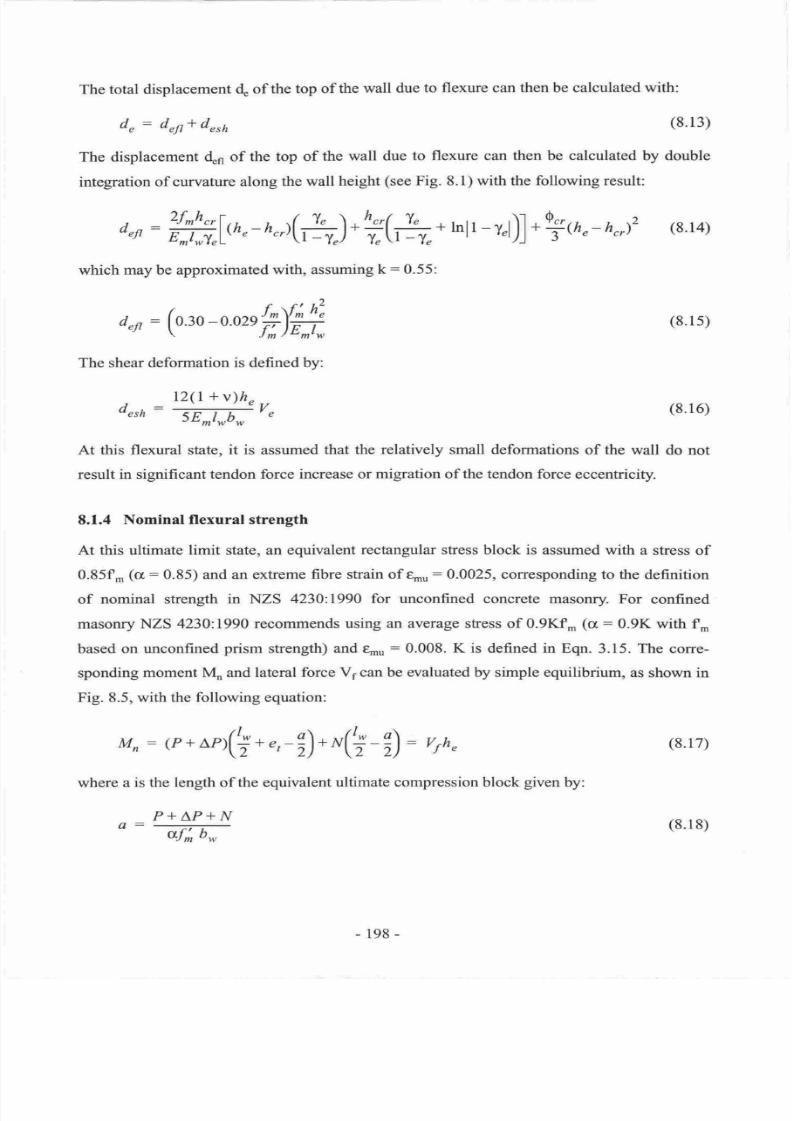
7/21/2019 PHD Laursen-masonry Prestressed Walls
http://slidepdf.com/reader/full/phd-laursen-masonry-prestressed-walls 224/308
The total displacement
d of
the top of
the
wall due
to flexure can then be calculated
with:
d
:
d It*
d rh
(8.13)
The displacement
4n
of the
top of
the wall
due to
flexure
can
then be calculated
by double
integration
of
curvature along the
wall
height
(see
Fig. 8.1) with the following result:
,
2f^h
a
rI
:
#l*
-
h
)(+ ).
?(h,.
which
may
be approximated
with,
assuming
k:0.55:
d rt:(o.m
-o.ozs*Y#,
The shear
deformation is defined
by:
d rh:'ffi'
Mn
:
(P
+
^P)(?
*
,-;).
-(+
-|)
:
,ro
where a
is the length
of
the equivalent
ultimate
compression
block
given
by:
P+AP+N
a:ffi
r,,lr
-rJ)]
.
Y,o
-
h ,)'
(8.14)
At
this flexural
state,
it
is assumed
that the relatively small deformations
of
the wall
do not
result
in significant tendon force
increase or
migration
of
the tendon
force
eccentricity.
8.1.4
Nominal flexural strength
At
this ultimate
limit
state, an equivalent
rectangular stess block is
assumed with a
stress of
0.85fn
(o:
0.85) and an
extreme
fibre strain
of e,ou:
0.0025,
corresponding
to
the
definition
of
nominal strength in
NZS
4230:1990
for
unconfined concrete masonry.
For
confined
masonry
NZS 4230:1990 recommends
using an average stess
of 0.9Kf.
(a
:
0.9K with
f,
based on unconfined
prism
strength)
and
e-u
:0.008.
K
is defined
in
Eqn.
3.15. The corre-
sponding
moment Mn and lateral
force
Vl
can
be evaluated
by simple equilibrium,
as shown
in
Fig. 8.5,
with the following equation:
(8.
l 5)
(8.16)
(8.17)
-198-
(8.1
8)
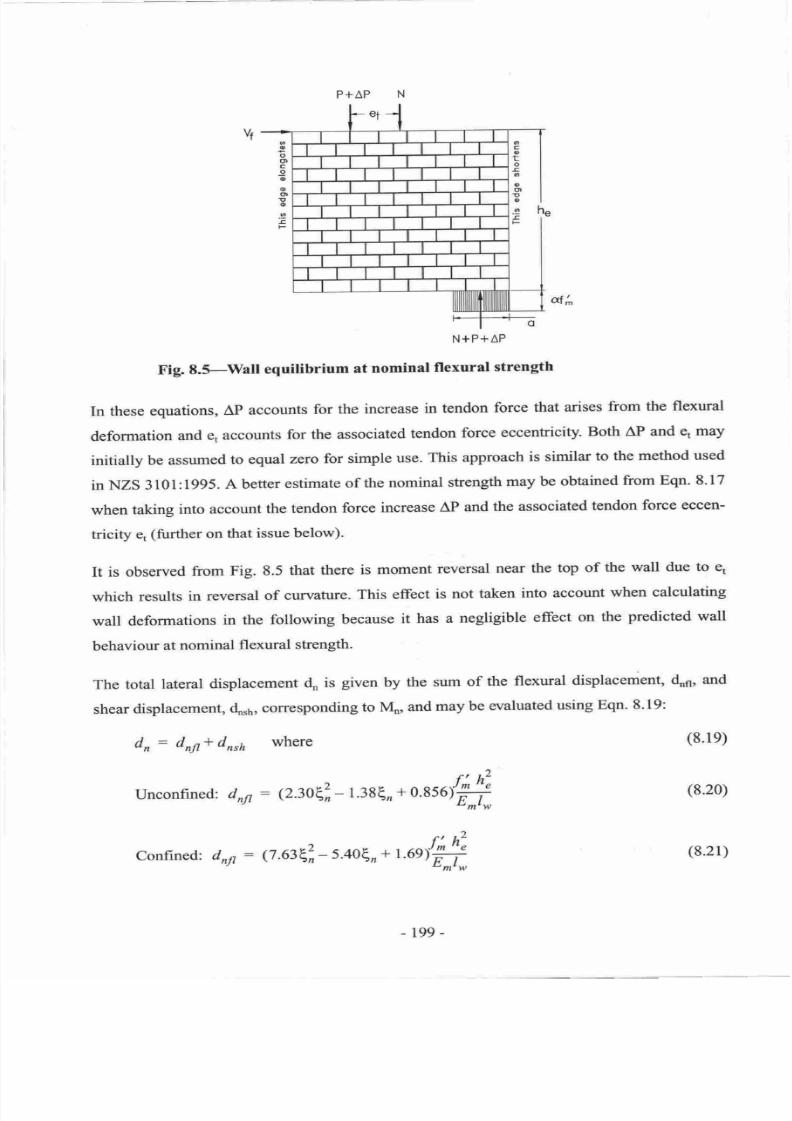
7/21/2019 PHD Laursen-masonry Prestressed Walls
http://slidepdf.com/reader/full/phd-laursen-masonry-prestressed-walls 225/308
o
o
o)
c
-9
o
o
ot
:(t
o
E
F
o
c
o
t
o
E
o
o
o
t
o
o
=
P+AP
df
i"
N+P+AP
Fig.
8.5-Wall
equilibrium
at nominal
flexural
strength
In
these
equations,
Ap
accounts
for
the
increase
in
tendon
force
that
arises
from
the flexural
deformation
and
e,
accounts
for the
associated
tendon
force
eccentricity.
Both
AP
and
er may
initially
be
assumed
to
equal
zero
for
simple
use.
This
approach
is similar
to
the
method used
in NZS
3101:1995.
A
better
estimate
of
the
nominal
strength
may
be
obtained
from
Eqn.
8.17
when
taking
into
account
the
tendon
force
increase
AP
and
the
associated
tendon
force
eccen-
tricity e.
(further on
that
issue
below).
It
is observed
from
Fig.
8.5
that
there
is moment
reversal
near
the
top
of
the
wall
due
to
e,
which
results
in
reversal
of
curvature.
This effect
is
not
taken
into
account
when calculating
wall
deformations
in
the
following
because
it
has
a
negligible
effect
on
the
predicted
wall
behaviour
at
nominal
flexural
strength.
The
total
lateral
displacement
d,,
is
given by the
sum
of
the
flexural
displacement,
doq,
and
shear
displacemeot,
4rr,,
corresponding
to
Mo,
and
may
be
evaluated
using
Eqn'
8'19:
d,
:
dnfl*
drrh
where
unconfine
d:
dn,
:
Q3oEl-
1.38€,,
+0.856#
Confined:
d
rlt
:
Q.$e1-
5.40q,,
*
r.unff
(8.1e)
(8.20)
-199-
(8.21)
7/21/2019 PHD Laursen-masonry Prestressed Walls
http://slidepdf.com/reader/full/phd-laursen-masonry-prestressed-walls 226/308
u.
I
I
I
I
\
def
ormed
shope
Fig.8.fWail deformation
at nominal flexural strength
I2(l
+
v)h
5Emlwb*
v1.
rrh
,
P+AP+N
a:-
>n
f;l*b*
(8.22)
(8.23)
Eqns.
8.20 and 8.21
were developed using
numerical
integration
and curve fitting,
and are thus
of an approximate
nature, and
are
valid for axial load
ratios,
L,
of
0.05
to
0.025.
The
extreme
fibre
strain
was taken
8s
enu
:
0.003
for
unconfined
concrete masonry
(consistent
with interna-
tional codes,
but not
NZS 4230)
and
0.008
for confined concrete masonry. Detailed
informa-
tion on
derivation of
these equations
may be found
in Appendix A.
The
total
tendon force
increase
AP
at
tmu
of
0.003
(or
0.008)
is
difftcult to
evaluate
for
pre-
stressed
walls with unbonded
tendons because
the tendon stress increase
depends on the defor-
mation
of
the entire wall between
points
of
anchorage.
However,
the
force
increase
(or
decrease)
in
each
tendon in the wall cross
section may be evaluated based
on
the
estimated wall
end
elongation, u ,
(tension
end)
and
shortening
(compression
end),
us,
assuming
a
linear
vari-
ation
of
vertical
deformation
across
the wall top as shown
in Fig.
8.6. The following equations
were established
for unconfrned
and confined
concrete masonry
(refer
to
Appendix A):
-200-
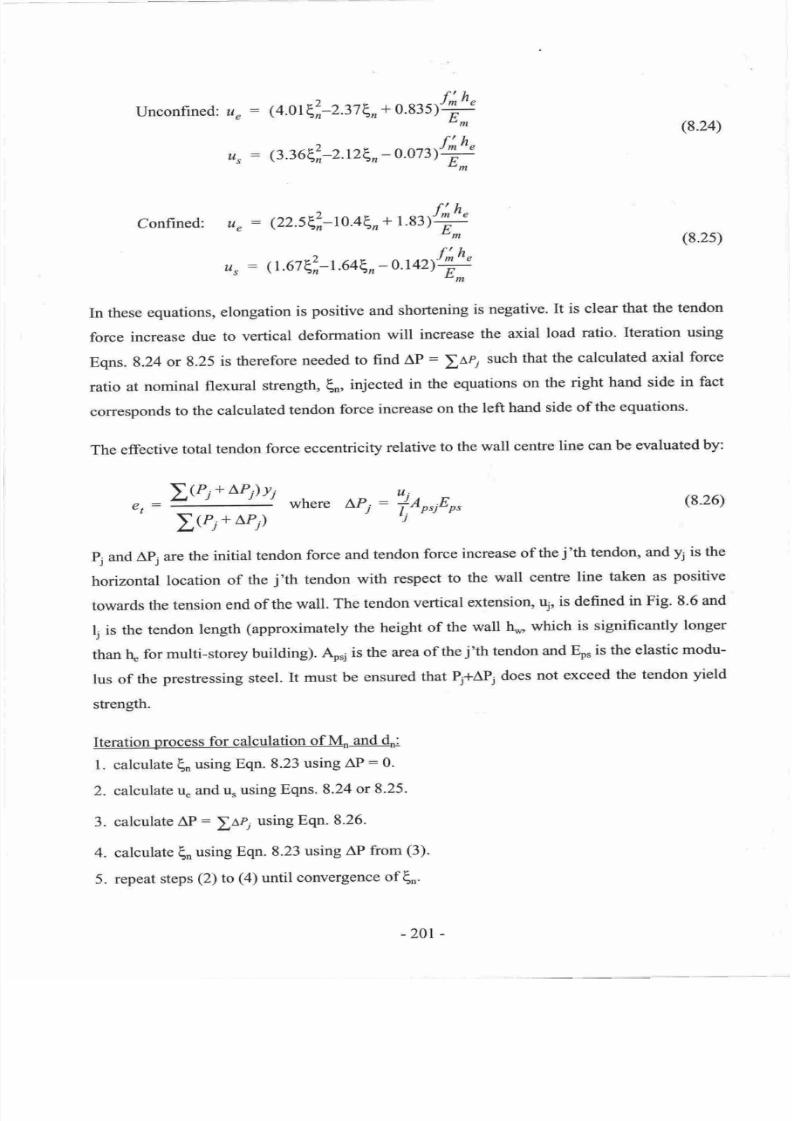
7/21/2019 PHD Laursen-masonry Prestressed Walls
http://slidepdf.com/reader/full/phd-laursen-masonry-prestressed-walls 227/308
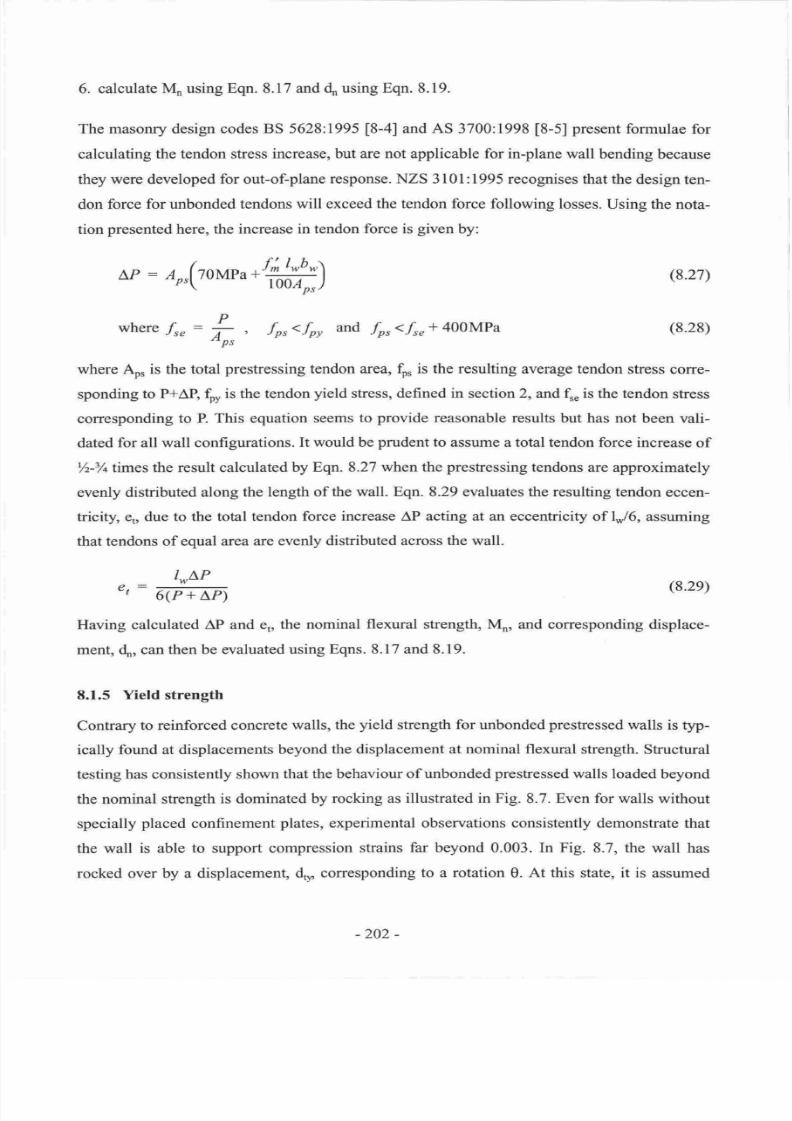
7/21/2019 PHD Laursen-masonry Prestressed Walls
http://slidepdf.com/reader/full/phd-laursen-masonry-prestressed-walls 228/308
6.
calculate
Mn using
Eqn.
8.17
and
do using
Eqn.
8.19.
The masonry design
codes
BS 5628:1995
[8-4]
and
AS
3700:1998
[8-5]
present
formulae
for
calculating
the tendon
stress
increase,
but
are
not applicable
for
in-plane
wall bending
because
they were
developed for out-of-plane
response.
NZS 3
I
01 : I
995
recognises
that
the
design
ten-
don
force for unbonded tendons
will
exceed the tendon force following losses.
Using the nota-
tion
presented
here,
the increase in tendon
force is
given
by:
L,P
:
Ao,
(8.27)
(8.28)
p
where
fr : t, ,
fpr<.fpy
and
forlfru*
400MPa
where Ao,
is
the
total
prestressing
tendon
area,
S,
is the
resulting
average
tendon
stress
cone-
sponding
to P*AP,
$,
is
the tendon
yield
stress,
defined
in
section
2,
ard,
f
is the tendon
stress
corresponding
to
P.
This
equation
seems
to
provide
reasonable results
but has not
been vali-
dated
for all wall configurations.
It
would
be
prudent
to
assume a
total tendon force
increase
of
Yz-3A
times
the result calculated
by Eqn.
8.27
when
the
presfessing
tendons
are
approximately
evenly
distributed
along the length
of
the
wall.
Eqn.
8.29
evaluates
the
resulting
tendon eccen-
tricity,
e,,
due
to the total tendon
force increase AP acting at an eccentricity
of lo./6,
assuming
that tendons of equal
area are
evenly
distributed
across
the
wall.
lwLP
o:-
6(P
+
LP\
(8.2e)
Having calculated AP and e,,
the nominal
flexural strength, Mn, and corresponding
displace-
ment,
d.,.,, can
then be
evaluated
using
Eqns.
8.17
and
8.19.
8.1.5 Yield strength
Contrary
to reinforced concrete
walls,
the
yield
strength for unbonded
prestressed
walls
is typ-
ically found at displacements
beyond
the displacement at
nominal flexural
strength.
Structural
testing
has
consistently
shown
that
the
behaviour of
unbonded
prestressed
walls loaded
beyond
the nominal
strength is dominated
by rocking
as
illustrated
in
Fig.
8.7.
Even for
walls without
specially
placed
confinement
plates,
experimental observations consistently demonstrate
that
the
wall
is
able
to
support
compression
strains
far
beyond 0.003.
In Fig.
8.7, the wall
has
rocked over
by
a
displacement
d*
corresponding
to a rotation
0.
At
this state,
it
is
assumed
-202 -
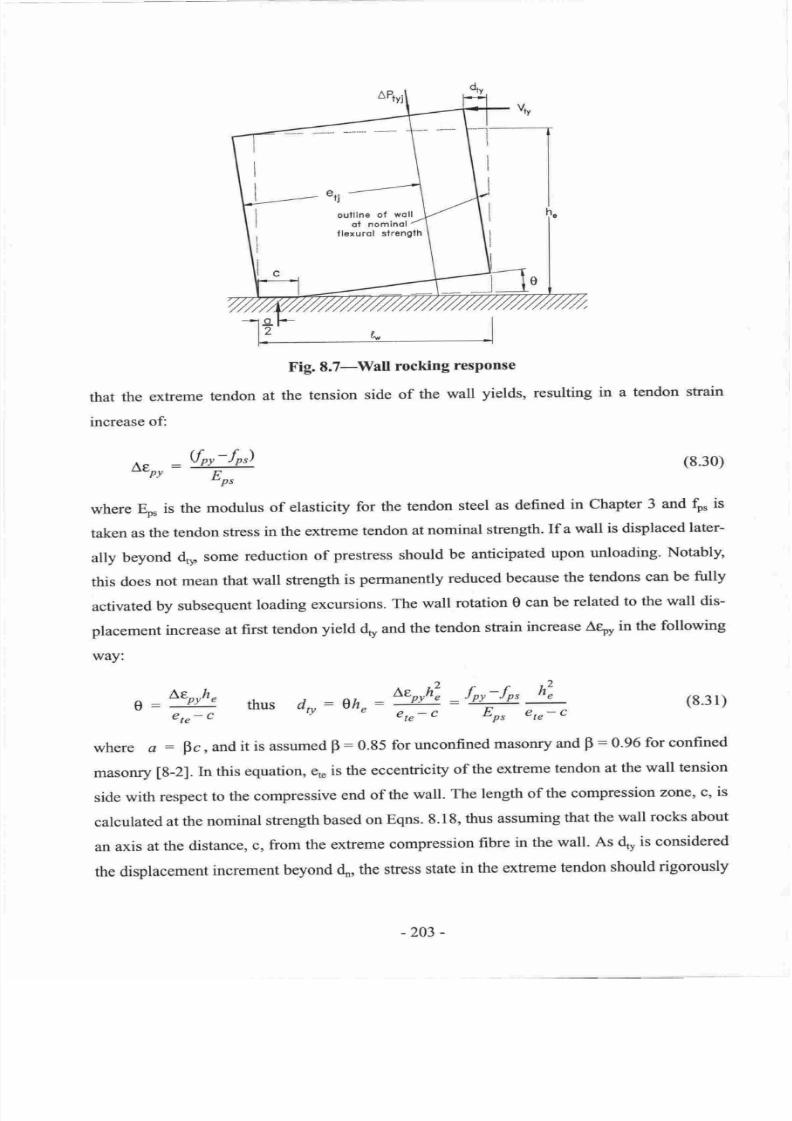
7/21/2019 PHD Laursen-masonry Prestressed Walls
http://slidepdf.com/reader/full/phd-laursen-masonry-prestressed-walls 229/308
that
the
extreme
tendon
increase
of:
a^
-
Vor-fpr)
u.py_
T
Fig.
8.7-Wall
rocking
response
at
the tension
side
of
the
wall
yields, resulting
in a
tendon
strain
(8.30)
where
Eo,
is
the
modulus
of
elasticity
for
the tendon
steel
as defined
in
Chapter
3
and fn, is
taken
as
the
tendon
stress
in
the
extreme
tendon
at
nominal
strength.
If a
wall
is displaced
later-
ally
beyond
d*
some
reduction
of
prestress
should
be anticipated
upon unloading.
Notably'
this
does
not
mean
that
wall
strength
is
permanently
reduced
because
the
tendons
can
be
fully
activated
by
subsequent
load ing
excursions.
The
wall
rotation
0
can be
related
to
the
wall
dis-
placement
increase
at
first
tendon
yield
do and
the
tendon
shain
increase
Aeo,
in the following
way:
thus
d,r:0h =#:W
h?
€t -
c
(8.31)
where
a
:
pc,
and
it
is
assumed
F
:
0.95
for
unconfined
masonry
and
B
=
0.96
for
confined
masonry
tg-2].
ln
this
equation,
eo,
is the
eccentricity
of
the
extreme
tendon
at
the
wall
tension
side
with
respect
to
the compressive
end
of
the
wall.
The
length
of
the
compression
zone,
c,
is
calculated
at
the
nominal
sfiengthbased
on
Eqns.
8.18,
thus assuming
that
the
wall
rocks
about
an
axis at
the
distance,
c,
from
the
extreme
compression
fibre
in
the
wall.
As
do
is
considered
the
displacement
increment
beyond
do,
the
stress
state
in
the
exfreme
tendon
should
rigorously
€t -
c
-203
-
7/21/2019 PHD Laursen-masonry Prestressed Walls
http://slidepdf.com/reader/full/phd-laursen-masonry-prestressed-walls 230/308
be taken as fo,, however
using
f,.
(initial
tendon stress
in
unloaded state) instead
of
{0,
in
Egn.
8.31
generally
result in little
enor.
Given
0,
the
force increase in
the individual tendons can
be
calculated as:
M,rj:ryEp,Ap,j=
LP,
:
}LP,ri
€,t-
C
(fpy-fpr)
Aorih
-te
(8.32)
(8.33)
where
e,i
is
the location
of the
j'th
tendon
with
respect to the
compression end
of
the
wall,
Apsl
is the
area
of
the
j'th
tendon and
AP, is the
total tendon force increase
above that
at
Mn.
Note
that
Eqn.
8.32
assumes
linear variation
of
the
tendon
force
increase
with
respect
to the
lateral
location of
the
tendons.
The resulting
moment
increase
M*
is
then
given
by:
Mty
:
Z
*
*,( u-7)
:
Z
LP,ri ,i
-7or,
(8.34)
j:l
j=r
where n is
the
total
number of
tendons along
the length of the wall
and the compression
zone
length at frst tendon
yield
may be
calculated as:
P+LPu+N
or:W
Finally
the
yield
moment
M,
*d
displacement
d can be evaluated as:
M,
:
(N+
P
.
*r(+
-?*
Mry
:
vrh,
du
:
dr+
dr,
Mo
=
w+P)(+-?:
voh,
(8.3s)
(8.36)
(8.37)
8.1.6
Flexural overstrength
The
maximum
credible strength
of
an
unbonded
prestressed
wall may
be evaluated
by
assum-
ing
that all tendons have
reached
their
yield
strength. Consequently, the flexural
overstrength,
Mo, maybe evaluated
as:
(8.38)
where ao is the
length of the equivalent
ultimate compression block and P is the total
tendon
force
when
all
tendons
are
yielding given
by:
-204
-
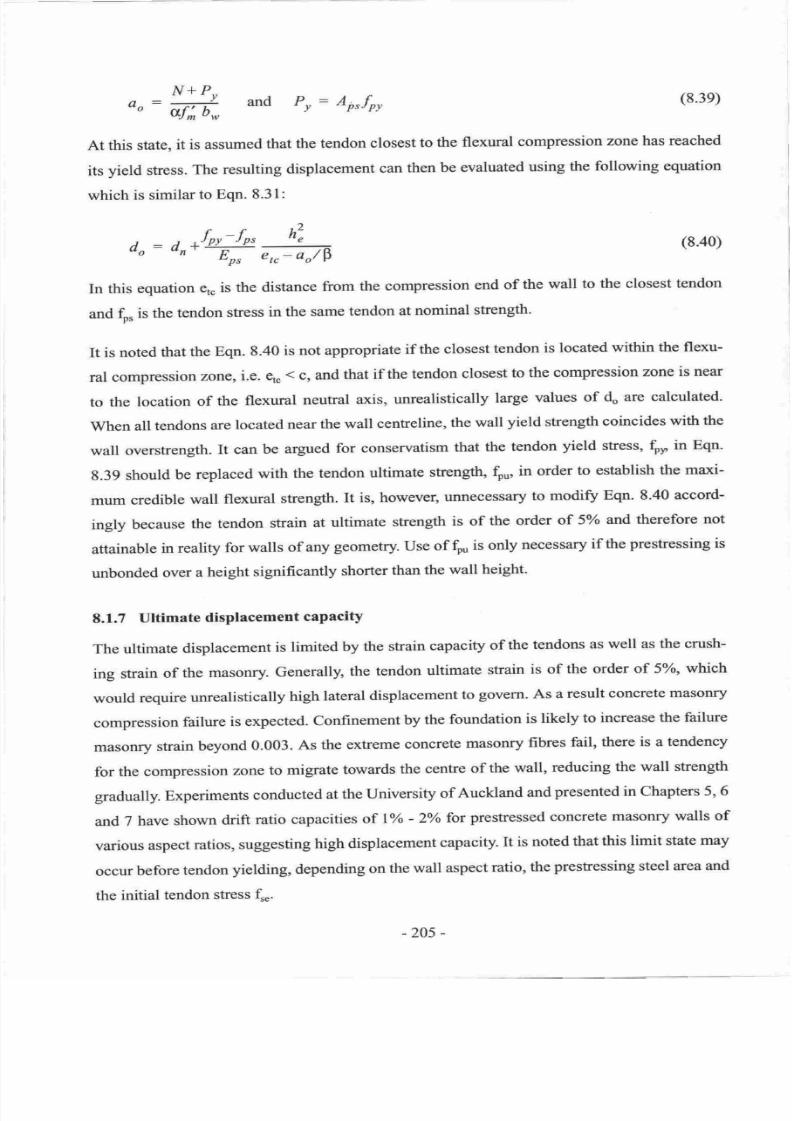
7/21/2019 PHD Laursen-masonry Prestressed Walls
http://slidepdf.com/reader/full/phd-laursen-masonry-prestressed-walls 231/308
(8.3e)
At
this
state,
it
is
assumed
that
the
tendon
closest
to
the flexural
compression
zone
has reached
its
yield
stress.
The
resulting
displacement
can
then be evaluated using the
following
equation
which
is similar
to
Eqn.
8.31:
)
_
)
-for-f^.
o:
,=
(s.40)
do:dn_fiffi
In
this
equation
e,
is
the
distance
from
the compression
end
of
the
wall
to
the
closest tendon
and
fp,
is
the
tendon
stress
in
the
same
tendon
at
nominal
strength.
It
is noted
that
the
Eqn.
8.40
is
not
appropriate
if
the
closest
tendon
is
located
within
the flexu-
ral compression
zone,
i.e.
e,.
(
c,
and
that
if the
tendon
closest
to
the
compression
zone is
near
to the
location
of
the
flexural
neutral
axis,
unrealistically
large
values
of
do are
calculated.
When
all
tendons
are
located
near
the
wall
cenfreline,
the
wall
yield
strength
coincides
with
the
wall overstrength.
It can
be
argued
for
conservatism
that
the
tendon
yield
stress,
$r,
in
Eqn.
g.39
should
be
replaced
with the
tendon
ultimate
strength,
f,u,
it
order
to
establish
the maxi-
mum
credible
wall
flexural
strength.
It
is,
however, unnecessary
to modify
Eqn. 8.40
accord-
ingly because
the
tendon
strain
at
ultimate
strength
is
of
the order
of
5Yo
and
therefore
not
attainable
in
reality
for
walls
of any
geometry.
Use
of
fou
is only
necessary
if
the
prestressing is
unbonded
over
a
height
significantly
shorter
than
the
wall
height.
8.1.7
Ultimate
displacement
capacity
The
ultimate
displacement
is
limited
by
the strain
capacrty
of
the
tendons
as
well as
the crush-
ing
strain
of the
masonry.
Generally,
the
tendon
ultimate
strain
is
of
the order
of
5Yo,
which
would
require
unrealistically
high
lateral
displacement
to
govern. As
a result
concrete
masonry
compression
failure
is expected.
Confinement
by
the
foundation
is
likely
to
increase
the failure
masonry
strain
beyond
0.003.
As
the
extreme
concrete
masonry
fibres
fail,
there
is
a
tendency
for
the compression
zone
to
migrate
towards
the
centre
of
the
wall,
reducing
the
wall
strength
gradually.
Experiments
conducted
at
the
University
of
Auckland
and
presented
in Chapters
5,6
and
7
have
shown
drift
ratio capacities
of
l%
-
2%
for
prestressed
concrete
masonry
walls
of
various
aspect
ratios,
suggesting
high
displacement
capacity.
It
is
noted
thatthis
limit state
may
occur
before
tendon
yielding, depending
on
the
wall
aspect
ratio,
the
prestressing
steel
area
and
the
initial
tendon
stress
f .
o,
=
ffi*
and
Pr:
Ai,,fpy
-205
-
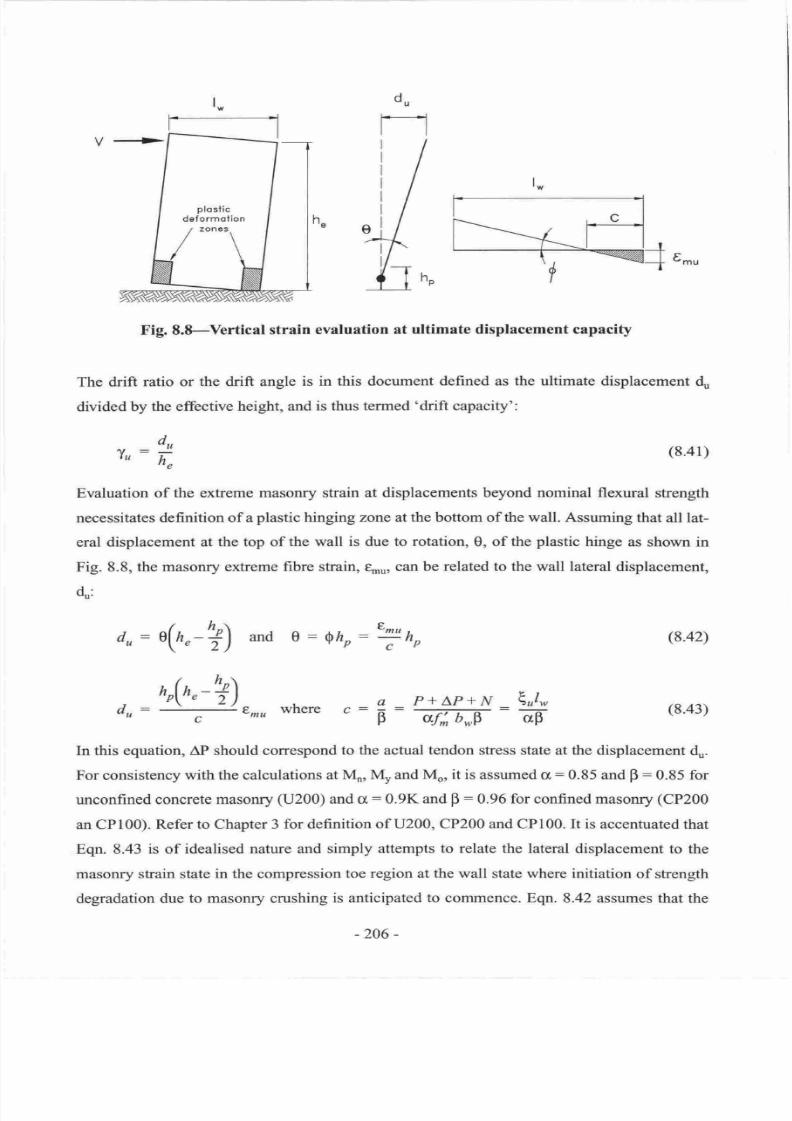
7/21/2019 PHD Laursen-masonry Prestressed Walls
http://slidepdf.com/reader/full/phd-laursen-masonry-prestressed-walls 232/308
ploslic
deformofion
du
r--1
l/
,
ll^,wr,-
Fig.
8.8-Vertical
strain
evaluation
at
ultimate
displacement
capacity
The
drift
ratio or the drift angle
is in this
document defined as the ultimate displacement
d'.,
divided
by the effective
height, and
is thus termed 'drift capacity':
he
^t
-d
u
he
(8.41)
(8.42)
(8.43)
Evaluation
of
the
extreme
masonry strain at
displacements
beyond nominal
flexural
strength
necessitates
definition of
a
plastic
hinging zone at
the bottom
of
the
wall. Assuming that
all
lat-
eral
displacement at
the top
of
the wall is due to
rotation,
0, of the
plastic
hinge
as shown in
Fig. 8.8, the
masonry extreme
fibre strain,
tmu,
can
be
related
to the
wall lateral
displacement,
d :
rh-l'e
d,: \lh -t)
and
g :
Qho:
#oo
,
oo(0 -+)
.
a P+^P+N
\ut*
du
:
1_
E^u
wnere ,
:
p:
WF
:
Ep__
tn this
equation, AP should correspond
to
the
actual
tendon
stress state at the
displacement
dr,.
For
consistency
with
the
calculations
at Mo,
My
and
Mo, it
is assumed
c[
:
0.85 and
B
:
0.85
for
unconfined
concrete
masoffy
(U200)
and
cr:
0.9K and
B:0.96
for confined masonry
(CP200
an
CP100). Refer
to
Chapter
3
for definition
of
U200,
CP200 and CP100.
It
is accentuated
that
Eqn.
8.43
is
of
idealised nature and simply
attempts
to
relate the
lateral
displacement
to the
masonry
strain state
in the compression
toe region at the wall
state
where initiation of
strength
degradation due
to masonry crushing
is anticipated
to
commence. Eqn.
8.42 assumes that the
-206-
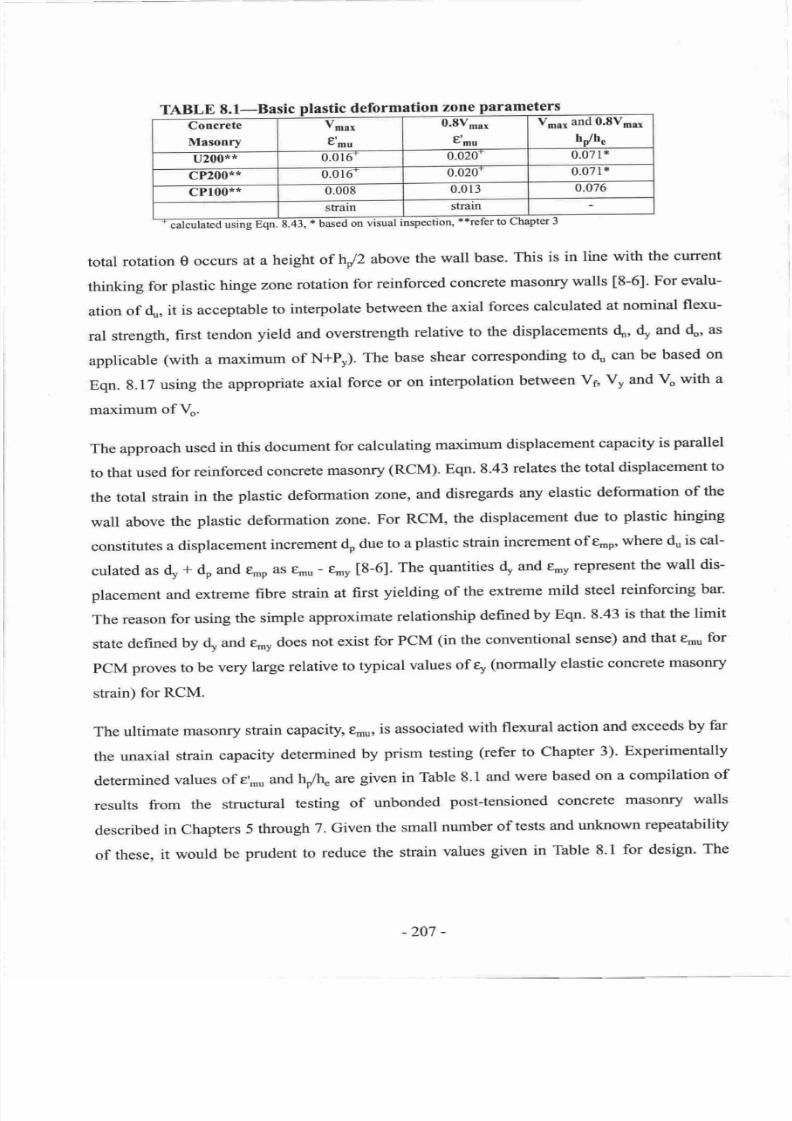
7/21/2019 PHD Laursen-masonry Prestressed Walls
http://slidepdf.com/reader/full/phd-laursen-masonry-prestressed-walls 233/308
deformation
meters
TABLE
8.I-Basic
zone
Concrete
Masonry
v
max
t'-u
0.8vmax
t'to
Vr.,
and 0.8vm'*
h/hu
u200**
0.016
0.020*
0.071'i
cP200*
0.016'
0.020
0.071|
cPl00**
0.00E
0.013
0.076
sfrain
strain
usln-lne
qn.
8.a3,
*
based
on
uisual inspection
**refer
to
Chi
rpter
3
ng
Eqn
total
rotation
0
occurs
at
a height
of
h/2
above
the
wall
base.
This
is
in
line with
the
crurent
thinking
for
plastic hinge
zone
rotation
for
reinforced
concrete
masoffy
walls
[8-6]-
For
evalu-
ation
of
{,
it
is
acceptable
to
interpolate
between
the
axial
forces
calculated
at
nominal
flexu-
ral
shength,
first
tendon
yield
and overstrength
relative
to
the displacements
do,
{ -d
4,
as
applicable
(with
a
maximum
of
N+Pr).
The base
shear
corresponding
to
d,.,
can
be
based
on
Eqn.
8.17
using
the
appropriate
axial
force or
on
interpolation
between
V6,
V, and
V'
with a
maximum
of
V..
The approach
used
in this
document
for
calculating
maximum
displacement
capacity
is
parallel
to that
used
for
reinforced
concrete
masonry
(RCM). Eqn.
8.43
relates
the
total
displacement
to
the
total
sfain
in
the plastic
deformation
zone,
and disregards any
elastic
deformation
of
the
wall
above
the
plastic deformation
zone.
For
RCM,
the
displacement
due
to
plastic hingtng
constitutes
a displacement
increment
dp
due
to a
plastic strain
increment
of
&np,
where
du
is cal-
culated
as
d,
+
do and t
o
as
&nu
-
s-v
t8-61.
The
quantities
d, and
Qnv
represent
the wall
dis-
placement
and
extreme
fibre
strain
at
fust
yielding
of
the
extreme
mild
steel
reinforcing
bar-
The
reason
for
using
the
simple
approximate
relationship
defined
by
Eqn.
8.43
is
that
the
limit
state
defined
by
q
and
env
does
not exist
for
PCM
(in
the
conventional
sense)
and
that
ernu
for
pCM
proves to be
very
large
relative
to
typical
values
of
g
(normally
elastic concrete masonry
strain)
for RCM.
The ultimate
masonry
strain
capaciry
4nu,
is associated
with
flexural
action
and
exceeds
by
far
the
unaxial
strain
capacity
determined
by
prism
testing
(refer
to
Chapter
3).
Experimentally
determined
values
of
€,n.,o
and
ho/tt
are
given in
Table
8.1 and
were
based
on
a compilation
of
results
from
the
structural
testing
of
unbonded
post-tensioned
concrete
masonry
walls
described
in
Chapters
5
through
7.
Given the
small number
of
tests
and
unknown
repeatability
of
these,
it
would
be
prudent
to
reduce
the
strain
values
given
in
Thble
8.1
for
design.
The
-207
-
7/21/2019 PHD Laursen-masonry Prestressed Walls
http://slidepdf.com/reader/full/phd-laursen-masonry-prestressed-walls 234/308
design
value of
the ultimate
strain capacity
should be
taken
tts
enu
:
t'*u/y,
where
yis
taken
as
1,3
to
1.5.
Normalisation of
ho with
t5 was based
on comparison of
results from the three test series which
indicated
that
\
was
likely to be
related
to the effective wall height, h , rather than the wall
length,
1,.
The values of
\
for U200
and CP200
(wall
test Series
I
and 2)
were
based on visual
inspection
of the
wall toe regions
when strength
degradation of 0.8Vr* had occurred. Inelastic
strain
(e*
>
0.0015)
in the masonry
above
the
frst
course
(200
mm) was not measured
in any
of the Series
I and
2 U200 and CP200
tests,
thus
\
:
200 mm was assumed. Series I
and
2
testing
results do
not confirm
that U200 or
CP200 concrete
masonry
are
capable
of developing
inelastic
strain
above
the
first
course,
therefore
the
results
for
U200
and CP200 should
for
taller
walls be extrapolated
with
caution.
The
plastic
deformation
zone lenglh for CP100 masonry
was
based on
the results from
testing
Series
3, which reflected
realistic
wall dimensions
in multi-storey
buildings. Extensive
and
reliable
measurement readings
revealed
that inelastic strain
(e*
>
0.0015) occurred over
a
height of
400-600 mm at both
V,n* and
0.8V.*.
This confirms that
CPl00
is
capable
of devel-
oping
inelastic
strain over a
height of four
or more courses
of
concrete
masoffy.
The longer
\
for the 5.25
m
high Series
3 walls also
explains why
the
average strain
(theoretical)
in
ttre
plas-
tic
deformation
zone for
Vn, *,
given
in Table 8.1,
for CPl00
is
lower
than that
of CP200. The
ho
value
given
in
Table
8.1 for CPl00
was based on actual
measured values, while ho
values
given
in Table 8.1 for
CP200
were
based
on visual inspection. For
design
pu{poses
\ftr
for
CP100
may be taken
as 0.08 which
conforms
well with that typically
used
for
reinforced
con-
crete
walls
[8-6].
It
may seem counter-intuitive
that
the
values for
€'-u
given
in Table
8.1
for
U200 and
CP200
are
higher than those
for CPl00.
However
as suggested above, the results for
U200
and CP200
walls cannot
directly be
compared with
the results for CP100 walls because the modular
nature
of the
masonry blocks determined
that
ho:200
mm for the squat walls U200
and CP200.
It
was found by strucfural
testing
when using CP200 and CPl00, that the wall strength
per-
sisted
at
levels
close
to
V.*
for displacements
beyond
d.,**
(corresponding
to
V.*),
until dis-
placements near
do.su'nu*
(corresponding
to
0.8V.u*)
were
reached.
It
can
therefore
be argued
that dependable
wall
displacement
capacity, d , with
little
strength degradation may
be calcu-
lated using €n,u
related to 0.8Vr *.
This is
generally
not the case for U200, for
which testing
-208-
7/21/2019 PHD Laursen-masonry Prestressed Walls
http://slidepdf.com/reader/full/phd-laursen-masonry-prestressed-walls 235/308
proved that significant
strength
degradation
was
imminent
after
d.,n,*.
Measurements
relating
to
0.gVn'o*
can
be
used
for U200
if
it
is assumed
that
reliable
wall
performance
persists
until
the strenglh
had degraded
to 0.8V'u*.
It appears
from
Table
8.1
that
the
plastic zone
heights
are
of
the
order
of
7-8o/o
of the
wall
height,
or
200
mm
to
400
mm
for
the
tested
wall
configurations.
This
is a
short
length
when
compared
with
typical
plastic hinge
lengths
for
reinforced
concrete
masonry
walls
of the order
of 0.5x1*
[8-6],
or 900
mm
to
1,500
mm
when
applied
to
the
experimental
wall
lengths.
Embedding
of
confining
plates can consequently
be
limited
to a
small
region
in
each end
of the
wall, say
over
a
vertical distance
of
1.5 to
2 times
ho
and a
horizontal
extent
of
1-5
times
(l*
Vertical
sfrain
measurements
from
testing
Series
|
,
2
and3,
as
discussed
in Chapters
5,
6
andT
,
confirm
the magnitude
of
strain and
plastic
zone
length
proposed in
Table
8.1.
Nevertheless,
it
is emphasised
that
the
results
in
Table
8.1
are
of
preliminary
nature
and
should
be used
with
caution
due
to
considerable
scatter
of
results,
and
as
stated
above,
that
these
values are
of theo-
retical
and
empirical
character.
Additionally,
the
proposed ultimate
strains
should
not
be
regarded
as
the
reliable
ultimate
uniaxial
strain
capacity
of
concrete
masomy.
8.1.8
Calculation
examPle
Consider
the
wall
shown
in Fig.
8.9(a).
It is assumed
that
the
five storey
wall
is
15 m
high, 3-6
m
long,
190
mm
thick
and
prestressed
with
five
15.2
mm
high strength
prestressing strands
(4,:
:
140
mm).
Half
height
concrete
masonry
blocks
from
the
20 series
(100
mm
high)
are
used
in the
plastic deformation
zone;
regular
20 series
blocks
elsewhere.
The
wall self
weight
is
calculated
to
be
225
kN and
the
dead
load
of
the
floors
and
roof
amounts
to 0.5
MPa
at the
base
of
the
wall,
resulting
in
a
total
dead
load
of
567
kN'
The
calculation
is
performed on
the
equivalent
structure
shown
in
Fig.
8.9O)
with an
effective
height,
lL
=
2/3xh*:
10
m
(refer to Chapter
9
for further
considerations
on
h ),
at
which
the
wall
lateral
load is assumed
to be
applied.
The
tendons
are
placed symmetrically
about
the wall
centre
line
at
zero,
L200
mm
and
+400
mm
eccentricities
from
the
wall
centre
line
(the
five
stands
are
represented
with
one
line
in
Fig. S.9).
ln
the
calculation,
the
tendon
elastic
elonga-
tion
capacity
is based
on
the actual
tendon
length,
approximated
with
h*
using
the effective
tendon
elastic
modulus
of
Eorxh/ho
An initial
tendon
stress
of
0.67fou
is
selected,
based
on an
estimated
first
tendon
yield
at
a
lateral
drift of
about
1.57o
assuming
that
the
wall rocks as
a
-209
-
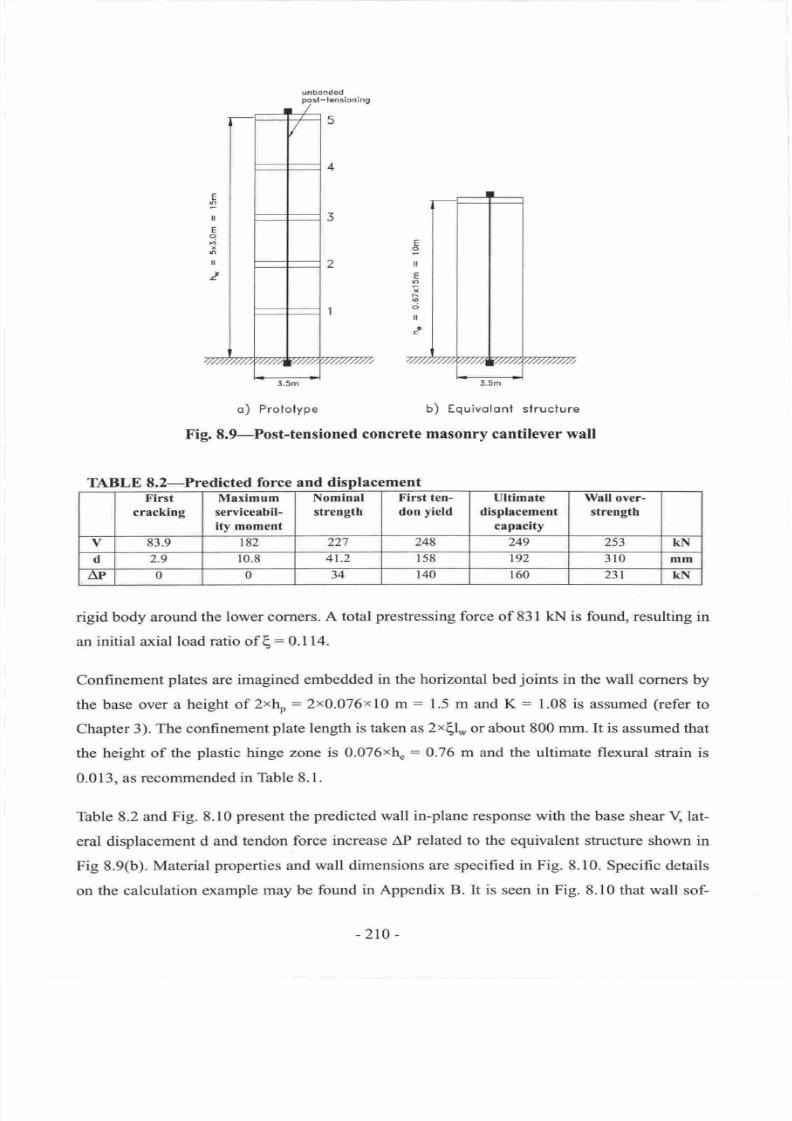
7/21/2019 PHD Laursen-masonry Prestressed Walls
http://slidepdf.com/reader/full/phd-laursen-masonry-prestressed-walls 236/308
E
6
tl
r;
o
ll
i
E
I
tl
E
o
;
F
@
o
ll
I
E
o)
Proiolype
b)
Equivolonf
sfructure
Fig.
8.9-Post-tensioned
concrete
masonry
cantilever wall
TABLE
8.2-Predicted
force and displacement
First
cracking
Maximum
serviceabil-
ity moment
Nominal
strength
First
ten-
don
yield
Ultimate
displacement
capacity
Well
over-
strength
v
83.9 182
227
248
249 253
kN
d
2.9 10.8
4t.2
158
t92
310
mm
AP
0
0
34
I40
160
231
KN
rigid
body around the
lower corners.
A total
prestressing
force
of 831 kN is found, resulting
in
an
initial axial
load ratio of
E:
0.114.
Confinement
plates
are
imagined embedded
in
the
horizontal
bed
joints
in
the
wall
corners
by
the base
over a height of
2 4
:2x0.076x10
m
:
1.5 m
and
K
:
1.08 is
assumed
(refer
to
Chapter
3). The confinement
plate
length
is taken as 2*€l* or about 800 mm- It is
assumed that
the
height
of the
plastic
hinge
zone is 0.076xh.
:
0.76 m
and the ultimate flexural
strain
is
0.013, as
recommended in
Table 8.1.
Table 8.2 and
Fig. 8.10
present
the
predicted wall in-plane
response with the
base shear
Y
lat-
eral displacement
d and
tendon force
increase AP
related
to
the
equivalent structure shown
in
Fig 8.9(b).
Material
properties
and
wall dimensions are
specified in Fig.
8.10.
Specific details
on
the calculation
example may
be found
in Appendix B. It is seen in Fig. 8.10 that
wall sof-
-2r0-
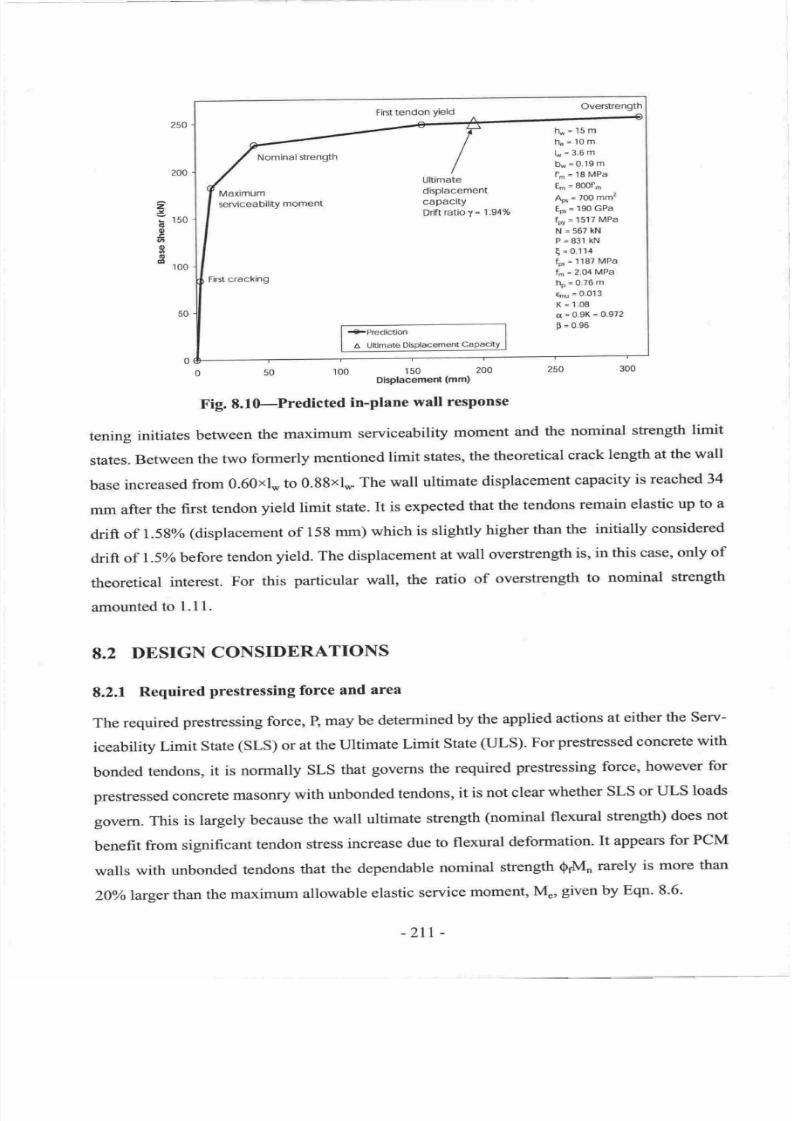
7/21/2019 PHD Laursen-masonry Prestressed Walls
http://slidepdf.com/reader/full/phd-laursen-masonry-prestressed-walls 237/308
First
tendon
Yield
Overstrength
Nominal
strength
hw=l5m
ho=l0m
lw=3.6m
b*
-
0.19 m
f.
=
18
MPa
E.
=
80of'm
Aro
=
700
mmz
Epo
=
190 GPa
fpv
=
1517
MPa
N=567kN
P
=
83'l
kN
E'0114
fp
=
1187
MPa
fm
=
2.0,1
MPa
rh
=
0.76
m
sru
=
0'013
K
=
1.08
cr=0.9K=0.972
F=0e6
Maximum
seMceability
moment
ultimate
displacement
capacity
Driftratioy=
1.94
First
cracking
+Prediction
a
ultimate
Dlsplacem€nt
o
50
100
o'to'uluto-e'r
(,nt)
200
250
300
Fig.
8.l0-Predicted
in-plane
wall
response
tening
initiates
between
the maximum
serviceability
moment
and
the
nominal
strength
limit
states.
Between
the
two
formerly
mentioned
limit
states,
the
theoretical
crack
length
at
the wall
base
increased
from
0.60x1*
to
0.88x1*
The
wall
ultimate
displacement
capacity
is reached
34
mm
after
the
first
tendon
yield
limit
state.
It
is
expected
that
the
tendons
remain
elastic
up
to
a
drift
of
l.5g
(displacement
of
158
mm)
which
is
slightly
higher
than
the
initially
considered
drift
of 1.5
before
tendon
yield.
The displacement
at
wall
overstrength
is,
in
this
case,
only
of
theoretical
interest.
For
this
particular
wall,
the
ratio
of
overstrength
to
nominal
strength
amounted
to
l.l
l.
8.2
DESIGN
CONSIDERATIONS
8.2.1
Required
prestressing
force
and
area
The
required
prestressing
force,
B
may
be determined
by
the applied
actions
at
either
the Serv-
iceability
Limit
state
(sLS)
or
at
the Ultimate
Limit
state
(uLS).
For
prestressed
concrete
with
bonded
tendons,
it
is
normally
SLS
that
governs the
required
prestressing
force,
however
for
prestressed
concrete
masonry
with
unbonded
tendons,
it
is
not
clear
whether
SLS
or ULS
loads
govern.
This
is largely
because
the
wall
ultimate
strength
(nominal flexural
strength)
does
not
benefit
from
significant
tendon
stress
increase
due
to flexural
deformation.
It appears
for
PCM
walls
with
unbonded
tendons
that the
dependable
nominal
strength
QsM,,
rarely
is more
than
20o/olargerthan
the maximum
allowable
elastic
service
moment,
M.,
given
by
Eqn.
8.6-
z
,'
Y
rso
o
o
6
lt
G
cl
100
-ztt
-
7/21/2019 PHD Laursen-masonry Prestressed Walls
http://slidepdf.com/reader/full/phd-laursen-masonry-prestressed-walls 238/308
Supposing
that for wind actions
the ultimate
flexural load Mu* is roughly equal
to 1.4 times the
service
load
M,*, it is found that the
ULS
requirement is likely to
govem
the design axial
pre-
stress.
For
seismic loads determined
for
limited ductility
demands, the strength
requirement
at
ULS
again
appears
to
govern the design
axial
prestress.
Current
studies
indicate that
the
ULS
requirement
given
by Eqn. 8.44
generally
is satisfied,
if the required design
axial
prestress
has
been
determined
based on un-cracked
section analysis
at
SLS
in accordance
with Eqn. 8.45.
Qr
Mr'- M,,
*
M r2
M,
(8.44)
(8.4s)
Prior to determination of
the required prestressing
force,
P,
it
needs
to
be decided
whether
the
wall
must
remain un-cracked
at SLS or
not. In that regard
it
is reiterated, that
only a single
crack
at
the base
is
expected
to open
when the l't cracking
moment
is exceeded at the
base, and
that this crack
will close immediately
upon unloading
of
the
wall,
unlike the behaviour
for
con-
ventionally
reinforced
concrete
consffuction.
Consequently
PCM wall
cracking
at SLS loads is
not a durability issue but
rather an
issue related to function of the structure. Seen
on the
basis
of
the expected
crack
paffern,
it
could
be argued
to require that PCM walls
remain un-cracked
for all
SLS load
combinations,
except
for
earthquake load combinations.
Altematively,
the
required
prestressing
force could be determined by shear strength
considera-
tions
at
ULS.
When
the required
prestressing
force
P has been determined, the
prestressing
steel amount
is
calculated,
assuming that P needs
to
be
present
after all
losses
(refer
to Chapter
4), and at the
same time
respecting
the allowable
prestressing
steel stress before and immediately
after
pre-
stress transfer.
The anchorage
region, to
which the concentrated
prestressing
load is
applied, shall be designed
accordingtoNZS3l0l:1995,section
16.3.9,inordertoavoidbursting,splittingandspalling.
It is conceivable that
the
prestressing
force
needs to be
applied
in two stages,
depending on the
early strength of
the masomy
and the magnitude of
the anticipated
prestressing
loss. Initially,
a
lower
prestressing
force
could
be
applied
to
resist construction
loads.
The
final
prestressing
force is
then
applied
at a later date.
-2r2-
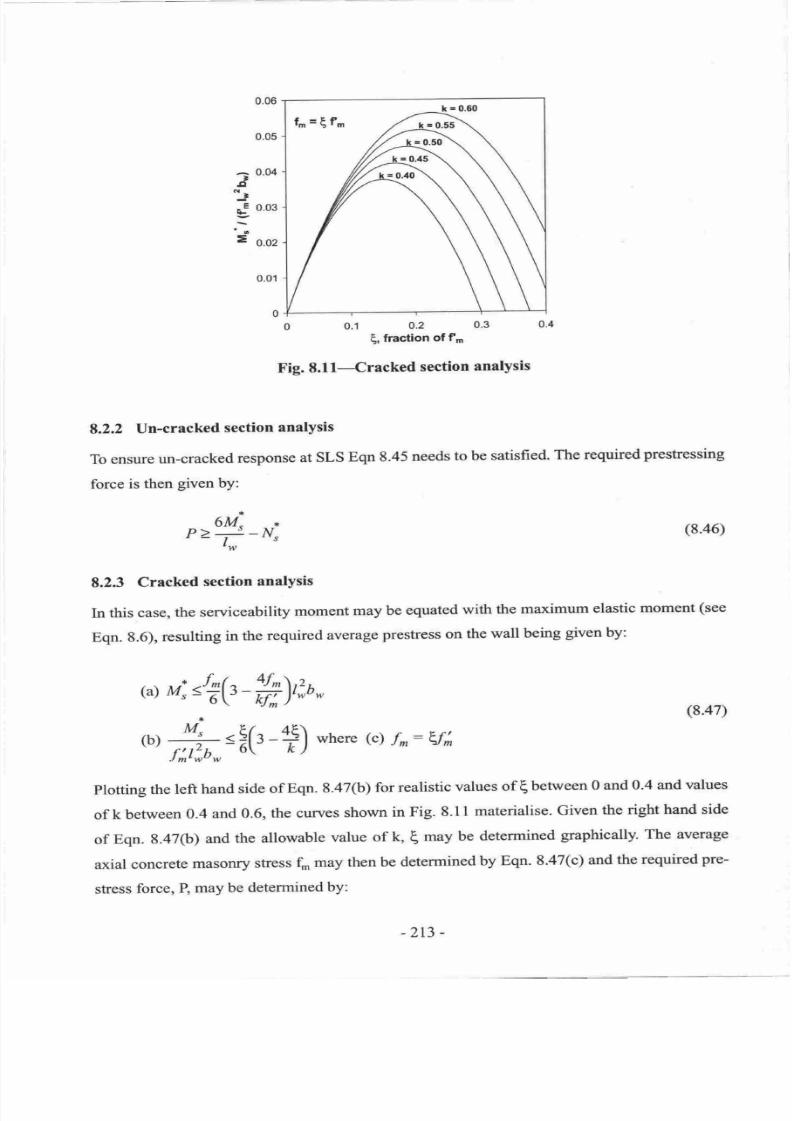
7/21/2019 PHD Laursen-masonry Prestressed Walls
http://slidepdf.com/reader/full/phd-laursen-masonry-prestressed-walls 239/308
^
0.04
'
t]
E
o.o3
,:
E
o.oz
[
fraction
of
f'
Fig. E.l
l-Cracked
section
analysis
8.2.2
Un-cracked
section
analysis
To
ensure
un-cracked
response
at
SLS
Eqn
8.45
needs
to
be
satisfied.
The required
prestressing
force
is then
given
by:
8.23
Cracked
section
analYsis
ln
this case,
the
serviceability
moment
may be
equated
with
the
morimum
elastic
moment
(see
Eqn. 8.6),
resulting
in
the
required
average
prestress
on
the
wall
being
given
by:
6M^
*
P>+-N
t
yt,
( )
M:
'*('-#),iu
i. Fl
ot
frlu_=:('
-+)
where
(c)
r,:v;
(8.46)
(8.47)
plotting
the
left
hand
side
of
Eqn. 8.47(b)
for
realistic
values
of
(
between
0 and
0.4
and
values
of
k
between
0.4
and
0.6,
the
curves
shown
in
Fig.
8.11
materialise.
Given
the
right
hand side
of
Eqn.
8.470)
and
the allowable
value
of k,
(
may be
deterrnined
graphically.
The
average
axial
concrete
masonry
stress
f,
may then
be
deterrrined
by
Eqn.
8.a7(c)
and the
required
pre-
stress
force,
R
may
be
determined
bY:
-2t3
-
7/21/2019 PHD Laursen-masonry Prestressed Walls
http://slidepdf.com/reader/full/phd-laursen-masonry-prestressed-walls 240/308
P>f*l*bw-
Ns
8.2.4 Ultimate
limit state
(8.48)
8.2.4.1 Strength
design
As the ultimate
limit state
flexural actions
may
govern
the
design
presfressing
force
P, it must
be
verified that
the dependable
flexural
strength exceeds the ultimate flexural
actions as
defined
by Eqn. 8.44,
using
Qs:0.85.
This
can be
done
by evaluating the
required
prestressing
force, P, which easily
can
be derived
by
trial-and-error
from the equations
presented
in
section Ll.4 by
initially
assuming
that AP
:
0. First approximation
of
the required total
prestressing
steel area Ap,
may
then be
calculated
with the
assumption
that the effective
presftessing
steel
stress
after all
losses,
f,.,
amounts to
about
0.50fp
(refer
to Chapter
4). A closer
approximation can then be obtained
when
AP
(Eqns.
8.24 or 8.25)
is
included
in the calculation
of the nominal strength I\d.
Depending
on
the required
accuracy,
P can be determined
after several
iterations.
8.2.4.2
Capacity
design
Calculation
of
the wall overstrength,
Mo, is of considerable significance for ductile
seismic
design.
The
principle
of
capacity design
states
that the forces
generated
throughout
the struc-
ture, caused by
development
of the maximum
strength of the ductile
yielding
components
cre-
ating
a
mechanismn
must be
exceeded
by the dependable capacity of all
other
joining
components.
This
will ensure, in
the event of a major earthquake, that
yielding
will
occur
at
the
specially
selected
locations
(plastic
hinges) and that
all other types of
potential
failure
modes
are
eliminated.
This
means
for
a
cantilever
wall,
that the
wall
shear
strength,
Vi,
must
exceed
the base shear, Vo, that develops
the
maximum
flexural strength of
the
wall
(overstrength
Mo)
and that the wall
flexural strength outside
the
plastic
hinge
must
exceed the
wall
moment
distri-
bution
corresponding to development
of the
wall
overstrength, Mo. Additionally,
the
moment
distribution
(demand)
arising
from development of
flexural overstrength may
have to
be ampli-
fied to
take
into
account
higher mode effects.
Refer to Paulay and Priestley
[8-6]
for
further
discussion.
-2r4-
7/21/2019 PHD Laursen-masonry Prestressed Walls
http://slidepdf.com/reader/full/phd-laursen-masonry-prestressed-walls 241/308
8.2.4.3
Displacement
caPacitY
For
ductile
seismic
design,
it
is
necessary
to
ensure
that
the
nominal
flexural
sfrength
and
yield
strength
are
suffrciently
large
to limit
excessive
displacements
(storey
drift)
during
seismic
attack.
This
concept
is
similar
to
reducing
the ductility
demand
for
reinforced
concrete
masonry
by
increasing
the
flexural
strength
(yietd srength).
A
prestressing
steel
area increase
is needed
if
the
wall
strength
is insufficient
to
ensure
reasonable
limitation
to
the lateral dis-
placements.
It
is desirable
to
ensure
that
the
prestressing
steel
in
an
unbonded
post-tensioned
concrete
masoffy
wall
responds
elastically
to
seismic
excitation
for several
reasons:
the
wall
retains
(l)
the
initial
stiftress, (2)
the
strength,
(3)
the
self centring capability,
and
(a)
restressing
of
the
tendons
after
the
seismic
event
is
not
necessary.
A low
initial
tendon
shess
relative to
the
ten-
don
yield
strength
allows
for
larger
wall
displacements
before
first
tendon
yield at
the displace-
ment
of
d
Conversely,
a
relatively
high
initial
tendon
stress
is
desirable
because
it
reduces
time
dependent
prestress
loss and
reduces
the
required
prestressing
steel
area
(better
econ-
omy).
Ideally,
the
seismic
displacement
demand,
dE*,
should
be
exceeded
by
both the
tendon
yield
displacement,4
*d
the displacement
capacity,
du'
The
displacement
demand
imposed
on
an
unbonded
wall
stnrcture
in a
seismic
event,
ds*,
can-
not be
predicted
using
existing
loadings
codes
and
acceleration
spectra.
However,
using
numerical
non-linear
time-history
analysis,
the
displacement
demand
can
be
estimated
as
described
in
Chapter
9.
8.2.5
Base
sliding
Base
sliding
response
should
be
avoided,
however
such
behaviour
is
not anticipated
for
pre-
stressed
concrete
masonry
walls
@CM)
of
normal
wall
aspect
ratios
and
prestressing lwels.
Base
sliding
for
pCM
is
conholled
by
the available
sliding
resistance,
which
is
provided
by
shear
friction
by
means
of
aggregate
interlock
mechanisms.
A
check
at
ultimate
using
the
fol-
lowing
formula
is recommended:
Vbo, 3
0p(P
+
/f)
(8.4e)
where
V6u,
is the base shear due
to
lateral forces,
p
is the dependable
coefficient
of friction for
concrete
to
concrete
contact
and
0
is
the appropriate
strength
reduction
factor
generally
taken
as
0.85,
except
when
V6*
is derived
from
capacity
design
considerations
where
0:
1.0'
The
-215
-
7/21/2019 PHD Laursen-masonry Prestressed Walls
http://slidepdf.com/reader/full/phd-laursen-masonry-prestressed-walls 242/308
recorlmended
value of
the
shear
friction
coefficient
(Coulomb
friction),
p,
depends on the con-
crete
roughness amplitude
(average
distance
between
'valley'
and
'peak'),
ru. The following
values are applicable
to concrete
[8-6]
but
may
be
used for concrete masonry
as
no
values spe-
cifically
for
concrete masonry
are
available:
(a)
p:1.4
for
rn)5mm
(b) p:
1.0 for
2mm(ro35
mm
(c)
lL:
03
otherwise
(8.50)
Eqns.
8.50
(a)
and
(b)
both relate
to concrete
surfaces that have
purposely
been roughened,
and
all
equations
(a,
b and
c) are based
on concrete
placed
against
a
clean
surface.
For
concrete masonry
walls, the
foundation and
above
floor
slabs
(whether intentionally
roughened
or not)
must be clean
before
the first course of concrete blocks
is laid.
'Wash-outs'
(clean-out
ports)
may be
necessary
for
grouted
construction
to
ensure that mortar
dropping
inside the
flues does not
prohibit
effective
aggregate interlock between
grout
and
the
founda-
tion/floor
slab.
New Zealand, standard
grout
with specified strength of 17.5 MPa typically con-
tains 7
mm
aggregate.
According
to Collins
[8-7],
aggregate interlock
increases with
increasing aggregate
size. Therefore
the
fine
aggregate
ofthe
grout
is unfavourable to larger
aggregate
in
concrete.
Furthermore,
it
should
be
kept
in mind
that the
largest
particle
type
in
mortar
is sand and
that the
mortar
bed
joints
typically occupy 25-50% of
the wall cross section.
It
can
be argued
that the
maximum friction
factor
of
1.4
given
in
Eqn. 8.50, in reality, is not
achievable.
The
minimum
value of
F
:
0.7 was
violated
by some of the
later tests
in Series
I
and2.
This is of
little concem because
base
sliding for these walls was highly affected by mul-
tiple use
of the same
foundation.
The foundation
top surface had after
some
tests
effectively
been smoothened
to a very small
roughness
amplitude that would not apply to real construc-
tion.
The
propensity
for sliding
is highly
dependent on
the
wall aspect ratio:
tL/l*
A reduction of
aspect
ratio
results in an increase
of
the
base
shear
needed to
develop
the
wall flexwal strength.
A high aspect
ratio
is therefore
preferred in
terms
of reducing
the
propensity
for
base sliding.
The
minimum
aspect
ratio
permitted
can be estimated
in
the
following
way. Consider the nom-
inal flexural
strength of a cantilever
wall assuming no
tendon
force increase:
M,:
w.
n(?-;)
= vfh
-2t6
-
7/21/2019 PHD Laursen-masonry Prestressed Walls
http://slidepdf.com/reader/full/phd-laursen-masonry-prestressed-walls 243/308
where
e\
a?
N+P
=
T
ano
;:7ffi
The
maximum
base
shear
can
be expressed
by:
V^o":
l.33Vtau
(8.s
1)
where
the
1.33
factor
accounts
for
maximum
conceivable
wall strength
(overstrength)
and
0L
the
seismic
dynamic
amplification
factor,
accounting
for
base
shear
amplification
due
to higher
mode
effects
(see
section
9.3.2.4).
Substitution
of the
equation
for a
into
the equation
for
Mn
and
solving
for Vlgives:
(8.52)
Injecting
Eqn.
g.52
into Eqn.
8.51
results
in the
following
requirement
for
the wall
aspect
ratio:
o
oz(r
-
l)'.
L,
l*-
(8.53)
vr:
ltw+
";;(
-h)
A suggested
minimum
aspect
ratio
can
be
estimated
using
6:0.1,
cr:0'96,
Q:
2'5,
0:
l'0
and
lr
:0.7
.Using
these
values
in Eqn.
8.53,
a minimum
wall aspect
ratio
of approximately
2.1
is found.
Assuming
that
the
effective
wall
height
amounts
to
2/3
of
the
actual
wall
heigh
a
minimum
absolute
aspect
ratio of
h*/|*:3.2
is
found.
The
value
of
o)o:
2.5 used
above
origi-
nated
from
section9.3.2.4.
A
more detailed
calculation
reflecting
the actual
wall dimensions,
overstrength,
roughness
amplitude
and
base
shear
amplification
may
justiff
a
lower
aspect
ratio.
It
should
be
kept
in
mind that
there
is always
an
effective
concrete
masonry
compressive
force
at
the base
of
the
wall
(in
excess
of
IrI)
due
to
flexure,
even
after
initiation
of
yielding
of the
tendons.
This differs
from
the
typical
response
of
conventionally
reinforced
walls
cyclically
loaded
beyond
yield, where
the
wall
effectively
is
supported
laterally
at
the
base
by
dowel
action
alone.
Finally,
if
significant
degradation
of
the
concrete
masonry
in
the
wall
comers is
expected
to
occur,
other
means
of inhibiting
base
sliding
may
be
required,
such
as
dowel
bars,
sliding
blocking
devices
or
recessing
of
the
wall
into
the
foundation.
-217
-
7/21/2019 PHD Laursen-masonry Prestressed Walls
http://slidepdf.com/reader/full/phd-laursen-masonry-prestressed-walls 244/308
8.3
\IERIFICATION
OF
PREDICTION
METIIOD
Three
structural
testing
series
were carried out
in the Civil
Test
Hall at the
University of Auck-
land.
Test
Series
I
focused on single storey
walls built
with
ordinary concrete masonry
(uncon=
fined)
and
is described
in
Chapter
5.
Test
Series
2,
reported
in
Chapter
6,
focused
on single
storey
walls with enhanced
wall corners such
that
the
masonry strength
and
vertical
strain
capacity
was increased, with
the overall scope
of increasing the wall displacement
capacity.
Test
Series 3 is described
in
Chapter
7 and
deals
with testing
of two three-storey
walls of real-
istic
proportion. This testing series consisted
of nvo
walls.
A
detailed comparison
between
predictions
based
on the flexure/rocking
model and
experi-
mentally
obtained
results may
be
found
in
Appendix
C.
The following
conclusions
were
drawn:
Initial stiffiress:
For
walls
of
low aspect ratio
(say
below
1.0), the
predicted
initial
stiffiress based
on
V ,
and d ,
overestimates
the actual
wall stiffness by
a factor of
the
order
of
1.5. For
aspect ratios above 2,
accurate
prediction
is expected.
Global
response:
Using
the
predicted
base shear and
displacement at
maximum
serviceability moment, at nomi-
nal
strength,
at first tendon
yield
and
at overstrength, accurate and consistent estimation
of the
force-displacement
envelope
(skeleton
curve) can
be achieved.
Displacement capacity
:
The
predicted
displacement capacity,
du,
was captured
with
reasonable accuracy
using the val-
ues
for exfreme
fibre strain
and
plastic
zone length suggested
in Table
8.1. Based on
structural
testing
of 2.8 m high walls,
enu
:
0.020
and
\/h :
0.071 are adopted for unconfined
and con-
fined masonry
of 200 mm block
height
(U200
and CP200). Predictions for the walls
using
con-
fined masonry
of
100
mm block height
(CPl00)
were based results from testingof
5.25 m high
walls:
€.u
:
0.013 and
hoftr
--
0.076. The strength
associated with
do
for
confined concrete
masonry
(CP200/CP100) should be based
on interpolation of base shear
between the nominal
strength,
first yield
strength and overstrength
limit
states, as
a
function
of
displacement,
as
applicable.
The maximum strength achieved
at du
should
be
limited
by M .
For
unconfined
concrete
masonry
it
appears
prudent
to calculate
the wall capacity
at
d
using 0.8Vr.
-2t8-
7/21/2019 PHD Laursen-masonry Prestressed Walls
http://slidepdf.com/reader/full/phd-laursen-masonry-prestressed-walls 245/308
8.4
REFERENCES
tg-ll
NZS
4203:
lgg2,
Code
of
Practicefor
General
Stntcural
Destgn
and
Design
Loadings
for
Buildings,
Standards
Association
of
New
7naland,l992,
Wellington'
tS-21
NZS
4230:1990,
Code
of
Practice
for
the
Design
of
Masonry Stntcturcs,
Standards
Association
of New
Zealand,
I 990,
Wellington.
t8-31
NZS
3101:
Lggs,
Concrete
Stntctures
Standard,
Standards
Association
of New
Zealan4
1995, Wellinglon.
tg4l
BS
5628:
lgg5,
Part
2:
Code
of
Practice
for
use
of
Masonry.
Structural
Use of
Rein'
forced
and
Prestres
sed
Masonry,
British
Standards
Institution,
London.
t8-51
AS 3700-1998,
Masonry
Stntcturzs,
Standards
Association
of
Ausfialia,
Homebustt
NSW
Australia.
18-61
paulay,
T.,
and
Priestley,
M.J.N.,
Seismic
Design
of
Reinforced
Concrcte
and
Masonry
Buildings,John
Wiley
&
Sons
[nc.,I992,744p.
t8-7]
Collins,
M.P.
and
Kuching,
D.,
How
Safe
are
Larye
Lightly
Reinforced
Concrete
Beams,
Slabs
and
Footings?,
ACI Structural
Journal,
July-Aug.
1999,
Vol.
96,
No.
4,
pp-
482-
490.
-2t9
-

7/21/2019 PHD Laursen-masonry Prestressed Walls
http://slidepdf.com/reader/full/phd-laursen-masonry-prestressed-walls 246/308
220
7/21/2019 PHD Laursen-masonry Prestressed Walls
http://slidepdf.com/reader/full/phd-laursen-masonry-prestressed-walls 247/308
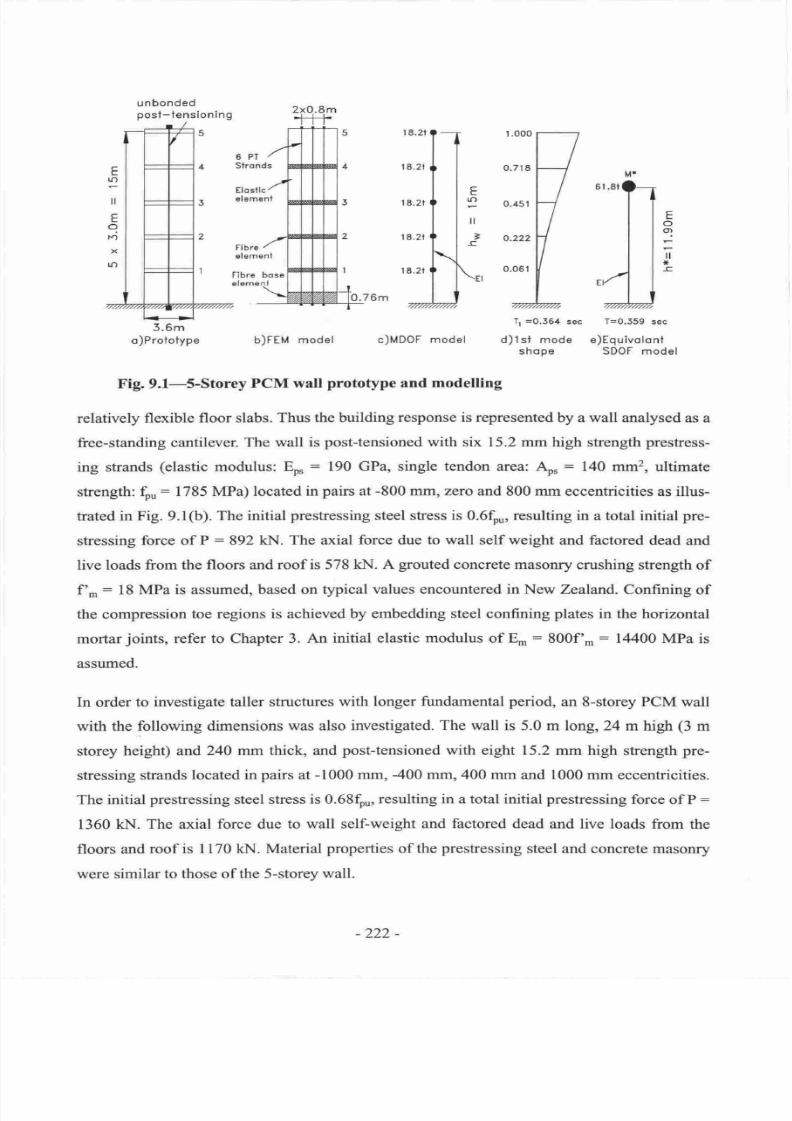
7/21/2019 PHD Laursen-masonry Prestressed Walls
http://slidepdf.com/reader/full/phd-laursen-masonry-prestressed-walls 248/308
E
p
tl
E
o
r;
x
tJ)
Elostlc
tr
lr)
ll
'
E
o
ol
ll
*
b)FEM model
Tr
=0.354
sec
T=0.559
sec
c)MDOF
model
d)1st mode e)Equivolonl
shop€ SDOF model
Fig. 9.l-S-Storey
PCM wall
prototype
and modelling
relatively flexible
floor slabs.
Thus the building
response is
represented by a wall analysed
as
a
free-standing
cantilever
The wall
is
post-tensioned with
six 15.2 mm high
strength
prestress-
ing strands
(elastic
modulus:
Ep,
:
190
GPa,
single
tendon
area:
,\s
:
140 mm2,
ultimate
strength:
fpu:
1785
MPa)
located in
pairs
at
-800
mm,
zero
and 800 mm eccentricities
as
illus-
trated in
Fig. 9.1(b).
The initial
prestressing
steel stress
is
0.6t , resulting in
a
total
initial
pre-
stressing
force of
P
:
892
kN. The axial
force
due
to wall
self weight
and
factored
dead
and
live loads
from the floors
and
roof is
5781d{.
A
grouted
concrete masonry
crushing
strength
of
fn,n
:
18 MPa is assumed,
based on typical
values encountered in New
Zealand. Confining
of
the compression
toe regions is achieved
by embedding
steel
confining
plates
in
the
horizontal
mortar
joints,
refer
to Chapter 3.
An initial elastic
modulus
of
E
:
800f'.
:
14400 MPa
is
assumed.
In
order
to
investigate taller structures
with
longer fundamental
period,
an 8-storey PCM
wall
with the following
dimensions was also
investigated.
The wall
is 5.0
m
long,24
m high
(3
m
storey
height)
and 240 mm thick, and
post-tensioned
with
eight
15.2
mm high
stength
pre-
stressing
strands
located in
pairs
at
-1000
mm, -400 mm,400 mm and
1000 mm eccentricities.
The initial
prestressing
steel shess
is 0.68f0,,,
resulting in
a total initial
prestressing
force
of P
:
1360
kN.
The axial force
due
to
wall
self-weight
and factored
dead
and
live
loads
from
the
floors and roof is I 170
kN. Material
properties
of
the
prestressing
steel and concrete masonry
were similar to those of the
5-storey
wall.
-222
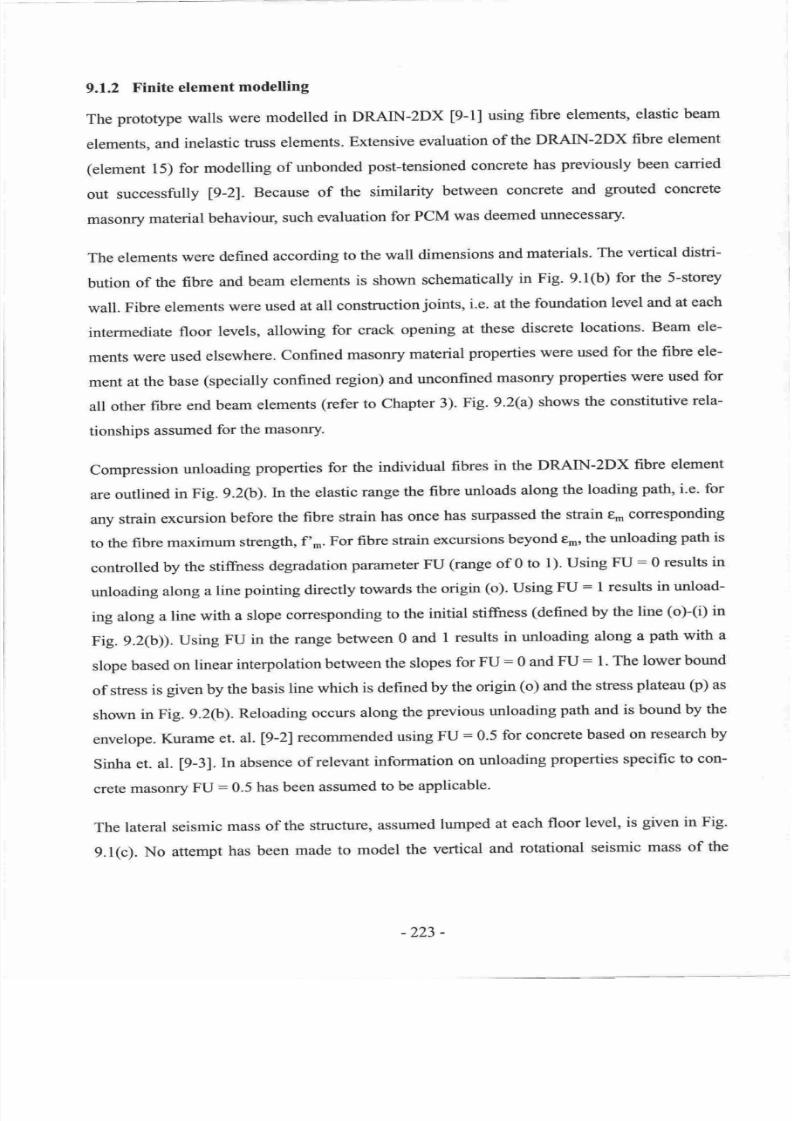
7/21/2019 PHD Laursen-masonry Prestressed Walls
http://slidepdf.com/reader/full/phd-laursen-masonry-prestressed-walls 249/308
9.1.2
Finite
element
modelling
The
prototype walls
were
modelled
in DRAIN-2DX
[9-1]
using
fibre
elements,
elastic
beam
elements,
and
inelastic
truss
elements.
Extensive
evaluation
of
the
DRAIN-2DX
fibre
element
(element 15)
for
modelling
of
unbonded post-tensioned concrete has
previously
been carried
out
successfully
1g-Zl.Because
of
the similarity
between
concrete
and
grouted
concrete
masonry
material
behaviour,
such
evaluation
for
PCM
was
deemed
unnecessary.
The
elements
were
defined
according
to
the
wall
dimensions
and materials.
The
vertical
distri-
bution
of
the
fibre
and
beam
elements
is shown
schematically
in Fig.
9.1(b)
for the
5-storey
wall.
Fibre
elements
were
used
at
all
construction
joints,
i.e.
at
the
foundation
level
and
at each
intermediate
floor
levels,
allowing
for
crack
opening
at
these
discrete locations. Beam
ele-
ments
were
used
elsewhere.
Confined
masonry
material
properties were
used
for
the
fibre
ele-
ment
at
the
base
(specially confined
region)
and
uncon{ined
masonry
properties
were
used
for
all other
fibre
end beam
elements
(refer
to
Chapter
3).
Fig.
9.2(a)
shows
the
constitutive
rela-
tionships
assumed
for
the
masonry.
Compression
unloading
properties
for
the
individual
fibres
in
the
DRAIN-2DX
fibre
element
are
outlined
in
Fig. 9.2(b).
ln
the elastic
range
the
fibre
unloads
along
the
loading
path,
i.e-
for
any
strain
excursion
before
the
fibre strain
has
once
has
surpassed
the strain
em
colresponding
to the
fibre
maximum
strength,
f r.For
fibre
strain
excursions
beyond
e-,
the
unloading
path
is
controlled
by
the
stiftress
degradation
parameter
FU
(range
of
0
to l). Using
FU
:
0
results
in
unloading
along
a
line
pointing directly
towards
the
origin
(o).
Using
FU
:
I
results
in unload-
ing
along
a
line
with
a
slope
corresponding
to
the
initial
stiffness
(defined
by
the
line
(o)-(i)
in
Fig. 9.2(b)).
Using
FU in
the
range
between
0
and
I results
in unloading
along
a
path
with a
slope based
on
linear interpolation
between the
slopes
for
FU:
0 and
FU
:
1.
The
lower
bound
of
stress
is
given
by
the
basis
line
which
is
defined
by
the
origin
(o)
and
the
sfiess
plateau
G)
as
shown
in Fig.
9.2(b).
Reloading
occurs
along
the
previous
unloading
path
and
is bound
by
the
envelope.
Kurame
et.
al.
[9-2]
recommended
using
FU
:
0.5
for
concrete
based
on
research
by
Sinha
et.
al.
t9-3].
[n absence
of
relevant
information
on
unloading
properties specific
to
con-
crete
masonry
FU:0.5
has been
assumed
to
be
applicable
The lateral
seismic
mass
of
the
structure,
assumed
lumped
at
each
floor
level,
is
given
in Fig.
9.1(c).
No
attempt
has been
made
to model
the
vertical
and
rotational
seismic
mass
of
the
^223
-
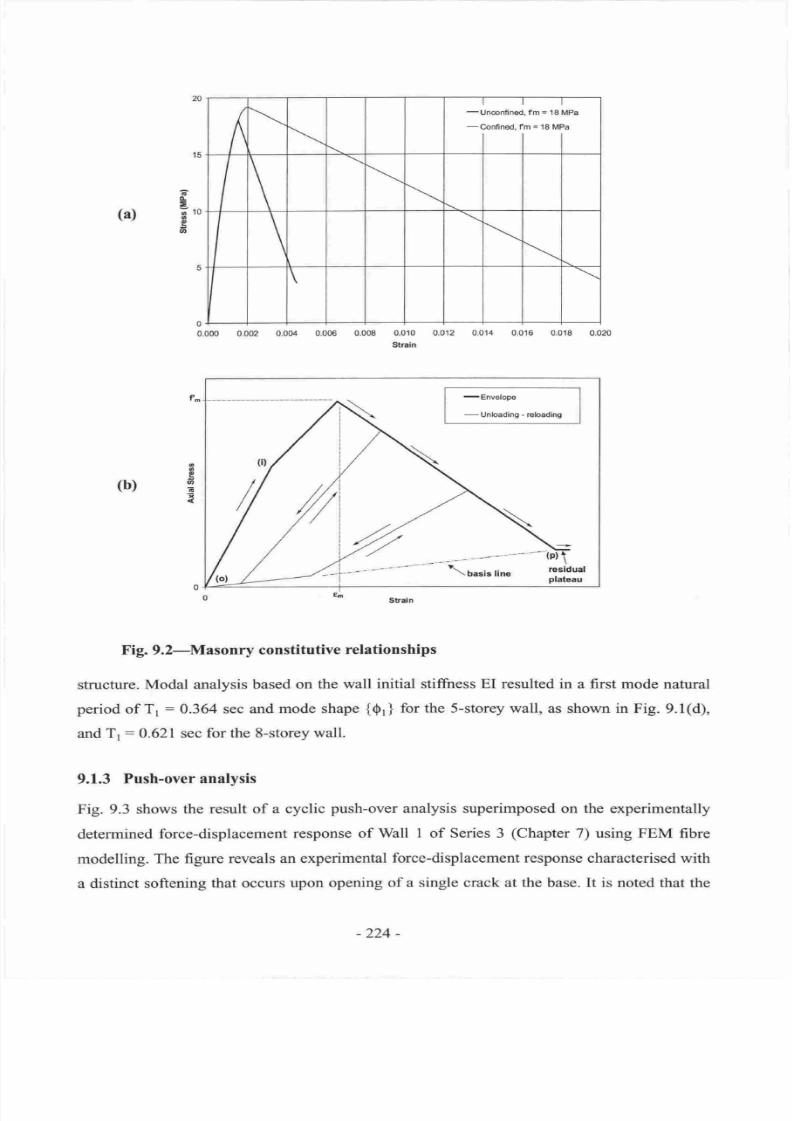
7/21/2019 PHD Laursen-masonry Prestressed Walls
http://slidepdf.com/reader/full/phd-laursen-masonry-prestressed-walls 250/308
6'
A
.
f
ql
rv
\s/
E
g,
/,
-Unconfined,
fm
=
lE MPa
-
Confined, fm
=
18
MPa
\
0.000 0.002 0.0(N 0.006 0.008 0.010 0.012
0.0
t4
0.016 0.018
0.020
Straln
-Envelope
-
Unbading
- rclradirq
(D
I
ft
4
(o)
'-_,:l----
--
_
*-"_""---in)f
-'-.--{*",",,n.
rcsldual
plaleau
Fig. 9.2-Masonry constitutive
relationships
sfucture.
Modal
analysis
based
on
the
wall initial
stiffiress
EI
resulted
in
a
first
mode natural
period
of
T1
:
0.364 sec
and
mode
shape
{0r }
for the
S-storey
wall,
as
shown
in
Fig.
9.1(d),
and Tr
--
0.621sec for
the
8-storey
wall.
9.fJ
Push-over analysis
Fig. 9.3
shows
the
result of
a
cyclic
push-over
analysis
superimposed
on the experimentally
determined force-displacement
response
of
Wall
I
of
Series
3
(Chapter
7)
using
FEM
fibre
modelling.
The
figure
reveals
an
experimental
force-displacement
response
characterised
with
a distinct softening
that
occurs
upon
opening of
a
single crack
at the
base.
It is noted that
the
f^
o
o
e
(b)
g.
n
-224
-
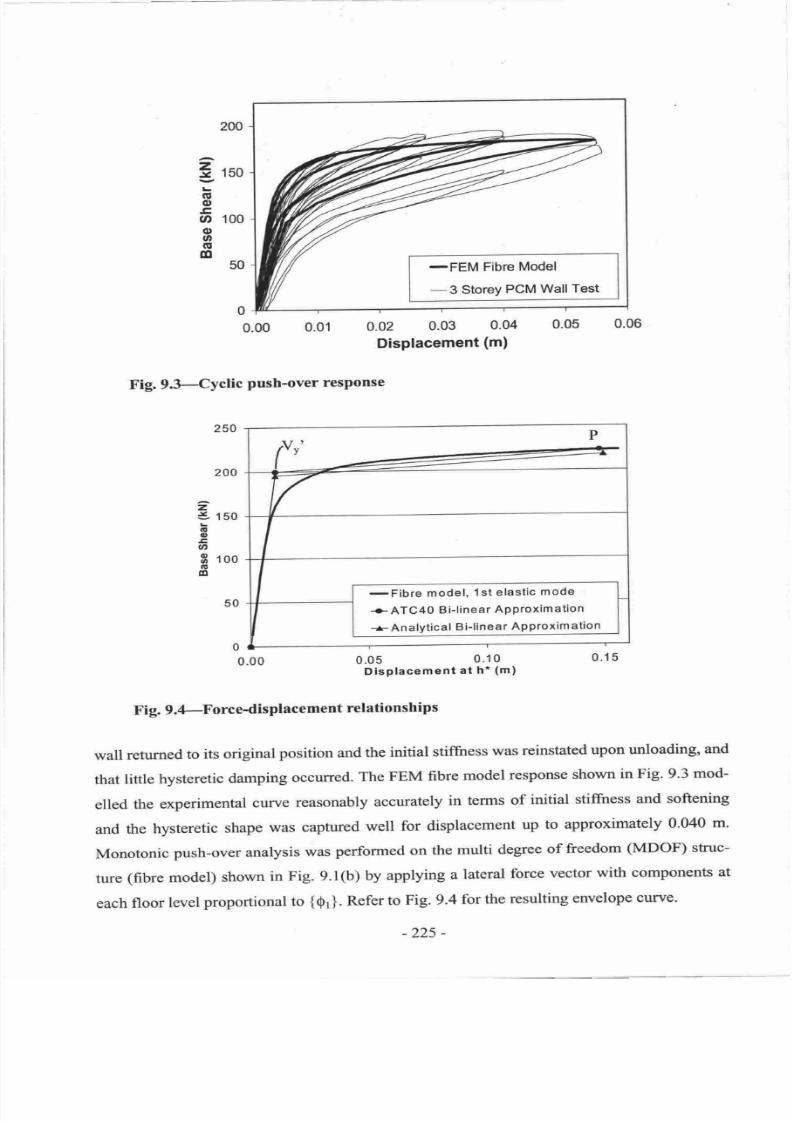
7/21/2019 PHD Laursen-masonry Prestressed Walls
http://slidepdf.com/reader/full/phd-laursen-masonry-prestressed-walls 251/308
200
0
0.00
0.01
o.o2 0.03 0.04
0.05
0.06
DisPlacement
(m)
Fig.
9.3-Cyclic
push{ver
response
0
0.00 0.05
0.10
0.15
Dlsplacement at
h'
(m)
Fig.
9.4-Force-displacement
relationships
wall
returned
to
its
original
position
and
the
initial
stiftress
was
reinstated
upon
unloading,
and
that
little
hysteretic
damping
occurred.
The
FEM
fibre
model
response
shown
in Fig.
9.3
mod-
elled
the experimental
curve
reasonably
accurately
in
terms
of
initial
stiftress
and softening
and
the
hysteretic
shape
was
captured
well for
displacement
up
to approximately
0'M0
m.
Monotonic
push-over
analysis
was
performed
on
the
multi
degree
of
freedom
(MDOF)
struc-
ture
(fibre
model)
shown
in Fig. 9.1(b)
by
applying
a
lateral
force
vector
with
components
at
eachfloorlevelproportionalto
tqr).
RefertoFig.
9.4for
theresultingenvelopecurve.
-
=
150
(E
o
E
(')
100
o
o
o
o
50
250
P
r;
T
I
-Fibre
model,
1st
elastic
mode
-+
ATC40
Bi-linear
APProximation
-+
Analytical
Bi-linear
Approximation
z
5
150
.E
o
u,
S
too
t
o
50
-22s
-
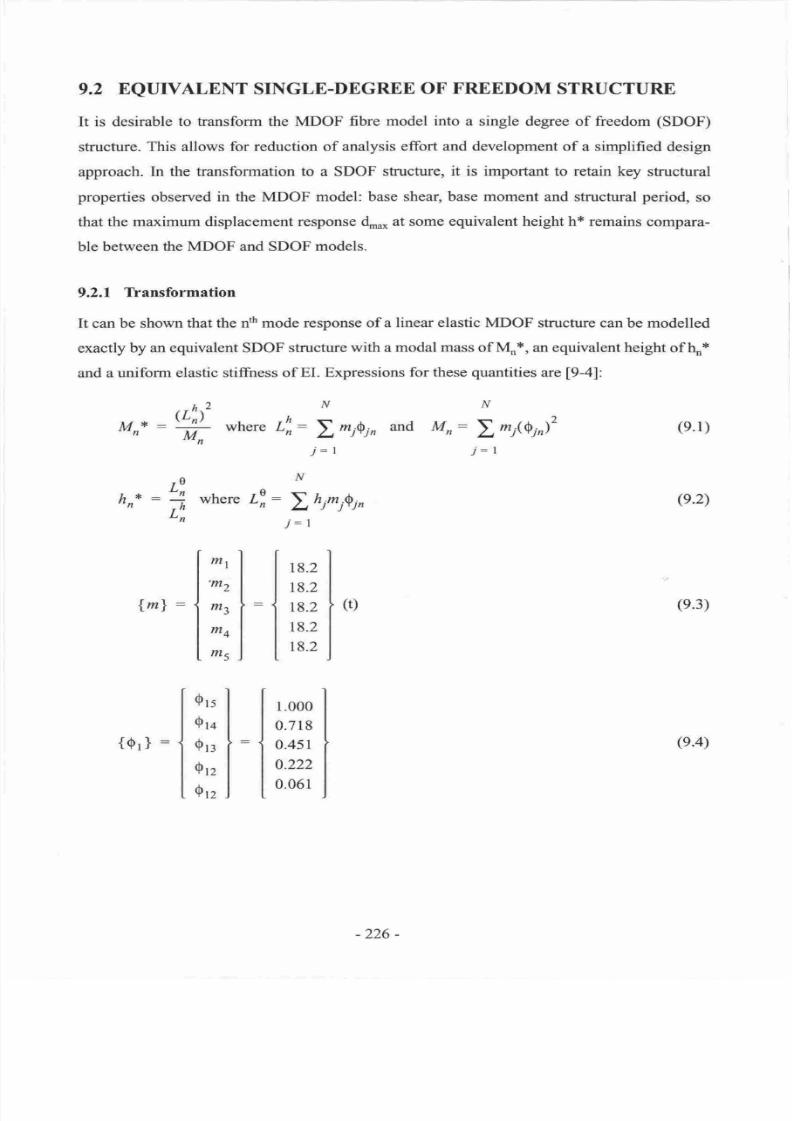
7/21/2019 PHD Laursen-masonry Prestressed Walls
http://slidepdf.com/reader/full/phd-laursen-masonry-prestressed-walls 252/308
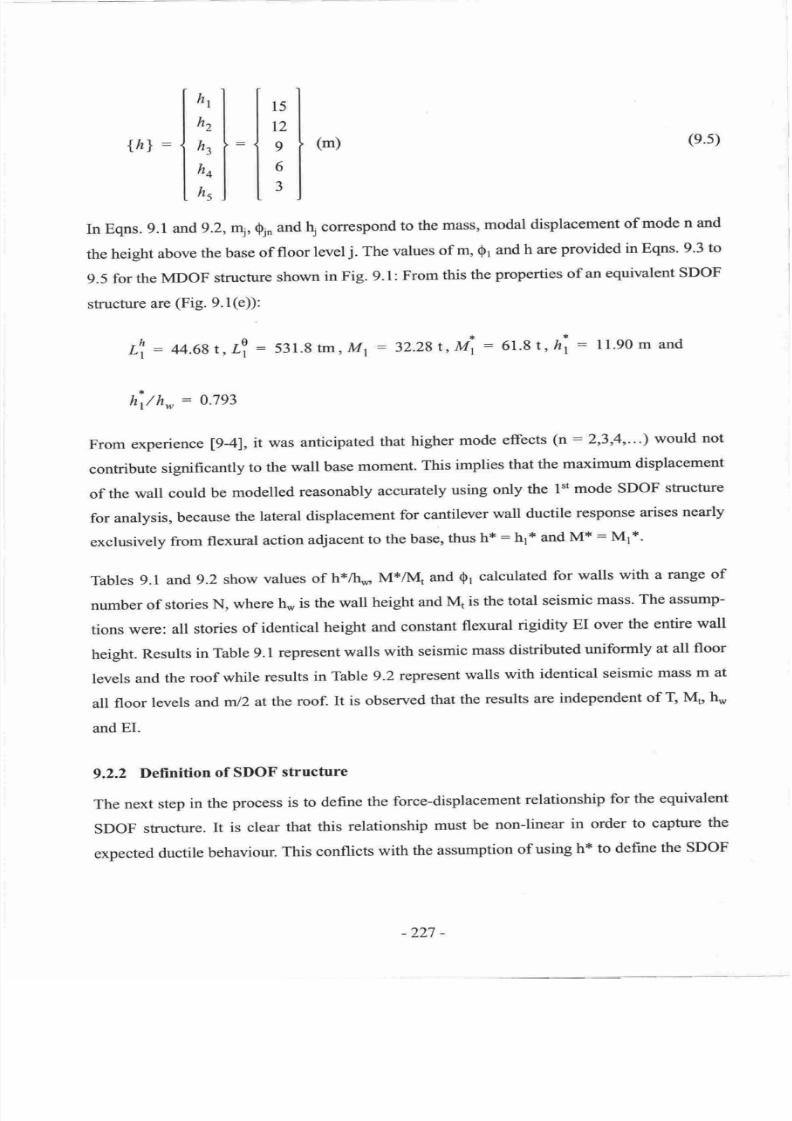
7/21/2019 PHD Laursen-masonry Prestressed Walls
http://slidepdf.com/reader/full/phd-laursen-masonry-prestressed-walls 253/308
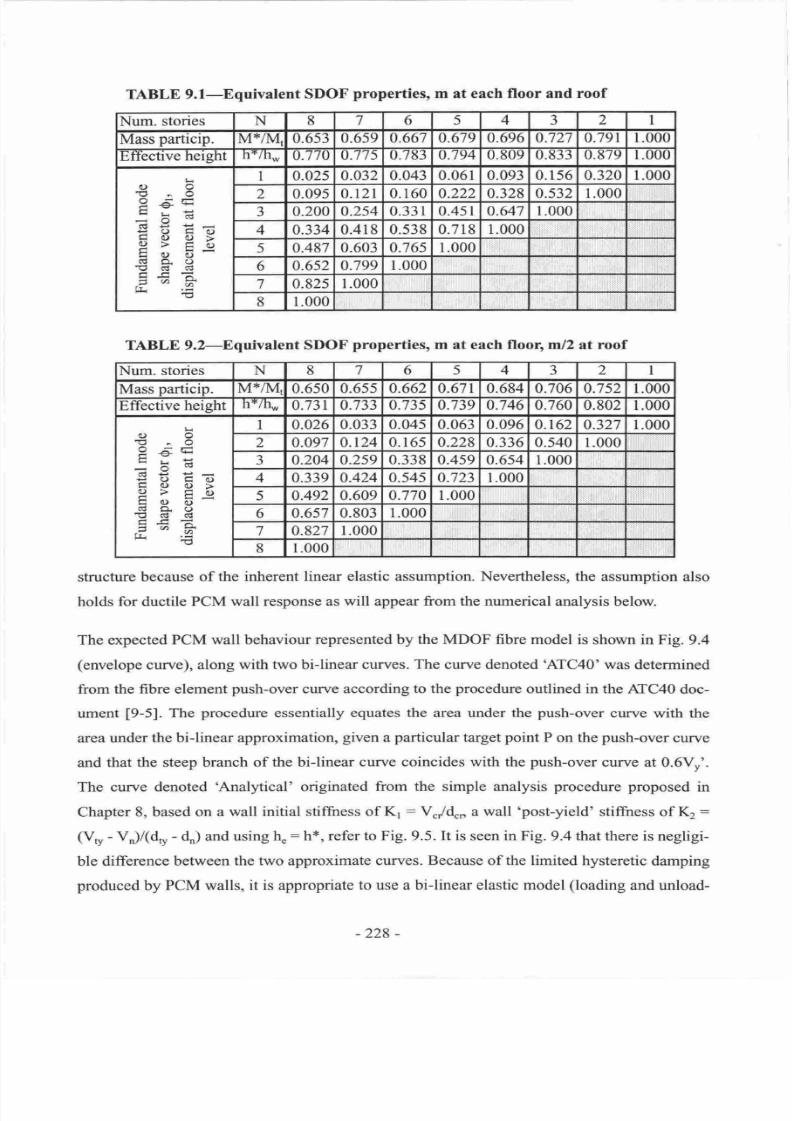
7/21/2019 PHD Laursen-masonry Prestressed Walls
http://slidepdf.com/reader/full/phd-laursen-masonry-prestressed-walls 254/308
TABLE
9.l-Equivalent
SDOF
properties,
m at each floor and
roof
Num. stories
N 8
7 6
5
4
J
2 t
Mass
particip.
M*/M
U.b)J 0.659 0.667
0.679 0.696 0.721 0.791 1.000
Ettbctrve
hetght
ll*/llw
0.'l'lt)
U./IJ
U.
/dJ u. t94
U.6UY
0.E33
U.U
/Y I.UUU
li
oo
VGv
_H
-'v
LA
(J
d I
€Qtrc)
EO0)
I
tro)0)
AA.o
_=tht
lJ-
'-
I
0.025 0.032
0.043 0.061
0.093 0.156
0.320
1.000
2
0.095
0.r21 0.160 0.222 0.328
0.s32 1.000
a
J 0.200
0.254
0.33
r
0.451
0.647 1.000
4 0.334
0.418
0.538 0.718 1.000
5
0.487 0.603
0.765
1.000
6 0.652
0.799
1.000
7
0.825
1.000
8
1.000
TABLE 9.2-Equivalent
SDOF
properties,
m at each floor, m/2 at roof
Num. stories N
8
7
6
5 4
a
J
2
I
Mass
particip.
M*/IV[,
0.650 0.655 0.662 0.67r 0.684 0.706 0.752 1.000
Effective height
h./h,,
0.731 0.733
0.735 0.739 0.746
0.760 0.802 1.000
Lr
oo
v^v
E
6=
L)
d9P-
.t
()
tr {.)
E()()
I
troo)so.()
'ct cd
c
=chx
0.026
0.033 0.04s 0.063 0.096
0.t62
0.327 r.000
2 0.097 0.t24 0.r65 0.228 0.336 0.540 1.000
a
J
0.204 0.2s9
0.338 0.459 0.654 r.000
4 0.339 0.424 0.545
0.723 1.000
5
0.492 0.609
0.770
1.000
6
0.657 0.803
1.000
0.827
1.000
8 L000
structure
because of
the inherent linear elastic
assumption. Nevertheless,
the assumption
also
holds for ductile
PCM
wall
response as
will
appear
from the numerical
analysis
below.
The
expected PCM
wall behaviour
represented
by
the MDOF
fibre model is shown in Fig.
9.4
(envelope curve),
along
with
two bi-linear
curves. The curve denoted
'AIC40'
was determined
from the
fibre
element
push-over
curve
according to the
procedure
outlined in
the ATC40
doc-
ument
[9-5].
The
procedure
essentially
equates the area
under
the
push-over
curve
with
the
area
under the bi-linear approximation,
given
a
particular
target
point
P
on
the
push-over
curve
and that
the
steep
branch of
the
bi-linear
curve coincides
with
the
push-over
curve at 0.6Vr'.
The curve denoted
'Analytical' originated
from the
simple analysis
procedure proposed
in
Chapter
8, based
on a wall initial stifkress
of
K1
=
V./d"",
a
wall
'post-yield'
stiffiress
of
&:
(Vr,
-
V")/(d,,
-
d")
and
using h.
:
h*,
refer
to Fig.
9.5.
It
is
seen
in Fig.
9.4
that
there
is
negligi-
ble difference
between the
two
approximate
curves.
Because
of the limited hysteretic
damping
produced
by PCM walls,
it is appropriate
to use a bi-linear elastic model
(loading
and
unload-
-
228
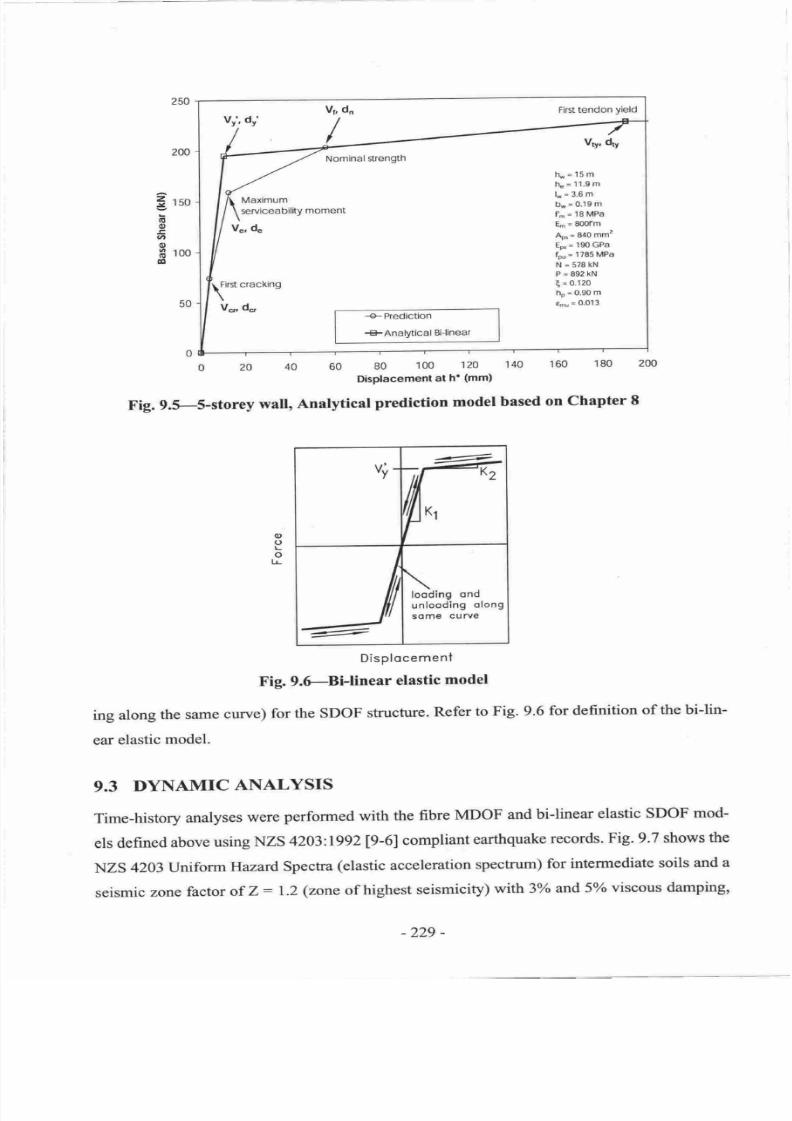
7/21/2019 PHD Laursen-masonry Prestressed Walls
http://slidepdf.com/reader/full/phd-laursen-masonry-prestressed-walls 255/308
250
Vr, dn
/
First
tendon
yield
vv', dv
Nominal
strength
v,y,
d,y
fv=15m
tte= 11.9m
L=3.6m
b.
=
0.19
m
fn
='18
MPa
E-
=
800fm
Ap,
-
840
mm2
Eo'
=
'190
GPa
fp,
=
'1785
MPa
N=578kN
P=89?kN
E
=
0.120
hp
-
0.9o
m
em
=
0.013
Maximum
serviceability
moment
V.,4
First cracKing
V-
do
€-
Predictlon
+FAnalytical
Bi-linear
200
Z rcn
o
0,
t
1t,
q,
fr
100
to
50
o
20
40
60
B0
100
"120
140
160
180 200
DisPlacement
at
h'
(mm)
Fig.9.5-5-storey
wall,
Analytical
prediction
model
based
on
Chapter
I
vy
4
looding
ond
unlooding
olong
some
curve
Displocement
Fig.
9.6-Bi-linear
elastic
model
ing
along
the
same
curve)
for the
SDOF
structure.
Refer
to
Fig.
9.6
for
definition
of
the
bi-lin-
ear
elastic
model.
9.3
DYNAMIC
ANALYSIS
Time-history
analyses
were
performed with
the
fibre
MDOF
and
bi-linear
elastic
SDOF mod-
els
defined
above
using
NZS
4203:199219-6lcompliant
earthquake
records.
Fig.9.7
shows the
NZS
4203
Uniform
Hazard
Spectra
(elastic
acceleration
spectrum)
for
intermediate
soils and
a
seismic
zone
factor
of
Z:
1.2
(zone
of
highest
seismicity)
with
3% and
sYo
viscous
damping,
o
(,
L
o
l
-229
-
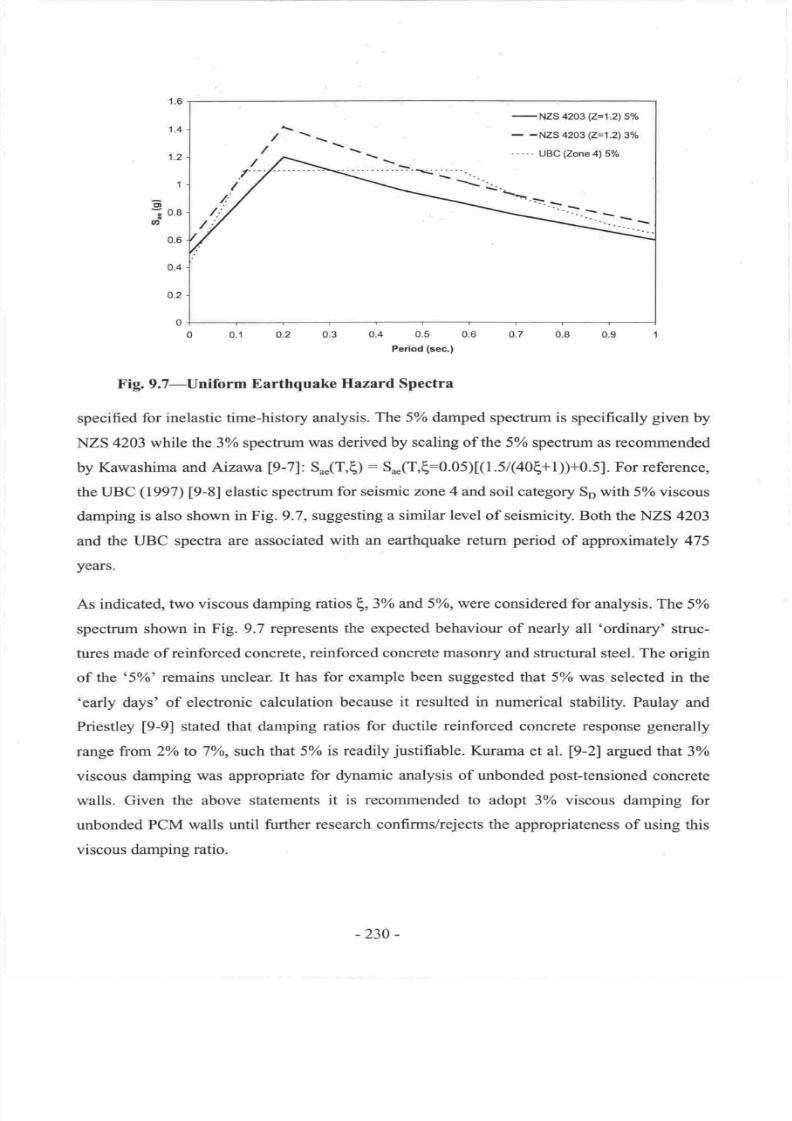
7/21/2019 PHD Laursen-masonry Prestressed Walls
http://slidepdf.com/reader/full/phd-laursen-masonry-prestressed-walls 256/308
1.6
1.4
't.2
o
:0.8
u,
0.6
-ltlZs
4203(Z=1.2)5o/o
-
-NZS
4203
(Z=1.2)
3Yo
----.
UBC(Zone4\5%
/
il
,'/
/
.......\.
: -....
0.2
0.4 0.5
0.6
Period
(sec.)
o.7
0.8
Fig. 9.7-Uniform
Earthquake
Hazard
Spectra
specified
for inelastic time-history
analysis.
The 5% damped
spectrum
is
specifically
given
by
NZS
4203
while
the
3Vo
spectrum
was
derived
by scaling of the
5% specfum
as
recommended
by
Kawashima
and Aizawalg-71: S. (T,E)
:
S .(T,€:0.05)K1.5(408+l)F0.51.
For
reference,
the
UBC
(1997)
[9-8]
elastic
spectrum
for
seismic zone 4 and
soil category
Sp
with
5olo
viscous
damping
is also shown
in Fig. 9.7, suggesting
a similar
level
of
seismicity.
Both the NZS 4203
and
the UBC spectra
are associated
with an earthquake return
period
of approximately
475
years.
As
indicated, two
viscous damping
ratios
8,3%
and sYo, were considered
for analysis. The
5%
spectrum
shown
in Fig. 9.7
represents
the expected
behaviour
of
nearly
all
'ordinary'
struc-
tures
made
of
reinforced concrete,
reinforced concrete masonry
and
structural
steel. The
origin
of
the
'5o/o'
remains unclear.
It
has for example
been suggested
that
5Yo was selected
in
the
'early
days'
of electonic calculation
because
it resulted
in numerical
stability.
Paulay
and
Priestley
[9-9]
stated
that damping
ratios for ductile
reinforced
concrete response
generally
range from
2Vo to 7Yo, such that
5%
is readily
justifiable.
Kurama
et al.
[9-2]
argued that
3%o
viscous
damping was appropriate
for dynamic analysis of unbonded
post-tensioned
concrete
walls. Given the
above statements
it is
recommended
to adopt 37o viscous damping
for
unbonded
PCM walls
until
further
research
confirms/rejects the
appropriateness
of
using this
viscous damping
ratio.
0.9.3.2.'l
-230-
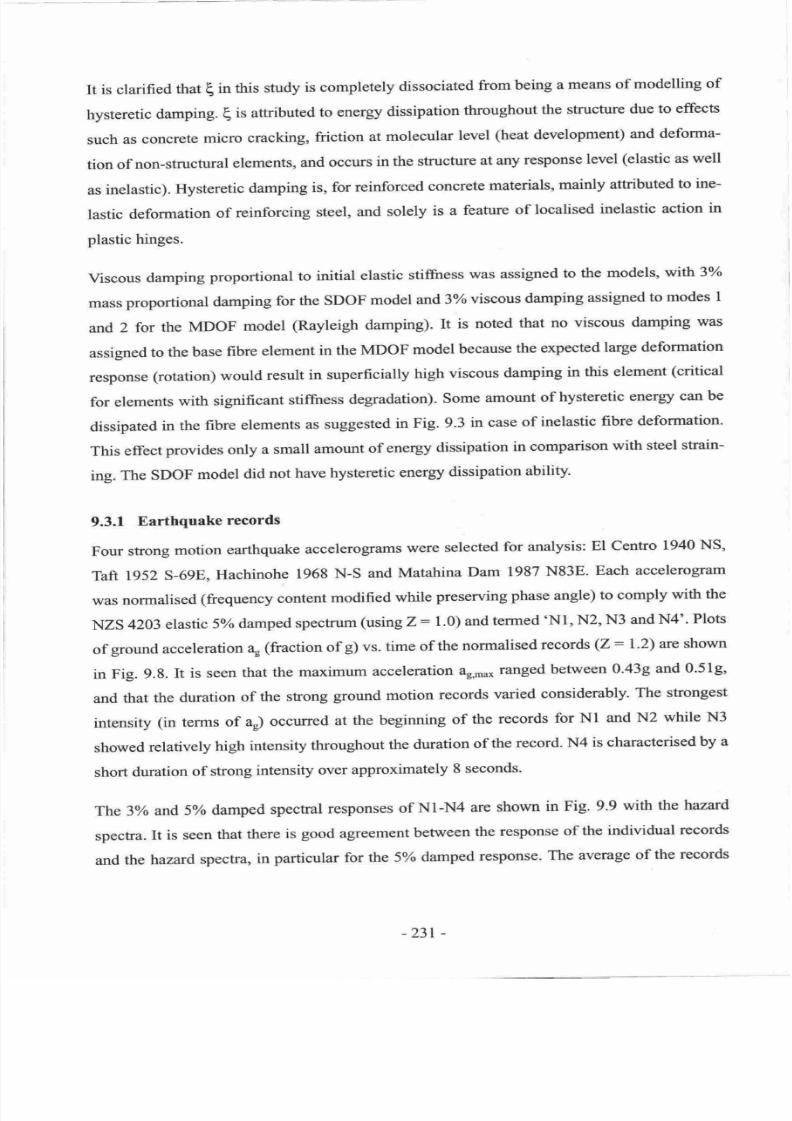
7/21/2019 PHD Laursen-masonry Prestressed Walls
http://slidepdf.com/reader/full/phd-laursen-masonry-prestressed-walls 257/308
It is clarified
that
(
in
this
study
is
completely
dissociated
from being
a
means
of
modelling
of
hysteretic
damping.
I
is
attributed
to
energy
dissipation
throughout
the
structure
due to effects
such
as
concrete
micro
cracking,
friction
at
molecular
level
(heat development)
and
defonna-
tion of non-structural
elements,
and
occurs in the structure
at any response
level
(elastic
as
well
as
inelastic).
Hysteretic
damping
is, for
reinforced
concrete
materials,
mainly
attributed
to ine-
lastic
deformation
of
reinforcing
steel, and
solely
is
a
feature
of
localised
inelastic
action
in
plastic
hinges.
Viscous
damping
proportional
to
initial
elastic
stiffiress
was
assigned
to
the
models,
with
3
mass
proportional
damping
for
the SDOF
model
andSo/oviscous
darnping
assigned
to modes
I
and
2 for
the
MDOF
model
(Rayleigh
damping).
It
is
noted
that
no
viscous
damping
was
assigned
to the
base
fibre
element
in
the
MDOF
model
because
the
expected
large
deformation
response
(rotation)
would
result
in superficially
high
viscous
damping
in
this
element
(critical
for
elements
with
significant
stiffness
degradation).
Some
amount
of
hysteretic
energy
can
be
dissipated
in
the
fibre
elements
as suggested
in
Fig.
9.3
in case
of
inelastic
fibre
deformation.
This
effect
provides
only
a
small
amount
of
energy
dissipation
in
comparison
with steel
strain-
ing.
The SDOF
model
did
not
have
hysteretic
energy
dissipation
ability.
9.3,1
Earthquake
records
Four
strong
motion
earthquake
accelerograms
were
selected
for
analysis:
El Centro
1940
NS,
Taft
Lg52
S-6gE,
Hachinohe
196g
N-s
and
Matahina
Dam
1987
N838.
Each
accelerogram
was
nornalised
(frequency
content
modified
while
preserving
phase
angle)
to comply
with
the
NZS
4203
elastic
5 o damped
spectrum
(using
Z:
1.0)
and
termed
'Nl,
N2,
N3
and
N4'.
Plots
of
ground acceleration
a,
(fraction of
g)
vs.
time
of
the
normalised
records
(Z
=
|
.2)
are
shown
in Fig.
9.8.
It
is seen
that
the
maximum
acceleratioll
Bg,max
ranged between
0.439
and
0.51g'
and
that the
duration
of
the
srong
ground motion
records
varied
considerably'
The
strongest
intensity
(in
terms
of
a)
occurred
at
the beginning
of
the
records
for
Nl
and
N2
while
N3
showed
relatively
high
intensity
throughout
the
duration
of
the record.
N4
is characterised
by
a
short
duration
of
strong
intensity
over
approximately
8 seconds.
The
3
and 5o/o
damped
spectral
responses
of
Nl-N4
are
shown
in Fig. 9.9
with
the
hazard
spectra.
It
is
seen
that there
is
good
agreement
between the
response
of
the
individual
records
and
the
hazard
spectra,
in
particular
for
the 5
damped
response.
The
average
of
the records
-23t
-
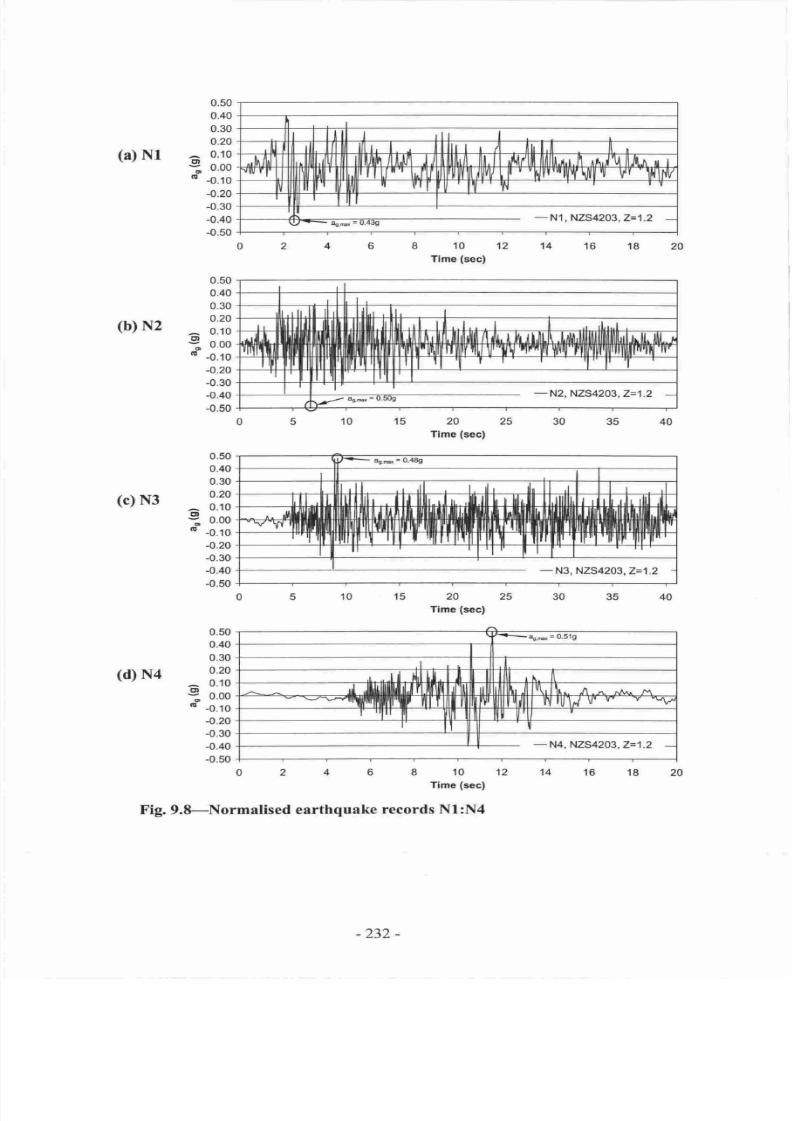
7/21/2019 PHD Laursen-masonry Prestressed Walls
http://slidepdf.com/reader/full/phd-laursen-masonry-prestressed-walls 258/308
0.50
0.40
0.30
0.20
(a)
Nl
^
o.1o
s,
o.oo
-0,10
-0.20
-0.30
-0.40
-0.50
(b) N2
0.50
0.40
0.30
0.20
^
0.10
?
o.*
-0.10
-0.20
-0.30
-0.40
-0.50
(c) N3
(d)
N4
0.50
0.40
0.30
0.20
^
0.10
{
o.oo
-0.10
-0.20
-0.30
-0.40
-0.50
81012
Tlme
(sec)
20
6
4
40
50
5
0
20
25
Tlme
(sec)
20 25
Time
(sec)
81012
Time
(sec)
0.50
0.40
0.30
0.20
^
0.10
*
o.*
t
-0.10
-0.20
-0.30
-0.rrc
-0.50
4050
5
0
18
Fig.
9.8-Normalised
earthquake
records
Nl
:N4
ll
,ll
vtu
I
l'
lu ''
lil
fl'q
UII'I
uf
lfl lfiy
t\|
ll ll1
'l
f
I
I
|/
'tl'
til
-N1,
NZS4203,Z=1.2
llLr
lllll.lltlll
llilrl
.rl ll..l,..l I
.,,1,,..t
tl
rllll
I
tll
l,
'l
tl
l
I
v.-./
as*
=
0'5Og
arE
=
0.489
I' ,l
tlllllr
.
lll
lllh
,lr'
,lllllh
t
lh.ll
ffi
r[
ltilll'I
tll
I
rqllt
ltTlllt14 t
'l
ltrlil'f
[ 1
I'
-N3,
NZS4203,Z=1.2
-ar*=0.519
.,
.II tillt.
lilt
ll
rl ,Illlllflltl,Il
t,
\'lh^. n.*
rAr^
.n
'$tnll;lt'lt
lll
If
llJl^/
v'
v'
-
-*v
,rltl
I
-N4,
NZS4203,Z=1.2
-232
-
7/21/2019 PHD Laursen-masonry Prestressed Walls
http://slidepdf.com/reader/full/phd-laursen-masonry-prestressed-walls 259/308
1.6
g
1'o
c
€
1.2
o
E1
c
o
E
o.e
g
o
E
o.o
.9
E
o.+
o
t,
0.2
0
1.2
a
=1
o
o
I
o.e
6
tr
o
E
0.6
g
o
o
a
t
o.r
'E
g
.'
o
O.z
o'1
o'2
o'3
o'4
t
t* a
n t rt
o'7
0'8
0'9
1
Fig.9.9-Spectral
response
of
N1:N4,
3o/o
and
57o
damping
Nl:N4
(shaded lines)
show
close
correlation
with
both
the 3o/o
and
5o/o
damped
hazard
specta.
The
motivation
for
using
these
normalised
(artificial) records
was
to
reduce
variation
of
response
of
the
models
as a
result
of
variability
in earthquake
records
and
to
ensure
code
com-
pliance.
9.3.2
Time-History
response:
MDOF
vs.
SDOF'
Fig.
9.10
shows
the
time-history
response
of
the 5-storey
MDOF
and
equivalent SDOF
struc-
tures
in terms
of
lateral
displacement
at
h* due
to
Nl
through
N4.
The SDOF
bi-linear
relation-
-MS4203
,Z=1.2,3To
-N1,3%
--N2,3%
-N3,3%
-N4,3%
-..*-*Avorage
N1:M
3%
(a)3%
damping
-N2S4203,2=1.2,1Yo
-N1,5%
--N2,5%
-N3.
50/6
-
-N4,5%
-
*-
Average
Nl :1,14 5%
-233
-
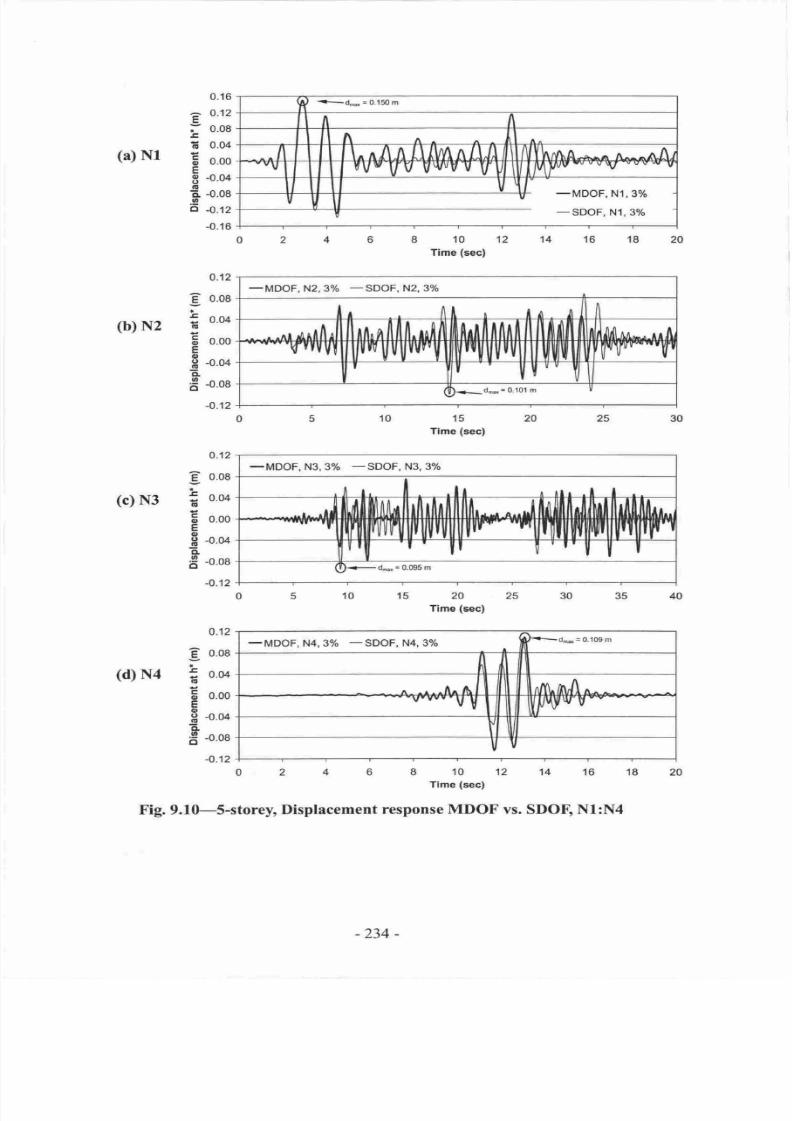
7/21/2019 PHD Laursen-masonry Prestressed Walls
http://slidepdf.com/reader/full/phd-laursen-masonry-prestressed-walls 260/308
(a)
Nl
(b)
N2
(c) N3
(d)
N4
0.16
;
o.12
l-
o.oe
E
f
0.04
6
o.oo
E
E
-0.04
o
E
-0.08
.9
o
-o.12
-0.16
0.12
€
o.oo
t
f
o.o+
a
E
o.oo
E
0,
H
-0.04
CL
f;
o.oe
-o.12
o.12
E
o.oe
;
0,04
o
b
0.00
E
o
-0.04
c
f;
-o.oe
^o.12
0,12
€
o.oe
o.*
G
b
0.00
E
o
H
-0.04
-rL
S
-o.oa
-0.12
81012
Time
(sec)
15
Time
(sec)
15 20
25
Time
(sec)
-MDOF,
N4,37o
-SDOF,
N4'
37o
P--d.-=o.1oe.
^
-^^^^^
al
^/ILm/l
^
,,.'.'-
V
U
/l
JVw
v'
l,|v
18
4
30
500
40
50
0
0246
810121416
Time
(sec)
Fig. 9.10-5-storey,
Displacement
response
MDOF
vs. SDOE,
Nl:N4
20
-d.*=0..t50m
fi
n A
./l \^ nAn
illlnaAllJt
\rrl\A^^^ n^^-rrA
vl
UV'
v
vwvvv
u
yl
NV
v
-MDOF,
Nl,3%
-SDOF,
Nl, 37O
-MDOF,
N2,3%
-SDOF,
N2, 3%
l.
/Il r ln.
/1
ll
-^{frfi{
Hffi
ftduq ru
ffi
lltw
ffim-s
I
Yv
il
@-o*=o.tot
m
-MDOF,
N3,3olo
-SDOF,
N3,
3olo
I
I It r rl. -l
I
hr{
llll,r ll tll
t
lh
ll ll
llll,
-
-
"..
J
llllllfl
ll dllhl ll tlMlh,.
ryTrll
l|l ll |ll|ll il
ll["-
""llullll[Yil,ulllllftll|F'
If
'l
lt
'r'l
|
|
( )-dffi.0.0e5m
-234-
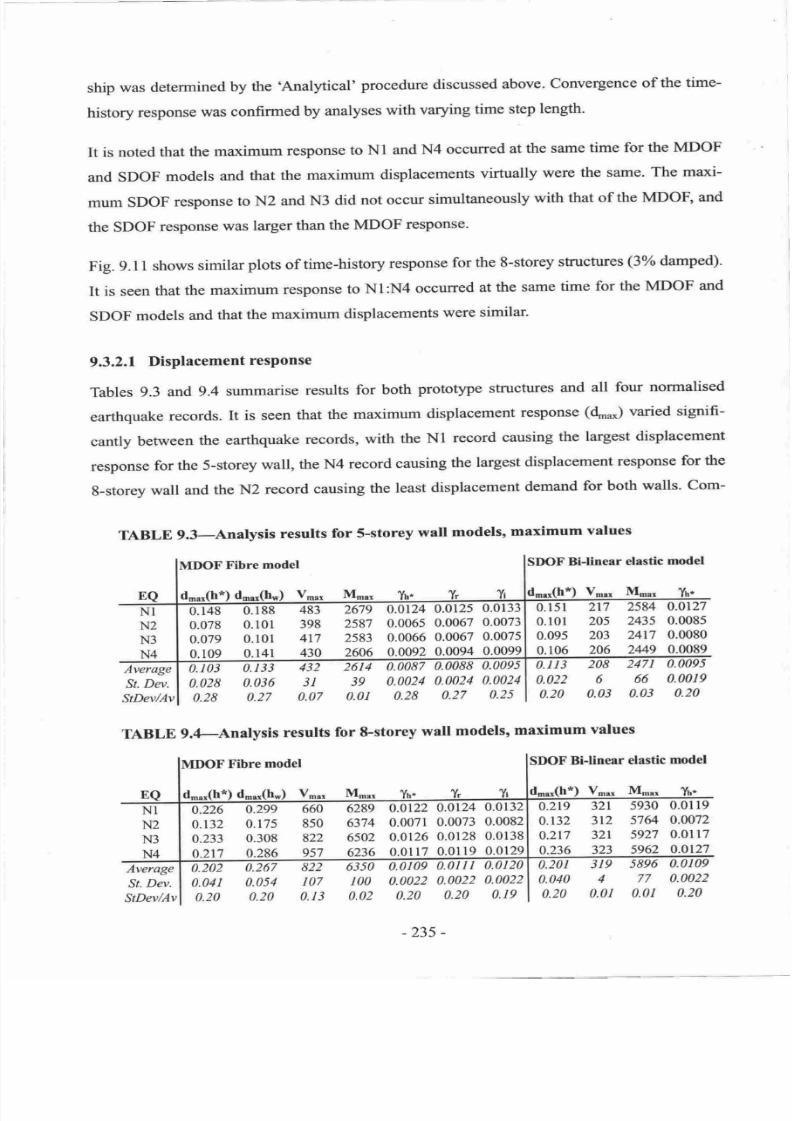
7/21/2019 PHD Laursen-masonry Prestressed Walls
http://slidepdf.com/reader/full/phd-laursen-masonry-prestressed-walls 261/308
ship
was determined
by
the 'Analytical'
procedure
discussed
above.
Convergence
of
the
time-
history
response
was
confirmed
by analyses
with
varying
time
step
length.
It
is noted
that
the
maximum
response
to
Nl and
N4
occurred
at the
same
time
for the MDOF
and
SDOF
models
and
that
the maximum
displacements
virtually
were
the
same.
The
maxi-
mum
SDOF
response
to
N2 and
N3
did not
occur
simultaneously
with
that of
the
MDOR
and
the SDOF
resporxie
was
larger
than
the
MDOF
response.
Fig.
9.I
I shows
similar
plots
of time-history
response
for
the
8-storey
sffuctures
(3%
damped)'
It
is seen
that
the
maximum
response
to
N1:N4
occurred
at
the
same
time
for
the MDOF
and
sDoF
models
and
that
the
maximum
displacements
were
similar.
9.3.2.1
Displacement
resPonse
Tables
9.3
and
9.4
summarise
results
for
both
prototype
structures
and
all
four
normalised
earthquake
records.
It is
seen
that
the
maximum
displacement
response
(d.*)
varied
signifi-
cantly
between
the earthquake
records,
with
the
Nl
record
causing
the
largest
displacement
response
for
the
S-storey
wall,
the
N4
record
causing
the
largest
displacement
response
for
the
g-storey
wall
and
the
N2 record
causing
the
least
displacement
demand
for
both
walls- Com-
TABLE
9.3-Analysis
results
for
S-storey
wall
models,
maximum
values
MDOF
Fibre
model
SDOF
Bi-linear
elestic
model
d..r(h*)
v
Mr ,
N1
N2
N3
N4
0.
t03
0./,33
0.028
0.036
0.28
0.27
432
2614
0.0087
31
39
0.0024
0.07
0.01
0.28
0.0088
0.0095
0.0024
0.0024
0.27
0.25
2t7
2584
0,0127
205 2435
0.0085
203
2417
0.0080
206
2449
0.0089
2471
0.0095
6
66
0.0019
0.03
0.03
0.20
0.151
0.101
0.095
0.106
0.113
0.022
0.20
Average
St.
Dev.
StDev/Av
TABLE
9.4-Anatysis
results
for 8-storey
wall
models,
maximum
values
MDOF
Fibre
model
SDOF
Bi-linear
elastic
model
EQ
NI
N2
N3
N4
*)
d. r(h*
*)v
0.2t9
0.r32
0.2t7
0.236
0.201
0.040
0.20
321
3t2
32r
323
319
4
0.01
0.01l9
0.0072
0.01l7
0.0t27
0.0109
0.0022
0.20
5930
57&
5927
5962
5896
77
0.01
Average
St.
Dev.
StDev/Av
0.202
0.267
0.041
0.054
0.20
0.20
822
6350
107
100
0.I3
0.02
0.0109
0.0111
0.0120
0.0022
0.0022
0.0022
0.20
0.20
0.19
ffi
o.ol24
0.0125
o.ol33
0.078
0.101
398
2587
0.0065
0.0067
0.0073
0.079
0.101
4r7
2583
0.0066
0.0067
0.0075
0.109
0.141
430
2606
0.0092
0.0094
0.0099
0.n6
0.299
660
6289
0.0122
0.0124
0.0132
0.132
0.175
850
6374
0.0071
0.0073
0.0082
0.233
0.308
822
6s02
0.0126 0.0128
0.0138
0.217
0.286
9s7
6236
0.0117
0.0119
0.0129
-235-
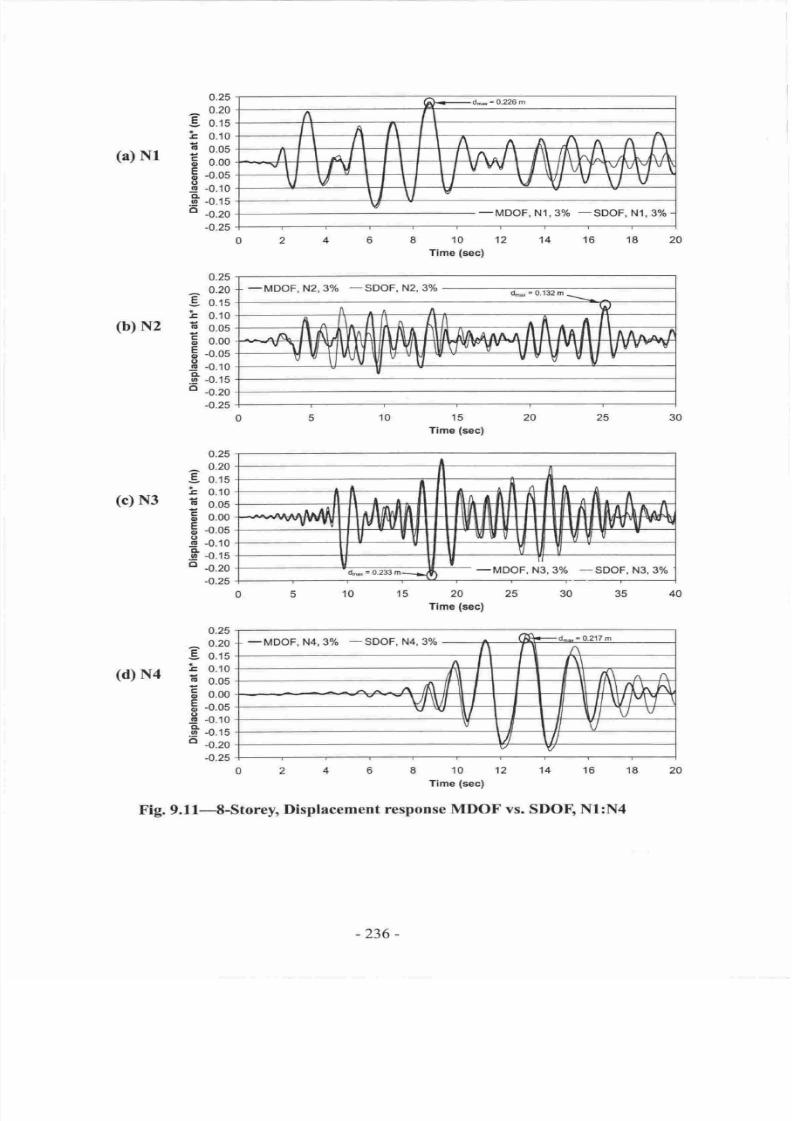
7/21/2019 PHD Laursen-masonry Prestressed Walls
http://slidepdf.com/reader/full/phd-laursen-masonry-prestressed-walls 262/308
(a)
Nr
(b)
N2
(c) N3
(d)
N4
0.25
^
0.20
€
o.rs
i
o.1o
o.os
5
o.oo
E
+.os
-E
-o.ro
.fr
-o,rs
o
-0.20
-0.25
0.25
^
0.20
.9
o.rs
i
o.ro
o.os
5
o.oo
E
-o.os
o.ro
.6
-o.rs
o
-0.20
-0.25
o.25
^
0.20
€
o.rs
i
o.ro
o.os
6
o.oo
F
-o.os
t
-o.ro
.F
-o.rs
o
-0.20
-0.25
o.25
^
0.20
5.
o.rs
i
o.ro
o.os
5
o.oo
F
-o.os
E
-o.ro
E
-o.rs
o
-o.zo
-0.25
10
12
Time
(sec)
15
Time
(sec)
-MDOF,
N3,370
-SDOF,
N3,370
15
20
Time
(sec)
-MDOF,
N4,3%
-SDOF,
N4, 370
/\
ffi
n
/[\nA
ra
I
VI
ll,/
\v/"
II III VV
V
I il\l
l
II
vv
20
64
30
5
0246810
12 14'16 18
Time
(sec)
Fig.
9.11--8-Storey,
Displacement
response
MDOF
vs.
SDOE,
N1:N4
G}
=O.?2Gm
A
I
A
nnA"/\nn
/l
-1
ln
,l
-t
vvvIt\l/,\ rlvfvlv,v
IV
V Y/
V
\/
V
\
v
v
-MDOF,
N1,306
-SDOF,
N1,3%'
-
MDOF, N2,
37o
-
SDOF,
N2,
3%
q*
=
0132 m
\_.=
A
^r
/t
{
/i
^
l\
n
(lll
l
rl
*-+llfl#fh
A-a
ra
a
fl
AAr.
vwv'
-1,
ll lf
Yll
lf
lrvv"
-v
v
v
lf'vu vl
"
-t?
vv
V
v
U
-236-
7/21/2019 PHD Laursen-masonry Prestressed Walls
http://slidepdf.com/reader/full/phd-laursen-masonry-prestressed-walls 263/308
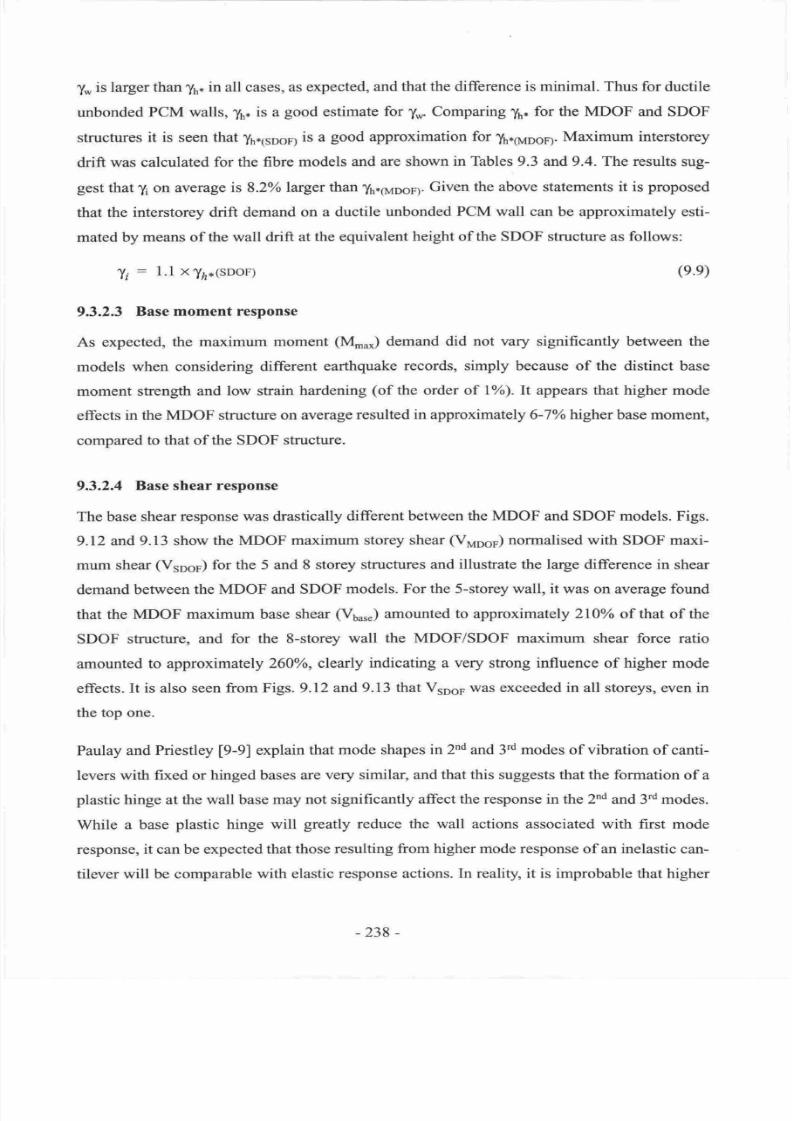
7/21/2019 PHD Laursen-masonry Prestressed Walls
http://slidepdf.com/reader/full/phd-laursen-masonry-prestressed-walls 264/308
1*
is larger than
y5*
in
all cases,
as expected,
and that the difference is minimal. Thus for
ductile
unbonded
PCM walls,
fi',
is a
good
estimate
for
y*
Comparing
y1,*
for
the
MDOF and
SDOF
structures
it is seen that
y1r1se6ry is a
good
approximation
for
{,.6,1oory.
Maximum interstorey
drift
was calculated
for
the
fibre
models and
are
shown
in
Tables
9.3
and
9.4.
The
results
sug-
gest
that
Ti
on
average
is 8.2Vo
larger than
{,*iyooo,.
Given the above statements it is
proposed
that the
interstorey drift demand
on a
ductile
unbonded
PCM wall
can
be
approximately esti-
mated by
means of the wall
drift
at
the equivalent
height of
the
SDOF
structure
as
follows:
t
:
1.1 xTr,*(sDOF)
9.3.2.3
Base moment response
As expected,
the maximum
moment
(M. J
demand
did not vary significantly
between the
models
when considering different
earthquake
records,
simply
because
of the
distinct base
moment strength
and low strain hardening
(of
the order of L%). h appears that higher
mode
effects
in the MDOF structure
on average
resulted
in
approximately 6-7Vo higher
base
moment,
compared
to that of the SDOF structure.
9.3.2.4
Base shear response
The base shear response
was drastically
different
between the MDOF
and SDOF models.
Figs.
9.12
and 9.13 show
the MDOF maximum
storey shear
(Vr,aoor)
normalised with
SDOF maxi-
mum shear
(Vsoor)
for the 5 and 8
storey structures
and
illustrate
the large difference
in
shear
demand
between
the MDOF
and SDOF
models. For
the
5-storey wall, it
was on average found
that
the MDOF
maximum
base
shear
(Vu , )
amounted
to
approximately 210%o of that
of the
SDOF
structure,
and
for
the 8-storey
wall the MDOF/SDOF maximum
shear
force
ratio
amounted
to
approximately 260%,
clearly indicating
a
very
strong influence
of
higher
mode
effects.
It
is also seen from Figs. 9.12 and
9.13 that V5o6r was exceeded in
all storeys,
even
in
the top one.
Paulay and
Priestley
[9-9]
explain
that mode shapes
in 2nd
and 3'd
modes
of vibration
of
canti-
levers
with fixed or hinged bases are
very
similar,
and
that this
suggests
that
the
formation
of a
plastic
hinge at
the
wall
base
may
not significantly
affect the response in
the
2nd
and 3'd modes.
While
a
base
plastic
hinge
will
greatly reduce the wall actions associated
with
first
mode
response, it can be expected
that those
resulting
from higher
mode response of an inelastic
can-
tilever will be comparable with
elastic
response actions.
In
reality, it
is
improbable that higher
(e.e)
-238
-
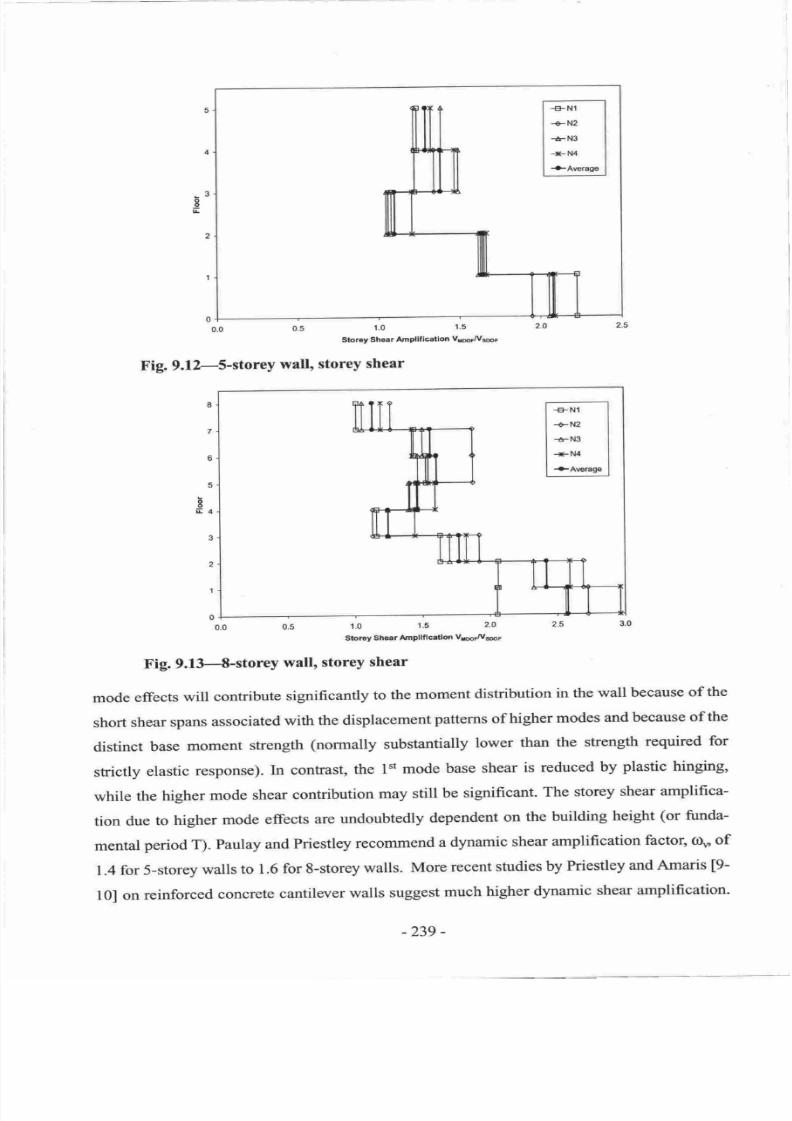
7/21/2019 PHD Laursen-masonry Prestressed Walls
http://slidepdf.com/reader/full/phd-laursen-masonry-prestressed-walls 265/308
4
_3
8
E
2
1
0
0.0 0.5
l'0
1'5
Storoy
Shsr
AnPllll€tld
VIs'V@t
Fig. 9.12-5-storey
wall,
storey
shear
5
T
E4
3
2
1
1.5
2.0
2.5
StotEY
Sh€€r Amplmcrdon
VFoCVmr
Fig.
9.13-8-storey
wall,
storey shear
mode
effects
will
contribute
significantly
to
the
moment
distribution
in
the
wall
because
of
the
short
shear
spans
associated
with
the displacement
patterns
of higher
modes
and
because
of
the
distinct
base
moment
strength
(normally
substantially
lower
than
the
strength
required
for
strictly
elastic
response).
ln
contrast,
the
I't
mode
base
shear
is
reduced
by
plastic
hinging,
while
the
higher
mode
shear
contribution
may
still
be
significant.
The
storey
shear
amplifica-
tion
due
to
higher
mode
effects
are
undoubtedly
dependent
on
the
building
height
(or
funda-
mental
period T).
paulay
and
Priestley
recommend
a dynamic
shear
amplification
factor,0)
of
1.4
for
5-storey
walls
to
1.6
for
8-storey
walls.
More
recent
studies
by
Priestley
and
Amaris
[9-
l0] on
reinforced
concrete
cantilever
walls
suggest
much
higher
dynamic
shear
amplification.
0
.{-
0.0
-239
-
7/21/2019 PHD Laursen-masonry Prestressed Walls
http://slidepdf.com/reader/full/phd-laursen-masonry-prestressed-walls 266/308
Values
of
c.\
:
I .8 for
4-storey
walls and
ou:2.5
for 8-storey walls
were found when
compar-
ing results
from SDOF
displacement
based analysis
with
MDOF ductile
time-history
analysis.
Research
by Kurame
t9-11]
on
precast
unbonded concrete
cantilever walls
also
confirm
shear
amplification
of
such
magnitude.
The observations
by
Priestley
and
Amaris and by
Kurame correspond
well
with
the 5-storey
and
8-storey
analyses
results
given
above.
This holds despite
the fact that unbonded PCM
shows
of
significantly
lower
hysteretic
damping
and
lower viscous damping
(3
assumed)
than
RC and
RCM, that
in
conjunction
are likely
to
less effectively suppress
higher mode
effects.
As will be
shown in section
9.5,
the achieved
base
moment reduction due
to rocking
(hingrng
adjacent to
the base)
relative to
purely
elastic
response
was 4 for the 5-storey
wall
and
5
for the
8-storey wall,
thus the
SDOF base shear
was reduced 4-5 fold but the MDOF
(real)
base
shear
reduced with only
4/2.1
:
1.9 for the S-storey
wall
and
5/2.6:
1.9
for the
8-storey
wall
-
clearly a significant
contribution to
the
base shear
from
higher mode effects. It is
finally
noted that
more accurate
estimation of c4
could be achieved by
more accurate modelling
of the
actual
wall shear stiffness,
however
this was beyond
the
scope of
this study.
Given
these results, it
was concluded that
the
SDOF
model, defined
above,
predicted
the wall
displacement
response at h* and the
base moment
with reasonable
accuracy, and that the base
shear demand
could suitably
be
predicted
by
estimating the amplification due to higher
mode
effects, e.g.
using interpolation
between oJr:2.1
for
the
S-storey
wall
(T
:
0.364 sec) and
rou
:
2.6
for
the
8-storey
wall
(T:
0.621
sec) based on
the building fundamental
period
T
(extrapo-
lation may be
used for buildings
of
period
lower than
T
:
0.364 sec). Altematively, the wall
aspect
ratio A,:
h*/l*
may simply be used
for
interpolation
to find
CIu because
this
parameter
is
indicative
of
the
building
period
and
dynamic
properties.
It
should be
kept
in
mind that
the
proposed
values
are
valid for force reductions
R of 4
to
5
(see
next section for definition
of
R).
Using
R:
1
(purely
elastic response)
will
result in
cl,
slightly higher than 1.0 because
the
'full'
I't
mode actions
(base
moment and base
shear) that dominate
purely
elastic
response
will be
developed.
Therefore, both
the wall aspect
ratio,
A,,
and
the
achieved force reduction, R,
should
be
considered when
estimating
ton
9.4
SPECTRAL ANALYSIS
Spectral
analysis consists
of
calculating
the nominal structural
response
as
a function
of
the
structural
period
T for
given
structural
characteristics.
In the
present
case, the characteristics
-240 -
7/21/2019 PHD Laursen-masonry Prestressed Walls
http://slidepdf.com/reader/full/phd-laursen-masonry-prestressed-walls 267/308
were
the
strain
hardening
ratio cr
:
KzA(r
and
the
viscous
damping
ratio
(.
A
parametric analy-
sis
has
shown
that
the
ratio
c
is typically
of the
order
of
0.01
to
0.02.
Calculations
were
per-
formed
for
two
viscous
damping
ratios:
3%
and
SVo.
The
bi-linear
elastic
SDOF
model,
as
illusfrated
in
Fig.
9.6
was
characterised
by
the
following
parameters:
initial
stiftress
K1,
post-yield
stiffiress
K2,
yield
strength
Vr'
and
seismic
mass
M*.
It
is
noted
that
the
yield
strength
signifies
the
wall
strength
at which
wall
response softens
due
to opening
of
the
base crack;
it
is not
associated
with
yielding of
the
prestressing
steel.
9.4.1
Elastic
response
The
minimum
wall yield
strength
V,
required
to
ensure
purely
elastic
wall
response
(a
value
strictly
associated
with
developing
the
base
moment
M,
:
Vrh*
for
the SDOF
structure)
was
determined
as
the
maximum
wall
strength
demand
for
given T, Kr,
M*,
e
and
earthquake
record
(Ee.
The
elastic
spectral
acceleration
S
was
defined
as
Vy/gM*.
It can
easily
be
shown
that
Su :
fr(T,
E,
EQ);
noting
that
Su
is independent
of
choice
of
Kt'
The
reader
is
reminded
that
the
spectral
acceleration
for
the elastic
structure,
S ,
merely
can
be
read
off
the
Uniform
Earttrquake
Hazard
Spectra
in
Fig.
9.7
because
of
normalisation
of
the
earthquake
records.
9.4.2
Ductile
resPonse
The
wall
ductile
response
was
calculated
for
a
range
of
force
reduction
values
R, defining
the
yield
strength
of
the
ductile
sDoF
structure
as
\'
:
Vr/R'
where
v,
was
determined
from
the
elastic
response
as explained
above.
The
definition
of
Vr',
Kr
and
K, is
shown
in Fig'
9'6'
A
realistic
range
of
R
values,2 -
6,was
selected,
reflecting
typically
achieved
force
reduction
for
ductile
reinforced
concrete
masonry
cantilever
walls.
The
spectral
displacement
56
:
frI(T'
&
cL
e,
Ee)
was
defined
as
the
maximum
recorded
displacement
for a
given
calculation
and
has
the
unit
of
lenglh.
It is
observed
that
56
is
independent
of
the choice
of
K1
and
K2.
Running
multiple
time-history
SDOF
analyses
with
various
K,
(but
constant
M*/K,
ratio)
confirmed
the
independence
of
the
choice
of
K1 and
K2.
9.4.3
Spectral
disPlacement
Fig.
9.
14
shows
the spectral
displacement
for a
:
lo/o
and
q
:
3Yo
and
5%.
A
period
range
of
0.1
sec
to
1.0 sec
was
investigated,
R
was varied
between
2
and6,
and
responses
from
the
four
-24r -
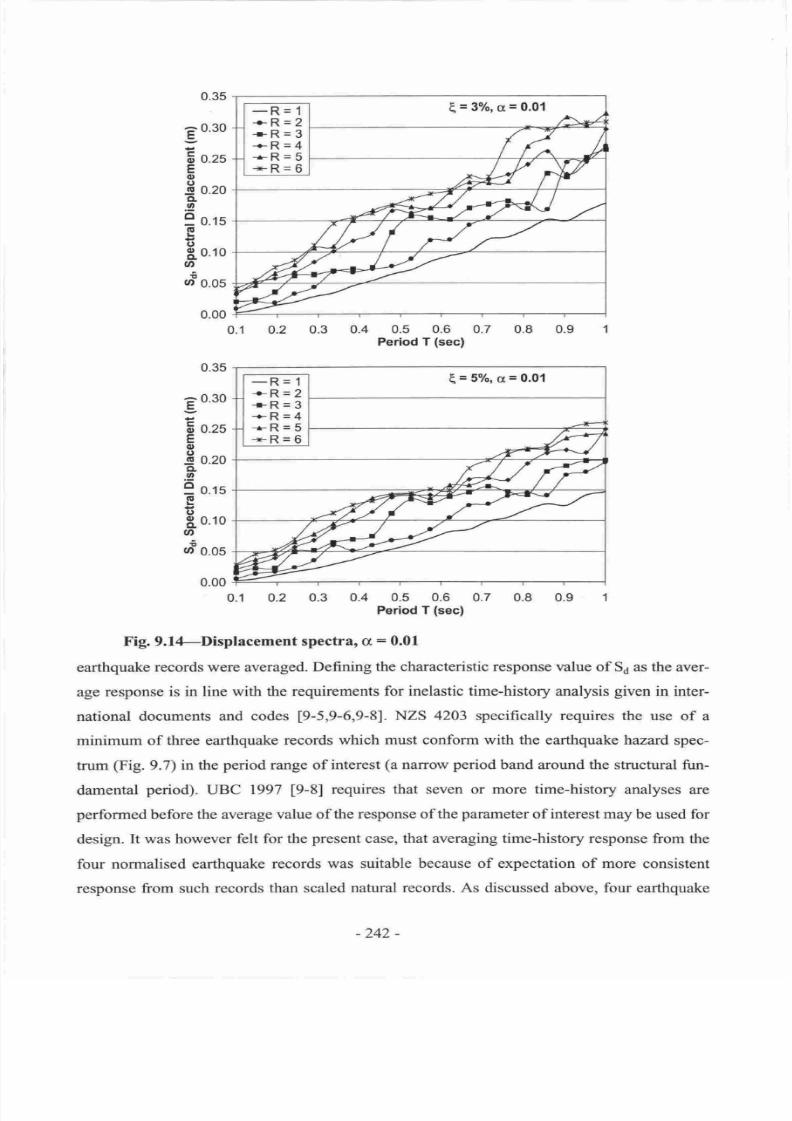
7/21/2019 PHD Laursen-masonry Prestressed Walls
http://slidepdf.com/reader/full/phd-laursen-masonry-prestressed-walls 268/308
0.35
0.4 0.5 0.6
0.7
Period T
(sec)
0.35
o 1 o'2 o'3 o
o
,"?r3o
r?;1"r
o't
o'8
o'e 1
Fig.
9.l4-Displacement
spectra, cx
:
0.01
earthquake records were
averaged.
Defining
the characteristic
response
value
of
36
as
the aver-
age
response is in line
with
the
requirements
for
inelastic time-history analysis
given
in
inter-
national
documents and
codes
19-5,9-6,9-81.
NZS 4203 specifically requires the
use of a
minimum
of
three earthquake
records
which must conform
with
the earthquake hazard
spec-
trum
(Fig.
9.7) in
the
period
range
of
interest
(a
narrow
period
band around the
structural
fun-
damental
period).
UBC 1997
[9-8]
requires that seven or more time-history
analyses
are
performed
before the average
value
of
the response of
the
parameter
of interest may be
used for
design.
It was however felt for the
present
case, that
averaging
time-history response from
the
four normalised earthquake
records
was suitable because of expectation of more consistent
response
from such records
than scaled
natural
records.
As
discussed above, four earthquake
a
0.30
E
;
6
o.zs
E
o
(
0.20
CL
.9
3
o.rs
E
o
g
0.10
o
lt
u,
0.05
a
0.30
tr
;
5
o.zs
E
o
c
0.20
TL
.9
3
o.ts
o
(,
&
0.10
o
E
(,'
0.05
0.2
.1
E,=3Yo,
g
=
0.01
-R=1
+-R=2
-r-R=3
-.-R=4
-*-R
=
5
-x-R=
6
E=5o/o,o=0.01
-R=
1
-e-R=2
-r-R
=
3
-+-R
=
4
-*-R
=
5
-*-R
=
6
-242
-
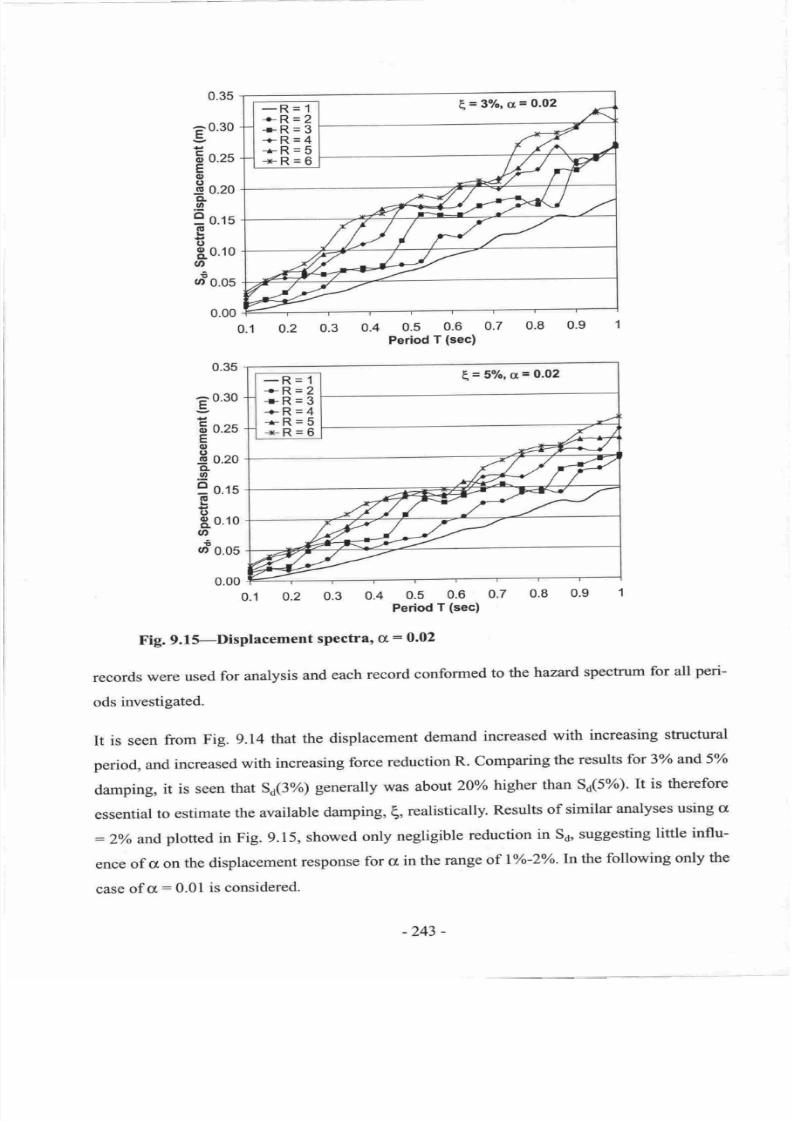
7/21/2019 PHD Laursen-masonry Prestressed Walls
http://slidepdf.com/reader/full/phd-laursen-masonry-prestressed-walls 269/308
E,=3Vo,a=0.02
-R=1
+-R=2
-+R=3
+-R=4
+-R=5
-x-R
= 6
0.35
0.1
0.2
0.4 0.5 0.6
0.7
Period
T
(sec)
0.00
o'1
o'2
o'3
oo
,*3or?;l"l
o't
Fig.
9.I5-Displacement
spectra,
ct,
:
0.02
records
were
used
for
analysis
and
each
record
conformed
to
the
hazard
spectrum
for all
peri-
ods
investigated.
It
is
seen
from
Fig. 9.14
that
the
displacement
demand
increased
with
increasing
stnrctural
period,
and
increased
with
increasing
force
reduction
R. Comparing
the
rezults
fot
3o/o
and5/o
damping,
it is
seen
that
56(3%)
generally was
about
20%
lngher
than
Sd(5%)'
It is
therefore
essential
to
estimate
the
available
damping,
(, realistically.
Results
of
similar
analyses
using
o
:2vo
and
plotted
in Fig.
9.15,
showed
only
negligible reduction
in
56,
suggesting
little
influ-
ence
of cr
on
the displacement
response
for cr
in
the
range
of
l%-2Yo.In
the
following
only
the
case
of cr:0.01
is
considered.
a0.30
E
;
E
o.zs
E
o
E
0.20
CL
.t2
3
o.ts
IE
o
90.10
o
0'
0.05
0.00
=0.30
E'o
ru
E
o
o.zo
EL
.9
3
o.rs
o
t
go.1o
tt
(/,
0.05
0.35
1=So/o,a=0.02
-R=1
e-R
=
2
-rR=3
-+R=4
-*-R=5
-x-R=6
-243
-
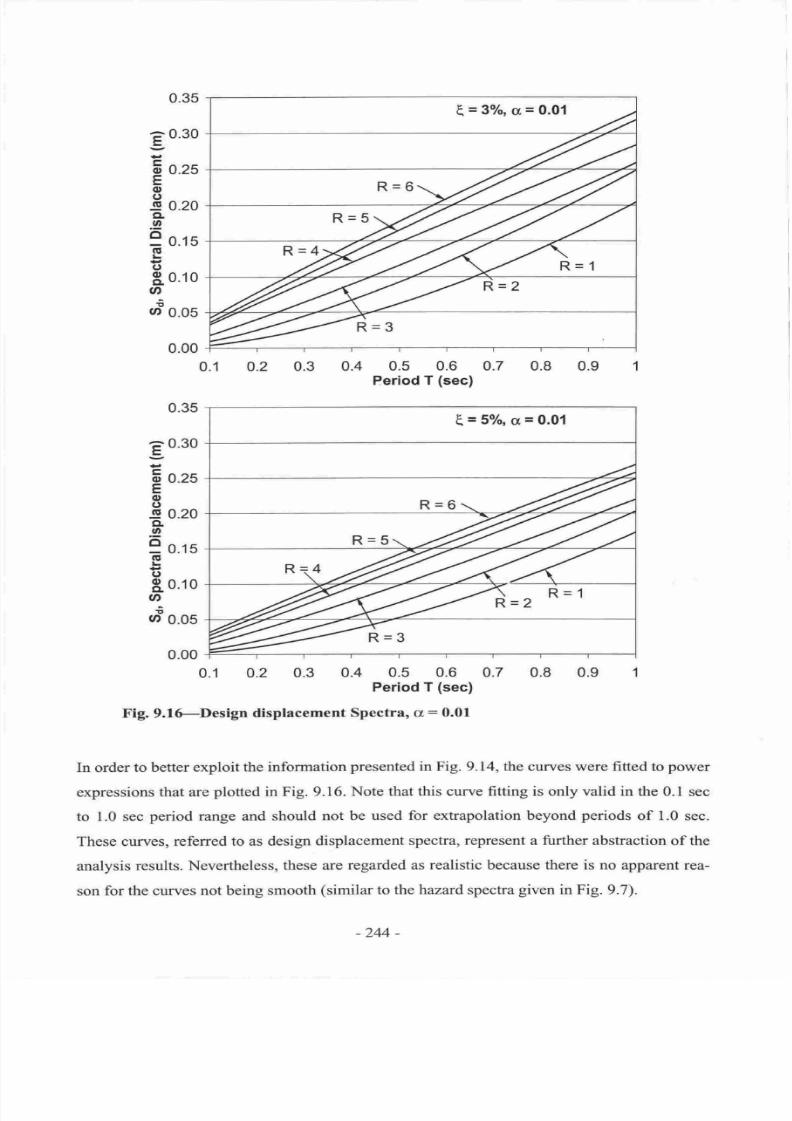
7/21/2019 PHD Laursen-masonry Prestressed Walls
http://slidepdf.com/reader/full/phd-laursen-masonry-prestressed-walls 270/308
0.35
0.00
0.2
0.3
0.4
0.5 0.6
a.7
Period T
(sec)
0.35
0.00
0.1 0.2 0.3 0.4 0.5 0.6
0.7
Period
T
(sec)
Fig. 9.16-Design
displacement
Spectra,
cr
:
0.01
In order to better
exploit the
information
presented
in Fig. 9.14, the curves were fitted
to
power
expressions
that
are
plotted
in Fig. 9.16.
Note that
this curve fitting is only valid in the
0.1 sec
to
1.0 sec
period
range and should
not
be used for extrapolation beyond
periods
of
1.0
sec.
These curves,
referred
to as design
displacement
spectra, represent a further abstraction
of the
analysis
results. Nevertheless,
these are
regarded
as
realistic
because
there is no apparent
rea-
son
for the curves
not being smooth
(similar
to
the hazard spectra
given
in Fig.
9.7).
a
0.30
tr
;
6
o.zs
E
o
()
-G
0.20
CL
.9,
=
0.15
IE
(,
g
0.10
a
E
(/,
0.05
0.1
0.8 0.9
a
0.30
=
;
E
o.zs
E
o
(J
g
0.20
EL
. )
=
0.15
IE
(,
g
0.10
U'
E
u,
0.05
0.9.8
E=
3o/o,
cr
=
0.01
Z=
SVo,
cr
=
0.01
-244-
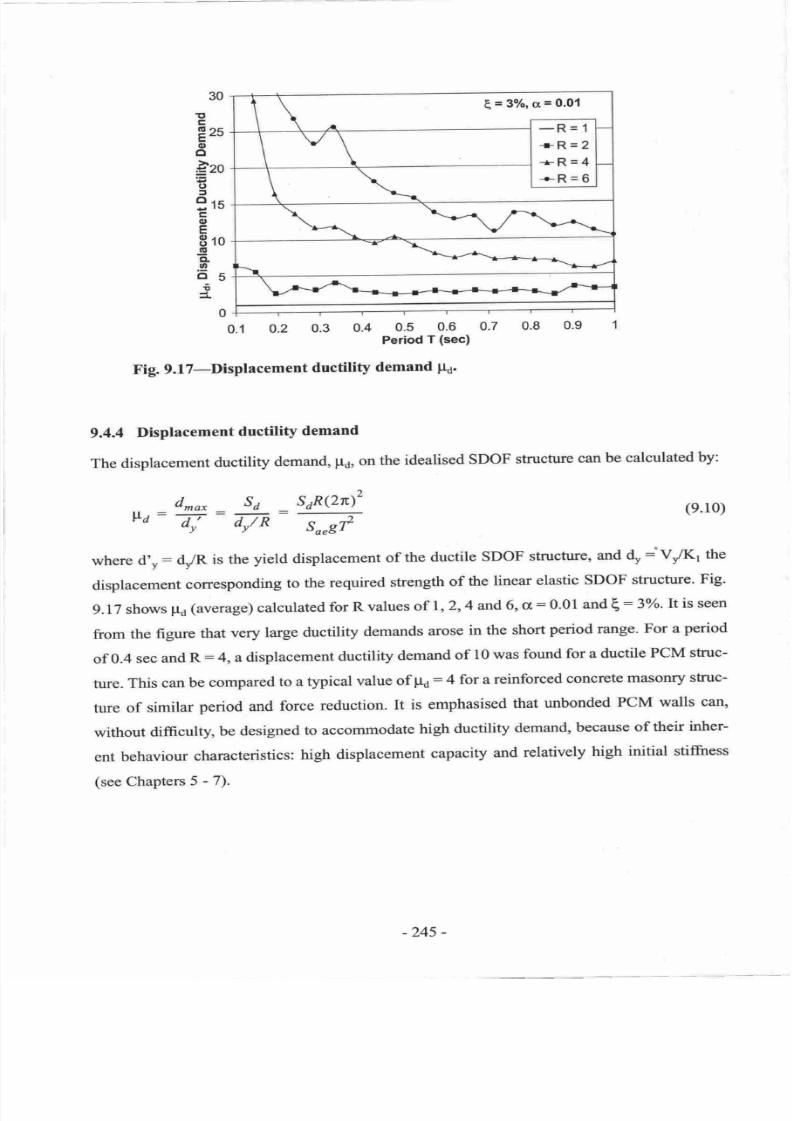
7/21/2019 PHD Laursen-masonry Prestressed Walls
http://slidepdf.com/reader/full/phd-laursen-masonry-prestressed-walls 271/308
30
It
c
F25
E
o
o
Bzo
t
3
3rs
E
o
E
8to
g
CL
.9
o5
0
0.1
0.2
0.3
o.o
,J;3o
r?;?"r
o't
0.8
0'e
Fig.
9.l7-Displacement
ductility
demand
p4.
9.4.4
Displacement
ductility
demand
The
displacement
ductility
demand,
Fo,
on
the
idealised
SDOF
structure
can
be
calculated
by:
d^o" ,Sd
S6R(2n\2
lro-T:T7n
W
(e.10)
where
d,r:
d./R
is
the
yield
displacement
of
the
ductile
SDOF
structure,
and
E
JV/t<t
ttt
displacement
corresponding
to
the
required
strength
of
the
linear
elastic
SDOF
stmcture.
Fig.
9.
17
shows
p6
(average)
calculated
for
R
values
of
l
,
2,
4
and
6,
d
:0'0
1
and
1:
3o/o' It
is
seen
from
the
figure
that
very
large
ductility
demands
arose
in
the
short
period
range.
For a
period
of
0.4
sec
and
R:
4,
a
displacement
ductility
demand
of
l0 was
found
for
a
ductile
PCM
struc-
ture.
This
can
be
compared
to
a typical
value
of
lta:4
for
a reinforced
concrete
masonry
stuc-
ture
of
similar
period
and
force
reduction.
It
is
emphasised
that
unbonded
PCM
walls
can,
without
difficulty,
be
designed
to
accommodate
high
ductility
demand,
because
of
their
inher-
ent
behaviour
characteristics:
high
displacement
capacity
and
relatively
high
initial stiftress
(seeChapters5-7).
t,=3T",
a
=
0.01
-245-
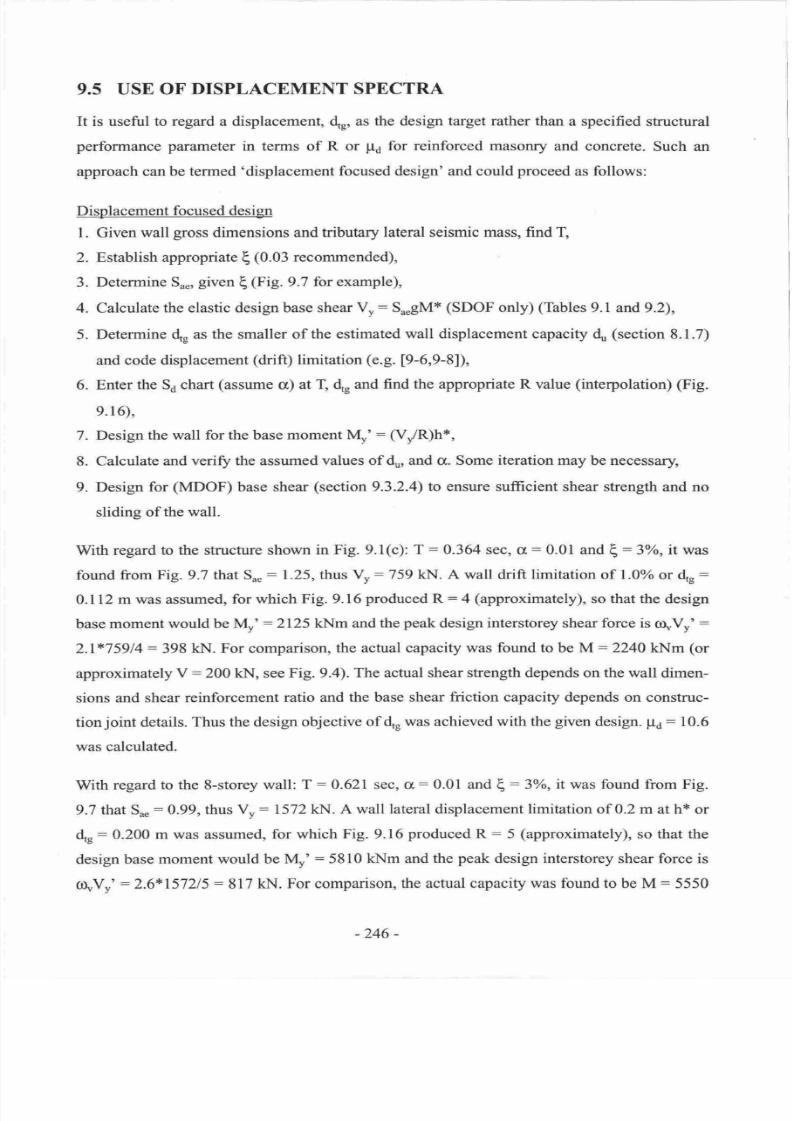
7/21/2019 PHD Laursen-masonry Prestressed Walls
http://slidepdf.com/reader/full/phd-laursen-masonry-prestressed-walls 272/308
9.5
USE OF
DISPLACEMENT SPECTRA
It is
useful
to
regard
a
displacement,
4g,
as
the design target rather than
a specified
structural
performance
parameter
in
terms
of R or
p6
for reinforced masoffy
and
concrete. Such
an
approach
can
be
termed
'displacement
focused
design' and
could
proceed
as
follows:
Displacement
focused
desi
gn
l.
Given
wall
gross
dimensions
and tributary
lateral seismic
mass, fmd T,
2.
Establish appropriate
[
(0.03
recommended),
3.
Determine
Su ,
given
€
(Fig.
9.7
for
example),
4.
Calculate
the elastic design
base shear V,
:
SugM*
(SDOF
only)
(Tables
9.1
and
9.2),
5.
Determine
4c
as
the
smaller
of
the estimated
wall
displacement
capacity
d
(section
8.1.7)
and code
displacement
(drift)
limitation
(e.g.
[9-6,9-8]),
6.
Enter the
Sa
chart
(assume
cr)
at T,
4,
and
find
the appropriate
R
value
(interpolation)
(Fig.
9.16),
7.
Design the
wall for the
base
moment
Mv'
:
(Vr/R)h*,
8. Calculate
and
veriff
the assumed values
of
du, and cr. Some
iteration
may
be
necessary
9. Design
for
(MDOF)
base
shear
(section
9.3.2.4) to ensure
sufficient
shear strength
and
no
sliding
of the wall.
With
regard
to
the structure
shown
in
Fig. 9.1(c):
T
:
0.364
sec,
s:
0.01
and
(,
:3%,
it
was
found from Fig. 9.7
that
Su
:
L25,
thus
Vy:
759
kN.
A wall
drift limitation of
1.0%
or
4e
:
0.112
m
was
assumed,
for which
Fig.
9.16
produced R:4
(approximately),
so
that the
design
base
moment
would be Mr'
:
2125
klt{m and
the
peak
design
interstorey
shear force
is
t&Vr'
--
2.1*75914:
398
kN.
For comparison,
the
actual capacity was
found to
be
M
:2240
kNm
(or
approximately
V:200
kN,
see
Fig.
9.a).
The actual
shear
strength
depends
on
the wall
dimen-
sions and
shear
reinforcement
ratio
and the
base
shear
friction capacity depends
on
construc-
tion
joint
details.
Thus
the
design
objective
of
d,,
was
achieved
with
the
given
design.
p6:
10.6
was calculated.
With regard
to the
8-storey
wall: T
:0.621
sec,
cr:
0.01
and
(
:3%,
it
was
found
from Fig.
9.7
that
Su
:0.99,
thus
V,
:
1572 kN.
A wall
lateral displacement
limitation
of
0.2
m
at
h* or
4r:
0.200
m
was assumed,
for
which Fig.
9.16 produced
R
:
5
(approximately),
so
that
the
design
base
moment
would be
Mr'
:
5810
kNm
and
the
peak
design
interstorey
shear
force
is
r&Vu'
:2.6*157215:
817
kN. For
comparison,
the actual
capacity
was
found
to be
M:
5550
-246-
7/21/2019 PHD Laursen-masonry Prestressed Walls
http://slidepdf.com/reader/full/phd-laursen-masonry-prestressed-walls 273/308
kNm
(or
approximately
V
:
300
lN).
Thus
the
design
objective
of
d,
was
achieved
with
rea-
sonable
accuracy
(M
5%
lower
than
Mr')
with
the
given
design.
p6:
10.5
was
calculated.
9.6
NOTES
Higher
order
effects
must
be
taken
into
account
in the
wall
design,
in
particular for detemrining
the
actual
(MDOF)
base
shear
demand,
which
may
amount
Io
2
to 3
times
V.o
from
SDOF
analysis.
The
maximum
SDOF
base
shear
Vn.o
and
base
moment
M' *
are
higher
than
Vr'
and
Mr',
respectively,
because
of strain
hardening.
Strain
rate
dependency
of
the concrete
masonry
was not
considered
in
this
analysis.
Detailed
design
of
the
entire
wall
should
be
conducted
according
to
capacity
design
principles,
e.g.
[9-9]'
9.7
CONCLUSIONS
It
has
been
shown
that
a SDOF
equivalent
structure,
based
on
a
bi-linear
elastic
force-displace-
ment
relationship,
can
be
used
to
accurately
estimate
the
displacement
response
of
multi-storey
unbonded
post-tensioned
concrete
masonry
cantilever
walls.
Displacement
spectra
were
developed
for
PCM
walls
of
realistic
structural
dimensions.
It was
found
that
the
wall
displacement
demand
was
strongly
dependent
on
the
fundamental struc-
tural
period
(T),
the
force
reduction
factor
(R)
and
the
viscous
damping
ratio
(E).
Response
was
not
sensitive
to
variation
of
the strain
hardening
ratio
(a)
between
lVo
and2o/o.
The
displacement
ductility
demand
on
PCM
walls
was
found
to
be
much
higher
than
that for
reinforced
concrete
masonry
walls
of
similar
proportions'
With
reference
to the
results
from
the detailed
MDOF
models,
it
was
concluded
that
the
wall
base
moment
was determined
with
reasonable
accuracy
by
the SDOF
model,
howwer,
the
base
shear
was
underestimated
by a
factor
of
2.I
to
2.6.
The
base
shear
amplification
due
to higher
mode
effects
is subject
to further
investigation
given the
preliminary
nature
of this
investiga-
tion.
It
was
concluded
that
the
proposed
analysis
method
is suitable
for
displacement
focused
design.
-247
-
7/21/2019 PHD Laursen-masonry Prestressed Walls
http://slidepdf.com/reader/full/phd-laursen-masonry-prestressed-walls 274/308
9.8
REFERENCES
l9-l]
Prakash,
V., Powell, G. and
Campbell, 5., DMIN-2DX
Base
Prcgram Description
and
User Guide;
Version 1./0, Report
No.
UCB/SEMM-93117, Department
of Civil
Engi-
neering,
University
of
California,
Berkeley,
Califomia,
1993.
t9-21
Kurame,
Y., Pessiki,
P., Sause,
R. and
Lu,
L.W.,
Seismic
Behavior
and Design of
Unbonded
Post-knsioned
Precast
Concrete Walls, PCI Journal, May-June 1999,
pp.
72-89.
t9-31
Sinha,
B.P., Gerstle,
K.H. and
Tulin, L.G., Stress-strain Behaviour for Concrete
under
Cyclic
Loading, ACI Journal,
Vol.
61, No. 2, February 1964,pp.195-211.
[94]
Chopra,
A.K.,
Dynamics of Structures:
Theory and
Applications
to Earthquake Engi-
neering, Prentice
Hall,
1995.
t9-5]
ATC40,
Seismic
Evaluation
and
Renoft
of
Concrete
Buildings,
Vol.
1, Applied Tech-
nology Council,
California
Seismic Safety Commission, Report SSC 96-01.
[9-6]
NZS
4203:1992,
Code
of
Practicefor General Stntctural Design
and
Design
Loadings
for
Buildings, Standards Association
of New Zealand, Wellington.
19-71
Kawashima
K.,
and
Aizawa,
K.,
Modification of
Earthquake
Response
Specta
with
Respect to
Damping Ratio,3'd
U.S. National Conference on Earthquake
Engineering,
Charleston, South Carolina,
Aug.
1986.
t9-81
Untfurm
Building Code 1997,
International Conference
of
Building
Officials, Whittier;
California, USA.
t9-91
Paulay, T., and
Priestley, M.J.N.,
Seismic
Design of Reinforced
Concrete and Masonry
Buildings,
John
Wiley
Sons
lnc.,1992,744
p.
[9-10]
Priestley, M.J.N and
Amaris, A.D.,
Dynamic Amplification
of
Seismic
Moments
and
Shear
Forces in Cantilever Walls, European School for Advanced Studies in Reduction
of
Seismic Risk, Research
Report
No. ROSE-200210I,
Pavia, Italy.
[9-lU
Kurame,
Y.,
Seismic
Behavior
and Design of Unbonded Post-Tbnsioned Precast
Con-
crete Walls, PhD Dissertation,
Departnent
of Civil
and Environmental Engineering,
Lehigh University,
Bethlehem, Pennsylvanea,
USA,
May
1997.
-248-
7/21/2019 PHD Laursen-masonry Prestressed Walls
http://slidepdf.com/reader/full/phd-laursen-masonry-prestressed-walls 275/308
Chapter
10
SUMMARY
OF
CONCLUSIONS
10.
CONCLUSIONS
AND
FUTURE
RESEARCH
The
general
scope
set out
in Chapter
L:
to
provide
detailed
guidelines
for
complete
analysis
and design
of ductile
post-tensioned
concrete
masonry
walls
was successfully
achiwed
Anal-
ysis and
design
of
pCM
walls
can
readily
be
conducted
using
the
procedures
proposed
in
Chapters
g
and
9.
The
analytical
procedures
were
supported
by
experimental
investigations,
and
international
research
and
regulations.
This
thesis
investigated
a broad
array
of
PCM
wall
features,
ranging
from
material
properties
and
large
scale
structural
testing
to
theoretical
considerations.
While
the
investigated
elements
were
examined
thoroughly,
there
are
many
more
issues
to
be
explored
that
fell
outside
the
scope
of
this
thesis.
some
of
these
issues
are
listed
in
section
10.6.
Three
series
of
wall
tests
confirmed
that
fully
grouted
unbonded
post-tensioned
concrete
masonry
is
a competent
construction
form
for
ductile
structural
wall
systems.
The PCM
walls
reported
herein
exhibited
a
nearly
non-linear
elastic
behaviour
dominated
by
rocking
response.
Large
drift
capacity
was
measured:
up
to
1olo
was
measured
for
u200
unconfined
concrete
masoffy,
more
than
l7o
was
measured
for CP200
confined
concrete
masonry
and 1 5olo
was
measwed
for
Cpl00
confined
concrete
masoffy.
Testing
Series
3
that reflected
a
realistic
4-
storey
cantilever
wall
was
particularly
successful.
All
fully
grouted
wall
tests
showed
that only
localised
damage
in the
lower
wall
corners
occurred.
Earthquake
damage
would
therefore
be
easy
to
repair.
partially
and
ungrouted
PCM
walls
wore
capable
of
developing
significant
strength,
exceeding
the
predicted
nominal
flexural
strength.
Significant
displacement
capacity
was
recorded
despite
their
brittle
failure
mode.
Limited
energy
dissipation
was observed
during
wall
cycling.
One
wall
from
testing
Series
2
incorporated
energy
dissipators
that successfully
increased
the
hysteretic
energy
dissipation.
-249-
7/21/2019 PHD Laursen-masonry Prestressed Walls
http://slidepdf.com/reader/full/phd-laursen-masonry-prestressed-walls 276/308
Theoretical
procedures
for
determining
PCM
wall
in-plane
force displacement-relationship
successfully
predicted
the observed
experimental
behaviour. lnelastic time-history analysis
using
strong
motion earthquake
records
revealed
that PCM
walls are
likely to undergo signifi-
cantly
larger lateral
displacements
than reinforced
concrete
masonry
walls
of
similar
dimen-
sions and
strength.
However,
it was
found,
for a S-storey PCM
prototype
building, that the
expected
drift demand
was
less than
|o/o and
therefore
lower
than the typical code drift limita-
tion of
l.syo. The 5-storey
prototype
model
did not
rely
on
any external energy dissipation.
Based on
two
creep
and
shrinkage
testing
series conducted at
the
University of
Auckland
and
on
international
research,
it
was concluded
that long
term
prestress
losses
are
considerable
in
both grouted
and
ungrouted concrete masonry
and
must
be
taken
into
account in design. Use
of
high
strength
prestressing
steel
is required
to minimise
prestress
loss.
Detailed conclusions
for the individual
chapters are
presented
below
1O.I MATERIAL
PROPERTTES
- CHAPTER
3
Accurate
prediction
of f'. and
t
u
is necessary
for
design of PCM walls
because
of
the signifi-
cant influence
of
these parameters
on the
wall
strength and
displacement
capacity.
Unfortu-
nately, the current
New
Zealand
masonry
code specifications
poorly
reflect
actual concrete
masonry
properties
(in
particular
strength
and elastic
modulus).
For the time
being it is recom-
mended to base
the concrete masonry
properties
on the rational
methods
presented
in this
doc-
ument.
Theoretical stress-strain curves
for unconfined
and
confined concrete
masonry
may
be estab-
lished using
the Priestley-Elder formulation.
The required
information to
do so
is
limited to fn,
and,
in
case
of confined masonry,
the confining steel
dimensions
and
yield
strength. Using con-
finement
plates
in
the bed
joints
greatly
improves the
masonry strain
capacity. A uniaxial
dependable strain
capacity of
more than lVo
can readily be
achieved.
IO.2
TIME
DEPENDENT
EFFECTS
-
CHAPTER
4
For
grouted
concrete
masonry
is was recommended to use the creep coefficient
C.
:
3.0,
a
value
in
agreement
with
the
values
stipulated
by BS
5628 and
AS
3700. For ungrouted
con-
crete
masonry C
:
3.0 is similarly
recommended
for design
purposes.
Values
predicted
by BS
5628 and
AS
3700
appear
to
be
on the conservative
side. The following
shrinkage
strains were
-250-
7/21/2019 PHD Laursen-masonry Prestressed Walls
http://slidepdf.com/reader/full/phd-laursen-masonry-prestressed-walls 277/308
recommended
for
design
underNew
Zealand
conditions:
for
grouted
walls
er6:700
pe and
for
un-grouted
walls tr6:400
pa, values
in agreement
with
international
research.
Creep
and
shrinkage
properties
for
partially
grouted concrete
masonry
should
be
based
on
interpolation
between
the
results
for
grouted
and
un-gtouted
concrete
masonry
according
to
the
ratio
of
grouted cells
to
the
total
number
of cells'
Using
high
strength
strand
with
an
initial
stress
of
0.7f*
and
an
axial
load
ratio
of
0.15,
about
20
loss
ofprestress
can
be
expected
after
all
long
term
losses
have
occurred.
The
use
ofhigh
strength
bar
instead
of
strand,
under
similar
conditions,
is expected
to result
in
about
30
pre-
stress
loss.
Less
loss
is
anticipated
using
ungrouted
concrete
masonry.
In both
grouted and
ungrouted
concrete
masonry,
losses
are
considerable
and
must
be
taken
into
account
in
design'
However,
high
prestress
loss
can
be
countered
by
restressing
of
the
prestressing
steel
at
some
later
time
after
the
initial
stressing.
It
is,
in
theory
possible
to
reduce
the
prestress loss by
about
50 by
restressing
about
3
months
after
the
initial
stressing.
10.3
STRUCTURAL
TESTING
-
CHAPTERS
5,60
AND 7
Series
l:
It
was
concluded
that
fully
grouted unbonded
post-tensioned
concrete
masonry
is a
competent
material
combination
for
ductile
structural
wall
systems.
The
PCM
walls
reported
herein
exhibited
a
nearly
non-linear
elastic
behaviour
dominated
by
rocking
response.
Large
drift
capacity
of
more
than
1.0o4
was measured.
Only
localised
damage
occurred'
Tendon
force
loss
due
to
yielding
should
be
expected
for
short
(squat)
walls
at
relatively
low
wall
drift
ratios.
Even
after
tendon
yielding,
reliable
and
self-centring
wall
behaviour
is
expected.
Before
tendon
yielding,
little
energy
dissipation
was
observed
during
wall
cycling'
partially
and
ungrouted
pCM
walls
were
capable
of
developing
significant
strength,
exceeding
the
predicted
nominal
flexural
strength.
Despite
their
brittle
failure
mode,
significant
displace-
ment
capacity
was
recorded'
Additional
axial
load
from
the
prestressing
enhanced
the
concrete
masonry
shear
strength.
The
paulay
and
priestley [5-4]
provisions
for
masonry
shear
strength was
found
to
most
accurately
reflect
experimental
performance.
The
NZS
4230:1990
shear
strength
provision
is
highly
con-
servative.
-25r
-
7/21/2019 PHD Laursen-masonry Prestressed Walls
http://slidepdf.com/reader/full/phd-laursen-masonry-prestressed-walls 278/308
Series
2:
Strengthening
of
the flexural compression
zones
of
fully
grouted
unbonded
post-tensioned
concrete masoffy walls
improved
the wall displacement capacity and delayed the
onset
of
strength degradation
in
comparison
with
PCM walls
made
with
unconfined masonry. The
PCM
walls
from Series
2
behaved similarly
to the behaviour observed for testing
Series
l;
notably
they exhibited
a nearly nonJinear
elastic
behaviour dominated by rocking
response.
The
exception
was P2-CP-CA-ED that exhibited
rocking
response
with non-linear
elasto-plastic
behaviour
due
to the
presence
of
energy dissipation
devices.
The maximum wall strengths
were
insensitive
to
strengthening of the compression zone.
Drift
capacities
of
0.7o/o
to
2o/o
were
measured
using
CP200,
l.Io/oto
2.6 with
CP100
and
l.l
to
1.4
with
high
strength block
corners.
The highest
performing
solution was
CPl00.
Only
localised damage occurred.
Relatively
little
energy
dissipation was observed
during
cycling
of all walls, except for P2-CP-CA-ED
that had
'dog-bone'energy
dissipation
devices
embedded.
This simple device
proved
successful and
provided
a
33o/o
wall
strength increase
and a
threefold
increase of hysteretic
damping
relative to P2-CP-CA.
Exteme
masoffy fibre sfiain
at nominal
flexural
strength
in the
order of 0.0035 was found
for
CP200 and
0.0020 was
found
for
CPl00.
Both
values
are substantially lower
than 0.008
stipu-
lated by NZS
4230:1990 for confined
masonry. At ultimate displacement, extreme
fibre
strains
as high as 0.046-0.050
were measured
for both CP200 and CP100.
Series
3:
This
testing series
provided
final
confirmation
that PCM walls
of realistic
proportions,
strengthened
in
the flexural
compression
zones
with
confining
plates
(CPl00),
successfully
can withstand
severe cyclic
loading as
imposed by major earthquakes.
Ductile response
was
measured,
with
reliable
drift
capacity of
l.5o/o for both walls tested. Relatively
little energy
dis-
sipation
was
observed
during cycling
of the
walls. Adequate
shear
friction
between
wall
and
foundation
was
achieved by
intentional
roughening of the
wall
to foundation interface.
All
visual damage occuned
to
the lowest
300400
mm
in
the
flexural
compression
zone. Ine-
lastic
masonry
response
was
measured
in
the
lowest 400-600
mm
of
the walls.
Exffeme
masoffy
fibre
strain
in the order of
0.0010
to
0.0020
were
measured at nominal flexural
strength.
These values were substantially
lower
than
0.008
as stipulated by NZS 4230:1990
for
-252 -
7/21/2019 PHD Laursen-masonry Prestressed Walls
http://slidepdf.com/reader/full/phd-laursen-masonry-prestressed-walls 279/308
confrned
m4sonry.
Average
strains
in
the
extreme
fibre
as
high
as
0.019-0.024
were
measured
at ultimate
disPlacement.
Comparison
between
pCM
and
RCM
walls
suggested
that
RCM
walls
are
expected
to
exhibit
larger
displacement
capacity
than
PCM
walls
primarely
because
of
a
longer
plastic
hinge
lenglh.
pCM
walls
are
expected
to
sustain
much
less
and
more
localised
damage
during
strong
ground motion
than
RCM
walls,
resulting
in simpler
and
cheaper
post-earthquake
repair.
10.4
AFIALYSIS
AND
DESIGN.
CHAPTER
8
For
walls
of
low
aspect
ratio
(say
below
1.0),
the
predicted
initial
stiffiress
overestimates
the
actual
wall
stiftress.
For
aspect
ratios
above
2,
acaxate
prediction
is
expected.
Accurate
and
consistent
estimation
of
the
force-displacement
envelope
(skeleton curve)
can
be
achieved,
using
the
predicted
base
shear
and
corresponding
displacement
at maximum
service-
ability
moment,
at
nominal
strength,
at
fust
tendon
yield
and
at
overstrength.
The
predicted
displacement
capacity,
du,
was
captured
with
reasonable
accuracy
and
consist-
ency
(it
is acknowledged
that
the
prediction
method
in
the
first
place
was
calibrated
by
the
same
tests).
The
strength
%
associated
with
d for confined
concrete masonry (CP200/CP100)
was captured
reasonably
accurately.
The
unconfined
concrete
masoffy
(U200)
wall
capacity
at
d'.,
should
be
taken
as
0.8Vr.
10.5
DYNAMIC
ANALYSIS.
CHAPTER
9:
A
SDOF
equivalent
structure
can
be
used
to
accurately
estimate
the
displacement
response
of
multi-storey
unbonded
post-tensioned
concrete
masonry
cantilever
walls.
From
an array
of
analyses,
it
was
found
that
the
wall
displacement
demand
was
strongly
dependent
on
the fun-
damental
structural
period
(T),
the
force
reduction
factor
(R)
and
the
viscous
damping
ratio
(().
Response
was
not
sensitive
to
variation
of the
strain
hardening
ratio
(ct)
between
l% and2%-
The
displacement
ductility
demand
on
PCM
walls
was
found
to
be
much
higher
than
that
for
reinforced
concrete
masonry
walls
of similar
proportions.
Likewise,
the
base
shear
amplifica-
tion
factor
of
Z.I
to
2.6
recorrmended
for
PCM
walls
to
account
for
higher
mode
effects,
was
much
higher
than
that
recommended
for
reinforced
concrete
masonry'
-2s3
-
7/21/2019 PHD Laursen-masonry Prestressed Walls
http://slidepdf.com/reader/full/phd-laursen-masonry-prestressed-walls 280/308
Displacement
limitation
is the
primary
focus
of
the
proposed
method. This makes the
method
suitable
for displacement
focused design where
emphasis is
put
on
displacement limitation
rather than
strength.
10.6 FUTTJRE RESEARCH
Experimental research:
Prediction
methods
described
in
Chapter
8 correlated well
with
the experimental results
pre-
sented
in Chapters
5, 6 and 7. Unfornmately,
no experimental
results
were available to confirm
that the
predicted
dynamic
response,
as
presented
in Chapter 9,
reflects
reality. It is therefore
recommended
to
conduct dynamic
shake
table
(scale
model) testing. The wall
displacement
demand
and base shear
amplification
are of
particular
interest
in such investigation.
It
is recommended
to conduct fuither
creep
and
shrinkage experiments. The current database
was established
under
laboratory conditions
and does
not
directly
reflect the variability
of
the
New Zealand exterior
conditions-
The influence of wall
weather
proofing
on creep and shrink-
age should
also be addressed.
Only
one
wall
had energy dissipators
incorporated.
While
the
wall
test
wuls
successful, there
remains further
need to investigate
this issue with
regards
to energy dissipator type, location
and strength.
Theoretical
work:
The displacement spectra
developed
in Chapter 9 covered a limited
number
of earthquakes
and
were only specific
to medium soil
conditions
and a seismic
zone factor
of
Z: 1.2. To expand
the
understanding
and statistical
reliability of
the
predicted
PCM
wall
dynamic behaviour,
a
larger array
of earthquake records,
earthquake
intensities, and soil types should
be
investigated.
Displacement
spectra
reflecting additional
external damping should also be developed system-
atically.
Energy
dissipation arising
from
deformation of building
floors should
be investigated in detail.
Damping
from that
source is normally disregarded
for design of
reinforced
concrete masonry
because
of
it s low magnitude
in comparison
with the hysteretic damping
occurring in the
plas-
tic
hinge
zone. For PCM walls with
unbonded
tendons that exhibit little
hysteretic damping,
the energy
dissipation from
yielding
of floor slabs
may have significant
impact on the seismic
displacement
demand.
-254-
7/21/2019 PHD Laursen-masonry Prestressed Walls
http://slidepdf.com/reader/full/phd-laursen-masonry-prestressed-walls 281/308
With
reference
to Chapter
9
results
from
the
detailed
MDOF
models
it
was
concluded
that
the
wall
base
moment
was
deterrrined
with
reasonable
accurac y
by
the
SDOF
model
however
the
base
shear
was wrderestimate
by
a
factor
af
2.1
to
2.6. The
base
shear
amplification
due
to
higher
mode
effects
should
be explored further given
the
preliminary
nature
of
this
investiga-
tion
The
theoretical
concepts
developed
in
this
thesis
were
specific
to
concrete
masonry.
Given the
simplicity
of
the
proposed anatysis
and
design
method
it
would
be
obvious
to
port
the
method
to
analysis
and
design
of
unbonded
post-tensioned
concrete
walls.
-255
-

7/21/2019 PHD Laursen-masonry Prestressed Walls
http://slidepdf.com/reader/full/phd-laursen-masonry-prestressed-walls 282/308
56
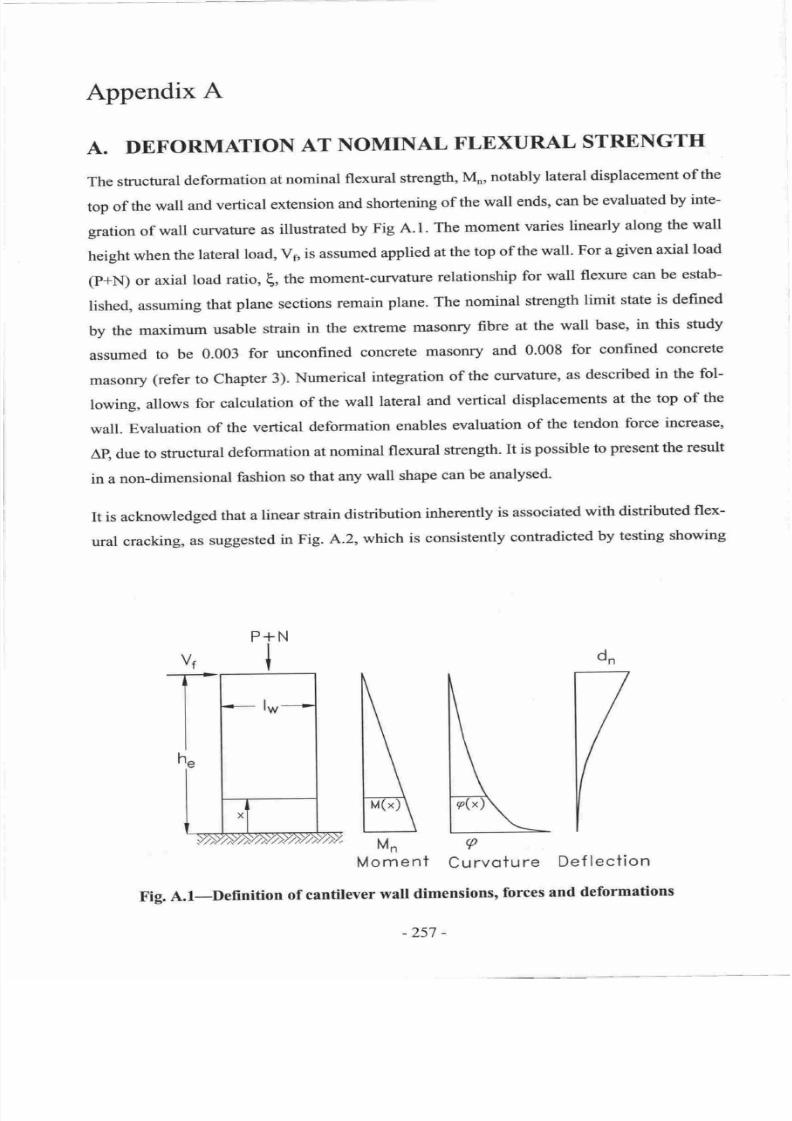
7/21/2019 PHD Laursen-masonry Prestressed Walls
http://slidepdf.com/reader/full/phd-laursen-masonry-prestressed-walls 283/308
Appendix
A
A.
DEFORMATION
AT
NOMINAL
FLEXURAL
STRENGTII
The
structural
deformation
at
nominal
flexural
strength,
Mn,
notably
lateral
displacement
of
the
top
of
the
wall
and
vertical
extension
and
shortening
of
the
wall
ends,
can
be
evaluated
by
inte-
gration
of
wall
curvature
as
illustrated
by
Fig
A.l.
The
moment
varies
linearly
along
the
wall
height
when
the
lateral
load,
Vs,
is
assumed
applied
at the
top
of
the
wall.
For a
given
axial
load
(p+N) or
axial
load
ratio,
6,
th
moment-curvature
relationship
for
wall
flexure
can be
estab-
lished,
assuming
that
plane sections
remain
plane.
The
nominal
strength
limit
state is defined
by
the
maximum
usable
strain
in
the
extreme masonry
fibre
at
the
wall
base,
in
this study
assumed
to
be
0.003
for
unconfined
concrete
masonry
and
0.008
for confined
concrete
masonry
(refer
to
Chapter
3).
Numerical
integration
of
the
curvature,
as described
in
the
fol-
lowing,
allows
for calculation
of
the
wall
lateral
and
vertical
displacements
at
the
top of
the
wall.
Evaluation
of
the
vertical
deformation
enables
evaluation
of
the
tendon
force
increase,
Ap,
due
to structural
deformation
at
nominal
flexural
strength.
It
is
possible
to
present
the
result
in a
non-dimensional
fashion
so
that any
wall shape
can
be
analysed.
It is acknowledged
that
a
linear
strain
distribution
inherently
is associated
with
distributed
flex-
ural
cracking,
as suggested
in Fig.
A.2,
which
is
consistently
contradicted
by
testing
showing
dn
r
Curvoture
Def
lection
Fig.
A.l-Definition
of
cantilever
wall
dimensions,
forces
and
deformations
\
t\
A
n
Moment
-2s7
-
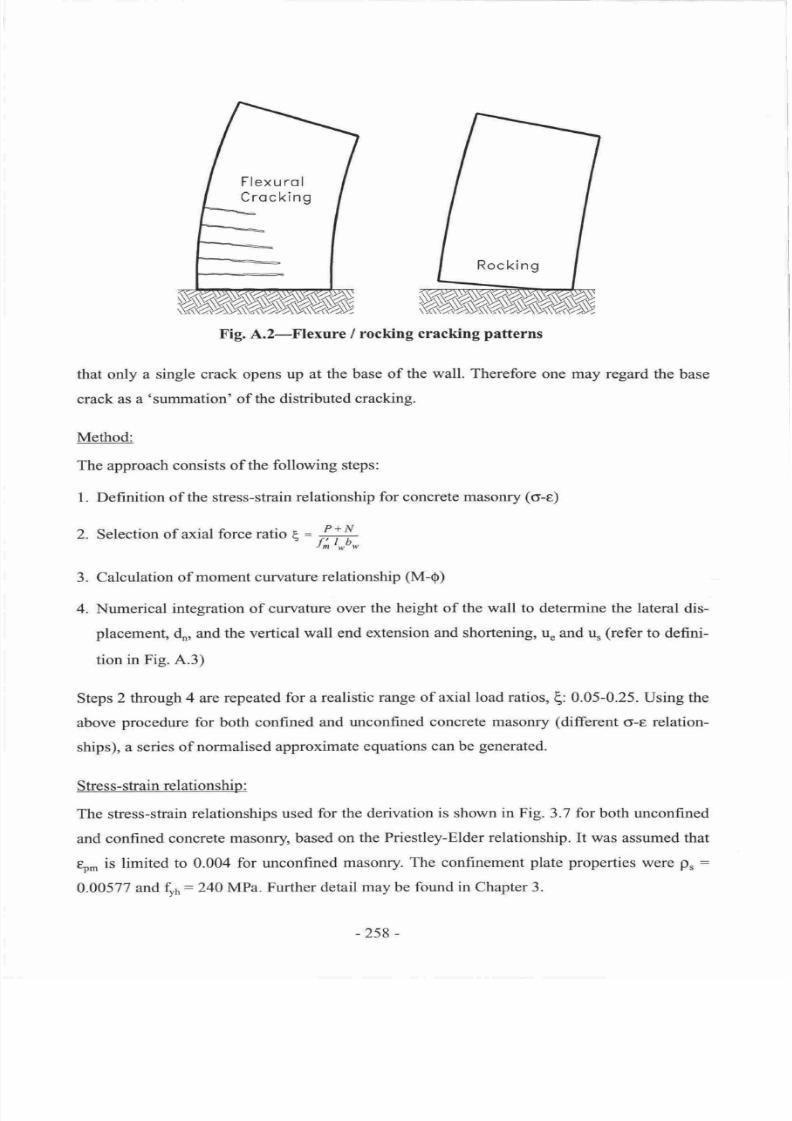
7/21/2019 PHD Laursen-masonry Prestressed Walls
http://slidepdf.com/reader/full/phd-laursen-masonry-prestressed-walls 284/308
Flexurol
Crocking
Rocking
3.
4.
Fig.
A.2-Flexure
/
rocking
cracking patterns
that only a
single crack opens up at
the base of
the
wall.
Therefore
one may regard
the
base
crack
as a'summation'
of the distributed
cracking.
Method:
The approach
consists of the
following steps:
1.
Definition
of
the stress-strain
relationship
for
concrete masonry
(o-e)
2.
Selection
of axial
force ratio
E
=
:+-y-
J;
t*b*
Calculation
of
moment curvature
relationship
(M-0)
Numerical
integration
of curvature
over
the height of the wall to determine the
lateral dis-
placement,
4,
and
the vertical
wall end extension
and
shortening,
u
and u,
(refer
to defini-
tion in
Fig.
A.3)
Steps
2 through
4
are
repeated
for a realistic ftmge
of axial load ratios,
(:
0.05-0.25. Using
the
above
procedure
for
both confined
and unconfined concrete masonry
(different
o-e
relation-
ships),
a series of
normalised approximate
equations
can be
generated.
Stress-sffain
relationship
:
The stress-strain
relationships used
for the derivation
is shown in Fig. 3.7 for
both
unconfined
and confined
concrete masonry, based
on
the
Priestley-Elder relationship.
It
was
assumed that
%rn
is limited
to 0.004
for unconfined
masonry.
The confinement
plate properties
were
p,
:
0.00577
and
tr,
:240
MPa. Further
detail
may
be
found in Chapter 3.
-258-
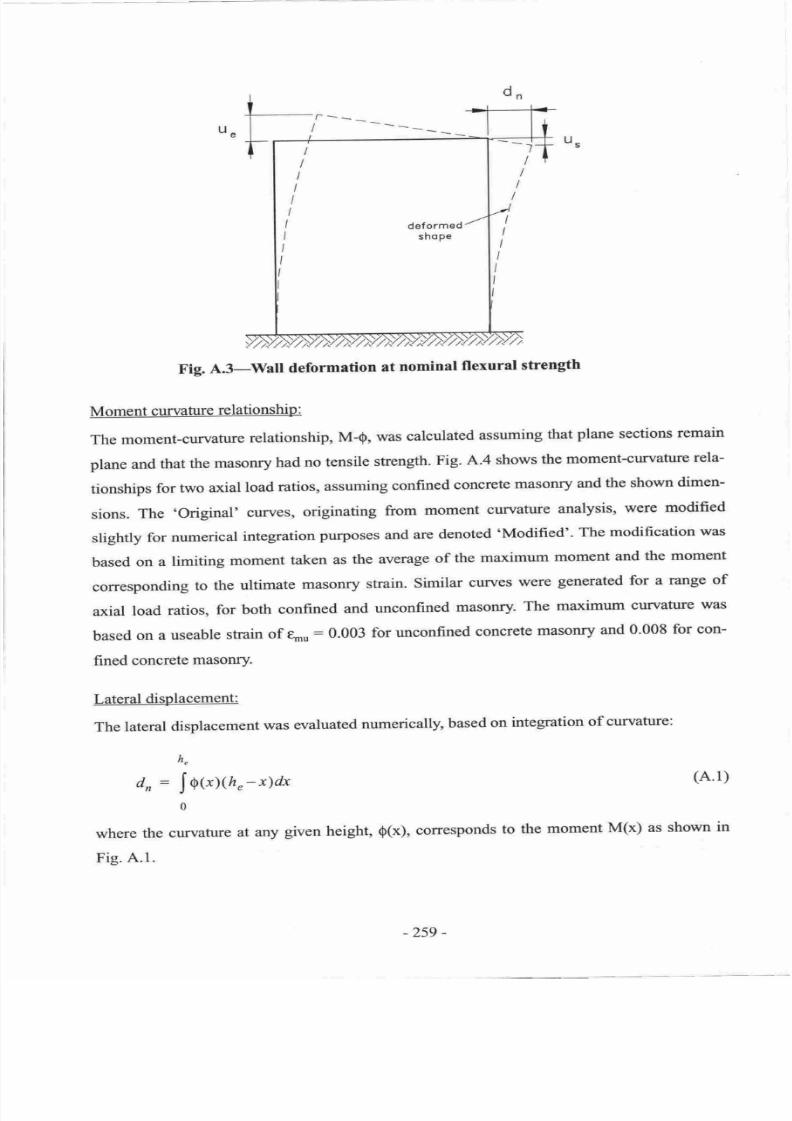
7/21/2019 PHD Laursen-masonry Prestressed Walls
http://slidepdf.com/reader/full/phd-laursen-masonry-prestressed-walls 285/308
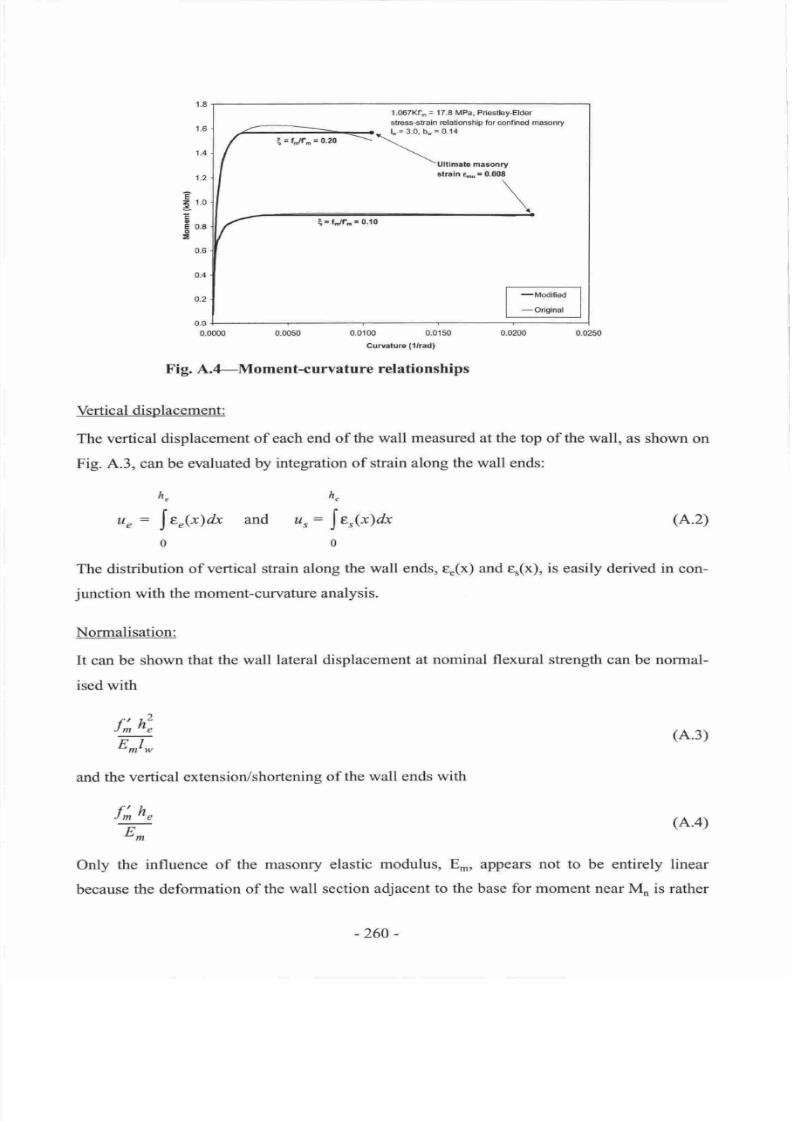
7/21/2019 PHD Laursen-masonry Prestressed Walls
http://slidepdf.com/reader/full/phd-laursen-masonry-prestressed-walls 286/308
1.8
1.6
1.4
1.2
F
z
1.0
x
=
a
E 0.8
o
-
0.6
0;4
o.2
1.(D7Kf'
=
17.8
MPa'
Pdestley-Eld€r
shass€train
r€ladonshlp
tor
confhed
masonry
L
=
3.0.
b
=
0.1,1
E=fJf,=0.d
Ultlmrlo
msimry
sttaln
qil
=
0,008
E=t
t?n=o,lo
0.0
0.0000 0-(x)50 0.0100 0.0150 0.0200
0.0250
Curr.rlur.
(lrrrd)
Fig.
A.4-Moment-curvature
relationships
Vertical displacement:
The
vertical displacement of each end
of the
wall
measured
at
the top
of
the
wall, as shown
on
Fig. A.3, can be evaluated
by
integration of strain along the
wall
ends:
h
hs
t,rf
ur:
Je (x)dx
and ur:
Jer(x)dx
(A.2)
The distribution of vertical
strain along
the wall ends,
e (x) and e*(x),
is easily derived
in con-
junction
with
the moment-curyature analysis.
Norrnalisation:
It
can
be
shown
that
the
wall
lateral
displacement at
nominal flexural
strength
can
be
nomral-
ised
with
f;
h?
m,
(A'3)
and the
vertical
extensior/shortening
of
the
wall
ends with
f;
h
E-
(A.4)
um
Only
the
influence of the
masonry elastic
modulus,
En,,
appears not
to
be entirely linear
because
the
deformation
of
the wall section adjacent
to the base for moment near
Mo is rather
-260
-
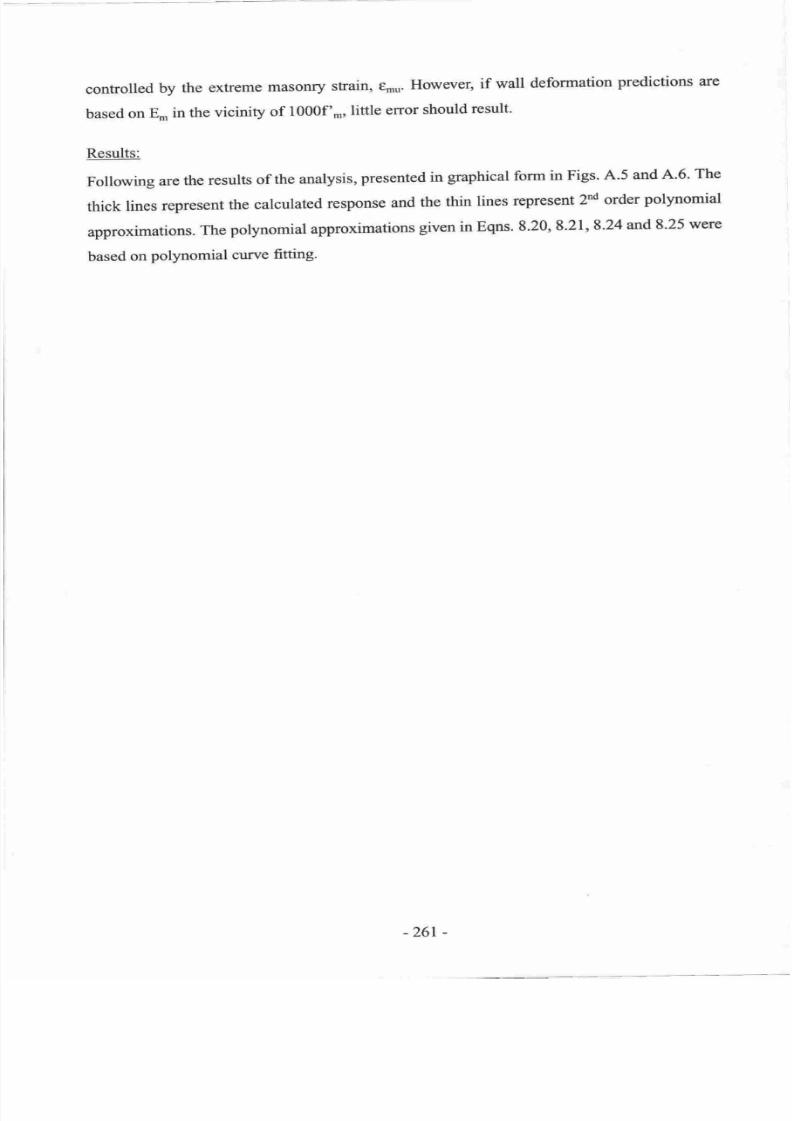
7/21/2019 PHD Laursen-masonry Prestressed Walls
http://slidepdf.com/reader/full/phd-laursen-masonry-prestressed-walls 287/308
csntslled
by
the
eEfreme
maEonry
stain,
e*,,
How.ever,
ilf
wall
deformafion
pred[otions
are
hased
on
E-
ln the
vioinity
of
l000fnn
Httle
error Should
regult.
Rs
del
Followi4g
ane
ttB rasule
of the
rlna,V,etg,
presomtsd in
gnphieal
fonn
in ftgs.
A5
and
A 6
The
thick
linesl.epresent
iho
edsulaEd
rqspons€
aod
the, ttdn linos
rc,present
2d
order
pol pomial
approxi
tions.
The
pqtynomial appmximatiom
givenin
Eqns.
8 20
821,8 24and
8 25
were
based onpol1rotm,ial
ourve
fittiryli
-261
-
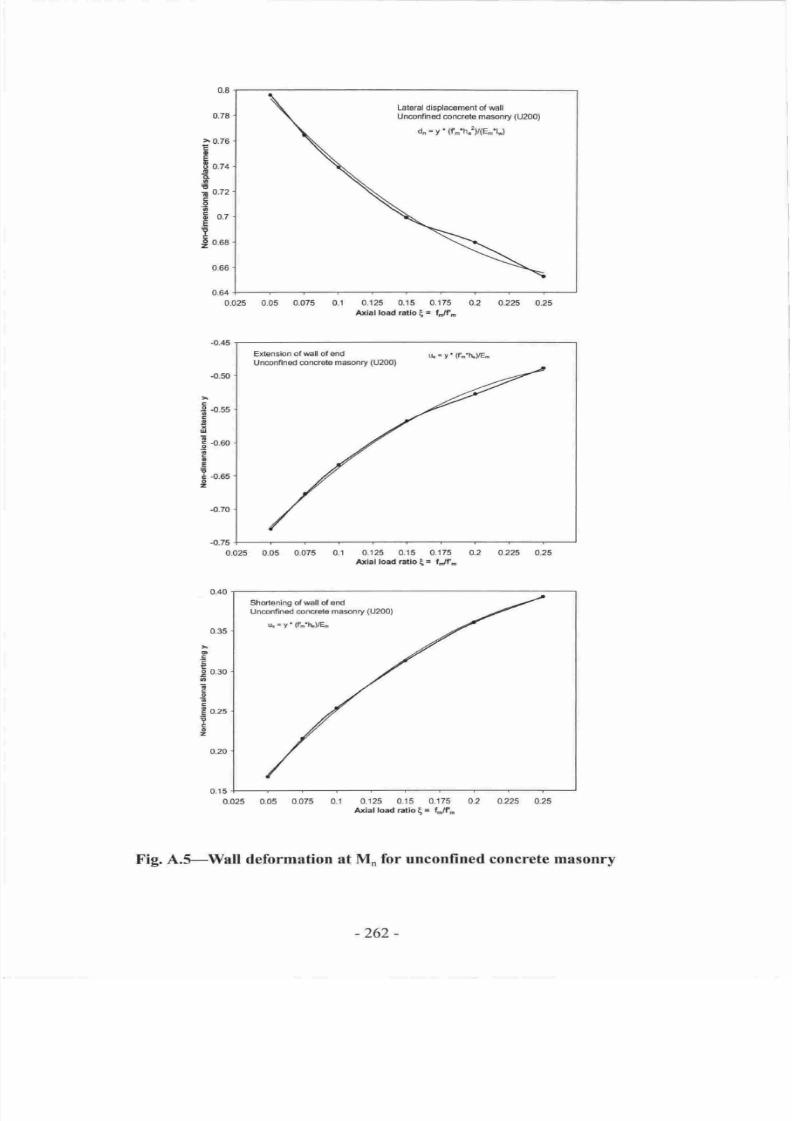
7/21/2019 PHD Laursen-masonry Prestressed Walls
http://slidepdf.com/reader/full/phd-laursen-masonry-prestressed-walls 288/308
qo
,0:78
:'o/0
0i74
o12
O,7
i1.68
rq06
9.e{
{:70
475
{I0r
'o50
g
1.0:56
i
u
E+',
E
a;
E
Eo.oe
-
L4|al
dltdaqenett sl
qFll
Unodrodloontndarrnsqny
(Ue0)
db
=y'(ffiLe)4F{ li)
ods o.ffi
0'gr,6
0.f
o.Jt25
0J6 017'5
0.
oa25
0 5
Affrlrirlr$Es
ilf-
lii-y.'Fin|l,E-
o.os
0.06
0.075 0.r
0.125 olq
o1?5
0.t
o.n6
0.z5
0;025
0.05
0l0W
0.l |1125
0.t5
0.f76
aA a'z?E 035
ldrlhdntbEr
1"J'..
,0.f0
o36
tr
o
C
€
F
O30
G
t
t
o
z
Ior.
E
o:
2
9.ffi
0,1r5
ilrlel
lcr{
t{lirEr
hlf'
Fig-
A,S-W-all
deforoa-dol
at lU"
for
nnconffned
concretemasorry
-?62 -
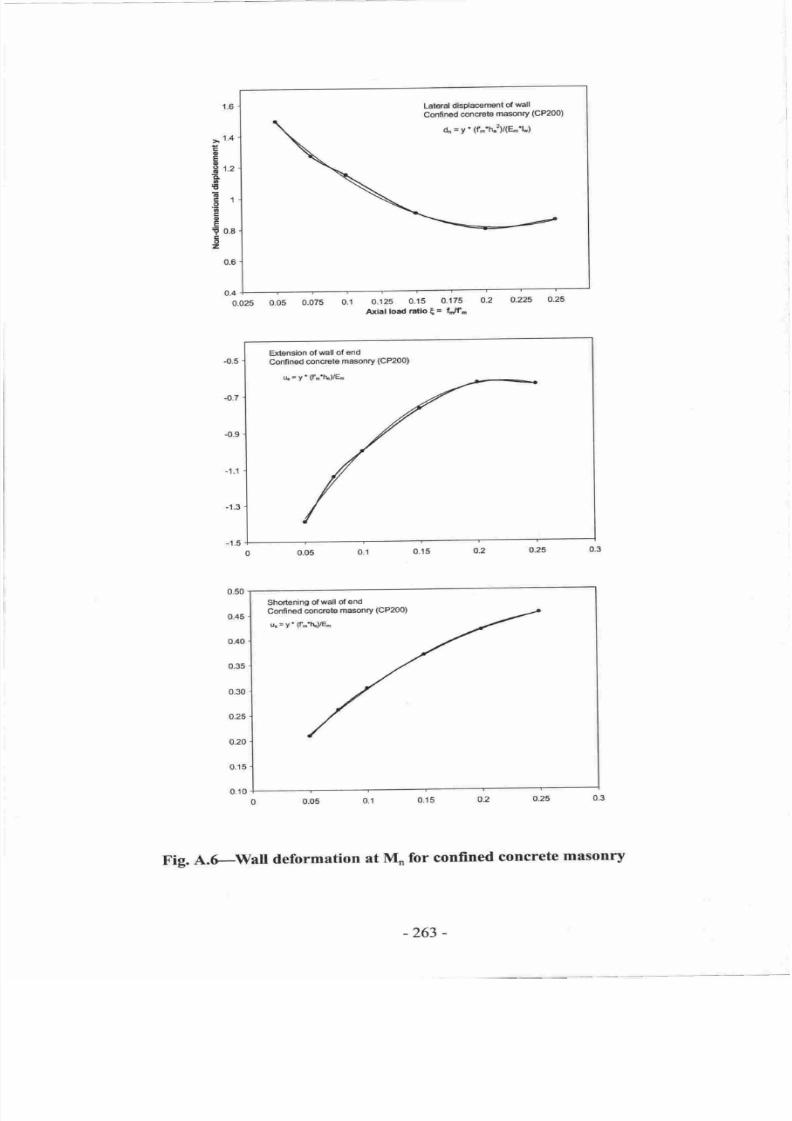
7/21/2019 PHD Laursen-masonry Prestressed Walls
http://slidepdf.com/reader/full/phd-laursen-masonry-prestressed-walls 289/308

7/21/2019 PHD Laursen-masonry Prestressed Walls
http://slidepdf.com/reader/full/phd-laursen-masonry-prestressed-walls 290/308
264
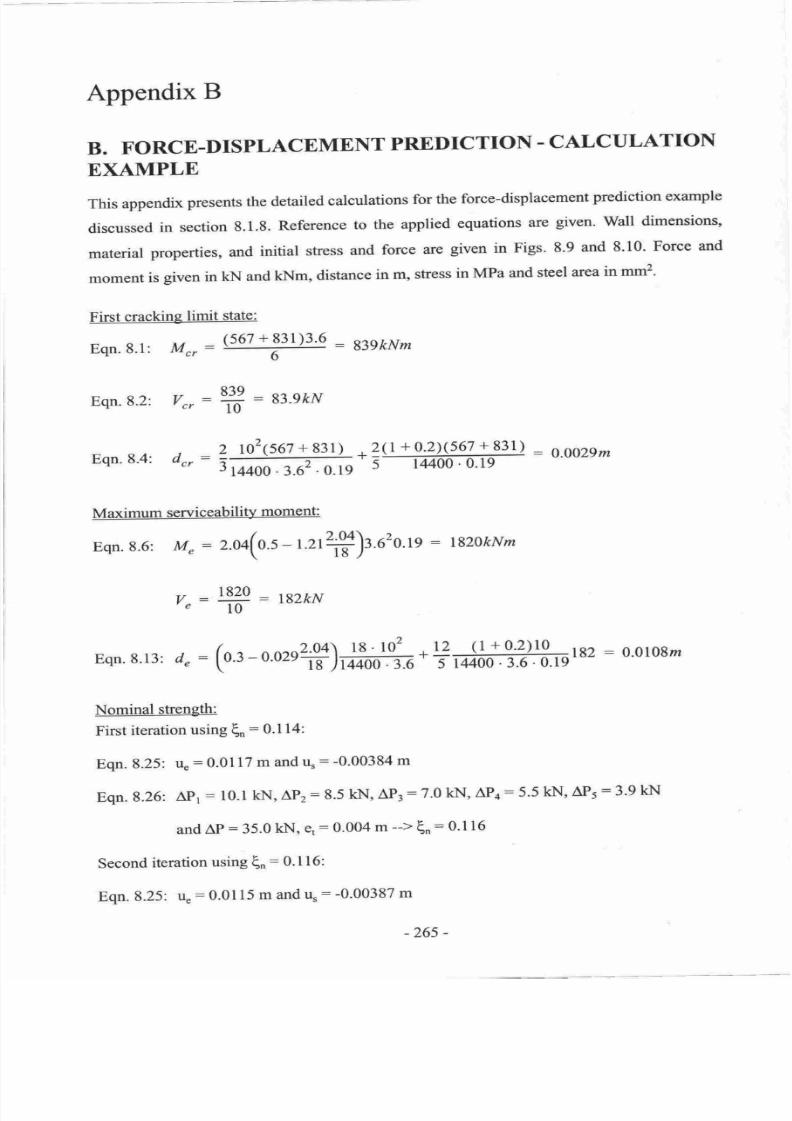
7/21/2019 PHD Laursen-masonry Prestressed Walls
http://slidepdf.com/reader/full/phd-laursen-masonry-prestressed-walls 291/308
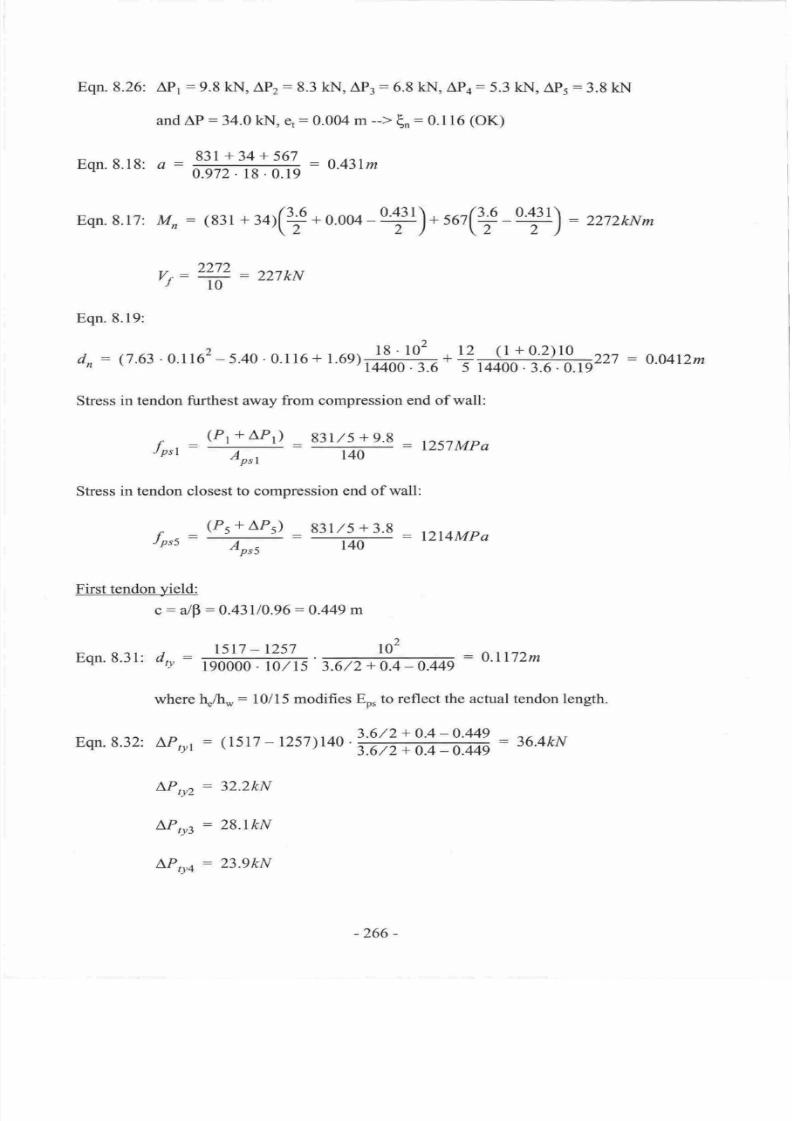
7/21/2019 PHD Laursen-masonry Prestressed Walls
http://slidepdf.com/reader/full/phd-laursen-masonry-prestressed-walls 292/308
Eqn.
8.26: AP1
:9.8
kI\,[, APr:8.3 kf'.I, AP3
=
6.8 kh[,
AP4
=
5.3
ldr|,
APj
:3.8
k]-.[
andAP
:34.CI
kI.[*
q:0.-0M
m
-->
Eo
=
0.116
(OK)
nall3,1+
197=
:
o.4irm
qn'
8'18:
o
:
u=glz. rg
.
o.l9
Eqn
8.17:
Mo:
(83r
+
34t(T+0.004-ry)+tt(T-ry)
:
2272kNm
7r't',
\:
ff
=
Z27kN
Eqn
8.19:
dn
:
(7.63.0.1162-s.40.0.116+
r.eey$+9
(t
+o'z)to
r'
-''14/100'3'6
s ia'+=ffi=227
:
o'Mr2m
Stness
in tendon
firthest
away from
compressi,on end
of
wall:
(pr+Mr)
_
g3l,/s+qR
______.
4or:
T
tr:tLs7Iu{Pa
Stress
in
terrdon
closesttor
conrpression
end
of,wall:
(ps
+
Ap5)
g3l,/5
+
3_B
fpss
=
T:
ff:
tZI4MPe
First tendon
yield:
c,:
a/F:0,431/0,96
:0.449
m
Eqn
8.3r:
d,y
- ffi m:
o.l r72m
where
151h*
:
10/15
rnodifies E,* b reflect the actual tendon length.
Eqn.8.32: M,r,
=
(1517
-t2s7)t4o
tffi=
i6.4kN
LPffi
=
32'2kN
Mro,
:
28.lhN
M*o: 23'9kN
-266
-
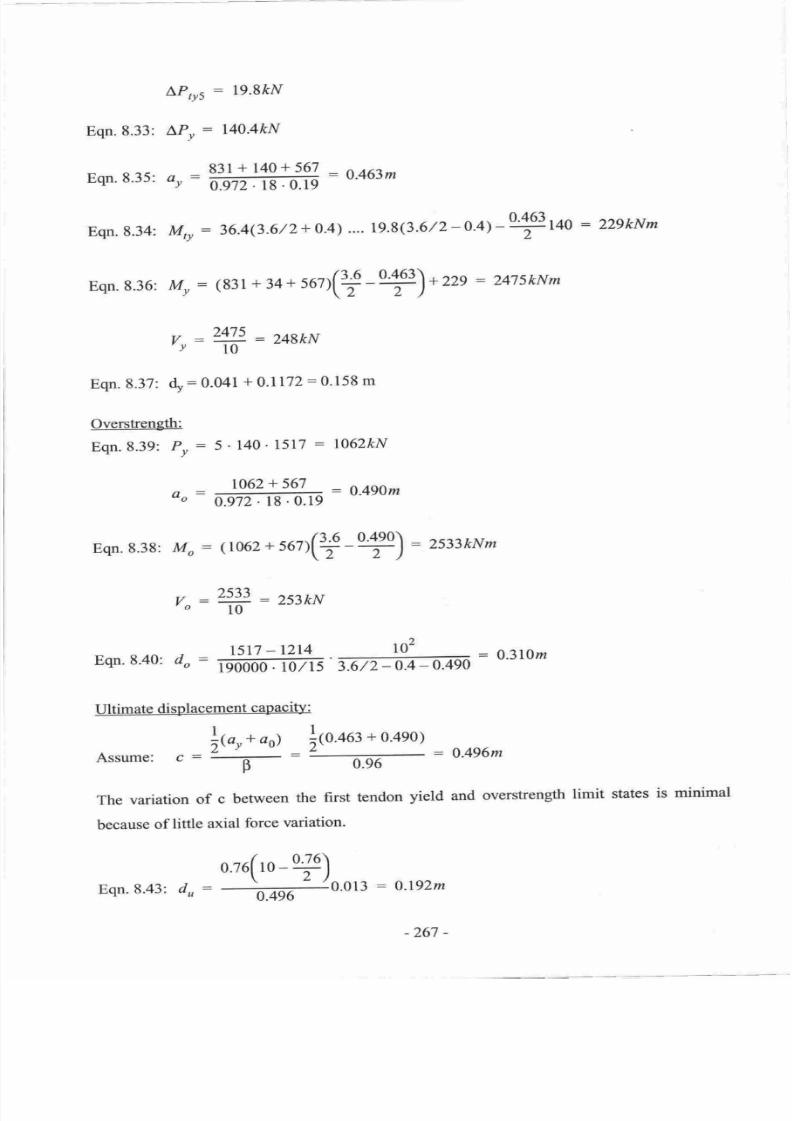
7/21/2019 PHD Laursen-masonry Prestressed Walls
http://slidepdf.com/reader/full/phd-laursen-masonry-prestressed-walls 293/308
LPrrr:
19.8&N
Eqn.8.33:
LP,
:
l40.4kN
*rt
+
140
+.591
:
0.463m
Eqn.
8.35:
o,
=
6.972.tg.
0.19
Eqn.
8.34:
M,,
:
36.4(3-6/2+
0.4)
...-
19.8(3.6
/2-O'4)-ry
40
:
229kNm
Eqn.
8.36:
M,
:
(831
+
34
+
56?)(+
-ry)*
zzs
:
2475kNm
'ry
:248kN
vr:
=ro
Eqn.
8.37:
4:
0.0+t
+
0j172
=
0'I58
m
Overstrength:
Eqn.
8.39:
P,
:
5'
140
' l5l7
:
l062kN
f,
_
1062+567
.
=o.4gom
-o
0.972. 18.0.19
Eqn.
8.38:
Mo
:
(
1062
+
s6T(+-
ry)
=
2533kNm
,,533
:
253kN
o:rro
Eqn.
8.40:
a
:
ffi #=
o.3lon
Ultimate
displacement
capacity:
\{ar+
ao)
lto'out+
o'4eo)
Assume:
:t
:tT:0.496nt
The
variation
of
c
between
the
first
tendon
yield
and overstrength
limit
states
is
minimal
because
of
little
axial
force
variation.
ozofro-ry)
Eqn.8.43:
du:
#0.013
:
A]92m
-267 -
7/21/2019 PHD Laursen-masonry Prestressed Walls
http://slidepdf.com/reader/full/phd-laursen-masonry-prestressed-walls 294/308
The
wall
strength at
du
is found
by interpolation
between
first
tendon
yield
and overstrength
limit
states
with respect to
displacemsnt:
vu:
vy.ffirdu-dy
=
248.0ffi
Q.r 2-0.158
:
249kN
-268
-
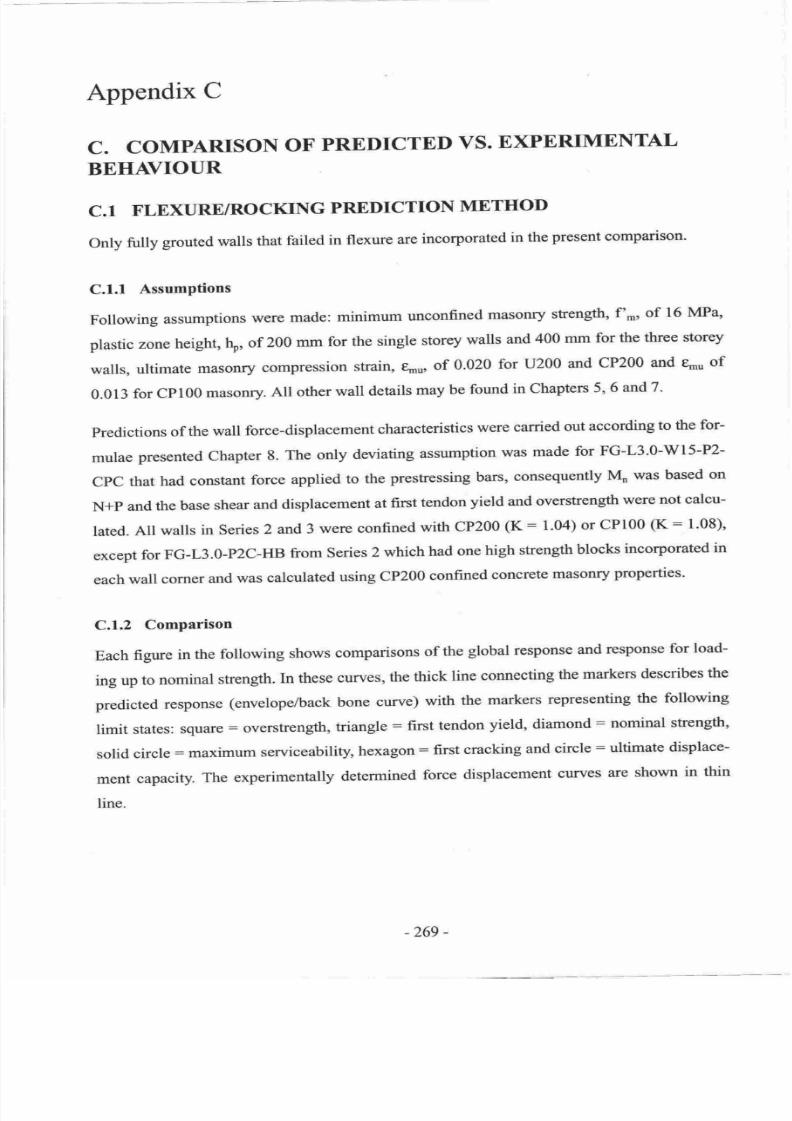
7/21/2019 PHD Laursen-masonry Prestressed Walls
http://slidepdf.com/reader/full/phd-laursen-masonry-prestressed-walls 295/308
Appendix
C
C.
COMPARISON
OF
PREDICTED
VS.
EXPERIMENTAL
BEHAVIOUR
C.l
FLEXIJRE/ROCKING
PREDICTION
METHOD
Only
fully
grouted walls
that
failed
in
flexure
are
incorporated
in
the
present comparison
C.1.1
AssumPtions
Following
assumptions
were
made:
minimum
unconfined
masonry
stength,
f of
16
MPa
plastic zone
height,
\,
of
200
mm
for
the
single
storey
walls
and
400 mm
for
the three storey
walls,
ultimate
masonry
compression
strain,
tmu,
of
0.020
for
U200
and
CP200
and e,,,u
of
0.013
for
CPl00
masonry.
All
other
wall
details
may
be
found
in Chapters
5,6
andT
predictions
of
the
wall
force-displacement
characteristics
were
carried
out
according
to the
for-
mulae
presented
Chapter
8.
The
only
deviating
assumption
was
made
for
FG-L3.0-W15-P2-
CPC
that
had
constant
force
applied
to
the
preshessing
barso
consequently
Mn
was
based
on
N+p
and
the
base
shear
and
displacement
at
first
tendon
yield
and
overstrength were not
calcu-
lated.
All
walls
in
Series
2 and
3 were
confined
with
CP200
(K:
1.04)
or CP100
(K:
1.08),
except
for
FG-L3.0-P2C-HB
from
series
2 which
had
one
high
strength
blocks
incorporated
in
each
wall corner
and
was
calculated
using
CP200
confined
concrete
masonry
properties.
C.1.2
Comparison
Each
figure
in
the
following
shows
comparisons
of
the
global
response
and
response
for
load-
ing up
to nominal
shength.
In these
curyes,
the
ttrick
line
connecting
the
markers
describes
the
predicted
response
(envelope/back
bone
curve)
with
the
markers
representing
the following
limit
states:
square
:
overstrength,
triangle
:
first
tendon
yield,
diamond:
nominal
strength
solid
circle:
maximum
serviceability,
hexagon:
first
cracking
and
circle:
ultimate
displace-
ment
capacity.
The experimentally
determined
force
displacement
curves
are
shown
in
thin
line.
-269
-

7/21/2019 PHD Laursen-masonry Prestressed Walls
http://slidepdf.com/reader/full/phd-laursen-masonry-prestressed-walls 296/308
C.l.z.l
Series
I
walls
Figs.
C.l-C.5 show comparison of
predictions
vs. recorded
force-displacement
behaviour
for
Series
I
testing of unconfined single storey
walls.
In terms of
global
measured response vs.
prediction,
it
is
clear from
Figs. C.1-C.5
that
there is
good
correlation between experiments and
predictions
at the maximum
serviceability,
nominal
strength and tendon
yield
limit states.
In terms of
wall
response beyond
tendon
yield,
it
is seen that
the
predicted
strength
at the
pre-
dicted
wall
displacement capacity
(circle
located on
the
prediction
curve) was
only achieved
for
one
wall, notably
FG-L3.0-W20-P3, which had
a relatively
low
axial
load
applied
to
it.
A
lower bound strength at
wall
displacement
capacity, do, was estimated
using
o:
0.5 and
F
:
1.0 in
for
calculation of
the wall flexural compression
zone
length cu
(centroid
of
compressive
stress located at a distance of
2/3cu
away
from the
extreme compression fibre).
These results
are
shown
with the circular
markers slightly offset
vertically
from the
circles on the
prediction
curves.
ln terms of the
predicted
wall
displacement
capaciry
it
is
seen
from Figs.
C.l-C.5
that initia-
tion of strength
degradation
generally
is captures
well.
Only wall FG-L3.0-W20-P3
showed
sigrrrifisanlly
large displacement
capacity
than
predicted.
This
wall
differed from the
other
walls in series 1 in
the
sense
that the maximum
wall axial force
due to two
yielding
tendons
(third
tendon
located
in the wall compression
zone
and
had
nearly lost all
prestress
at that
stage)
was applied
to
a
larger wall section,
thus
resulting
in
a shorter compression
zone and
a
proportionally
lower extreme masonry
fibre strain.
It
is
seen
from
the
low
level
plots in
Figs. C.1-C.5 that
the
predicted
wall initial
stiffness repre-
sented by the
first cracking
limit
state
(hexagonal
marker) in
all
cases exceeded
the
measured
initial
stiffness.
This discrepancy
is
mainly
attributed to inadequacy
of the
plane
section
assumption
to describe deformation
of walls of low aspect
ratio.
This observation is
confirmed
by studying
the
low
level response of the
wall withthe
highest
aspect ratio,
FG-1.8-Wl5-P2,
in
Fig. C.5
which indicates an accurate
prediction
of
the measured
initial
stiffiress.
-270
-
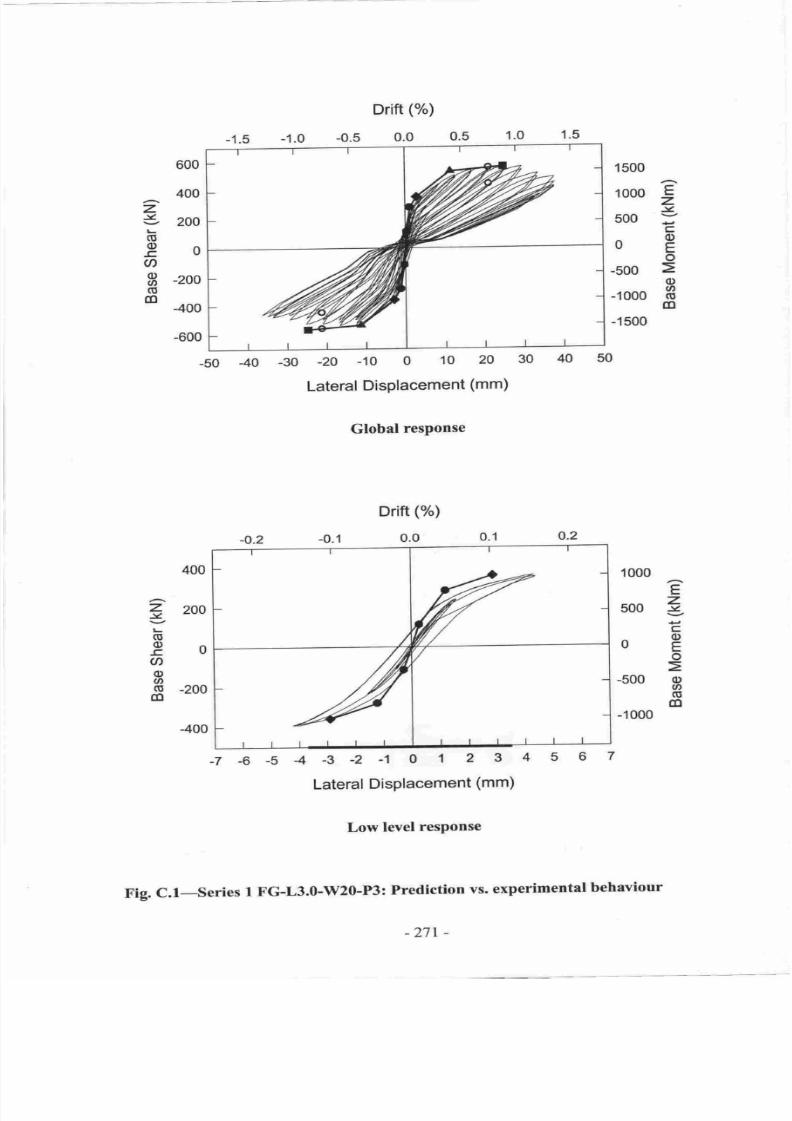
7/21/2019 PHD Laursen-masonry Prestressed Walls
http://slidepdf.com/reader/full/phd-laursen-masonry-prestressed-walls 297/308
Drift
(%)
-0.5
0.0
600
400
200
0
-200
400
-600
-50
40
-30
-20
-10
0
10
20
30
40
50
Lateral
DisPlacement
(mm)
Global
resPonse
Drift
(%)
0.0
Irtlll
-7-6-54-3-2-101234
Lateral
DisPlacement
(mm)
Low
level
response
Fig.
C.l-series
1
FG-L3.0-W20-P3:
Prediction
vs.
experimental
behaviour
z
(U
o
.c,
U)
o
6
o
dl
1500
1000
t
l<
500
;
c
og
o
-500
o
-1000
I
dl
-1500
E
z
.v,
c
o)
E
o
o
o
(u
[D
400
a
200
Y
go
a
o
o
s
-200
-400
o.2
.1
0.1
1000
500
0
-500
-1000
56
-27t
-

7/21/2019 PHD Laursen-masonry Prestressed Walls
http://slidepdf.com/reader/full/phd-laursen-masonry-prestressed-walls 298/308
z
.Y
o
o
.c,
U)
o
o
(E
(D
600
[
4oo
[-
I
200
r
.f
-roo
I
400
|-
-600
L
40
1500
1000
E
z
500
5
fl
c
oE
o
-5oo
=
@
-1000
fi
-1500
-20
-10
0
10
Lateral
Displacement
(mm)
Global
response
Drift
( )
-o.2
-0.1
0.0 0.1 0.2
20
30
600
400
z
5
200
L
(E
go
U)
o
E
-200
dl
-400
-600
1500
1000
e
z
500
5
fl
ofl
o
-qnn
c)
u,
-1ooo
S
-1500
-7-6-54-3-2-101234 67
Lateral
Displacement
(mm)
Low
level
response
Fig.
C.2-Series
I FG-L3.0-W15-P3:
Prediction
vs. experimental
behaviour
il,
T
-272-
7/21/2019 PHD Laursen-masonry Prestressed Walls
http://slidepdf.com/reader/full/phd-laursen-masonry-prestressed-walls 299/308
E
z
.Y
C
o
E
o
o
U,
o
dl
z
v
o
o
a
o
a
o
dl
400
300
200
100
0
-100
-200
-300
400
Drift
( )
-0.s
0.0
0.s
-30
-20
-10 o
10
20
30
40
Lateral
DisPlacement
(mm)
Global
response
Drift
( )
-0.1
0.0
0.1
1200
900
600
300
0
-300
-600
-900
-1200
50
-50
-40
-o.2
o.2
E
z
-v
c
o
E
o
o
o
(s
dl
400
300
?
2oo
-v
Y
1oo
(U
go
ao
-100
o
S
-2oo
-300
400 t-
1200
900
600
300
0
-300
-600
-900
-1200
-7
-6
-5 4
-3
-2
-1 0'l
2
3
4
5
6
7
Lateral
Displacement
(mm)
Low
level
response
Fig.
c.3-series
I FG-L3.0-W15-P2C:
Prediction
vs.
experimental
behaviour
-273
-
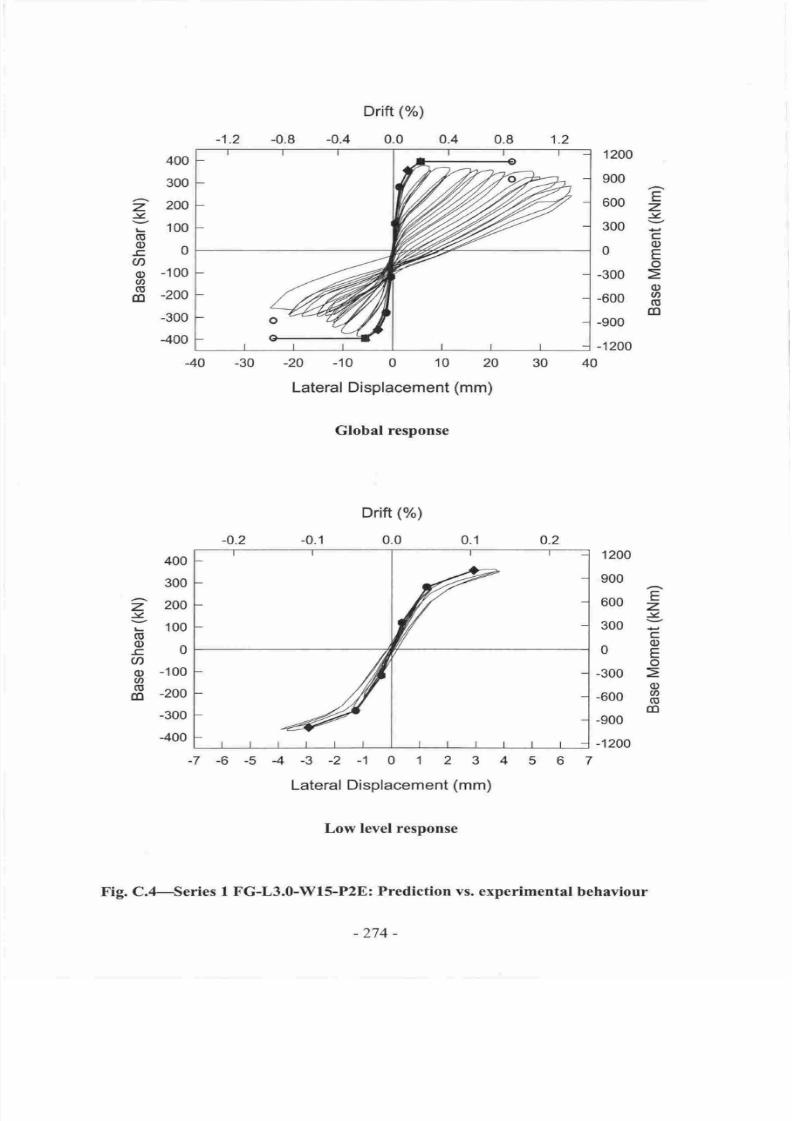
7/21/2019 PHD Laursen-masonry Prestressed Walls
http://slidepdf.com/reader/full/phd-laursen-masonry-prestressed-walls 300/308
-1.2
-0.8
Drift
(%)
-0.4
0.0 0.4
E
z
c
o
E
o
o
.n
o
(D
z
l.
(E
o
E
U)
o
a
(U
dl
400
|_
300
[
200
F
100
l-
I
or
-100
l-
-roo
I
-300
[
400
t
40
1200
900
600
300
0
-300
-600
-900
-1200
-20 -10
0 10
20
Lateral
Displacement
(mm)
Global
response
Drift
(%)
-o.2
-0.1
0.0 0.1 0.2
1200
900
600
300
0
-300
-600
-900
-1200
-7-6-54-3-2-101234
67
Lateral Displacement
(mm)
Low
level
response
Fig. C.4-Series
1
FG-L3,0-W15-P2E: Prediction
vs.
experimental
behaviour
E
z
.Y
c
o
E
o
o
o
(g
dl
400
300
2
2oo
.Y
;
1oo
(u
go
U)
o
-100
o
3
-2oo
-300
400
rrtrll
t-
-274-
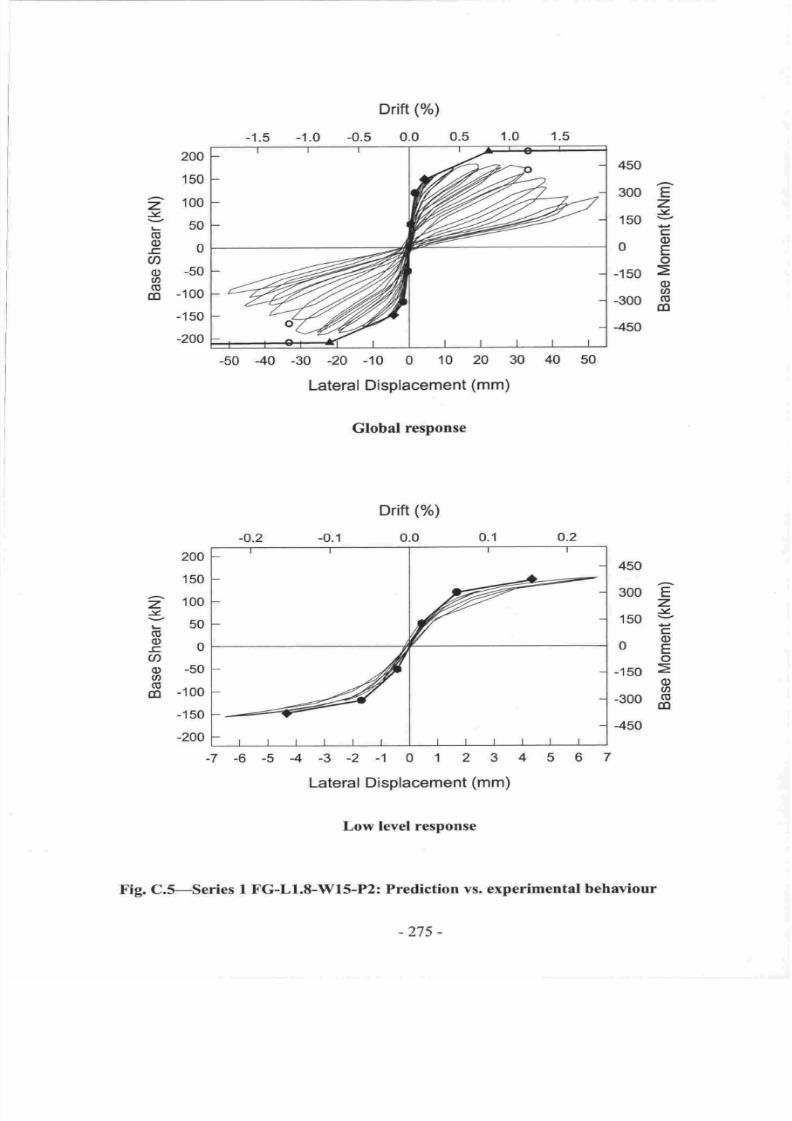
7/21/2019 PHD Laursen-masonry Prestressed Walls
http://slidepdf.com/reader/full/phd-laursen-masonry-prestressed-walls 301/308
450
300
E
z
l<
150
;
c.
og
o
-150
o
o
-3oo
fi
-450
200
150
2
1oo
.Y
;so
G
eo
@
o
-50
o
3
-1oo
-1
50
-200
-50
40
-30
-20
-10
0
10
20 30
40
Lateral Displacement
(mm)
Global
response
o.2
.1
0.1
Drift
( )
0.0o.2
450
300
€
z
v
150
;
c
ofl
o
-150
o
U'
-3oo
s
-450
200
150
2
100
lz
;50
o
eo
@
o
-50
a
S
-1oo
-150
-200
67
7-6-54-3-2-101234
Lateral
Displacement
(mm)
Low level
response
Fig. C.S-Series
I FG-L1.8-W15-P2:
Prediction
vs. experimental
behaviour
tttttl tttttl
-27s
-
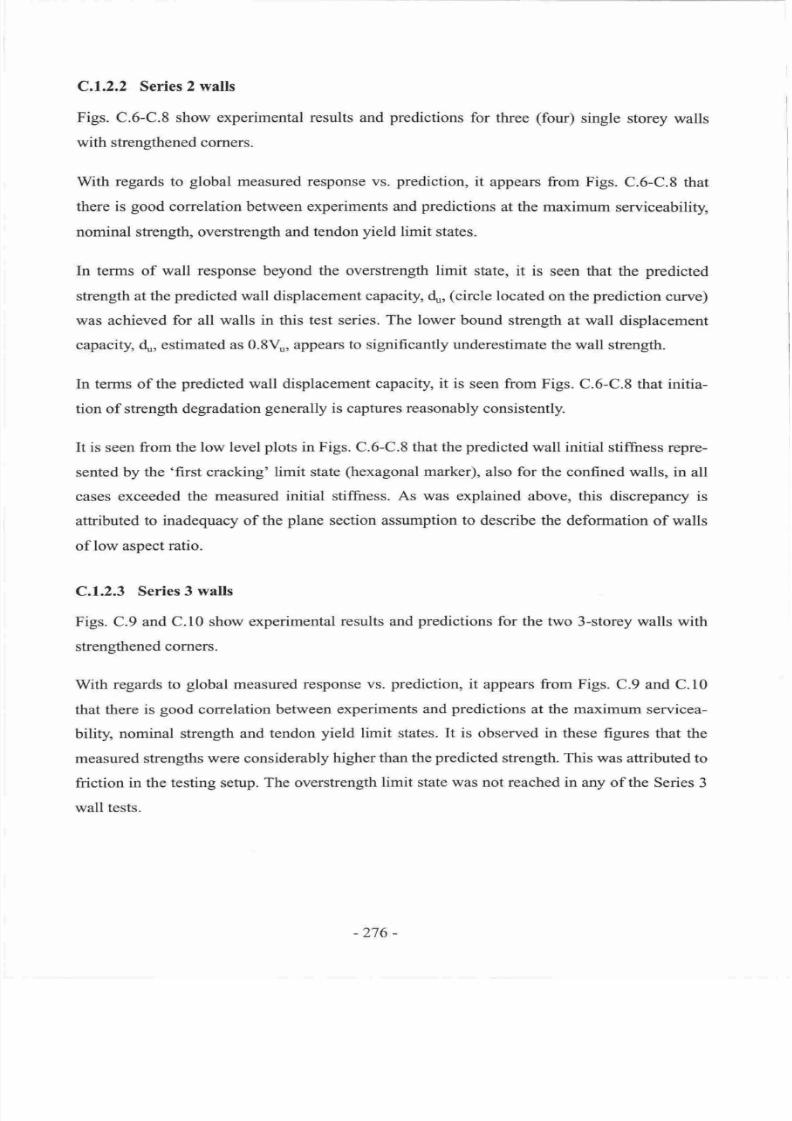
7/21/2019 PHD Laursen-masonry Prestressed Walls
http://slidepdf.com/reader/full/phd-laursen-masonry-prestressed-walls 302/308
C.1.2.2
Series
2 walls
Figs.
C.6-C.8
show
experimental results and
predictions
for three
(four)
single
storey walls
with strengthened corners.
With
regards to
global
measured
response vs.
prediction,
it
appears from Figs. C.6-C.8
that
there is
good
correlation between experiments and
predictions
at
the
maximum
serviceability,
nominal strength, overstrength and
tendon
yield
limit states.
In terms
of
wall response beyond the overstrength
limit
state,
it is
seen
that
the
predicted
strength at
the
predicted
wall
displacement
capacity,
d.,,
(circle
located
on the
prediction
curve)
was
achieved
for all walls in this test series.
The lower bound
strength
at wall displacement
capacity,
du, estimated as 0.8Vo, appears
to significantly underestimate
the wall
shength.
In terms of
the
predicted
wall displacement
capacity, it is
seen from Figs. C.6-C.8
that initia-
tion of strength
degradation
generally
is captures
reasonably
consistently.
It is seen from the low level
plots
in Figs. C.6-C.8 that the
predicted
wall initial stiffiress repre-
sented by the
first cracking limit state
(hexagonal
marker),
also for the
confned walls,
in all
cases exceeded
the
measured
initial
stiffiress.
As
was
explained
above,
this
discrepancy
is
attributed
to
inadequacy
of
the
plane
section assumption
to
describe the
deformation of walls
of
low aspect
ratio.
C.1.2.3
Series 3 walls
Figs. C.9
and C.l0 show experimental
results
and
predictions
for the
two 3-storey walls
with
strengthened
corners.
With
regards
to
global
measured
response
vs.
prediction,
it
appears from
Figs. C.9
and C.10
that
there is
good
correlation
between experiments
and
predictions
at the maximum
servicea-
bility, nominal strength and
tendon
yield
limit
states.
It is
observed
in
these
figures
that the
measured strengths
were
considerably
higher than
the
predicted
strength.
This
was attributed
to
friction
in
the
testing
setup.
The overstrength
limit state
was
not reached in any
of
the
Series 3
wall
tests.
-276-
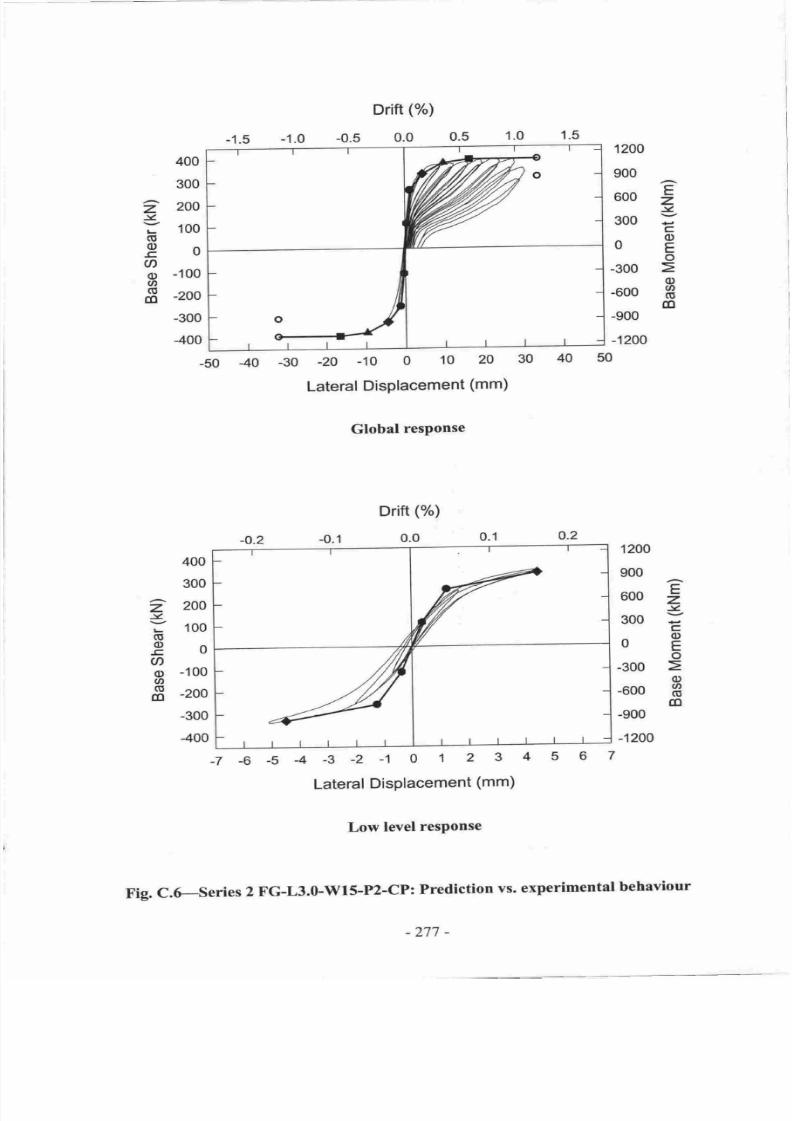
7/21/2019 PHD Laursen-masonry Prestressed Walls
http://slidepdf.com/reader/full/phd-laursen-masonry-prestressed-walls 303/308
Drift
(%)
-0.5
0.0
0.5
400
300
200
100
0
-100
-200
-300
-400
-50
-40
40
50
Global
response
Drift
(%)
-0.1
0.0
0.1
1200
900
600
300
0
-300
-600
-900
-1200
Lateral
DisPlacement
(mm)
Low
level
response
Fig.
c.6-series
2
FG-L3.0-W15-P2-CP:
Prediction
vs. experimental
behaviour
E
z
l4
c
o
E
o
o)
(t
dl
z
-g
(g
o
E
U)
o
(t,
dl
1200
900
600
300
0
-300
-600
-900
-1200
-30
-20
-10
0
10
20
30
Lateral
DisPlacement
(mm)
o.2
-o.2
E
z
.Y
o
E
o
o
o
(g
@
400
300
2
zoo
lz
Y
1oo
o
go
U)
o
-100
o
fi
-2oo
-300
400
t:
-7
-6
-5 4
-3 -2
-1 0
1
2
3
4
5
6
7
-277
-
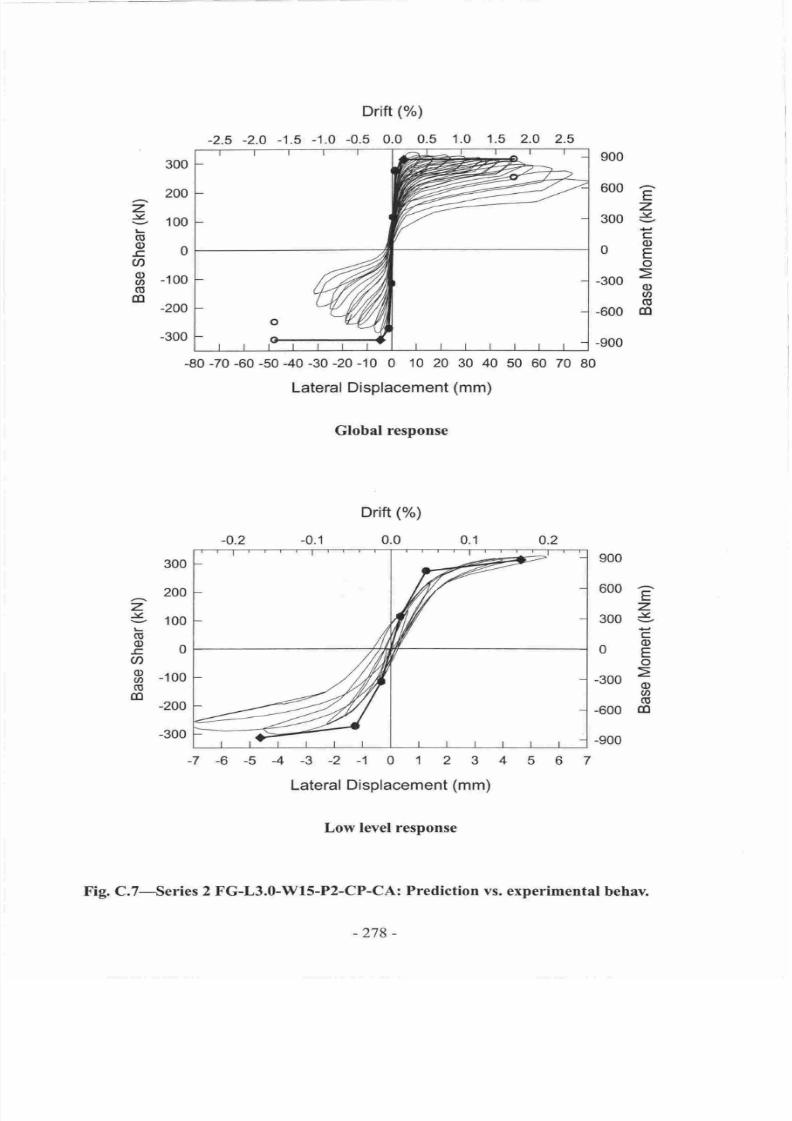
7/21/2019 PHD Laursen-masonry Prestressed Walls
http://slidepdf.com/reader/full/phd-laursen-masonry-prestressed-walls 304/308
Drift
( )
-2.5 -2.0
-'1.5
-1.0
-0.5
0.0
0.5
1.0
1.5 2.0
2.5
E
z
.Y
c
o
E
o
o
@
tU
m
z
.Y
t-
G
o
E
(n
o
U)
(E
(D
300
200
100
0
-100
-200
-300
300
200
100
0
-100
-200
-300
900
600
300
0
-300
-600
-900
Lateral Displacement
(mm)
Global
response
Drift
(7o)
-0.1 0.0
0.1
900
600
300
0
-300
-600
-900
-7-6-54-3-2-101234
Lateral
Displacement
(mm)
Low
level
response
Fig.
C.7-Series
2 FG-L3.0-W15-P2-CP-CA:
Prediction
vs. experimental
behav.
E
z
J
c
o
E
o
o
o
o
dl
z
.:C
o
o
E
U)
o
(t
(U
(D
-80 -70 -60 -50
40
-30
-20
-10
0
10
20
30
40 50
60
70 80
-278-
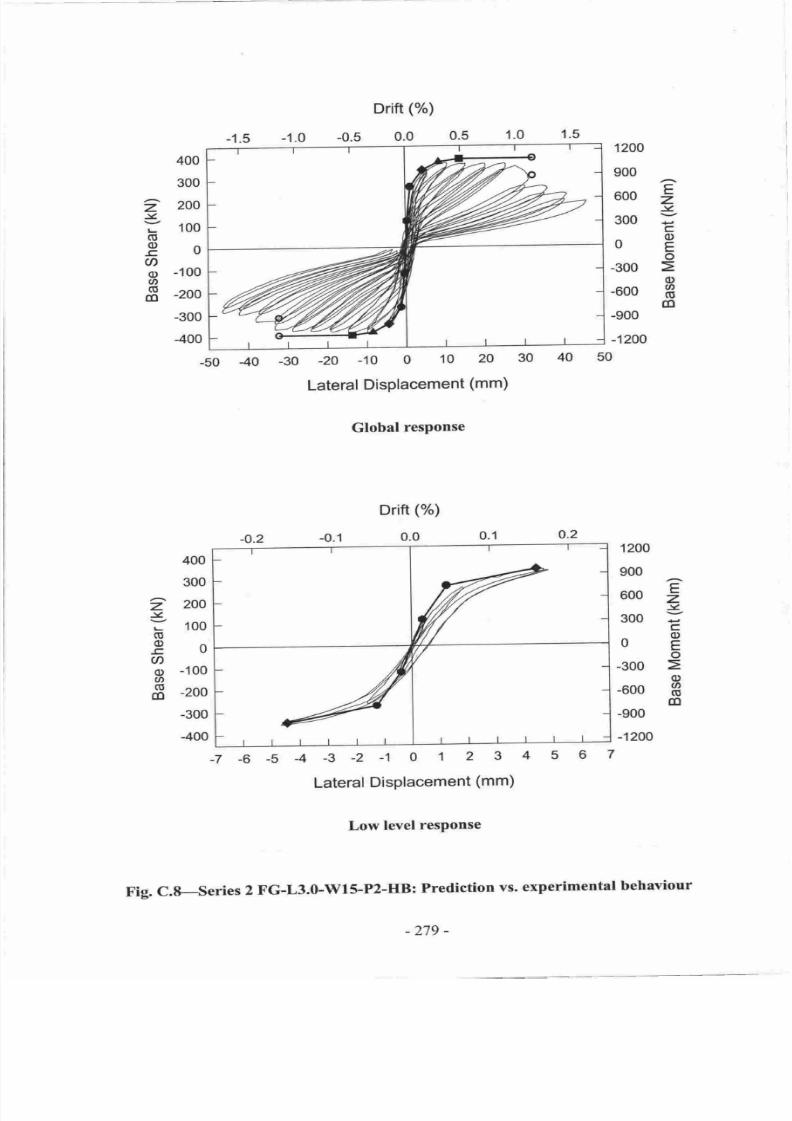
7/21/2019 PHD Laursen-masonry Prestressed Walls
http://slidepdf.com/reader/full/phd-laursen-masonry-prestressed-walls 305/308
Drift
( )
-0.5 0.0
0.5
-50
40
-30
-20
-10
0
10
20
30
Lateral
DisPlacement
(mm)
Global
response
Drift
( )
-o.2
-0.1
0.0
0.1
-1.0
1.5
1.5
,0
400
300
?
2oo
v
;
1oo
o
eo
U'
o
-100
o
S
-zoo
-300
-400
1200
900
600
300
0
-300
-600
-900
-1200
E
z
.Y
c
o
E
o
o
a
o
trl
40
50
0.2
E
z
-v
=
E
o
o
a
o
dl
400
300
2
2oo
.Y
;
1oo
o
eo
a
o
-100
o
E
-2oo
-300
400
1200
900
600
300
0
-300
-600
-900
-1200
Lateral
Displacement
(mm)
Low
level
response
Fig.
c,g-series
2
FG-L3.0-W15-P2-IIB:
Prediction
vs.
experimental
behaviour
ltlll
|/
t:
-7
-6
-5 4
-3
-2 -1 0
1
2
3
4 5
6
7
-279
-

7/21/2019 PHD Laursen-masonry Prestressed Walls
http://slidepdf.com/reader/full/phd-laursen-masonry-prestressed-walls 306/308
In
terms
of
wall
response beyond
the overstrength
limit
state, it
is
seen
that
the
predicted
strength
at the
predicted
wall displacement
capacity,
d,
(circle
located on the
prediction
curve)
was
achieved
for both walls
in this test series.
This was
expected because
the
prediction
model
was
calibrated
with
these
two
wall
tests.
The
lower
bound strength
at
wall
displacement
capac-
ity,
4,
estimated as
0.8Vu, appears
to significantly
underestimate
the
wall
strength.
The initia-
tion
of strength
degradation
generally
was captures
well.
It is seen from
the low level
plots
in Figs. C.9
and C.10 that the
predicted
wall initid
stiffiress,
represented by
the
'first
cracking'
limit
state
(hexagonal
marker),
in both cases captured
the
actual
resonse.
C.13
Conclusion
The following conclusions
were drawn from comparison between
predictions
using
the
proce-
dures developed
in this chapter and experimental
results.
Initial stiffiress:
For wall of
low
aspect ratio
(say
below
1.0),
the
predicted
initial
stiffiress based
on V , and
d .
overestimates the actual
wall
stiftress
by a
factor
of
the
order
of
1.5. For
aspect ratios
above 2,
accurate
prediction
is expected.
Global
response:
Using
the
predicted
base shear and displacement
at maximum serviceability
moment, nominal
strength,
first tendon
yield
and overstrength,
an accurate
estimation of the force-displacement
envelope
(skeleton
curve)
can
be achieved.
Displacement capacity:
The
predicted
displacement capacity,
d,.,,
was captured with reasonable
accuracy
using the
val-
ues
for
extreme
fibre strain
and
plastic
zone
length
given
in Thble
8.1. The strength
associated
with
d for CPl00 confined concrete
masonry can be
based on Vu. For CP200
confined
masonry
and U200 unconfined masonry,
it
appears
prudent
to limit
the
wall
stength
(base
shear) at d
to 0.8%. The maximum strength
predicted
at du should
be
limited
by Mo.
-280 -
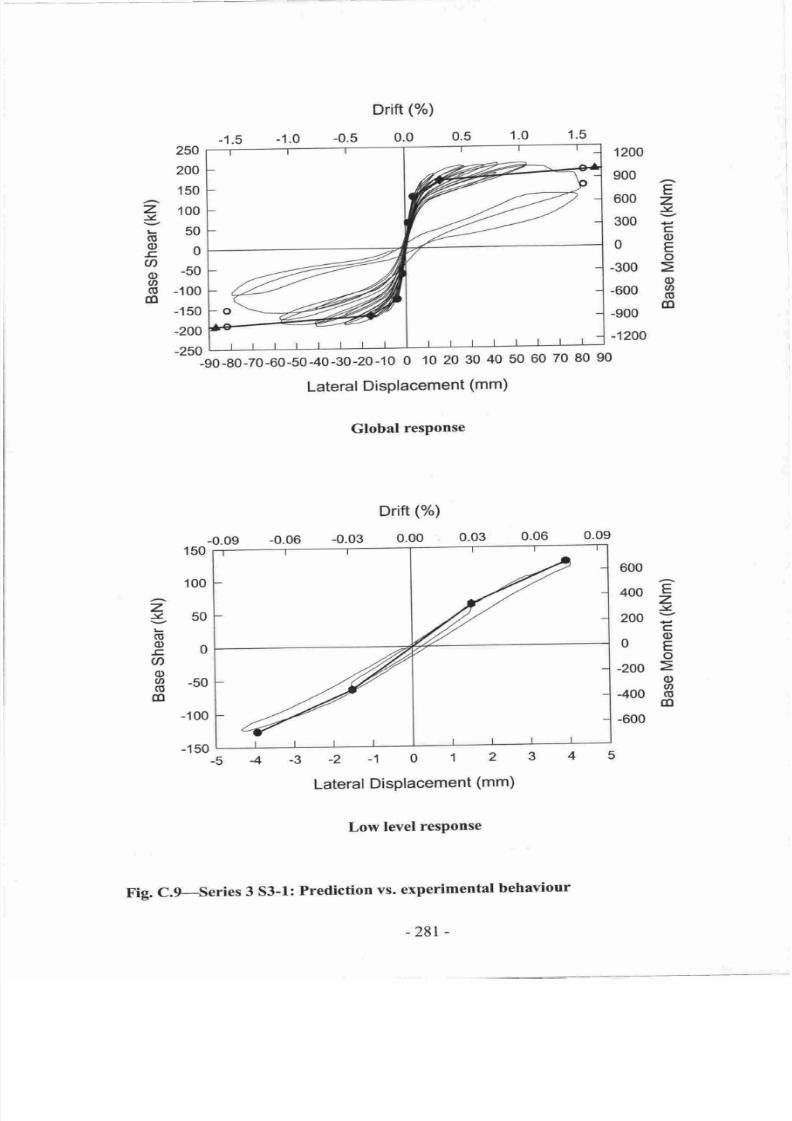
7/21/2019 PHD Laursen-masonry Prestressed Walls
http://slidepdf.com/reader/full/phd-laursen-masonry-prestressed-walls 307/308
E
z
.v
c,
o
E
o
o
o
o
dl
600
300
0
-300
-600
-900
z
-v
(0
o
-c
a
o
a
(u
dt
Drift
( )
-0.s
0.0
0.5
250
200
150
100
50
0
-50
-100
-150
-200
-250
----90.80.70-60-50.40.30-20-100102030405060708090
Lateral
DisPlacement
(mm)
Global
response
0.06
1200
900
-1200
600
400
200
0
-200
400
-600
-0.09
-0.06
Drift
( )
-0.03 0.00
0.03
0.09
150
100
-100
-150
-3-2-10123
Lateral
DisPlacement
(mm)
Low
level
response
Fig.
c.r-Series
3
s3-l:
Prediction
vs.
experimental
behaviour
E
z
.Y
c
o
E
o
o
a
(E
(Il
950
o
go
@
o
ffi
-50
dl
-5
-28r
-
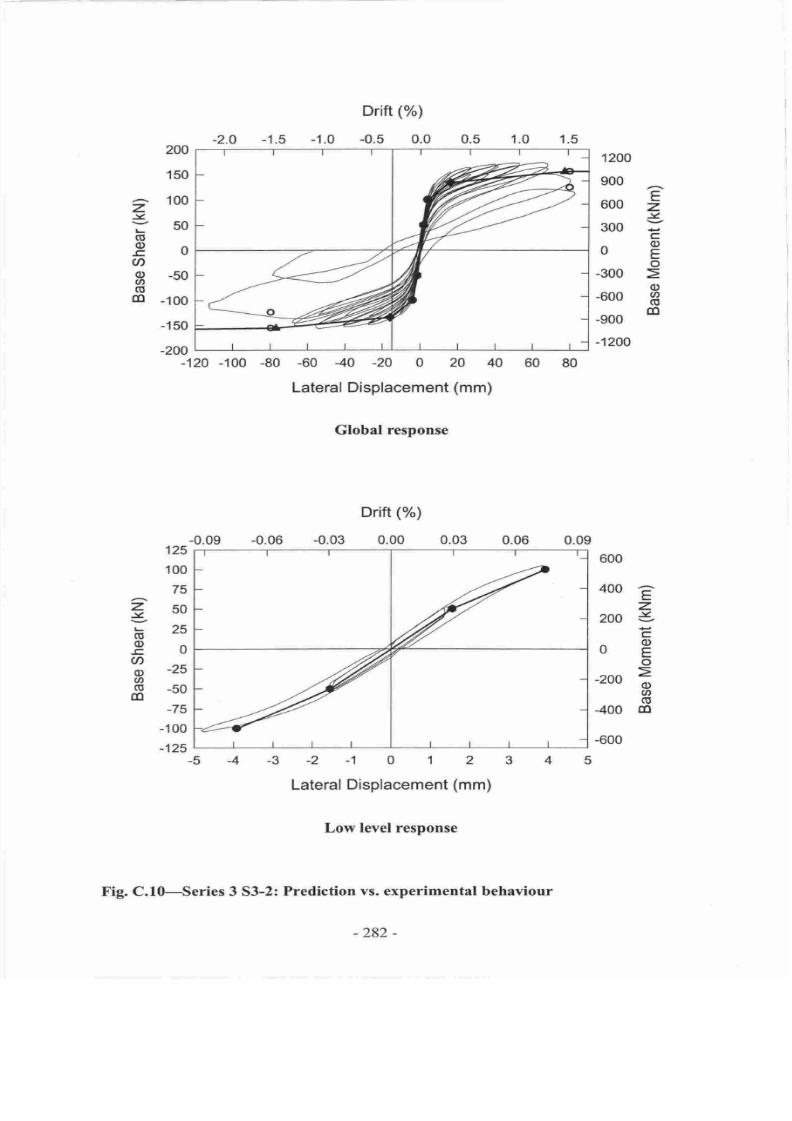
7/21/2019 PHD Laursen-masonry Prestressed Walls
http://slidepdf.com/reader/full/phd-laursen-masonry-prestressed-walls 308/308