Phase III Study of ASP015K −A randomized, double …...Sponsor: Astellas Pharma Inc. SAP...
109
Phase III Study of ASP015K −A randomized, double-blind, placebo-controlled confirmatory study of the safety and efficacy of ASP015K in patients with rheumatoid arthritis (RA) who had an inadequate response to DMARDs− ISN/Protocol 015K-CL-RAJ3 ClinicalTrials.gov Identifier: NCT02308163 Date of Statistical Analysis Plan: Version 1.0, dated 19 January 2018 Sponsor: Astellas Pharma Inc. (API) 2-5-1 Nihonbashi-Honcho, Chuo-ku, Tokyo
Transcript of Phase III Study of ASP015K −A randomized, double …...Sponsor: Astellas Pharma Inc. SAP...

Phase III Study of ASP015K
−A randomized, double-blind, placebo-controlled confirmatory study of the safety and efficacy of ASP015K
in patients with rheumatoid arthritis (RA) who had aninadequate response to DMARDs−
ISN/Protocol 015K-CL-RAJ3
ClinicalTrials.gov Identifier: NCT02308163
Date of Statistical Analysis Plan: Version 1.0, dated 19January 2018
Sponsor: Astellas Pharma Inc. (API)
2-5-1 Nihonbashi-Honcho, Chuo-ku, Tokyo

Sponsor: Astellas Pharma Inc. SAP Final VersionISN/Protocol 015K-CL-RAJ3
19-Jan-2018 Astellas Page 1 of 108
STATISTICAL ANALYSIS PLAN
Final Version, dated 19-Jan 2018
Phase III Study of ASP015K
A Randomized, Double-Blind, Placebo-Controlled Confirmatory Study of the Safety and Efficacy of ASP015K in Patients with Rheumatoid Arthritis (RA) who Had an Inadequate
Response to DMARDs
ISN: 015K-CL-RAJ3
Astellas Pharma Inc. (API)
This confidential document is the property of the sponsor. No unpublished information contained in this document may be disclosed without prior written approval of the sponsor.
Sponsor: Astellas Pharma Inc. SAP Final VersionISN/Protocol 015K-CL-RAJ3
19-Jan-2018 Astellas Page 2 of 108
Table of Contents
I. LIST OF ABBREVIATIONS AND KEY TERMS··········································· 5
1 INTRODUCTION·················································································· 9
2 FLOW CHART AND VISIT SCHEDULE ···················································10
FLOW CHART ·····························································································10
TABLE 1 SCHEDULE OF ASSESSMENTS··························································11
3 STUDY OBJECTIVE(S) AND DESIGN······················································14
3.1 Study Objective(s) ············································································14
3.2 Study Design···················································································14
3.3 Randomization·················································································15
4 SAMPLE SIZE ····················································································15
5 ANALYSIS SETS ·················································································17
5.1 Full Analysis Set (FAS) ······································································17
5.2 Per Protocol Set (PPS)········································································17
5.3 Safety Analysis Set (SAF) ···································································17
5.4 Pharmacokinetic Analysis Set (PKAS)·····················································17
5.5 Pharmacodynamic Analysis Set (PDAS)···················································18
6 ANALYSIS VARIABLES ·······································································18
6.1 Efficacy Endpoints············································································18
6.1.1 Primary Efficacy Endpoints····························································18
6.1.2 Secondary Efficacy Variables··························································19
6.2 Safety Variables ···············································································22
6.3 Pharmacokinetic Variables···································································22
6.4 Pharmacodynamic Variables ································································22
6.5 Other Variables················································································24
7 STATISTICAL METHODOLOGY ···························································26
7.1 General Considerations·······································································26
7.2 Study Population ··············································································29
7.2.1 Disposition of Subjects ·································································29
7.2.2 Demographic and Other Baseline Characteristics ···································30
7.2.3 Previous and Concomitant Medications ··············································34

Sponsor: Astellas Pharma Inc. SAP Final VersionISN/Protocol 015K-CL-RAJ3
19-Jan-2018 Astellas Page 3 of 108
7.3 Study Drugs····················································································35
7.3.1 Exposure··················································································35
7.3.2 Treatment Compliance··································································35
7.4 Analysis of Efficacy ··········································································36
7.4.1 Analysis of Primary Endpoint(s) ······················································36
7.4.2 Analysis of Secondary Endpoints ·····················································41
7.5 Analysis of Safety·············································································42
7.5.1 Adverse Events ··········································································42
7.5.2 Clinical Laboratory Evaluation ························································46
7.5.3 Vital Signs················································································51
7.5.4 Electrocardiograms (ECGs) ····························································51
7.5.5 Chest radiography ·······································································52
7.5.6 Pregnancies···············································································52
7.6 Analysis of PK·················································································52
7.7 Analysis of PD·················································································53
7.8 Subgroups of Interest ·········································································54
7.8.1 Subgroup analysis of primary endpoint and treatment emergent adverse
events ·····················································································54
7.8.2 Subgroup analysis for Study Region (Japan, Korea, Taiwan) ·····················55
7.8.3 Protocol Version Number (used for confirmation of the Inclusion criteria
and the Exclusion criteria) (<= Version 2.0, >= Version 3.0)······················55
7.9 Other Analyses ················································································56
7.10 Interim Analysis (and Early Discontinuation of the Clinical Study)····················56
7.11 Handling of LLOQ, Missing Data, Outliers, Visit Windows, and Other
Information ····················································································56
7.11.1 LLOQ ·····················································································56
7.11.2 Missing Data ·············································································56
7.11.3 Outliers ···················································································62
7.11.4 Visit Windows ···········································································63
7.11.5 Handling of Schedule of Assessments of Efficacy Variables ······················64
7.11.6 Handling of Schedule of Assessments of Safety Variables ························65
7.11.7 Handling of Schedule of Assessments of Pharmacodynamic Variables ··········69
8 DOCUMENT REVISION HISTORY ·························································70
9 REFERENCES ····················································································70

Sponsor: Astellas Pharma Inc. SAP Final VersionISN/Protocol 015K-CL-RAJ3
19-Jan-2018 Astellas Page 4 of 108
10 APPENDICES ·····················································································71
10.1 Appendix 1: Overview of ACR20 response at Week 12/ET·····························71
10.2 Appendix 2: Overview of Secondary Endpoints ··········································73
10.3 Appendix 3: Overview of AE analysis ·····················································81
10.4 Appendix 4: Overview of Clinical Laboratory Evaluation, Vital Sings, and
Electrocardiograms (ECGs) analyses·······················································84
10.5 Appendix 5: Computation of HAQ-DI Score··············································87
10.6 Appendix 6: Computation of SF-36v2® Score ·············································90
10.7 Appendix 7: Computation of WPAI Scale Score········································ 101
10.8 Appendix 8: AE of Special Interest ······················································· 102
10.9 Appendix 9: Standard Toxicity Grading for Laboratory Tests According to
National Cancer Institute Common Terminology Criteria for Adverse Events
(NCI-CTCAE) v4.0 ········································································· 103
10.10 Appendix 10: Key Contributors and Approvers········································· 106

Sponsor: Astellas Pharma Inc. SAP Final VersionISN/Protocol 015K-CL-RAJ3
19-Jan-2018 Astellas Page 5 of 108
I. LIST OF ABBREVIATIONS AND KEY TERMS
List of AbbreviationsAbbreviations Description of abbreviationsACR American College of Rheumatology
AE Adverse Event
ALP Alkaline Phosphatase
ALT Alanine Aminotransferase (GPT)
ANCOVA Analysis of Covariance
ANOVA Analysis of Variance
AST Aspartate Aminotransferase (GOT)
ASP015K Astellas Pharmaceuticals Compound 015K
BDRM Blinded Data Review Meeting
BMI Body Mass Index
BUN Blood Urea Nitrogen
anti-CCP antibody anti-cyclic citrullinated peptide antibody
CDAI Clinical Disease Activity IndexCI Confidence Intervals
CK Creatine Kinase
CK-MB Creatine kinase MB isozyme
CRF Case Report Form
CRO Contract Research Organization
CRP C-reactive protein
CSR Clinical Study Report
DAS Disease Activity Score
DBP Diastolic Blood Pressure
DIP Distal interphalangeal joint
DILI Drug-induced Liver Injury
DMARD Disease-modifying antirheumatic drug
DSMB Data and Safety Monitoring Board
ECG Electrocardiogram
eCRF Electronic Case Report Form
EOS End of Study
ESR Erythrocyte sedimentation rate
ET Early termination
EU European Union
EULAR European League Against Rheumatism
FAS Full Analysis Set
FDA Food and Drug Administration
GCP Good Clinical Practice
GD Global Development
GFR Glomerular filtration rate
GMP Good Manufacturing Practice
γ-GTP γ-Glutamyl Transpeptidase (GGT)
H High

Sponsor: Astellas Pharma Inc. SAP Final VersionISN/Protocol 015K-CL-RAJ3
19-Jan-2018 Astellas Page 6 of 108
Abbreviations Description of abbreviationsHAQ-DI Health Assessment Questionnaire - Disability Index
HBc antibody Hepatitis B core antibody
HBs antigen/antibody Hepatitis B surface antigen/antibody
hCG Human chorionic gonadotropin
HBV Hepatitis B virus
HCV Hepatitis C virus
HDL High-density lipoprotein
hERG Ether-a-go-go related gene
HIV Human Immunodeficiency Virus
HSA Human serum albumin
ICH International Conference on Harmonization of Technical Requirements for Registration of Pharmaceuticals for Human Use
INR International Normalized Ratio
IP Interphalangeal joint
IRB Institutional Review Board
ISN International Study Number
JAK Janus Kinase
L Low
LLN Lower Limit of Normal
LLOQ Lower limit of quantification
LOCF Last observation carried forward
MCP Metacarpophalangeal joint
MDRD Modification of Diet in Renal Disease
MedDRA Medical Dictionary for Regulatory Activities
MMP-3 Matrix metalloproteinase 3
MTP Metatarsophalangeal joint
MTX Methotrexate
N Normal
NCI-CTCAE National Cancer Institute Common Terminology Criteria for Adverse Events
NK Natural killer
NRI Non-responder imputation
NSAIDs Non-steroidal anti-inflammatory Drugs
PD Pharmacodynamic
PDAS Pharmacodynamic Analysis Set
PGA Physician’s Global Assessment of Arthritis
PGx Pharmacogenomics
PK Pharmacokinetic
PKAS Pharmacokinetic analysis set
PPS Per protocol set
PT Preferred Term
PY Patient-years
QD Once a day
RA Rheumatoid arthritis

Sponsor: Astellas Pharma Inc. SAP Final VersionISN/Protocol 015K-CL-RAJ3
19-Jan-2018 Astellas Page 7 of 108
Abbreviations Description of abbreviationsRCS Role/social component score of the SF-36v2®
RF Rheumatoid Factor
SAE Serious adverse event
SAF Safety analysis set
SAP Statistical Analysis Plan
SAS Statistical Analysis Software
SBP Systolic Blood Pressure
SDAI Simplified Disease Activity Index
SF-36v2® Short form health survey – 36 questions, version 2
SFL Screening Failure Log
SGA Subject’s Global Assessment of Arthritis
SGAP Subject’s Global Assessment of Arthritis PainSI International System of Units
SJC Swollen joint count
SOC System Organ Class
SOP Standard Operating Procedure
SUSAR Suspected Unexpected Serious Adverse Reactions
TBL Total bilirubin
TEAE Treatment emergent adverse event
TJC Tender joint count
TLF Tables, Listings and Figures
TNF Tumor Necrosis Factor
ULN Upper Limit of Normal
VAS Visual Analog Scale
WBC White Blood Cell
WHO-DD World Health Organization Drug Dictionary
WPAI Work Productivity and Activity Impairment Questionnaire

Sponsor: Astellas Pharma Inc. SAP Final VersionISN/Protocol 015K-CL-RAJ3
19-Jan-2018 Astellas Page 8 of 108
List of Key TermsTerms Definition of termsBaseline 1) Values/findings observed prior to the initiation of study treatment, which
are regarded as the starting point for comparison.2) The time point at which those reference values/findings were observed.
Study period The period of time from obtaining informed consent from the subject to the end of the final evaluation/observation specified in the protocol.
Investigational period The period of time where major interests of protocol objectives are observed. In general, the subject will receive a test drug, comparative drug, or reference drug (possibly without randomization) during this period, which extends until the last post-treatment assessment is completed.
Follow-up period The follow-up period will be 4 weeks (on a per-protocol basis) starting after the early-termination visit for withdrawn subjects and after the Week 52 visit for subjects who completed the study but are not willing to enroll into the extension study or those in the reference group who completed the study. For subjects who completed the study and wish to enroll into the extension study, the follow-up period will last for a maximum of 4 weeks starting after the Week 52 visit and ending at the initiation of the extension study treatment.
Subject An individual who participates in a clinical study as a recipient of either the test drug(s) or reference drug(s), or as a control.
Week 12/ET Week 12 or early termination before Week 12EOT Week 52 or early termination before Week 52Study discontinuation The act of concluding participation, prior to completion of all protocol-
required elements, in a study by an enrolled subject. Four categories of discontinuation are distinguished: a) dropout: Active discontinuation by a subject (also a noun referring to such a discontinued subject); b) discontinuation initiated by the investigator or other responsible personnel (e.g., for cause); c) loss to follow-up: discontinuation of participation without notice or action by the subject; d) sponsor-initiated discontinuation.Note that subject discontinuation does not necessarily imply exclusion of subject data from analysis.
Variable A characteristic under study that varies: any attribute, phenomenon, or event that can have different qualitative or quantitative values.

Sponsor: Astellas Pharma Inc. SAP Final VersionISN/Protocol 015K-CL-RAJ3
19-Jan-2018 Astellas Page 9 of 108
1 INTRODUCTION
This Statistical Analysis Plan (SAP) contains a more technical and detailed elaboration of the principal features of the analysis described in the protocol, and includes detailed procedures for executing the statistical analysis of the primary and secondary endpoints and other data.
The SAP is finalized and signed prior to unblinding.
This statistical analysis is coordinated by the responsible biostatistician of GD, API. Any changes from the analyses planned in the SAP will be justified in the Clinical Study Report (CSR).

Sponsor: Astellas Pharma Inc. SAP Final VersionISN/Protocol 015K-CL-RAJ3
19-Jan-2018 Astellas Page 10 of 108
2 FLOW CHART AND VISIT SCHEDULE
FLOW CHART
Obtaining informed consent
Screening period (The screening test period must be within 28 days prior to the baseline visit.)
Confirmation of inclusion/exclusion criteriaPreliminary registration
Baseline
Confirmation of inclusion/exclusion
criteriaEnrollment and randomization
Treatment period: maximum of 52 weeks, ranging from the start of
the treatment with the study drug or reference drug to the completion of tests/assessments
schedule at the end of treatment (Week
52 or early termination)
See figure below.
Entry into the extension studySubjects in the reference group or who do not proceed to the extension study will undergo follow-up observation 4 weeks after the end of the study treatment.
Initiation of screening
Placebo group
Screening periodScreening test period
(28 days)
ASP015K 100 mg group
ASP015K 150 mg group
Reference group(etanercept treatment)
DMARD-IR evaluation
Dose change under the blinded condition.
PlaceboASP015K 100 mg/day
ASP015K 150 mg/day
ASP015K 100 mg/day
ASP015K 150 mg/day
Etanercept 50 mg/week (open-label)
12 W 52 W0 WBaseline
Random allocation (including the doses to be assigned to subjects in
the placebo group at Week 12)
Primary efficacy variable: ACR20
Su
bjec
ts c
ompl
etin
g th
e st
udy
can
en
roll
int
o th
e op
en-l
abel
ext
ensi
on s
tudy
.
Sponsor: Astellas Pharma Inc. SAP Final VersionISN/Protocol 015K-CL-RAJ3
19-Jan-2018 Astellas Page 11 of 108
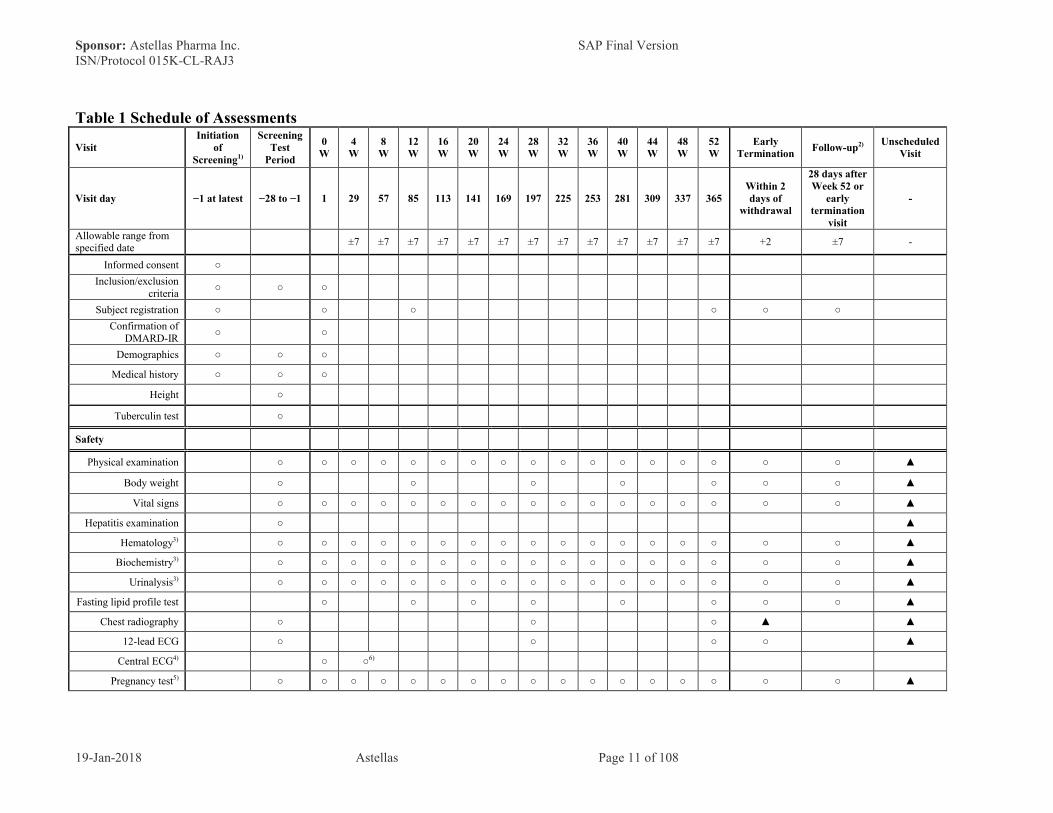
Table 1 Schedule of Assessments
VisitInitiation
of Screening1)
ScreeningTest
Period
0 W
4 W
8 W
12 W
16 W
20 W
24 W
28 W
32 W
36 W
40 W
44 W
48 W
52 W
Early Termination
Follow-up2) Unscheduled Visit
Visit day −1 at latest −28 to −1 1 29 57 85 113 141 169 197 225 253 281 309 337 365Within 2 days of
withdrawal
28 days afterWeek 52 or
early termination
visit
-
Allowable range from specified date
±7 ±7 ±7 ±7 ±7 ±7 ±7 ±7 ±7 ±7 ±7 ±7 ±7 +2 ±7 -
Informed consent ○
Inclusion/exclusion criteria
○ ○ ○
Subject registration ○ ○ ○ ○ ○ ○
Confirmation of DMARD-IR
○ ○
Demographics ○ ○ ○
Medical history ○ ○ ○
Height ○
Tuberculin test ○
Safety
Physical examination ○ ○ ○ ○ ○ ○ ○ ○ ○ ○ ○ ○ ○ ○ ○ ○ ○ ▲
Body weight ○ ○ ○ ○ ○ ○ ○ ▲
Vital signs ○ ○ ○ ○ ○ ○ ○ ○ ○ ○ ○ ○ ○ ○ ○ ○ ○ ▲
Hepatitis examination ○ ▲
Hematology3) ○ ○ ○ ○ ○ ○ ○ ○ ○ ○ ○ ○ ○ ○ ○ ○ ○ ▲
Biochemistry3) ○ ○ ○ ○ ○ ○ ○ ○ ○ ○ ○ ○ ○ ○ ○ ○ ○ ▲
Urinalysis3) ○ ○ ○ ○ ○ ○ ○ ○ ○ ○ ○ ○ ○ ○ ○ ○ ○ ▲
Fasting lipid profile test ○ ○ ○ ○ ○ ○ ○ ○ ▲
Chest radiography ○ ○ ○ ▲ ▲
12-lead ECG ○ ○ ○ ○ ▲
Central ECG4) ○ ○6)
Pregnancy test5) ○ ○ ○ ○ ○ ○ ○ ○ ○ ○ ○ ○ ○ ○ ○ ○ ○ ▲

Sponsor: Astellas Pharma Inc. SAP Final VersionISN/Protocol 015K-CL-RAJ3
19-Jan-2018 Astellas Page 12 of 108
VisitInitiation
of Screening1)
ScreeningTest
Period
0 W
4 W
8 W
12 W
16 W
20 W
24 W
28 W
32 W
36 W
40 W
44 W
48 W
52 W
Early Termination
Follow-up2) Unscheduled Visit
Visit day −1 at latest −28 to −1 1 29 57 85 113 141 169 197 225 253 281 309 337 365Within 2 days of
withdrawal
28 days afterWeek 52 or
early termination
visit
-
Allowable range from specified date
±7 ±7 ±7 ±7 ±7 ±7 ±7 ±7 ±7 ±7 ±7 ±7 ±7 +2 ±7 -
Adverse events ○ ○ ○ ○ ○ ○ ○ ○ ○ ○ ○ ○ ○ ○ ○ ○ ▲
Efficacy
CRP and ESR○
(CRP only)
○ ○ ○ ○ ○ ○ ○ ○ ○ ○ ○ ○ ○ ○ ○ ○ ▲
TJC/SJC (68/66 joints) ○ ○ ○ ○ ○ ○ ○ ○ ○ ○ ○ ○ ○ ○ ○ ○ ○ ▲
PGA (VAS), SGA (VAS), and
subject’s assessment of pain (VAS)
○ ○ ○ ○ ○ ○ ○ ○ ○ ○ ○ ○ ○ ○ ○ ○ ▲
SF-36 v2® ○ ○ ○ ○ ○ ○ ○ ○ ▲
WPAI ○ ○ ○ ○ ○ ○ ○ ○ ▲
HAQ-DI ○ ○ ○ ○ ○ ○ ○ ○ ○ ○ ○ ○ ○ ○ ○ ○ ▲
PK/PD ▲
Blood sampling for trough concentration4) ○ ○ ○ ○ ○ ○ ○
Blood sampling for post-dose drug concentration4)
○
Blood sampling for PD(biomarkers)
○ ○ ○ ○ ○ ○ ○ ○ ▲
Blood sampling for PD(lymphocyte subset)
○ ○ ○ ○ ○ ○ ○ ○ ▲
Informed consent for PGx research (relevant
sites only)4)○
Blood sampling for PGx (relevant sites
only)4)○

Sponsor: Astellas Pharma Inc. SAP Final VersionISN/Protocol 015K-CL-RAJ3
19-Jan-2018 Astellas Page 13 of 108
VisitInitiation
of Screening1)
ScreeningTest
Period
0 W
4 W
8 W
12 W
16 W
20 W
24 W
28 W
32 W
36 W
40 W
44 W
48 W
52 W
Early Termination
Follow-up2) Unscheduled Visit
Visit day −1 at latest −28 to −1 1 29 57 85 113 141 169 197 225 253 281 309 337 365Within 2 days of
withdrawal
28 days afterWeek 52 or
early termination
visit
-
Allowable range from specified date
±7 ±7 ±7 ±7 ±7 ±7 ±7 ±7 ±7 ±7 ±7 ±7 ±7 +2 ±7 -
Study drug/reference drug
Confirmation of remaining unused drugs
○ ○ ○ ○ ○ ○ ○ ○ ○ ○ ○ ○ ○ ○
Prescription ○ ○ ○ ○ ○ ○ ○ ○ ○ ○ ○ ○ ○
The symbol "○" designates mandatory items, whereas the symbol "▲" denotes the optional items to be investigated on the basis of the clinical judgment of the investigator/sub-investigator.
For details, see the respective Sections of the protocol.
1) Subjects who have signed the informed consent will undergo evaluation of DMARD response at the screening visit.
2) Follow-up will not be performed for subjects starting the extension study immediately after the Week 52 visit.
3) For details of the test parameters, refer to protocol Section 5.4.4.
4) Subjects in the reference group will not undergo these procedures.
5) For pregnancy tests, serum samples will be used at the screening visit, and urine samples will be used at and after the baseline visit.
6) Central ECG should be performed on the same day as blood sampling for post-dose drug concentration at Week 4 or Week 8 before and after study drug administration.

Sponsor: Astellas Pharma Inc. SAP Final VersionISN/Protocol 015K-CL-RAJ3
19-Jan-2018 Astellas Page 14 of 108
3 STUDY OBJECTIVE(S) AND DESIGN
3.1 Study Objective(s)
The objectives of this study are to verify the superiority of ASP015K alone or in combination with DMARDs over placebo in terms of efficacy, at doses of 100 mg/day and 150 mg/day, in patients with rheumatoid arthritis (RA) who had an inadequate response to DMARDs, as measured by the ACR20 response rate at Week 12, which is the primary variable; to evaluate the pharmacokinetics, pharmacodynamics, and safety of ASP015K; and to evaluate the efficacy and safety of long-term treatment with ASP015K (52 weeks).
3.2 Study Design
This is a Japanese, Korean and Taiwanese, multi-center, randomized, placebo-controlled, double-blind, parallel-group, confirmatory study to evaluate the efficacy and safety of ASP015K alone or in combination with DMARDs, at doses of 100 mg/day and 150 mg/day, in patients with RA who had an inadequate response to DMARDs. Open-label etanercept will also be administered as the reference drug for 52 weeks (the last dose will be given at Week 51). In the study, ASP015K (test drug) and placebo (comparative drug) will be given as study drugs, and etanercept will be given as a separate reference drug. DMARD response is evaluated at the initiation of screening and then after the screening period, subjects will be randomized in a 1:1:1:2 ratio to the ASP015K 100 mg, ASP015K 150 mg, placebo, or reference groups, and they will receive either the study drug or reference drug for 52 weeks. Subjects in the ASP015K 100 mg, ASP015K 150 mg, and placebo groups will orally receive either ASP015K or placebo once daily after breakfast, while those in the reference group will receive 50 mg of subcutaneous etanercept once weekly.
The planned sample size is 100 subjects each for the ASP015K 100 mg, ASP015K 150 mg, and placebo groups and 200 subjects for the reference group.
Re-screening is allowed only in situations in which a subject underwent the screening procedures (i.e., scans and laboratory work) and owing to logistical circumstances, the allocated time window for these tests has expired. Re-screening is not permitted in cases in which the initial test results do not support eligibility based on inclusion and exclusion criteria. The subject must be classified as a screening failure at that time point.
Based on the consideration of the ethical issues related to long-term placebo use, at Week 12 subjects in the placebo group will be switched to either ASP015K 100 mg or ASP015K 150 mg, and the dosage will be maintained until the end of treatment. The ASP015K dose that will be started for placebo group subjects at Week 12 (100 or 150 mg) will be randomly chosen at baseline. The dose will be switched under the blinded condition.
Subjects in the ASP015K 100 mg, ASP015K 150 mg, or placebo groups who complete this study will be eligible for participation in the open-label extension study (015K-CL-RAJ2). Subjects will make a follow-up visit after the Week 52 visit if they do not enroll into the extension study on the day of the Week 52 visit.

Sponsor: Astellas Pharma Inc. SAP Final VersionISN/Protocol 015K-CL-RAJ3
19-Jan-2018 Astellas Page 15 of 108
Safety data obtained from this study will be reviewed by the Independent Data and Safety Monitoring Board (DSMB), which will make recommendations on study continuation, termination, or protocol revision from the safety perspective.
3.3 Randomization
The person responsible for assigning study drugs will randomly assign the study drugs and retain the treatment code under secrecy until the breaking of the treatment code.
The Case Registration Center will assign subjects who have been found to be eligible for enrollment in accordance with the case registration procedures to 1 of the following groups: ASP015K 100 mg, ASP015K 150 mg, placebo, or reference groups at baseline in 1:1:1:2 ratio. At Week 12, subjects in the placebo group will be switched to receive either ASP015K at a dose of 100 mg or ASP015K at a dose of 150 mg. The dose of ASP015K (100 mg or 150 mg) to be administered to the placebo group from Week 12 will be determined in advance randomly at baseline, and study drugs must be switched under double-blind conditions.
To minimize potential bias in this study, dynamic allocation procedures in each study region (Japan, Korea, and Taiwan) will be used by biased-coin minimization with the following 1 to 3 as factors:
1. Study center;2. Prior Biologic DMARD-IR at baseline; and3. Concomitant DMARD at Baseline use at the initiation of treatment with the study drug
or reference drug.
All drug numbers are assigned randomly by the Case Registration Center under blind conditions.
4 SAMPLE SIZE
One hundred subjects per group will receive the study drug and 200 subjects the reference drug (a total of 500 subjects).
[Rationale for the sample size]
Based on 015K-CL-RAJ1 result and efficacy result from other RA drugs [XELJANZ®, tablet, 5 mg, CTD (2013)] [CIMZIA, sc, 200 mg, Syringe, CTD (2012)], 62 subjects per group will provide 90% power to detect a difference assumed in the Step 2 in the closed testing procedure (described in Section 7.4.1.1 Primary Analysis) under the following assumptions. In addition, it is assumed that ACR20 response rate of each country (Japan, Korea and Taiwan) is similar.
● ACR20 response rate at Week 12 in the placebo group: 25%● ACR20 response rate at Week 12 in the ASP015K 100 mg group: 54.5%

Sponsor: Astellas Pharma Inc. SAP Final VersionISN/Protocol 015K-CL-RAJ3
19-Jan-2018 Astellas Page 16 of 108
● ACR20 response rate at Week 12 in the ASP015K 150 mg group: 65.5%● Two-sided significance level of 0.05
On the other hand, according to the Extent of Population Exposure to Assess Clinical Safety for Drugs Intended for Long-term Treatment of Non-life-threatening Conditions (PAB/PCD Notification No.592, dated 24 May 1995), ("the long-term treatment guideline"), a sample size of 300-600 subjects under long-term treatment (6 months) is adequate to observe delayed adverse events at a reasonable frequency (generally, 0.5% to 5%) and to observe whether there is an increase in high-frequency adverse events during the later stage of treatment. For treatment lasting 1 year, 100 subjects is acceptable. It is also described in "Guidelines on methodology for clinical assessment of antirheumatic drugs" (PFSB/ELD Notification No. 0217001, dated 17 February 2006) that 100 subjects for 1 year are necessary.
Therefore, to collect data for 300 subjects for 6 month period, and for 100 subjects for 1 year period in both ASP015K 100 mg and 150 mg groups among 015K-CL-RAJ2/RAJ3/RAJ4 studies as long-term treatment data, approximately 80 subjects per treatment group (400 subjects in total) as a target are necessary to be enrolled in Japan. In addition, the target sample size for Taiwan is set at 10 subjects per treatment group (50 subjects in total) as a target in consideration of the requirement of regulatory authority in Taiwan (10% or more Taiwan subjects) and target sample size for Korea is also set at 10 subjects per treatment group (50 subjects in total) as a target. Therefore, the target sample size per treatment group is set at 100 subjects in total for 3 regions.
[Rationale for the sample size for the reference group]
The target sample size for the reference group was set at 200 subjects, considering the followings:
o Incidence rates for serious infections from post marketing studies for approved biologic drugs: approximately 1.0% to 3.6% reported in post-marketing all-case surveillance [ACTEMRA®, drip infusion, 80 mg, 200 mg, 400 mg, final reports for all patients ] [ORENCIA®, drip infusion, 250 mg, information for appropriate drug usage] [HYUMIRA®, sc, 40 mg, Syringe 0.8 mL, information for appropriate drug usage]; andapproximately 2.4% in the 5 mg group and approximately 1.5% in the Adalimumab group, as revealed by pooled analysis of the phase III tofacitinib study [XELJANZ®,tablet, 5 mg, CTD (2013)]
o Operational feasibility
Setting the sample size of reference group as 200, it can be detectable at least 1 subject with 95% confidence probability for AE which occurs at 1.5% incidence rate.

Sponsor: Astellas Pharma Inc. SAP Final VersionISN/Protocol 015K-CL-RAJ3
19-Jan-2018 Astellas Page 17 of 108
5 ANALYSIS SETS
In accordance with International Conference on Harmonization (ICH) recommendations in guidelines E3 and E9, the following analysis sets will be used for the analyses. FAS will be the primary data set for efficacy analyses.
5.1 Full Analysis Set (FAS)
FAS will consist of all subjects who are randomized and receive at least 1 dose of the study drug or reference drug. This will be the primary data set for efficacy analyses.
5.2 Per Protocol Set (PPS)
PPS includes all subjects of FAS who meet the following criteria. PPS is defined based on the data up to Week 12.
● Have no violation of inclusion criteria;● Do not meet any exclusion criteria possibly interfering with the efficacy evaluation;● Receive study or reference treatment for 8 weeks (56 days) or longer from the
initiation of treatment to Week 12* (those who have discontinued the study drug or reference drug due to the lack of efficacy should be included in PPS);
● Have study or reference treatment compliance of 75% or higher for 12 weeks after treatment;
● Have evaluable primary efficacy variables; and● Have no major protocol violations after registration.
Subjects who are considered to have no impact on the efficacy evaluation at the Case Review Meeting will also be included in PPS, if they are not satisfying these criteria.
*: The duration of treatment with the study drug will be calculated by subtracting the first day of study drug treatment from the date of treatment completion plus 1 day, and the duration of treatment with the reference drug will be calculated by subtracting the first day of reference drug treatment from the date of treatment completion plus 8 days.
5.3 Safety Analysis Set (SAF)
SAF is defined as all subjects who received at least 1 dose of the study drug or reference drug.
5.4 Pharmacokinetic Analysis Set (PKAS)
PKAS will consist of all subjects who receive at least 1 dose of the study drug and who provide samples for drug concentrations for at least 1 time point.

Sponsor: Astellas Pharma Inc. SAP Final VersionISN/Protocol 015K-CL-RAJ3
19-Jan-2018 Astellas Page 18 of 108
5.5 Pharmacodynamic Analysis Set (PDAS)
All subjects who receive at least 1 dose of the study drug or 1 injection of the reference drug and who provide samples for the determination of pharmacodynamic parameters at least 1time point will be included in PDAS.
6 ANALYSIS VARIABLES
6.1 Efficacy Endpoints
6.1.1 Primary Efficacy Endpoints
● ACR20 response rate at Week 12 or early termination (Week 12/ET)
DefinitionsACR20 response rate at Week 12 or early termination (Week 12/ET)
It is defined as percentage of subjects achieving ACR 20 response at Week 12/ET, based on C-reactive protein (CRP). ACR20 is a binary variable, with levels responder and non-responder.
Responder :
A subject will be defined as an ACR20-CRP responder at any time point (e.g. Week 12/ET) if the subject meet ALL the following American College of Rheumatology (ACR) response criteria:
● At least 20% reduction from baseline at the time point (e.g. Week 12/ET) in the number of 68 tender joint count (TJC-68)
AND
● At least 20% reduction from baseline at the time point (e.g. Week 12/ET) in the number of 66 swollen joint count (SJC-66)
AND
● At least 20% reduction from baseline at the time point (e.g. Week 12/ET) in ANY 3 or more of the 5 following ACR components ○ Subject’s global assessment of arthritis pain (SGAP) (assessed using a 100 mm VAS
; score of 0 indicates no pain, and score of 100 indicates very severe pain)○ Subject’s global assessment of arthritis (SGA) (assessed using a 100 mm VAS;
score of 0 indicates no disease activity, and score of 100 mm indicates very severe disease activity)
○ Physician’s global assessment of arthritis (PGA) (assessed using a 100 mm VAS;score of 0 indicates no disease activity, and score of 100 mm indicates very severe disease activity)

Sponsor: Astellas Pharma Inc. SAP Final VersionISN/Protocol 015K-CL-RAJ3
19-Jan-2018 Astellas Page 19 of 108
○ Health Assessment Questionnaire – Disease Index (HAQ-DI; score ranges from 0 to 3 with higher scores indicating greater disability)
○ CRP (Higher values indicate greater inflammation)
Baseline is defined in Section 7.11.4. A negative percent change indicates a reduction from baseline (i.e., a favorable outcome). If the baseline value is 0 in some of ACR components, then that component is regarded as non-responder at that component and used for ACR calculation. The handling of missing data in ACR components is described at Section 7.11.2.
Non-responder: A subject will be defined as an ACR20-CRP non-responder at the time point(e.g. Week 12/ET), if the subject does not meet the ACR20-CRP responder criteria.
6.1.2 Secondary Efficacy Variables
6.1.2.1 Categorical Variables
Categorical efficacy variables are:
● Percentage of subjects achieving ACR 20/50/70-CRP response at each analysis visit (except ACR20 Week 12/ET)
● Percentage of subjects achieving ACR 20/50/70-ESR response at Week 12/ET
Note: ACR 20-ESR response is similar to definition in 6.1.1 by replacing CRP with ESR.
● Percentage of subjects achieving ACR20-CRP response at Week 4 and sustaining the response at Weeks 8 and 12
● Percentage of subjects achieving ACR20-CRP response at Week 8 and sustaining the response at Week 12
Calculation DAS-CRP/ESR response:
DAS-CRP/ESR response is consist of following parameters, and calculated according to below description.
o TJC (28 joints)o SJC (28 joints)o CRP or ESRo SGA
[When CRP is used]DAS28 = 0.56√(TJC) + 0.28√(SJC) + 0.36 ln (CRP + 1) + 0.014 × SGA + 0.96
[When ESR is used]DAS28 = 0.56√(TJC) + 0.28√(SJC) + 0.70 ln ESR + 0.014 × SGA

Sponsor: Astellas Pharma Inc. SAP Final VersionISN/Protocol 015K-CL-RAJ3
19-Jan-2018 Astellas Page 20 of 108
Note: CRP values measured in mg/dL will be converted to mg/L for analysis purposes as: value in mg/L = value in mg/dL × 10; SGA is measured on 100 mm VAS. If any component is a missing value, then DAS28-CRP/ESR will be a missing value. If ESR is 0 then DAS28-ESR is missing.
● Percentage of subjects achieving DAS28-CRP score <2.6 at each analysis visit● Percentage of subjects achieving DAS28-ESR score <2.6 at each analysis visit● Percentage of subjects achieving DAS28-CRP score <=3.2 at each analysis visit● Percentage of subjects achieving DAS28-ESR score <=3.2 at each analysis visit
Table 2 Definition EULAR
DAS28 after treatmentDAS28 improvement (DAS28 before treatment - DAS28 after treatment)
> 1.2 > 0.6 and ≤ 1.2 ≤ 0.6≤ 3.2 Good response Moderate response No response
> 3.2 and ≤ 5.1 Moderate response Moderate response No response> 5.1 Moderate response No response No response
Note: If DAS28 score is missing at baseline, then post-baseline DAS28 improvement score will not be calculated and DAS28 EULAR response will be a missing value.
● Percentage of subjects in DAS28-CRP EULAR response criterion of "Good Response"at each analysis visit
● Percentage of subjects in DAS28-ESR EULAR response criterion of "Good Response"at each analysis visit
● Percentage of subjects in DAS28-CRP EULAR response criterion of "Good Response"or "Moderate Response" at each analysis visit
● Percentage of subjects in DAS28-ESR EULAR response criterion of "Good Response"or "Moderate Response" at each analysis visit
● Percentage of subjects achieving ACR/EULAR score for remission at each analysis visitIf all of the following 4 parameters are fulfilled, it is defined as remission:
o TJC (68 joints) <= 1o SJC (66 joints) <= 1o CRP <= 1 mg/dLo SGA <= 1 cm (on a VAS of 0-100 mm).
Note: All 4 conditions must be fulfilled to be in remission. If any component is a missing value, then ACR/EULAR score for remission will be a missing value.
● Percentage of subjects with a SDAI score of =< 3.3 at each analysis visitSDAI score is consist of following parameters, and calculated according to belowdescription.o TJC (28 joints)o SJC (28 joints)o SGA (0-10 cm VAS)

Sponsor: Astellas Pharma Inc. SAP Final VersionISN/Protocol 015K-CL-RAJ3
19-Jan-2018 Astellas Page 21 of 108
o PGA (0-10 cm VAS)o CRP (mg/dL)
SDAI = TJC +SJC +SGA +PGA + CRP
Note: If any component is a missing value, then SDAI score will be a missing value. Percentage of subjects achieving HAQ-DI (<= 0.5) at each analysis visit
● Percentage of subjects with a CDAI score of <= 2.8 at each analysis visitCDAI score is consist of following parameters, and calculated according to belowdescription.o TJC (28 joints)o SJC (28 joints)o SGA (0-10 cm VAS)o PGA (0-10 cm VAS)
CDAI = TJC +SJC +SGA +PGA
Note: If any component is a missing value, then CDAI score will be a missing value.● Percentage of subjects achieving HAQ-DI (<=0.5) at each analysis visit● Percentage of subjects achieving decrease of baseline HAQ-DI of at least 0.22 at each
analysis visit● Percentage of subjects achieving SF-36v2 of difference >= 5 at each analysis visit
6.1.2.2 Continuous Variables
Continuous efficacy variables are:
● Raw value and change from baseline in the following assessments:o TJC (68 joints)o SJC (66 joints)o CRP o ESR o SGAP (VAS) (100 mm VAS)o SGA (VAS) (100 mm VAS)o PGA (VAS) (100 mm VAS)o HAQ-DI (See Section 10.5 Appendix 5: Computation of HAQ-DI Score)o DAS28-CRP scoreo DAS28-ESR scoreo SF-36v2®o SDAI score o CDAI scoreo WPAI score (See Section 10.7 Appendix 7: Computation of WPAI Scale Score)

Sponsor: Astellas Pharma Inc. SAP Final VersionISN/Protocol 015K-CL-RAJ3
19-Jan-2018 Astellas Page 22 of 108
6.1.2.3 Time to Event Variables
o Time to the first ACR20-CRP response up to Week 12o Time to the first ACR50-CRP response up to Week 12o Time to the first ACR70-CRP response up to Week 12o Time to the first occurrence of DAS28-CRP < 2.6 up to Week 12o Time to the first occurrence of SDAI score <= 3.3 up to Week 12o Time to the first occurrence of CDAI score <= 2.8 up to Week 12o Time to the first occurrence of ACR/EULAR score for remission up to Week 12
6.2 Safety Variables
● AEs● Vital signs (body temperature, pulse rate and blood pressure in sitting position)● Body weight● 12-lead ECG● Central ECG● Chest radiography● Laboratory assessments
Treatment emergent adverse events (TEAEs) will be defined as any adverse event that started or worsened in severity after initial dose of study drug or reference drug throughWeek52 or Withdrawal.
AE for the subjects who switched ASP015K 100 mg or ASP150 mg from Placebo at Week 12 will be handled as follows:
● AE onset before the first dose of week12 study drug will be considered to be occurred at Placebo.
● AE onset after the first dose of week12 study drug will be considered to be occurred at ASP015K 100 mg or 150 mg, which is switched treatment from Placebo.
A drug-related TEAE is defined as any TEAE with possible, probable or missing relationship to study drug or reference drug as assessed by the investigator.
Moreover, any TEAE with missing relationship to study drug or reference drug was counted as drug related (probable).
6.3 Pharmacokinetic Variables
Refer to PK analysis plan.
6.4 Pharmacodynamic Variables
● Change from baseline in MMP-3 level

Sponsor: Astellas Pharma Inc. SAP Final VersionISN/Protocol 015K-CL-RAJ3
19-Jan-2018 Astellas Page 23 of 108
● Change from baseline in vascular endothelial growth factor (VEGF) level● Change from baseline for following variables in lymphocyte subset assays
1. Japan
○ CD3+/Lymphocytes (%), CD3+ (cells/uL)
○ CD8+/Lymphocytes (%), CD8+ (cells/uL)
○ CD4+/Lymphocytes (%), CD4+ (cells/uL)
○ CD19+/Lymphocytes (%), CD19+ (cells/uL)
○ CD4/CD8 Ratio
○ (CD16 or CD56)+/Lymphocytes (%), (CD16 or CD56)+ (cells/uL)
○ (CD16+ and CD56+)/CD3- (%), CD16+ and CD56+ (cells/uL)
○ (CD16- and CD56+)/CD3- (%), CD16- and CD56+ (cells/uL)
○ (CD16+ and CD56-)/CD3- (%), CD16+ and CD56- (cells/uL)
○ (CD16- and CD56-)/CD3- (%), CD16- and CD56- (cells/uL)
○ CD56 bright/CD3- (%), CD56 bright (cells/uL)
○ CD56 dim/CD3- (%), CD56 dim (cells/uL)
2. Korea
○ CD3+/Lymphocytes (%), CD3 (cells/uL)
○ (CD3+ and CD8+)/CD3+ (%), CD3+ and CD8+ (cells/uL)
○ (CD3+ and CD4+)/CD3+ (%), CD3+ and CD4+ (cells/uL)
○ (CD16 or CD56)+/CD3- (%), (CD16 or CD56)+ (cells/uL)
○ CD19+/CD3- (%), CD19+ (cells/uL)
○ CD4/CD8 Ratio
○ (CD16+ and CD56+)/CD3- (%), CD16+ and CD56+ (cells/uL)
○ (CD16- and CD56+)/CD3- (%), CD16- and CD56+ (cells/uL)
○ (CD16+ and CD56-)/CD3- (%), CD16+ and CD56- (cells/uL)
○ (CD16- and CD56-)/CD3- (%), CD16- and CD56- (cells/uL)
3. Taiwan
○ CD3+/Lymphocytes (%), CD3 (cells/uL)
○ (CD3+ and CD8+)/Lymphocytes (%), CD3+ and CD8+ (cells/uL)
○ (CD3+ and CD4+)/Lymphocytes (%), CD3+ and CD4+ (cells/uL)
○ (CD16 or CD56)+/Lymphocytes (%), (CD16 or CD56)+ (cells/uL)

Sponsor: Astellas Pharma Inc. SAP Final VersionISN/Protocol 015K-CL-RAJ3
19-Jan-2018 Astellas Page 24 of 108
○ CD19+/Lymphocytes (%), CD19+ (cells/uL)
○ CD4/CD8 Ratio
○ (CD16+ and CD56+)/Lymphocytes (%), CD16+ and CD56+ (cells/uL)
○ (CD16- and CD56+)/Lymphocytes (%), CD16- and CD56+ (cells/uL)
○ (CD16+ and CD56-)/Lymphocytes (%), CD16+ and CD56- (cells/uL)
○ (CD16- and CD56-)/Lymphocytes (%), CD16- and CD56- (cells/uL)
6.5 Other Variables
● Duration of RA (years), calculated as: (Date of Baseline visit – Onset Date of RA +1) / 365.25, and then rounded to one decimal place. The onset date of RA doesn’t have the day (e.g., 2013-03), therefore the first day of the month will be used (2013-03-01). Missing onset date of RA will be imputed. For example, if month is missing (e.g., 2013), then the first day of January will be used (2013-01-01).
● Age at onset of RA (years), calculated as: (date of onset of RA – date of birth +1) / 365.25. Missing date of onset of RA will be handled in the same way as described above.
● Duration of exposure (days)Duration of exposure will be calculated in days, using the following formula:(‘Date of Last Dose of Study Drug or Reference Drug’* - ‘Date of First Dose of Study Drug or Reference Drug’**) + 1***
* = Max(EX1ENDT, EX2ENDT) [Study Drug and Reference Drug_Dosing-page of the CRF]** = EX1STDT [Study Drug and Reference Drug_Dosing -page of the CRF]*** 8 for the Subjects who receive the reference drug
● Overall treatment compliance (during overall treatment period) (%)In the study, the subjects in the study drug group will be instructed to take 2 tablets once per day, totaling a daily dose of study dose. Therefore, overall treatment compliance will be based on number of tablets and calculated as follows:
Treatment compliance in the study drug group (%) =
[Total number of tablets actually received in the treatment period]
--------------------------------------------------------------------------------------------x 100[Total number of tablets planned to receive in the treatment period]
where total number of tablets planned to receive in the treatment period = 2 × number of days the subject was in the treatment period (the previous date of Week 52 visit [for completed subjects] / date of withdrawal date [for discontinued subjects] – date of first dose of study drug +1), and total number of tablets actually received in the treatment

Sponsor: Astellas Pharma Inc. SAP Final VersionISN/Protocol 015K-CL-RAJ3
19-Jan-2018 Astellas Page 25 of 108
period will be calculated as:(total number of tablets dispensed) – (total number of tablets returned) – (total number of tablets lost).
For the subjects in the reference group, the subjects will receive the reference drug once weekly. Therefore, overall treatment compliance will be based on number of syringes and calculated as follows:
Treatment compliance in the reference group (%) =
[Total number of syringes actually received in the treatment period]
--------------------------------------------------------------------------------------------x 100[Total number of syringes planned to receive in the treatment period]
where total number of syringes planned to receive in the treatment period =
○ For complete subjects: 1/7 × (the date of Week 52 visit* [for completed subjects]– the date of first dose of reference drug + 1)
* Week 52 visit is regarded as the final dose at Week 51 + 7
○ For discontinued subjects: 1/7 × (date of withdrawal date [for discontinued subjects] – date of first dose of reference drug + 8)
and then rounded down to integer number, and total number of syringes actually received in the treatment period will be calculated as:(total number of syringes dispensed) – (total number of syringes returned) – (total number of syringes lost).
● Treatment compliance during the 12 weeks of study (up to Weeks 12)Treatment compliance in the study drug group (%) =
[Total number of tablets actually received up to Weeks 12]
--------------------------------------------------------------------------------------------x 100[Total number of tablets planned to receive up to Weeks 12]
where total number of tablets planned to receive up to Weeks 12 = 2 × number of days the subject was during 12 weeks (the previous date of Week 12 visit [for completed Week 12 subjects] / date of withdrawal date [for discontinued before Week 12 subjects]– date of first dose of study drug +1), and total number of tablets actually received up to Weeks 12 will be calculated as:(total number of tablets dispensed up to Weeks 12) – (total number of tablets returnedup to Weeks 12) – (total number of tablets lost up to Weeks12).
Treatment compliance in the reference group (%) =
[Total number of syringes actually received up to Weeks 12]

Sponsor: Astellas Pharma Inc. SAP Final VersionISN/Protocol 015K-CL-RAJ3
19-Jan-2018 Astellas Page 26 of 108
--------------------------------------------------------------------------------------------x 100[Total number of syringes planned to receive up to Weeks 12]
where total number of syringes planned to receive up to Weeks 12 =
○ For complete subjects: 1/7 × (the date of Week 12 visit* [for completed subjects]– the date of first dose of reference drug + 1)
* Week 12 visit is regarded as the final dose at Week 11 + 7
○ For discontinued subjects: 1/7 × (date of withdrawal date [for discontinued subjects] – date of first dose of reference drug + 8)
and then rounded down to integer number, and total number of syringes actually received up to Weeks 12 will be calculated as:(total number of syringes dispensed up to Weeks 12) – (total number of syringesreturned up to Weeks 12) – (total number of syringes lost up to Weeks 12).
● Number of prior DMARD biologics, calculated as number of unique kinds of DMARD biologics prior to initial dose from following CRF page. [Concomitant Medication 2B -page of the CRF][Biologic DMARD -page of the CRF]
● Prior Biologic DMARD-IRFor the subject whose "Reactivity" checkbox [Biologic DMARD -page of the CRF] is selected as "Inadequate Response" or "Unknown", "Prior Biologic DMARD-IR" is regarded as "Yes", Otherwise "No".
7 STATISTICAL METHODOLOGY
7.1 General Considerations
● For continuous variables, descriptive statistics will include the number of subjects (n), mean, standard deviation (SD), median, minimum, and maximum.
● For categorical variables: number and percentages of subjects will be described.● For time-to-event variables: number and percentage of subjects with the event using
Kaplan-Meier method, the cumulative event rate will be estimated and a plot will be constructed.
● All data processing, summarization, and analyses will be performed using SAS Drug Development (ver. 4.5), and PC-SAS (ver. 9.4) or higher versions.
● Specifications for table, figures, and data listing formats can be found in the TLF specifications for this study.
● For the definition of subgroups of interest can be referred to Section 7.8.● Summaries based on FAS and PPS (e.g. disposition, baseline and efficacy data) will be
presented by treatment groups, unless specifically stated otherwise. Safety analysis and other summaries based on SAF will also be presented by treatment groups.

Sponsor: Astellas Pharma Inc. SAP Final VersionISN/Protocol 015K-CL-RAJ3
19-Jan-2018 Astellas Page 27 of 108
● Initial Randomization Set of efficacy analyses are those of the efficacy data up to Week 12 and include the primary analysis (ACR20 at Week 12/ET) as described 7.4.1.1. This set will be analyzed by the initially treated groups (ASP015K 100 mg, ASP015K 150 mg, Placebo and Reference group) and statistical testing will be performed for ASP015K 100 mg, and 150 mg, compared with Placebo.
Table 3 Initial Randomization SetInitial Randomization
Arm CodeInitial Randomization
LabelAnalysis Scope
PLACEBO Placebo
Screening,Week 0 to Week 12,
Week 12/ET
100MG 100 mg
150MG 150 mg
ETANERCEPT Etanercept
● Treatment Sequence Set of analyses are those of the data up to Week 52. Taking into consideration a switch from placebo to active treatment at Week 12, this set will be analyzed by following groups defined below. The two types of "Placebo to ASP015K xxmg at Week 12" groups are not for primary objective and are conducted optionally for efficacy and safety analyses.
Table 4 Treatment Sequence SetTreatment Sequence
CodeTreatment Sequence
LabelWeek0- Week12 Week 12- Week
52Analysis Scope
SEQ1 100mg ASP015K 100 mg ASP015K 100 mg Screening, Week 0 to
Week 52, EOTSEQ2 150mg ASP015K 150 mg ASP015K 150 mg
SEQ3 Placebo to 100mg at Week 12
Placebo ASP015K 100 mg
SEQ4 Placebo to 150mg at Week 12
Placebo ASP015K 150 mg
SEQ5 Etanercept Etanercept Etanercept
○ 100 mg: subjects who initially treated as ASP015K 100 mg Group○ 150 mg: subjects who initially treated as ASP015K 150 mg Group○ Placebo to 100 mg at Week 12: subjects who initially treated as Placebo group and
switched ASP015K 100 mg at Week 12 and at least one dose of ASP015K 100 mgdrug after switched
○ Placebo to 150 mg at Week 12: subjects who initially treated as Placebo group and switched ASP015K 150 mg at Week 12 and at least one dose of ASP015K 150 mgdrug after switched
○ Etanercept: subjects who initially treated as Etanercept Group
● MedDRA11.1 will be used as the coding dictionary for adverse event and medical history.

Sponsor: Astellas Pharma Inc. SAP Final VersionISN/Protocol 015K-CL-RAJ3
19-Jan-2018 Astellas Page 28 of 108
● Statistical hypothesis testing will be performed only if specified. All statistical comparisons of treatment groups will be versus placebo (i.e., each ASP015K treatment versus placebo) and will be made using two sided tests at the 0.05 significance level, unless stated otherwise. Multiplicity adjustment will be done in the primary analysis and other analysis if specified.
● Statistical analysis including hypothesis testing for efficacy variables to compare ASP015K 100 mg or ASP015K 150 mg versus Placebo, only the data for the pairwise comparison will be used.
● All statistical results will be presented, as appropriate, by treatment group, by treatment group and scheduled visit; the schedule of assessments is provided in Section 7.11.5-7.
● Demographics and other baseline characteristics will be provided for all ASP015K treatment groups combined ("100 mg + 150 mg") and for all treatment groups, including placebo and reference group, combined ("Total"). Efficacy presentations will not contain combined treatment groups. In study drug exposure, pharmacodynamics and safetypresentations, "Total except for Etanercept" will be used in place of "Total".
● Chi-square test is continuity corrected in all analysis.● Confidence interval for binary outcome is continuity corrected in all analysis.● Baseline for safety is defined as last non-missing value before the first dose of study
drug or reference drug for all subjects including placebo or reference group assigned subjects.
● The values below the lower limit of quantitation (BQL) for β-D-glucan, hCG, Troponin, CK-MB will be treated as it is and these variables are not used for descriptive statistics and displayed in the listings. As for β-D-glucan, it is used for shift-from baseline analysis.
● CRP (mg/dL) is below measurement (i.e. <0.01 mg/dL) then CRP is regarded as 0.01 U/ml, and used for the calculation of DAS28-CRP, etc. and categorized in <1.0 mg/dL.
● Baseline for efficacy is defined as value at Day1 before the first dose of study drug or reference drug for all subjects including placebo or reference group assigned subjects.
● Change from baseline to post-baseline will be calculated as: post-baseline value -baseline value. If the baseline value is missing, then that subject is not included in the calculation at any visit.
● Percent change from baseline to post-baseline will be calculated as: 100 × (change/baseline). If the baseline value is 0 or missing, or post-baseline value is missing, then percent change from baseline to post-baseline is missing.
● If onset date of AE is Unknown, then missing onset date of AE will be imputed as following steps. 1. If only the day of the month is missing (e.g., 2013-03), then the first day of the
month will be used (2013-03-01), 2. If both day and month are missing (e.g., 2013), then the first day of January will be
used (2013-01-01).3. If imputed onset date of AE is earlier than the first date of study drug, then the onset
date of AE is onset at the first date of study drug, because AE data in CRF is collected only after the first date of study drug.

Sponsor: Astellas Pharma Inc. SAP Final VersionISN/Protocol 015K-CL-RAJ3
19-Jan-2018 Astellas Page 29 of 108
● If the start date of concomitant medication is Unknown, then the missing date will be imputed as following steps. 1. If only the day of the month is missing (e.g., 2013-03), then the first day of the
month will be used (2013-03-01), 2. If both day and month are missing (e.g., 2013), then the first day of January will be
used (2013-01-01).
● If the end date of concomitant medication is Unknown, then the missing date will be imputed as following steps. 3. If only the day of the month is missing (e.g., 2013-03), then the last day of the
month will be used (2013-03-31), 4. If both day and month are missing (e.g., 2013), then the last day of December will
be used (2013-12-31).
7.2 Study Population
7.2.1 Disposition of Subjects
The following subject data will be summarized and presented with regard to All Subjects with Screening Failure Log and Case Report Form.
● Screened● Screen failed● Randomized
The following subject data will be summarized and presented by Initial Randomization Set and Treatment Sequence Set:
● Subjects randomized and dosed (same as the FAS)● Subjects who prematurely discontinued from the study period during overall period● Subjects who prematurely discontinued from the study period by 4 weeks● Subjects who included/excluded of FAS, PPS, SAF, PKAS, and PDAS
These analyses are also conducted by Study Region and Protocol Version Number (used for confirmation of the Inclusion criteria and the Exclusion criteria).
The following analysis will be conducted for Initial Randomization Set.● For time-to-withdrawal from initial dose up to Day 92: Kaplan-Meier plot will be
constructed.

Sponsor: Astellas Pharma Inc. SAP Final VersionISN/Protocol 015K-CL-RAJ3
19-Jan-2018 Astellas Page 30 of 108
Withdrawal Due to Lack of Efficacy:
In addition to the disposition summaries, the percentage of subject withdrawal due to lack of efficacy as the primary reason for withdrawal will be presented for all groups and compared (each ASP015K dose group versus placebo) using Fisher’s exact test, and the analysis will be based on SAF by Initial Randomization Set. Fisher’s exact p-values (No multiplicity adjustment) will be provided.
The following subject data will be summarized and presented by Initial Randomization Set and Treatment Sequence Set● Subjects who discontinued after starting the study period will be summarized for primary
reason for withdrawal during overall period. This analysis is also conducted by Study Region.
● Subjects who discontinued after starting the study period will be summarized for primary reason for withdrawal by 4 weeks.
● Subjects who were excluded from FAS, PPS, SAF, PKAS, and PDAS will be summarized by reason for exclusion.
7.2.2 Demographic and Other Baseline Characteristics
All demographic and other baseline characteristics (defined below) will be summarized by treatment group. To explore the imbalance among treatment groups (except for reference group) , comparisons with respect to categorical variables (e.g., sex) will be based on chi-squared test (continuity corrected), and comparisons with respect to continuous variables (e.g., BMI) will be based on a one-way ANOVA model with fixed effect for treatment group. All analyses/summaries except for (7.2.2.4) will be based on the SAF and PPS.
If the imbalance of the factors between treatment groups is found(at a two-sided 0.05significance level) and considered to clinically affect the primary variable, an analysis adjusted for the factor will be performed to assess the effect of the primary variable on the primary analysis.
7.2.2.1 Demographics
The following demographic variables will be summarized and presented for each treatment group. This analysis is also conducted by Study Region and Protocol Version Number (used for confirmation of the Inclusion criteria and the Exclusion criteria), but will not conduct to explore imbalance between treatment groups.

Sponsor: Astellas Pharma Inc. SAP Final VersionISN/Protocol 015K-CL-RAJ3
19-Jan-2018 Astellas Page 31 of 108
Table 5. Demographic Variables and Analysis MethodsItem Classification Testing Method
Age (at the time of Informed Consent)
Measurement value one-way ANOVA<65, >= 65 -
Sex Male, Female chi-squared testHeight[Screening] (cm) Measurement value one-way ANOVABody Weight[Screening] (kg) Measurement value one-way ANOVA
<- 40 kg,40 kg <- 60 kg,60 kg <- 80 kg,> 80 kg
-
BMI [Screening] (kg/m2) Measurement value one-way ANOVAComplications No, Yes -Previous Medications No, Yes -Concomitant Medications No, Yes -Concomitant DMARD at Baseline No, Yes chi-squared testConcomitant MTX at Baseline No, Yes chi-squared testConcomitant DMARD at Baseline category
MTX, DMARD except for MTXonly, None
chi-squared test
Concomitant Steroid at Baseline No, Yes chi-squared testPrednisone dose at Baseline (mg/day)
Measurement value one-way ANOVANone, 0 <- 5 mg/day, > 5 mg/day -
Study Region Japan, Korea, Taiwan chi-squared testProtocol Version Number (used for confirmation of the Inclusion criteria and the Exclusion criteria)
<= Version 2.0, >= Version 3.0 chi-squared test
7.2.2.2 Baseline Disease Activity
The following baseline disease activity variables will be summarized by descriptive statistics,and imbalance between treatment groups (except for reference group) will be considered based on a one-way ANOVA model with fixed effect for treatment group. This analysis is also conducted by Study Region and Protocol Version Number (used for confirmation of the Inclusion criteria and the Exclusion criteria), but will not conduct to explore imbalancebetween treatment groups.
○ TJC-68○ TJC-28○ SJC-66○ SJC-28○ SGAP (100 mm VAS)○ SGA (100 mm VAS)○ PGA (100 mm VAS)○ HAQ-DI (scale 0 - 3)○ CRP (mg/dL)

Sponsor: Astellas Pharma Inc. SAP Final VersionISN/Protocol 015K-CL-RAJ3
19-Jan-2018 Astellas Page 32 of 108
○ ESR (mm/hr)○ DAS28-CRP○ DAS28–ESR○ SDAI score ○ CDAI score ○ WPAI○ SF-36V2®
In addition, following baseline efficacy categorical variables will be summarized as well.
○ Baseline CRP (< 1.0, >= 1.0)○ Baseline DAS28-CRP (<= 3.2, 3.2<-5.1, > 5.1)○ Baseline DAS28-ESR (<= 3.2, 3.2<-5.1, > 5.1)
7.2.2.3 RA History
The following RA history variables will be summarized and presented for each treatment group and imbalance between treatment groups (except for reference group) will be tested.This analysis is also conducted by Study Region and Protocol Version Number (used for confirmation of the Inclusion criteria and the Exclusion criteria), but will not conduct to explore imbalance between treatment groups.
Table 6. RA History and Analysis Methods
Item Classification Testing Method
ACR 1991 Revised Criteria for Global Functional Status in RA
Class I, Class II, Class III
chi-squared test
Steinbrocker Classification Stage I, Stage II, Stage III, Stage IV
chi-squared test
Prior Surgical Procedure to Treat RA No, Yes chi-squared test
Duration of RA (years) Measurement value one-way ANOVA
< 5 years, >- 5 years -< 1 year,1 year -<5 years,5 years -< 10 years,>- 10 years
-
Onset Age of RA (years), calculated as: (onset date of RA – date of birth+1) / 365.25
- one-way ANOVA
Prior MTX Use Non-User, User chi-squared test
Maximum Dose(mg/week)
Measurement value -

Sponsor: Astellas Pharma Inc. SAP Final VersionISN/Protocol 015K-CL-RAJ3
19-Jan-2018 Astellas Page 33 of 108
Reactivity Response, Inadequate Response, Unknown
-
Tolerance Intolerance, Tolerance, Unknown
-
MTX Dose at Baseline (mg/week) Measurement value one-way ANOVA
None,0 <- 8 mg/week, 8 <- 12 mg/week, > 12 mg/week
Prior Non-Biologic DMARD Except for MTX
Use Non-User, User chi-squared test
Prior Anti-TNF DMARD Use
Use Non-User, User chi-squared test
Prior Biologic DMARD Use Non-User, User chi-squared test
Reactivity Response, Inadequate Response, Unknown
-
Prior Biologic DMARD-IR No, Yes chi-squared test
Number of Prior Biologic DMARDs 0, 1, 2, >= 3 chi-squared test
Number of Prior DMARDs (including biologics) 0, 1, 2, >= 3 chi-squared test
Prior Adalimumab Use Non-User, User -Reactivity Response , Inadequate
Response, Unknown-
Tolerance Intolerance, Tolerance, Unknown
-
Prior Golimumab Use Non-User, User -Reactivity Response, Inadequate
Response, Unknown-
Tolerance Intolerance, Tolerance, Unknown
-
Prior Infliximab Use Non-User, User -Reactivity Response, Inadequate
Response, Unknown-
Tolerance Intolerance, Tolerance, Unknown
-
Prior Certolizumab Pegol Use Non-User, User -Reactivity Response, Inadequate
Response, Unknown-
Tolerance Intolerance, Tolerance, Unknown
-
Prior Abatacept Use Non-User, User -Reactivity Response, Inadequate -

Sponsor: Astellas Pharma Inc. SAP Final VersionISN/Protocol 015K-CL-RAJ3
19-Jan-2018 Astellas Page 34 of 108
7.2.2.4 Medical History
Medical history will be coded using MedDRA (Version 11.1) and summarized. All summaries will be provided for SAF. This analysis is also conducted by Study Region and Protocol Version Number (used for confirmation of the Inclusion criteria and the Exclusion criteria).
7.2.3 Previous and Concomitant Medications
Previous DMARD medications up to Screening will be summarized as described in 7.2.2.3.
In addition to this, previous and concomitant medications (Non-Biologic DMARD/ Medications except for Non-Biologic DMARD) will be coded using WHODDE(B2) (V2011SEP) and summarized with preferred WHO name, respectively from following CRF page. Concomitant medications are defined as any drug medications after the first dose of study drug or reference drug up to the last dose date of study drug and before the last efficacy evaluation at Week52 or Withdrawal.
[Concomitant Medication 2B -page of the CRF][Concomitant Medication (Non-Biologic DMARD)]Subjects taking the same medication multiple times will be counted once per medication.
All summaries will be provided for SAF. This analysis is also conducted by Study Regionand Protocol Version Number (used for confirmation of the Inclusion criteria and the Exclusion criteria).
Response, UnknownTolerance Intolerance, Tolerance,
Unknown-
Prior Tocilizumab Use Non-User, User -Reactivity Response, Inadequate
Response, Unknown-
Tolerance Intolerance, Tolerance, Unknown
-
Prior Rituximab Use Non-User, User -Reactivity Response, Inadequate
Response, Unknown-
Tolerance Intolerance, Tolerance, Unknown
-
Prior Denosumab Use Non-User, User -Reactivity Response, Inadequate
Response, Unknown-
Tolerance Intolerance, Tolerance, Unknown
-

Sponsor: Astellas Pharma Inc. SAP Final VersionISN/Protocol 015K-CL-RAJ3
19-Jan-2018 Astellas Page 35 of 108
7.3 Study Drugs
7.3.1 Exposure
In this section, following analyses will be conducted and these analyses are also conducted by Study Region and Protocol Version Number (used for confirmation of the Inclusion criteria and the Exclusion criteria).
The following information on drug exposure will be presented for each treatment group for the SAF:
● Number and percent of subject with dose suspensions or interruptions by treatment group.
Duration of exposure will be summarized in two ways.
● Descriptive statistics will be presented by treatment group.● Exposure time up to Week 12 will be categorized according to the following categories
by treatment group:
○ 1 -< 29 days
○ 29 -< 57 days
○ 57 -< 85 days
○ 85 days -
● Exposure time for Overall Period will be categorized according to the following categories by treatment group:
○ 1 -< 85 days
○ 85 -< 197 days
○ 197 -< 281 days
○ 281 -< 365 days
○ 365 days -
Counts and percentages of subjects in each of these categories will be summarized for each treatment group for the SAF.
7.3.2 Treatment Compliance
Overall treatment period compliance, treatment compliance during the 12 weeks of study (up to Weeks 12) with the dosing schedule will be examined for subjects in the SAF whose total study drug or reference drug count and first and last days of treatment are known. These analyses will be summarized in two ways for the SAF:
● Descriptive statistics for overall treatment period will be presented by Treatment Sequence Set (including those initially treated as Placebo group or Reference group).

Sponsor: Astellas Pharma Inc. SAP Final VersionISN/Protocol 015K-CL-RAJ3
19-Jan-2018 Astellas Page 36 of 108
● Descriptive statistics up to Week 12 will be presented by Initial Randomization Set. ● Percent compliance for overall treatment period will be categorized according to the
following categories by treatment group:○ <50%○ 50% -<75% ○ 75% -<90%○ 90% - 100% or greater
● Percent compliance up to Week 12 will be categorized according to the following categories by treatment group:○ <50%○ 50% -<75% ○ 75% -<90%○ 90% - 100% or greater
These analyses are also conducted by Study Region and Protocol Version Number (used for confirmation of the Inclusion criteria and the Exclusion criteria).
For Drug Suspension and Interruption, following will be summarized.
○ Experience For Drug Suspension○ Experience For Drug Interruption○ The Number of Experience Drug Suspension Per Subject○ The Number of Experience Drug Interruption Per Subject
These analyses are also conducted by Study Region and Protocol Version Number (used for confirmation of the Inclusion criteria and the Exclusion criteria).
7.4 Analysis of Efficacy
Efficacy analysis will be conducted on FAS and PPS. The interpretation of results from statistical tests will be based on the FAS. In the primary analysis, the purpose of using PPS is to assess the robustness of the results from the statistical tests based on FAS.
Efficacy analysis up to Week 12 including primary analysis will be performed by Initial Randomization Set. Efficacy analysis up to Week 52 will be performed by Treatment Sequence Set for secondary purpose. Details for analysis groups will be described in 10.1 Appendix1 and 10.2 Appendix2.
7.4.1 Analysis of Primary Endpoint(s)
Summary for analysis of primary endpoints are displayed at Section 10.1 Appendix 1.

Sponsor: Astellas Pharma Inc. SAP Final VersionISN/Protocol 015K-CL-RAJ3
19-Jan-2018 Astellas Page 37 of 108
7.4.1.1 Primary Analysis
Primary analysis will be conducted on FAS. For the ACR20 response at Week 12/ET, pairwise comparisons to placebo will be performed at each ASP015K dose level using logistic regression model with treatment group (Placebo, ASP015K 100 mg, and ASP015K 150 mg) as the factor and the prior biologic-DMARD-IR*, concomitant DMARD at Baselineuse*, and study region (Japan, Korea, and Taiwan) * as the covariates. For multiplicity adjustment in the primary analysis, following closed testing procedure shown below will be done. Only if quasi-complete separation, or complete separation occurs in the logistic model, then the study region, the prior biologic-DMARD-IR, and concomitant DMARD at Baselineuse will be removed from the logistic regression model, one by one, sequentially.
*: The covariate (the prior biologic-DMARD-IR, concomitant DMARD at Baseline use, and study region) will not be included in the logistic regression model when these variables are used as a subgroup factor.
Two null hypotheses will be constructed:
● H01: ACR20-CRP response at Week 12/ET in ASP015K 150 mg is equal to that in
placebo
● H02: ACR20-CRP response at Week 12/ET in ASP015K 100 mg is equal to that in
placebo
The accompanying alternative hypotheses are:
● H11: ACR20-CRP response at Week 12/ET in ASP015K 150 mg is not equal to that in
placebo
● H12: ACR20-CRP response at Week 12/ET in ASP015K 100 mg is not equal to that in
placebo
Step 1.ACR20-CRP response at Week 12/ET: ASP015K 150 mg vs. Placebo
Step 2.ACR20-CRP response at Week 12/ET: ASP015K 100 mg vs. Placebo
The null hypotheses at Step 1 will be tested by Wald test at a two-sided significance level of 0.05.
If it is statistically significant, the next step (Step 2) will be initiated and implemented in the same manner. Otherwise, it is completion of the hypothesis test.
For each comparison, only the data for two treatment groups to be compared will be used.
For the missing data imputation of ACR20-CRP at Week 12/ET, Last Observation Carried Forward (LOCF) methodology will be used.

Sponsor: Astellas Pharma Inc. SAP Final VersionISN/Protocol 015K-CL-RAJ3
19-Jan-2018 Astellas Page 38 of 108
7.4.1.2 Sensitivity Analysis
In order to assess the robustness of findings from the primary efficacy analysis, the following sensitivity analyses will be performed:
● ACR20-CRP response at Week 12/ET using LOCF for components and NRI for response (see Section 7.11.2. for details, no multiplicity adjustment)
● ACR20-CRP response at Week 12/ET using LOCF for components and the PPS as analysis setNote: The FAS will be replaced with the PPS as analysis set, to assess robustness results from FAS. Multiplicity adjustment will be done.
● ACR20-CRP response at Week 12/ET using Observed data (data as collected, no imputation, no multiplicity adjustment)
● ACR20-CRP response at Week 12/ET using multiple imputation, assuming missing at random mechanism (see Section 7.11.2. for details)
● ACR20-CRP response at Week 12/ET using placebo Multiple Imputation (pMI) (see Section 7.11.2. for details)
● Re-randomization testIn order to assess the validity of dynamic allocation, re-randomization test will be conducted, using Monte Carlo sampling in the following equation.
�̂ =1 + ∑ �(|�� − �̅| ≥ |���� − �̅|)�
���
� + 1, �̅ = �
���
�
���
�: ������������������̂:��� − �������������������������: ������������������������: ��������������������������������������������������: �ℎ���������������������������
Based on the equation above, the two-sided Monte Carlo �̂ will be calculated by following steps.1. The entry order of subjects, the 3 allocation factors (sites, prior biologic-DMARD-
IR, concomitant DMARD at Baseline use, and study region), and ACR20-CRPresponse at Week 12/ET are fixed. Then, simulate dynamic allocation which is actually conducted in RAJ3, and continue to all subjects. The random seed is 1001.
2. When getting 1st simulation result, for the ACR20-CRP response at Week 12/ET, the same analysis described in 7.4.1.1 will be conducted using logistic regression model with data getting from step 1, and calculate Z test statistics for 150 mg versus placebo, 100 mg versus placebo.
Z test statistics are defined as follows.
� =���
��(���)
���:�������������ℎ��������������������

Sponsor: Astellas Pharma Inc. SAP Final VersionISN/Protocol 015K-CL-RAJ3
19-Jan-2018 Astellas Page 39 of 108
3. Repeat the simulation process (Stpe1 and 2) up to M times (set as 9999). During individual simulations, if quasi-complete separation , or complete separation occurs, then these results will not be included in the 9999 simulation results, and these result will be replaced with the next results which does not occur quasi-complete separation, nor complete separation. Note that the random seed is used from 1000 + m at mth
simulation.4. When completing M (set as 9999) simulation results, then the two-sided Monte Carlo
�̂ will be calculated.● Sensitivity Analysis of ACR20-CRP response at Week 12/ET using LOCF for
components to assess the impact of HAQ-DI caused by inappropriate description in the local questionnaire in TaiwanNote: In the local questionnaire used in Taiwan (i.e. written in Taiwanese), there was one inappropriate description about "aids or devices" checkbox in Hygiene category in place of "Bathtub bar" (Refer to Section 10.5 Appendix 5). To examine the impact of this inappropriate description, sensitivity analysis of primary analysis will be conducted on the following assumptions.
b Checked "Bathtub bar"at Baseline
Checked "Bathtub bar"at Weeks 4, 8, 12 and Week 12/ET
1 ☑ ☑
2 ☑ □
3 □ ☑
* The Checkbox "Bathtub bar" taken with the inadequate description was inactivated (not checked) including the all data up to Week 12 for all subjects in Taiwan and inactivated (not checked data) Checkbox "Bathtub bar" will be used in the primary analysis (Section 7.4.1.1).
7.4.1.3 Interaction Analysis
Interaction Analysis will be performed in two steps as follows:
Step 1. Logistic regression model (Section 7.4.1.1) including interactions of [the prior biologic-DMARD-IR x treatment group interaction], [concomitant DMARD at Baseline usex treatment group interaction] and [study region x treatment group interaction], separately,will be conducted in order to present the information of significance of interactions.
The interaction term will be assessed at a two-sided significance level of 0.05.
Step 2. If the interaction term described above is significant, odds ratio and the other statistics based on the model including interactions will be evaluated.
7.4.1.4 Subgroup Analysis
In order to evaluate homogeneity of treatment effects across subjects with different demographic and baseline characteristics, subgroup analysis of the primary efficacy variables

Sponsor: Astellas Pharma Inc. SAP Final VersionISN/Protocol 015K-CL-RAJ3
19-Jan-2018 Astellas Page 40 of 108
will be performed, respectively. In addition, logistic regression model described in Section 7.4.1.1 will be performed for each subgroup category and odds ratios, and 95% confidence intervals will be provided for each subgroup. The subgroups in Section 7.8 will be analyzed.As for subgroup analysis, it is not executed any statistical testing. These subgroup analyses will be displayed graphically as Dot-and-Forest plot.
7.4.1.5 Adjustment for imbalances in demographics and other baseline characteristics
As for the variables in which imbalance is present in 7.2.2, adjusted analysis will be performed to evaluate the influence. Logistic model with the variables in which imbalance is present as a covariate added to logistic regression model (Section 7.4.1.1) will be performed.
7.4.1.6 Time to the first response analysis
Time to the first ACR20-CRP response analysis will be analyzed as following procedure.This analysis will be applied during first 12 weeks of treatment period, because placebo treated subjects are switched to ASP015K after Week 12.
● Time to the first response analysis will be analyzed using KM profile plots for each treatment group (including reference group), and stratified log-rank test will be used for comparing each ASP015K dose group time-to-event profile versus placebo. Stratified analyses will use the following 3 stratification factors: the prior biologic-DMARD-IR, concomitant DMARD at Baseline use, and study region (Japan, Korea, and Taiwan). This analysis will be applied up to Week 12.
● For each subject, time to the first event (days) will be defined as the number of days from the date of initial dose of study drug or reference drug to the date the first occurrence of the event, and calculated as: date of the first occurrence of the event (most recent assessment among each components if the assessment date is different among each components) – date of initial dose of study drug or reference drug +1. In addition to this, Cox proportional hazards model with a main effect for treatment group (Placebo, ASP015K 100 mg, and ASP015K 150 mg) and the prior biologic-DMARD-IR, concomitant DMARD at Baseline use, and study region (Japan, Korea, and Taiwan) as the covariates will be used comparing each ASP015K dose group versus placebo (except for reference group).
● Subjects who complete the treatment period through Week 12 without having the event will be censored at one day before the dosing at Week 12 day up to Day 92, and the censored time will be calculated as: one day before the dosing at Week 12 day up to Day 92 – date of initial dose of study drug or reference drug +1.
● In the time to response analysis, each subject will be classified as either a responder (event = 1 in time-to-event model) or a non-responder (event = 0 in time-to-event model), based on the definition in Section 6.1.1. The definition of event is the same as the definition of the binary response.

Sponsor: Astellas Pharma Inc. SAP Final VersionISN/Protocol 015K-CL-RAJ3
19-Jan-2018 Astellas Page 41 of 108
● Subjects who prematurely discontinued the treatment period through Week 12 (i.e. before the dosing at Week 12) without having the event up to Day 92 will be censored at the date of early discontinuation, and the censored time will be calculated as: date of early discontinuation from the treatment period up to Day 92 – date of initial dose of study drug or reference drug +1.
7.4.1.7 Analysis for Japanese subjects
The same analysis as the primary analysis (Section 7.4.1.1) will be conducted for Japanese subjects.
7.4.2 Analysis of Secondary Endpoints
Refer to Section 10.2 Appendix 2. They includes categorical, continuous, and time-to-event variables, with "X" indicating that the variable will be analyzed. As for secondary variables, no multiplicity adjustment will be done. Basically, analysis of secondary endpoints will be performed by Initial Randomization Set and Treatment Sequence Set defined at Secrion7.1.
The secondary variables and analyses are as follows:
<Initial Randomization Set>
● Categorical variables at each visit (including Baseline, Weeks 4, 8, 12, 12/ET) will be analyzed using logistic regression model, as described for the primary efficacy variable, unless otherwise specified in Section10.2 Appendix 2.
● For continuous variables, raw value and change from baseline variables at each visit (Baseline, Weeks 4, 8, 12, 12/ET) will be analyzed using the ANCOVA model with treatment group (Placebo, ASP015K 100 mg, and ASP015K 150 mg) as the factor, and the prior biologic-DMARD-IR, concomitant DMARD at Baseline use, study region (Japan, Korea, and Taiwan), and baseline value as the covariates. In addition to this, sensitivity analysis to assess the impact of HAQ-DI caused by inappropriate description in the local questionnaire in Taiwan will be conducted similarly as described in 7.4.1.2.
● Time to the first response analysis will be analyzed similarly as described in 7.4.1.5.o ACR50-CRPo ACR70-CRPo DAS28-CRP <2.6o SDAI score <= 3.3o CDAI score <= 2.8o ACR/EULAR score for remission
As for DAS28-CRP< 2.6, SDAI score <= 3.3, CDAI score <= 2.8, ACR/EULAR score for remission, if the event is occurred at baseline, then that subject is excluded from this analysis.
● Graphical analysis (including Baseline, Weeks 4, 8, 12, 12/ET).

Sponsor: Astellas Pharma Inc. SAP Final VersionISN/Protocol 015K-CL-RAJ3
19-Jan-2018 Astellas Page 42 of 108
○ ACR20/50/70-CRP will be plotted for over time. ○ The mean-standard deviation plot of actual values and changes from baseline will be
presented for DAS28-CRP and DAS28-ESR.○ To visually explore possible relationships between ACR20-CRP and DAS28-CRP, 2-
panel line graphs of DAS28-CRP over time will be plotted for ACR20-CRP responders (in 1 panel) and non-responders (in another panel). Similar graphs will be provided for DAS28-ESR.
<Treatment Sequence Set>
● Categorical variables at each visit (including Baseline, Weeks 4, 8, 12, 16, 20, 24, 28, 32, 36, 40, 44, 48, 52, EOT) will be summarized as described in Section10.2 Appendix 2.
● For continuous variables, raw value and change from baseline variables at each visit (including Baseline, Weeks 4, 8, 12, 16, 20, 24, 28, 32, 36, 40, 44, 48, 52, EOT) will be summarized by descriptive statistics. Details are described in Section10.2 Appendix 2.
● Graphical analysis(including Baseline, Weeks 4, 8, 12, 16, 20, 24, 28, 32, 36, 40, 44, 48, 52, EOT). ○ ACR20/50/70-CRP will be plotted for over time. ○ The mean-standard deviation plot of actual values and changes from baseline will be
presented for DAS28-CRP and DAS28-ESR.
7.5 Analysis of Safety
In general, For AE Analysis up to Week 12 will be performed by Initial Randomization Set in SAF. AE Analysis from "Week 12 to Week 52 or Later" will be performed by Treatment Sequence Set in SAF. AE 100 Patient-Years analysis will be performed by Groups for Patient-Years. Details for analysis groups will be described in 10.3 Appendix3.
For other safety analysis except for AE up to Week 12 will be performed by Initial Randomization Set in SAF. For other safety analysis except for AE up to Week 52 will be performed by Treatment Sequence Set in SAF. Details for analysis groups will be described in 10.4 Appendix4.
7.5.1 Adverse Events
If an AE occurs on the same date as the initial dose date, the subject will be asked to select one of the following (see the eCRF page for AE): onset before initial dose of study drug or reference drug, onset after initial dose of study drug or reference drug. Any AEs occurring after initial dose of study drug or reference drug through the follow-up period will be considered treatment emergent.

Sponsor: Astellas Pharma Inc. SAP Final VersionISN/Protocol 015K-CL-RAJ3
19-Jan-2018 Astellas Page 43 of 108
Adverse events will be coded using the Medical Dictionary for Regulatory Activities (MedDRA).
All adverse events reported during the study period will be presented in subject listings.
Only TEAEs in the study period will be analyzed, and 2 types of analyses will be performed: TEAE occurrence analysis and TEAE per 100 patient-years analysis, as described below.TEAE occurrence analysis will be displayed by whole treatment period and by the following period. Primarily, TEAE occurrence analysis for Week 0 to Week 12 will be conducted in the view of comparison with placebo.
TEAE occurrence analysis for overall treatment period will be conducted in focus for ASP015K dose groups and reference group.
1. Week 0 to Week 12
2. Week 12 to Week 52 or Later
TEAE per 100 patient-years analysis will be displayed above category, and by overall period.
7.5.1.1 Adverse events
The coding dictionary for this study will be MedDRA 11.1. It will be used to summarize AEs by SOC and PT. Subjects reporting more than one AE for a given MedDRA PT will be counted only once for that term. Subjects reporting more than one AE within a SOC will be counted only once for the SOC total. Subjects reporting more than one AE will be counted only once in the overall AE total.
SOCs will be presented by descending frequency for 100 mg + 150 mg column, and PTs within SOC will be presented by decreasing frequency in the 100 mg + 150 mg.
Number and percentage of subjects with TEAE in the following AE categories will be summarized by SOC and PT for each treatment group, 100 mg + 150 mg, Total:
An overview table will include the following details:
● Number and percentage of subjects with TEAE● Number and percentage of subjects with drug related TEAE● Number and percentage of subjects with death● Number and percentage of subjects with serious TEAE● Number and percentage of subjects with drug related serious TEAE● Number and percentage of subjects with Grade 3 or Higher in Severity TEAE● Number and percentage of subjects with TEAE leading to permanent discontinuation of
study drug or reference drug● Number and percentage of subjects with drug related TEAE leading to permanent
discontinuation of study drug or reference drug● Number and percentage of subjects with serious TEAE leading to permanent
discontinuation of study drug or reference drug

Sponsor: Astellas Pharma Inc. SAP Final VersionISN/Protocol 015K-CL-RAJ3
19-Jan-2018 Astellas Page 44 of 108
● Number and percentage of subjects with drug related serious TEAE leading to permanent discontinuation of study drug or reference drug
The number and percentage of subjects with TEAEs, as classified by SOC and PT will be summarized for each treatment group. Summaries will be provided for:
● TEAEs● Drug related TEAEs, defined as any TEAE with possible, probable or missing
relationship to study drug or reference drug as assessed by the investigator.Subjects reporting more than one TEAE for a given PT will be counted only once for that term in the most related category reported.
● Serious TEAEs ● Drug related serious TEAEs● TEAEs by severity based on National Cancer Institute Common Terminology Criteria
for Adverse Events (NCI-CTCAE) Grade (Grade 1 = mild, Grade 2 = moderate, Grade 3= severe or medically significant, Grade 4 = life threatening, Grade 5 = death related to AE)Subjects reporting more than one TEAE for a given PT will be counted only once for that term in the most severe category reported. If a subject has an AE which has a missing severity, then the subject will be counted in the severity category of "Missing" (i.e., missing severity will not be imputed).
● Drug related TEAEs by severity● Grade 3 or higher TEAEs by severity● TEAEs by relationship to study drug or reference drug
Subjects reporting more than one TEAE for a given PT will be counted only once for that term in the most related category reported. TEAE with missing relationship to study drug missing will be counted as drug related.Moreover, any TEAE with missing relationship to study drug or reference drug was counted as drug related (probable).
● TEAEs leading to death ● TEAEs leading to permanent discontinuation of study drug or reference drug● Drug related TEAEs leading to permanent discontinuation of study drug or reference
drug● Serious TEAEs leading to permanent discontinuation of study drug or reference drug● Drug related serious TEAEs leading to permanent discontinuation of study drug or
reference drug● TEAEs excluding serious adverse events that equal to or Exceed a threshold of 5% in
Any Treatment Group● Most common TEAEs (> 5% in any treatment group)● Most common serious TEAEs (> 5% in any treatment group)
● The number and percentage of subjects with TEAEs by subgroups defined in Section 7.8.
● The number and percentage of subjects with TEAEs of special interest.

Sponsor: Astellas Pharma Inc. SAP Final VersionISN/Protocol 015K-CL-RAJ3
19-Jan-2018 Astellas Page 45 of 108
Following adverse events of special interest are defined in the Appendix 8:
○ Serious Infections○ Malignancies○ Herpes Zoster Related Disease (Herpes Zoster and Varicella)○ Herpes Zoster○ Varicella○ Infections That Require Intravenous Anti-infectious Therapy
In addition, the subgroup analysis of Sex, Age Group, Concomitant Steroid at Baseline, and Prednisone Dose at Baseline will be conducted.
7.5.1.2 Adverse Events Per 100 Patient-Years
In order to adjust for differences in subjects’ durations in the study and the potential differential dropout rates between the treatment groups, TEAEs per 100 patient-years (PYs)will be calculated for each treatment group as follows:
Definition 1:
TEAEs per 100 PYs = 100 × (Number of subjects who had at least 1 incidence / Total PYs
Total PYs will be calculated by summing individual subjects’ durations.
If subjects had at least 1 predefined AE, then the duration of these subjects are summed as from initial dose up to first incidence of predefined AEs.
If subjects had no predefined AE, then the duration of these subjects are summed as from initial dose through follow-up. Summed duration will be divided by 365.25 to represent per year.
Definition 2:
TEAEs per 100 PYs = 100 × (Number of TEAEs for all subjects in the treatment group / Total PYs in the treatment group).
For number of TEAEs for all subjects in the treatment group, multiple occurrences of the same TEAE in the same subject will be counted multiple times.
Total PYs will be calculated by summing subjects’ durations in study through the follow-up period. Each subject’s duration will be calculated as: (last date of follow-up in the study –date of initial dose of study drug + 1) / 365.25.
Patient-Year analysis will be calculated by Placebo, 100 mg, 150 mg, 100mg+150mg, ASP015K Total, Total.
The number of TEAEs and AEs per 100 PYs will be provided by Definition 2, for all TEAEs (if analyzable), by SOC and PT for each treatment group, ASP015K Total and Total.

Sponsor: Astellas Pharma Inc. SAP Final VersionISN/Protocol 015K-CL-RAJ3
19-Jan-2018 Astellas Page 46 of 108
Patient-Year analysis for following specified AE will also be conducted by Definition 1 with 95% confidence interval.
○ Serious Infections○ Malignancies○ Herpes Zoster Related Disease (Herpes Zoster and Varicella)○ Herpes Zoster○ Varicella○ Infections That Require Intravenous Anti-infectious Therapy
Note: Definition will be provided in the Appendix 8.
Confidence Interval for TEAEs per 100 patient-years will be calculated for AE of special Interest based on following formula (assuming Poisson distribution).
● Upper limit of CI log (TEAEs per 100 PYs) : ��� �log ��
�� + ������ ∗ �
�
��
● Lower limit of CI log (TEAEs per 100 PYs) : ��� �log ��
�� − ������ ∗ �
�
��
A: Number of subjects who had at least 1 incidence
T: Total PYs by 100 PYs as one unit
Z(alpha): alpha % point of standard normal distribution
alpha = 0.025
In addition, the subgroup analysis of Sex, Age Group, Concomitant Steroid at Baseline, and Prednisone Dose at Baseline will be conducted.
7.5.1.3 Subgroup Analyses
In order to assess whether or not AEs vary across specific patient groups, AE occurrence will be summarized by SOC and PT for the subgroups specified in Section 7.8.
7.5.2 Clinical Laboratory Evaluation
All Laboratory Tests
For clinical laboratory parameters (hematology, biochemistry, fasting lipid profile, and urinalysis), raw values at each scheduled visit, change from baseline at each post-baseline visit, shift from baseline and shift from reference range will be summarized using descriptive statistics or frequency tabulations. No statistical hypothesis testing will be performed. For Fasting Lipids Profile, all analysis will be conducted using the measured values which are confirmed under fasting condition. In addition, all Lipid Profile values including non-fasting condition will also be summarized for descriptive statistics.

Sponsor: Astellas Pharma Inc. SAP Final VersionISN/Protocol 015K-CL-RAJ3
19-Jan-2018 Astellas Page 47 of 108
Clinical laboratory test is conducted at central institution at each region (Japan, Korea, Taiwan) in accordance with each procedure and each reagent for clinical test. The possibility of harmonization among each region was conducted before clinical laboratory test was initiated in Korea and Taiwan. If clinical laboratory evaluation could be harmonized, then these measurement data among each region could be regarded as the same scale. If harmonization was reported to be difficult, then clinical test would be summarized by Study Region (Japan, Korea, Taiwan). However, among clinical laboratory tests not-harmonized, for exploratory analysis, Beta-D-glucan, Glucose, HCO3, urine pH, urine gravity will be summarized by whole population. Qualitative Urinalysis test will be summarized by Study Region, only (see 7.8.2 Subgroup analysis for Study Region (Japan, Korea, Taiwan).
○ Clinical laboratory tests harmonized
- All of the hematology test
- Biochemistry test except for Beta-D-glucan, Glucose, HCO3
- All of the fasting lipid profile
- CRP
○ Clinical laboratory tests not-harmonized
- Beta-D-glucan, Glucose, HCO3
- All of the urinalysis test
* For Beta-D-glucan, reference range is not validated throughout the study period and it will be displayed in listing only.
* Pregnancy test, CPK monitoring, Hepatitis test, Hepatitis DNA test are not applicable to harmonization and it will be displayed in listing only.
● For continuous variables, descriptive statistics of raw values at each scheduled visit will be summarized at each time point using SI unit. For the ratio T-Chol to HDL and the ratio LDL to HDL, descriptive statistics will be summarized at each post-baseline visit.
● For continuous variables, descriptive statistics of change from baseline value will be summarized at each post-baseline visit using SI unit.
● Shift-from-baseline table: Shift from baseline baseline to highest value up to Week 12 or during entire period, and baseline to lowest value up to Week 12 or during entire period, for all laboratory variables. If the laboratory value of same subject is measured lower from normal range at one visit, and higher from normal range at the other visit, that subject will be counted as both low and high from baseline up to Week 12 or during entire period.

Sponsor: Astellas Pharma Inc. SAP Final VersionISN/Protocol 015K-CL-RAJ3
19-Jan-2018 Astellas Page 48 of 108
Laboratory Tests for NCI-CTC Toxicity Grading
Laboratory test results for the select laboratory tests will be graded programmatically using the standardized NCI-CTC toxicity grading criteria (Grade 0, 1, 2, 3, 4) specified in the 10.8Appendix8 for this study. Shift-from-baseline to worst value up to Week 12 or during entire period will be provided. Note: AEs in this study are graded the investigator using NCI-CTAE Grade (1, 2, 3, 4, 5).
Laboratory Tests for Reference Range
Test results for the select laboratory tests in Table 7 will be summarized against the reference range indicated. Number and percentage for the Highest/Lowest values of each subject included in pre-specified reference range for select laboratory up to Week 12 or during entire period will be provided.

Sponsor: Astellas Pharma Inc. SAP Final VersionISN/Protocol 015K-CL-RAJ3
19-Jan-2018 Astellas Page 49 of 108
Table 7. Select Laboratory Variables and Corresponding Reference Ranges
Select Laboratory Variable
Reference RangeHighest/Lowest
Aspartate Aminotransferase (AST)
>= 1 × ULN to < 2 × ULN>= 2 × ULN to < 3 × ULN
>= 3 × ULN
Highest
Alanine Aminotransferase (ALT)
>= 1 × ULN to < 2 × ULN>= 2 × ULN to < 3 × ULN
>= 3 × ULN
Highest
Alkaline Phosphatase (ALP)
> 2 × ULN to <= 3 × ULN > 3 × ULN to <= 5 × ULN> 5 × ULN
Highest
Total Bilirubin >1.5× ULN Highest
Total Bilirubin >= 1 × ULN to < 2 × ULN>= 2 × ULN to < 3 × ULN
>= 3 × ULN
Highest
Low-Density Lipoprotein (LDL)
> 160 mg/dLHighest
Low-Density Lipoprotein (LDL)
< 100 mg/dL100 to < 130 mg/dL130 to < 160 mg/dL160 to < 190 mg/dL
>= 190 mg/dL
Highest
Hemoglobin (HGB) >=8.0 to < 10.0 g/dL< 8.0 g/dL
Lowest
Hemoglobin (HGB) >= (Baseline-2) to <(Baseline-1) g/dL<(Baseline-2) g/dL
Lowest
Hemoglobin (HGB) ∙ Mild to Moderate: decrease from baseline >=1 to <=2 g/dL,
∙ Severe: decrease from baseline >2 to <3 g/dL or absolute value >7 and <8 g/dL,
∙ Potentially Life Threatening: decrease from baseline >=3 or absolute value <=7 g/dL
Lowest
Creatine Phosphokinase (CPK)
> 500 to <= 2,000 U/L> 2,000 U/L
Highest
Creatine Phosphokinase (CPK)
> 5 × BaselineHighest
Creatine Phosphokinase (CPK)
> 2× ULN to <= 5 × ULN> 5 × ULN to <= 10 × ULN
> 10 × ULN
Highest

Sponsor: Astellas Pharma Inc. SAP Final VersionISN/Protocol 015K-CL-RAJ3
19-Jan-2018 Astellas Page 50 of 108
Select Laboratory Variable
Reference RangeHighest/Lowest
Creatinine> 1.5 × Baseline to <= 3.0 × Baseline
> 3.0 × Baseline
Highest
Absolute Neutrophil Count (ANC)
>= 1,500 to < 2,000 / mm^3>= 500 to < 1,500 / mm^3
< 500 / mm^3
Lowest
Lymphocytes >= 200 to < 500 /uL< 200 /uL
Lowest
Lymphocytes >= 1,500 to < 2,000 / mm^3>= 500 to < 1,500 / mm^3
< 500 / mm^3
Lowest
Platelets >= 2 × 10^4 to < 5 × 10^4 /uL< 2 × 10^4 /uL
Lowest
Platelets> 600,000 /uL
Highest
ULN = Upper Limit NormalEach categories are mutually exclusive.
7.5.2.1 Liver Abnormalities
The following potentially clinically significant criteria in liver function tests for Alkaline Phosphatase (ALP), Alanine Transaminase (ALT), total bilirubin, Aspartate Transaminase (AST) and their combination are defined. The subject’s highest value during the investigational period will be used.
Parameter Criteria
ALT > 3xULN
> 5xULN
> 10xULN
> 20xULN
AST > 3xULN
> 5xULN
> 10xULN
> 20xULN
ALT or AST > 3xULN
> 8xULN
Total Bilirubin > 2xULN

Sponsor: Astellas Pharma Inc. SAP Final VersionISN/Protocol 015K-CL-RAJ3
19-Jan-2018 Astellas Page 51 of 108
ALP > 1.5xULN
ALT and/or AST OR Total Bilirubin(*) (ALT and/or AST > 3xULN) ortotal bilirubin > 2xULN
ALT and/or AST AND Total Bilirubin(*) (ALT and/or AST > 3xULN) and total bilirubin > 2xULN
(*) Combination of values measured within same sample
The number and percentage of subjects with potentially clinically significant values in liver function tests during the investigational period will be presented by treatment group.
Additionally, confirmed liver abnormities will be characterized as moderate and marked, as follow:
Moderate: ALT or AST > 3×ULN OR Total Bilirubin > 2×ULN.
Marked: ALT or AST > 3×ULN AND Total Bilirubin > 2×ULN.
Number and percentage of subjects in each category at each scheduled visit will be summarized. These combinations of elevated values are based on measured value within the same sample.
Liver Functions Plots
A matrix scatter plot of liver function test will be plotted showing the maximum ALT, AST, ALP and total bilirubin during study period crossed against each other. Different dots will be used for randomization arm.
7.5.3 Vital Signs
Raw values and changes from baseline at each scheduled visit will be summarized using descriptive statistics.
7.5.4 Electrocardiograms (ECGs)
<12-lead ECG>● Raw values (categorical) and changes from baseline (shift from baseline) will be
summarized, and the summaries will include number and percentage of subjects with normal, not clinically significant abnormal and clinically significant abnormal 12 lead ECG findings.
<Central ECG (except for reference group)>
QTc intervals should be calculated by followed procedure:
○ Bazett’s formula: QTc = QT/(RR/1000)1/2

Sponsor: Astellas Pharma Inc. SAP Final VersionISN/Protocol 015K-CL-RAJ3
19-Jan-2018 Astellas Page 52 of 108
○ Fridericia’s formula: QTc = QT/(RR/1000)1/3
Change for ECG variables is defined in two ways.○ baseline: before the first dose of study drug or reference drug○ pre-dose at Week 4 / Week 8: before the Week 4 / Week 8 dose of study drug or
reference drug○ post-dose at Week 4 / Week 8: after the Week 4 / Week 8 dose of study drug or
reference drug
● Descriptive statistics of the central ECG variables (QTcF, QTcB, QT, PR, RR intervals,QRS and HR) and the corresponding changes from baseline by each visit and time ofmeasurement will be calculated. In addition, the corresponding changes from pre-dose to post-dose at Week 4 / Week 8 will be calculated.
● The QT, QTc interval variables will be summarized by the frequencies of subjects with following categories up to Week 12, and each time points.
○ < 300 msec○ < 330 msec○ < 360 msec○ > 450 msec○ > 480 msec○ > 500 msec
● The change from baseline of QT, QTc interval variables will be summarized by the frequencies of subjects with following categories up to Week 12, and each time points.In addition, the corresponding changes from pre-dose to post-dose at Week 4 / Week 8 will be calculated.
○ > 30 msec increase○ > 60 msec increase○ > 30 msec decrease○ > 60 msec decrease
7.5.5 Chest radiography
Chest radiography will be provided as a subject listing only.
7.5.6 Pregnancies
Pregnancies will be provided as a subject listing only.
7.6 Analysis of PK
Refer to PK SAP.

Sponsor: Astellas Pharma Inc. SAP Final VersionISN/Protocol 015K-CL-RAJ3
19-Jan-2018 Astellas Page 53 of 108
7.7 Analysis of PD
Following analysis is executed for PDAS.
Raw values and changes from baseline for Vascular Endothelial Growth Factor (VEGF),Matrix metalloproteinase 3 (MMP-3) will be summarized using descriptive statistics.
As for Lymphocytes subset variables, as described in 7.5.2, harmonization among each region (Japan, Korea, Taiwan) was reported to be difficult and therefore, Raw values and changes from baseline will be summarized by Study Region (Japan, Korea, Taiwan), using descriptive statistics. For CD3, CD8, CD4, CD19, CD4/CD8 ratio, (CD16 or CD56)+, CD16+ and CD56+, CD16- and CD56+, CD16+ and CD56-, CD16- and CD56-, count values (cells/uL) will be summarized by whole population for exploratory analysis.
1. Japan
○ CD3+/Lymphocytes (%), CD3+ (cells/uL)
○ CD8+/Lymphocytes (%), CD8+ (cells/uL)
○ CD4+/Lymphocytes (%), CD4+ (cells/uL)
○ CD19+/Lymphocytes (%), CD19+ (cells/uL)
○ CD4/CD8 Ratio
○ (CD16 or CD56)+/Lymphocytes (%), (CD16 or CD56)+ (cells/uL)
○ (CD16+ and CD56+)/CD3- (%), CD16+ and CD56+ (cells/uL)
○ (CD16- and CD56+)/CD3- (%), CD16- and CD56+ (cells/uL)
○ (CD16+ and CD56-)/CD3- (%), CD16+ and CD56- (cells/uL)
○ (CD16- and CD56-)/CD3- (%), CD16- and CD56- (cells/uL)
○ CD56 bright/CD3- (%), CD56 bright (cells/uL)
○ CD56 dim/CD3- (%), CD56 dim (cells/uL)
2. Korea
○ CD3+/Lymphocytes (%), CD3 (cells/uL)
○ (CD3+ and CD8+)/CD3+ (%), CD3+ and CD8+ (cells/uL)
○ (CD3+ and CD4+)/CD3+ (%), CD3+ and CD4+ (cells/uL)
○ (CD16 or CD56)+/CD3- (%), (CD16 or CD56)+ (cells/uL)
○ CD19+/CD3- (%), CD19+ (cells/uL)
○ CD4/CD8 Ratio
○ (CD16+ and CD56+)/CD3- (%), CD16+ and CD56+ (cells/uL)
○ (CD16- and CD56+)/CD3- (%), CD16- and CD56+ (cells/uL)

Sponsor: Astellas Pharma Inc. SAP Final VersionISN/Protocol 015K-CL-RAJ3
19-Jan-2018 Astellas Page 54 of 108
○ (CD16+ and CD56-)/CD3- (%), CD16+ and CD56- (cells/uL)
○ (CD16- and CD56-)/CD3- (%), CD16- and CD56- (cells/uL)
3. Taiwan
○ CD3+/Lymphocytes (%), CD3 (cells/uL)
○ (CD3+ and CD8+)/Lymphocytes (%), CD3+ and CD8+ (cells/uL)
○ (CD3+ and CD4+)/Lymphocytes (%), CD3+ and CD4+ (cells/uL)
○ (CD16 or CD56)+/Lymphocytes (%), (CD16 or CD56)+ (cells/uL)
○ CD19+/Lymphocytes (%), CD19+ (cells/uL)
○ CD4/CD8 Ratio
○ (CD16+ and CD56+)/Lymphocytes (%), CD16+ and CD56+ (cells/uL)
○ (CD16- and CD56+)/Lymphocytes (%), CD16- and CD56+ (cells/uL)
○ (CD16+ and CD56-)/Lymphocytes (%), CD16+ and CD56- (cells/uL)
○ (CD16- and CD56-)/Lymphocytes (%), CD16- and CD56- (cells/uL)
7.8 Subgroups of Interest
7.8.1 Subgroup analysis of primary endpoint and treatment emergent adverse events
Primary efficacy endpoint and treatment emergent adverse events will be summarized by the treatment group for the subgroups defined on the basis of the categorized variables listed below:
○ Sex (Male, Female)○ Age Group (< 65 years, >= 65 years)
○ Prior Anti-TNF DMARD Use (User, Non-user)○ Prior Biologic DMARD-IR (No, Yes)○ Duration of RA (years)(< 5 years, >= 5 years)○ Number of Prior DMARDs Used (0, 1, 2, >= 3)○ Number of Prior Biologic DMARDs Used (0, 1, 2, >= 3)○ MTX Dose (mg/week) at Baseline (None, 0 mg/week, 0 <- 8 mg/week, 8 <-
12 mg/week, > 12 mg/week)○ Concomitant Steroid at Baseline (No, Yes)○ Prednisone Dose (mg/day) at Baseline (None, 0 <- 5 mg/day, > 5 mg/day)○ Concomitant DMARD at Baseline Use (No, Yes)○ Study Region (Japan, Korea, Taiwan)○ Baseline DAS28-CRP (<= 3.2, 3.2 <- 5.1, > 5.1) *○ Baseline DAS28-ESR (<= 3.2, 3.2 <- 5.1, > 5.1) *○ Baseline CRP (< 1.0, >= 1.0) *

Sponsor: Astellas Pharma Inc. SAP Final VersionISN/Protocol 015K-CL-RAJ3
19-Jan-2018 Astellas Page 55 of 108
○ Concomitant DMARD Category at Baseline (MTX, DMARD except for MTXonly, None)
○ Protocol Version Number (used for confirmation of the Inclusion criteria and the Exclusion criteria) (<= Version 2.0, >= Version 3.0)
○ Body Weight (kg) at Screening (<- 40 kg, 40 kg <- 60 kg, 60 kg <- 80 kg, > 80 kg)
*: Only applied to efficacy analysis.
7.8.2 Subgroup analysis for Study Region (Japan, Korea, Taiwan)
For Study Region (Japan, Korea, Taiwan), following secondary efficacy endpoints, safety endpoints, and pharmacodynamics endpoints will be analyzed in addition to 7.8.1 Subgroup analysis of primary endpoint and treatment emergent adverse events.
○ ACR50○ ACR70○ DAS28-CRP○ DAS28-ESR○ Pharmacodynamics endpoints
- Vascular Endothelial Growth Factor (VEGF)- Matrix metalloproteinase 3 (MMP-3)
○ Overview of TEAEs○ Serious TEAEs○ Drug related TEAE○ TEAE leading to permanent discontinuation of study drug or reference drug○ The number and percentage of subjects with TEAEs of special interest
- Serious Infections- Malignancies- Herpes Zoster Related Disease (Herpes Zoster and Varicella)
○ Clinical Laboratory Evaluation- For continuous variables, descriptive statistics of raw values, change from
baseline value at each scheduled visit will be summarized at each time point using SI unit
- For categorical variables, frequencies and percentages will be displayed at each scheduled visit.
7.8.3 Protocol Version Number (used for confirmation of the Inclusion criteria and the Exclusion criteria) (<= Version 2.0, >= Version 3.0)
For Protocol Version Number (used for confirmation of the Inclusion criteria and the Exclusion criteria) (<= Version 2.0, >= Version 3.0), following secondary efficacy endpointsand safety endpoints will be analyzed in addition to 7.8.1 Subgroup analysis of primary endpoint and treatment emergent adverse events.
○ ACR50

Sponsor: Astellas Pharma Inc. SAP Final VersionISN/Protocol 015K-CL-RAJ3
19-Jan-2018 Astellas Page 56 of 108
○ ACR70○ DAS28-CRP○ DAS28-ESR○ Serious TEAEs ○ The number and percentage of subjects with TEAEs of special interest
- Serious Infections- Malignancies- Herpes Zoster Related Disease (Herpes Zoster and Varicella)
7.9 Other Analyses
Not Applicable.
7.10 Interim Analysis (and Early Discontinuation of the Clinical Study)
Not applicable for efficacy analysis. Review of safety data and safety evaluation will be completed by an independent DSMB during the study in accordance with separate SOP.
7.11 Handling of LLOQ, Missing Data, Outliers, Visit Windows, and Other Information
7.11.1 LLOQ
Safety variables
Values below the LLOQ for beta-D-glucan, hCG, Troponin-T, CK-MB will be treated as it is and these variables are not used for descriptive statistics and displayed in the listings. As for beta-D-glucan, it is used for shift-from baseline analysis.
PD variables
Values below the LLOQ will be set to 0 for calculation of descriptive statistics.
7.11.2 Missing Data
Missing Data in ACR20/50/70, DAS28
Table 8 addresses the handling of missing ACR components and ACR response in the inferential analyses of ACR20/50/70, DAS28, and DAS28-related variables at Week12/ET. Note that if subject does not have any post-baseline values, then that subject will be defined as an ACR20-CRP non-responder. Moreover, if subject does not have baseline values, then that subject will be defined as an ACR20-CRP non-responder.
For ACR20/50/70, if some of ACR components include missing, then the following handling will be done.

Sponsor: Astellas Pharma Inc. SAP Final VersionISN/Protocol 015K-CL-RAJ3
19-Jan-2018 Astellas Page 57 of 108
TJC-68 SJC-66 Remaining 5 Components
ACR20/50/70
Pattern 1 Non-Responder Any Any Non-ResponderPattern 2 Any Non-Responder Any Non-ResponderPattern 3 Any Any The Number of the
Response is Less than 3 Components.
Non-Responder
Pattern 4 Missing Responder or Missing The Number of the Response is at least 3 Components, or the Number of the Missing is at least 3 Components.
Missing
Pattern 5 Responder or Missing Missing The Number of the Response is at least 3 Components, or the Number of the Missing is at least 3 Components.
Missing
Pattern 6 Responder or Missing Responder or Missing The Number of the Missing is at least 3 Components (Baseline=0 regarded as Non-Responder).
Missing
Pattern 7 Responder Responder The Number of the Response is at least 3 Components.
Responder

Sponsor: Astellas Pharma Inc. SAP Final VersionISN/Protocol 015K-CL-RAJ3
19-Jan-2018 Astellas Page 58 of 108
Table 8. Imputation Methods for Missing ACR and DAS28 for Components and Response at Week 12/ET
Imputation Method Explanation/Instruction
For use in all ACR20/50/70 analyses at Week 12/ET including primary analysis.
1 LOCF components
● First LOCF all missing ACR component value(s) at Week 12 and then calculate ACR response as Week 12/ET.
For use in sensitivity analysis of ACR20-CRP at Week 12/ET
2 LOCF components and NRI response
● If all ACR component values are missing at Week 12 for
any reason and therefore the ACR response is missing, the missing ACR response at Week 12/ET will be imputed using NRI (i.e., subject is a non-responder).
● If NOT all ACR component values are missing at Week 12for any reason, all missing ACR component value(s) at Week 12/ET will first be imputed using LOCF and then the ACR response will be calculated.
3 Observed ● Data as observed (i.e., data as reported in the study database) will be analyzed. Missing ACR response components will remain missing if reported in the study database as missing. Missing ACR response will remain missing.
*: ACR20 at Week 12 is used for this sensitivity analysis

Sponsor: Astellas Pharma Inc. SAP Final VersionISN/Protocol 015K-CL-RAJ3
19-Jan-2018 Astellas Page 59 of 108
Imputation Method Explanation/Instruction
4 Multiple Imputation, assuming Missing at Random Mechanism
Multiple imputation (MI) will be conducted in the following procedure.
<Step1>Imputation Part1) Multiple Imputation for Non-Monotone Missing dataIf non-monotone missing pattern exists, then those non-monotone missing data will be imputed by adapting Markov Chain Monte Carlo method, using each non-missing ACR components data up to Week 12. Imputation will be conducted by each ACR components (i.e. TJC-68, SJC-66, SGAP, SGA, PGA, HAQ-DI, CRP), and treatment groups, respectively.
2) Multiple Imputation for Monotone Missing dataCompleting the imputation for non-monotone missing data, each ACR components (i.e. TJC-68, SJC-66, SGAP, SGA, PGA, HAQ-DI, CRP) at Week 12 will be imputed, respectively, based on the regression model with treatment group (Placebo, ASP015K 100 mg, ASP015K 150 mg, Etanercept) as factor and all values up to Week 12 as covariate. In this method, using seed as 12345, 1000 imputed datasets for each ACR components will be created based on SAS ver. 9.4 PROC MI procedure, monotone reg statement. Then, ACR20 response at Week 12 will be calculated with imputed datasets for each ACR components based on the same method described in Section 6.1.1.
<Step2>Analysis PartBased on 1000 Imputed datasets created at Step1, ACR20 at Week 12 in each treatment group will be summarized by Imputed datasets. Also, the difference in ACR20 at Week 12
between ASP015K 100 mg / 150 mg, Etanercept and placebo and their standard error will be calculated. Moreover, the log odds ratio to placebo in ACR20 at Week 12 and its standard error will be calculated by each Imputed datasets using logistic regression model with treatment group, the prior biologic-DMARD-IR (No, Yes), concomitant, DMARD use (No, Yes) and study region (Japan, Korea, and Taiwan) as factor.

Sponsor: Astellas Pharma Inc. SAP Final VersionISN/Protocol 015K-CL-RAJ3
19-Jan-2018 Astellas Page 60 of 108
Imputation Method Explanation/Instruction
4 Multiple Imputation, assuming Missing at Random Mechanism
<Step3>Combine PartIn accordance with Rubin’s rule (Little and Rubin, 2002), the 1000 estimated
ACR20 response rate in each treatment groups are combined. In addition, the difference between ASP015K 100 mg and placebo, the difference between ASP015K 150 mg and placebo, the difference between Etanercept and placebo, and 95% confidence interval for the difference will be combined. Moreover, the Wald's chi-squared test using logistic regression model with treatment group (Placebo, ASP015K 100 mg, ASP015K 150 mg) , the prior biologic-DMARD-IR (No, Yes), concomitant, DMARD use (No, Yes) and study region (Japan, Korea, and Taiwan) as factor will also be calculated.

Sponsor: Astellas Pharma Inc. SAP Final VersionISN/Protocol 015K-CL-RAJ3
19-Jan-2018 Astellas Page 61 of 108
Imputation Method Explanation/Instruction
5 Placebo Multiple Imputation (pMI)
Placebo Multiple Imputation, assuming the statistical behavior of ASP015K 100 mg or 150 mg treated patients who discontinue becomes that of placebo-treated patients after the time of dropoutwill be conducted in the following procedure.
<Step1>Imputation Part1) Multiple Imputation for Non-Monotone Missing dataIf non-monotone missing pattern exists, then those non-monotone missing data will be imputed by adapting Markov Chain Monte Carlo method, using each non-missing ACR components data up to Week 12. Imputation will be conducted by each ACR components (i.e. TJC-68, SJC-66, SGAP, SGA, PGA, HAQ-DI, CRP), and treatment groups, respectively. 2) Multiple Imputation for Monotone Missing dataCompleting the imputation for non-monotone missing data, each ACR components (i.e. TJC-68, SJC-66, SGAP, SGA, PGA, HAQ-DI, CRP) at Week 12 will be imputed, respectively, based on the regression model using only data from the placebo group up to Week 12. In this method, using seed as 12345, 1000 imputed datasets for each ACR components will be created based on SAS ver. 9.4 PROC MI procedure, monotone reg statement. Then, ACR20 response at Week 12 will be calculated with imputed datasets for each ACR components based on the same method described in Section 6.1.1.
<Step2>Analysis PartFor 1000 Imputed datasets created at Step1, ACR20 at Week 12 in each treatment group will be calculated. Also, the difference in ACR20 at Week 12 between ASP015K 100 mg / 150 mg,
Etanercept and placebo and their standard error will be calculated. Moreover, the log odds ratio to placebo in ACR20 at Week 12 and its standard error will be calculated by each Imputed datasets using logistic regression model with treatment group, the prior biologic-DMARD-IR (No, Yes), concomitant, DMARD use (No, Yes) and study region (Japan, Korea, and Taiwan) as factor.

Sponsor: Astellas Pharma Inc. SAP Final VersionISN/Protocol 015K-CL-RAJ3
19-Jan-2018 Astellas Page 62 of 108
Imputation Method Explanation/Instruction
5 Placebo Multiple Imputation (pMI)
<Step3>Combine PartIn accordance with Rubin’s rule (Little and Rubin, 2002), the 1000 estimated ACR20 response rate in each treatment groups are combined. In addition, the difference between ASP015K 100 mg and placebo, the difference between ASP015K 150 mg and placebo, the difference between Etanercept, and 95% confidence interval for the difference will be combined. Moreover, the Wald'schi-squared test using logistic regression model with treatment group (Placebo, ASP015K 100 mg, ASP015K 150 mg), the prior biologic-DMARD-IR (No, Yes), concomitant, DMARD use (No, Yes) and study region (Japan, Korea, and Taiwan) as factor will also be calculated.
For use in all DAS28 and DAS28-based analyses, unless otherwise specified in Section 10.2Appendix 16 LOCF DAS28
CRPcomponents
● LOCF all missing DAS28 CRP component value(s) and
then calculate the DAS28 score.
Missing Data in HAQ-DI
For HAQ-DI, there are 20 items in 8 categories, with each category having 2 or 3 questions. A subject must have a score in >= 6 of the 8 categories, otherwise the HAQ-DI cannot be computed and will be considered missing for data summarization and analysis purposes. If responses to individual questions within a category are missing, they are not imputed. Therefore, the score in each category is based on non-missing responses. A category score is missing when all responses within a category are missing.
Missing Data in SF-36v2
For SF-36v2, there are 8 scales (domains). Missing values will be imputed if at least half of the items in the domain that included the missing item score(s) are non-missing. In that case, the missing value will be imputed with the average score of the non-missing item scores in this domain.
Missing Data in WPAI
For WPAI Scale Score, each score will be computed on condition that the all of the questions for each score will not be non-missing.
7.11.3 Outliers
All values will be included in the analyses.

Sponsor: Astellas Pharma Inc. SAP Final VersionISN/Protocol 015K-CL-RAJ3
19-Jan-2018 Astellas Page 63 of 108
7.11.4 Visit Windows
The acceptable time ranges of the efficacy and safety examinations, observations, etc. from the date of initial study treatment (Day 1) are defined as follows. If there are multiple data available over the same period of time, the data obtained on the date closest to the reference date will be utilized; the later date will be applied if the number of days from the reference date is equal. Subjects who have no evaluable post-dose data on ACR20, ACR50, and ACR70 response rates will be counted as non-responders and included in the analysis at the end of Week 12 (Week 12 or at early termination before Week 12).

Sponsor: Astellas Pharma Inc. SAP Final VersionISN/Protocol 015K-CL-RAJ3
19-Jan-2018 Astellas Page 64 of 108
7.11.5 Handling of Schedule of Assessments of Efficacy Variables
For data obtained after the end of study treatment, the data obtained within + 2 days after the last dose is taken will be included in analysis. For data after the end of reference treatment, data obtained within + 9 days after the last dose will be included in analysis. Baseline for efficacy is defined as value at Day 1 before the first dose of study drug or reference drug for all subjects including placebo assigned subjects. For Week 12/ET, the values at closest date to reference date will be used. As for the subjects who switched to receive ASP015K instead of placebo, the last observation before first dose of ASP015K at Week 12 will be used for the analysis for visit Week 4, 8, 12, 12/ET. For EOT, the closest value to the reference date will be used regardless of the switching from placebo.
(1) TJC (68 joints)/SJC (66 joints), laboratory test (CRP)
Table 9. Visit Window for TJC (68 joints)/SJC (66 joints), laboratory test (CRP)
Time points defined in analysis Reference date* Acceptable time rangeScreening** Day −28 to Day −1 Day −28 to Day −1
Baseline Day 1 Day 1Week 4 to Week 48*** Day 7×x + 1 Day (7×x − 6) to Day (7×x + 8) and
before the initiation of treatment with the study drug or reference drug on the visit day
Week 52 Day 365 Day 358 to Day 372Week 12/ET (Week 12 or at early
termination before Week 12)Day 85 Day 2 to Day 92
EOT (Week 52 or at early termination)
Day 365 Day 2 to Day 372
*: Day 1 represents the first day of study or reference treatment. The day before the initiation of treatment with the study drug or reference drug is expressed as Day −1.
**: PGA, SGA, subject’s assessment of pain, and CRP are not applicable.
**: Represents the reference date and acceptable time range for Week x.
(2) PGA and SGA (VAS), subject’s assessment of pain (VAS), HAQ-DI, laboratory test (ESR)
Table 10. Visit Window for PGA and SGA (VAS), subject’s assessment of pain (VAS), HAQ-DI,
laboratory test (ESR)
Time points defined in analysis Reference date* Acceptable time rangeBaseline Day 1 Day 1
Week 4 to Week 48** Day 7×x + 1 Day (7×x − 6) to Day (7×x + 8) andbefore the initiation of treatment with the
study drug or reference drug on the visit dayWeek 52 Day 365 Day 358 to Day 372
Week 12/ET (Week 12 or at early termination before Week 12)
Day 85 Day 2 to Day 92
EOT (Week 52 or at early termination)
Day 365 Day 2 to Day 372
*: Day 1 represents the first day of study or reference treatment. The day before the initiation of treatment with the study drug or reference drug is expressed as Day −1.
**: Represents the reference date and acceptable time range for Week x.

Sponsor: Astellas Pharma Inc. SAP Final VersionISN/Protocol 015K-CL-RAJ3
19-Jan-2018 Astellas Page 65 of 108
(3) SF-36 v2®, WPAI
Table 11. Visit Window for SF-36 v2®, WPAI
Time points defined in analysis Reference date* Acceptable time rangeBaseline Day 1 Day 1
Week 4 to Week 28** Day 7×x + 1 Day (7×x − 6) to Day (7×x + 8) andbefore the initiation of treatment with the
study drug or reference drug on the visit dayWeek 52 Day 365 Day 358 to Day 372
Week 12/ET (Week 12 or at early termination before Week 12)
Day 85 Day 2 to Day 92
EOT (Week 52 or at early termination)
Day 365 Day 2 to Day 372
*: Day 1 represents the first day of study or reference treatment. The day before the initiation of treatment with the study drug or reference drug is expressed as Day −1.
**: Represents the reference date and acceptable time range for Week x.
7.11.6 Handling of Schedule of Assessments of Safety Variables
For data obtained after the end of study treatment, the data obtained within + 2 days after the last dose is taken will be included in analysis. For data after the end of reference treatment, data obtained within + 9 days after the last dose will be included in analysis. Baseline for safety is defined as last non-missing value before the first dose of study drug or reference drug for all subjects including placebo assigned subjects. For Week 12/ET, the values at closest date to reference date will be used. As for the subjects who switched to receive ASP015K instead of placebo, the last observation before first dose of ASP015K at Week 12 will be used for the analysis for visit Week 4, 8, 12, 12/ET. For EOT, the closest value to the reference date will be used regardless of the switching from placebo.

Sponsor: Astellas Pharma Inc. SAP Final VersionISN/Protocol 015K-CL-RAJ3
19-Jan-2018 Astellas Page 66 of 108
(1) Physical examination, vital signs, laboratory test [hematology, biochemistry, urinalysis, and pregnancy test (serum and urine)]
Table 12. Visit Window for Physical examination, vital signs, laboratory test (hematology,
biochemistry, urinalysis, and pregnancy test (serum and urine))
Time points defined in analysis Reference date* Acceptable time rangeScreening Day −28 to Day −1 Day −28 to Day −1Baseline Day 1 Day 1
Week 4 to Week 48** Day 7×x + 1 Day (7×x − 6) to Day (7×x + 8) andbefore the initiation of treatment with the
study drug or reference drug on the visit dayWeek 52 Day 365 Day 358 to Day 372
Minimum on Treatment up to Week 12***
Minimum value at allowance Range (Day 2 to Day 92) before first dose of Week 12
study drug
Maximum on Treatment up to Week 12***
Maximum value at allowance Range (Day 2 to Day 92) before first dose of Week 12
study drug
Minimum on Treatment***Minimum value during Entire Period (No
limitation for period)
Maximum on Treatment***Maximum value during Entire Period (No
limitation for period)Week 12/ET (Week 12 or at early
termination before Week 12)Day 85 Day 2 to Day 92
EOT (Week 52 or at early termination)
Day 365 Day 2 to Day 372
*: Day 1 represents the first day of study or reference treatment. The day before the initiation of treatment with the study drug or reference drug is expressed as Day −1.
**: Represents the reference date and acceptable time range for Week x.
***: Applied to laboratory test only.

Sponsor: Astellas Pharma Inc. SAP Final VersionISN/Protocol 015K-CL-RAJ3
19-Jan-2018 Astellas Page 67 of 108
(2) Laboratory test (fasting lipid profile test)
Table 13. Visit Window for Laboratory test (fasting lipid profile test)
Time points defined in analysis Reference date* Acceptable time rangeBaseline Day 1 Before the initiation of treatment with the
study drug or reference drug on Day 1 andat least 8 hours after the last meal
If Baseline data is not measured at Day 1, then the closest day up to Day 1 after Day
−28 will be used for Baseline.Week 12 Day 85 Day 78 to Day 92Week 20 Day 141 Day 134 to Day 148Week 28 Day 197 Day 190 to Day 204Week 40 Day 281 Day 274 to Day 288Week 52 Day 365 Day 358 to Day 372
Minimum on Treatment up to Week 12
Minimum value at allowance Range (Day 2 to Day 92) before first dose of Week 12
study drug
Maximum on Treatment up to Week 12
Maximum value at allowance Range (Day 2 to Day 92) before first dose of Week 12
study drug
Minimum on TreatmentMinimum value during Entire Period (No
limitation for period)
Maximum on TreatmentMaximum value during Entire Period (No
limitation for period)Week 12/ET (Week 12 or at early
termination before Week 12)Day 85 Day 2 to Day 92
EOT (Week 52 or at early termination)
Day 365 Day 2 to Day 372
*: Day 1 represents the first day of study or reference treatment. The day before the initiation of treatment with the study drug or reference drug is expressed as Day −1.
(3) 12-lead ECG, Chest radiography
Table 14. Visit Window for 12-lead ECG
Time points defined in analysis Reference date* Acceptable time rangeScreening Day −28 to Day −1 Day −28 to Day −1Week 28 Day 197 Day 190 to Day 204Week 52 Day 365 Day 358 to Day 372
EOT (Week 52 or at early termination)
Day 365 Day 2 to Day 372
*: Day 1 represents the first day of study or reference treatment. The day before the initiation of treatment with the study drug or reference drug is expressed as Day −1.
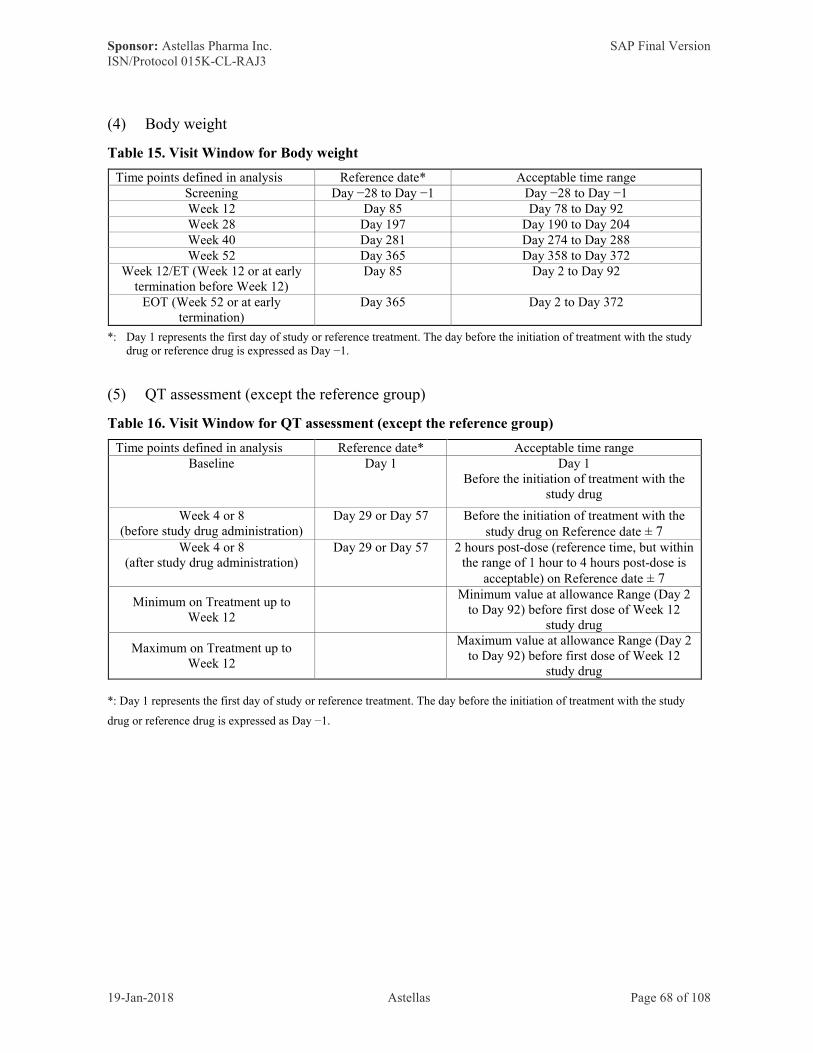
Sponsor: Astellas Pharma Inc. SAP Final VersionISN/Protocol 015K-CL-RAJ3
19-Jan-2018 Astellas Page 68 of 108
(4) Body weight
Table 15. Visit Window for Body weight
Time points defined in analysis Reference date* Acceptable time rangeScreening Day −28 to Day −1 Day −28 to Day −1Week 12 Day 85 Day 78 to Day 92Week 28 Day 197 Day 190 to Day 204Week 40 Day 281 Day 274 to Day 288Week 52 Day 365 Day 358 to Day 372
Week 12/ET (Week 12 or at early termination before Week 12)
Day 85 Day 2 to Day 92
EOT (Week 52 or at early termination)
Day 365 Day 2 to Day 372
*: Day 1 represents the first day of study or reference treatment. The day before the initiation of treatment with the study drug or reference drug is expressed as Day −1.
(5) QT assessment (except the reference group)
Table 16. Visit Window for QT assessment (except the reference group)
Time points defined in analysis Reference date* Acceptable time rangeBaseline Day 1 Day 1
Before the initiation of treatment with the study drug
Week 4 or 8(before study drug administration)
Day 29 or Day 57 Before the initiation of treatment with the study drug on Reference date ± 7
Week 4 or 8(after study drug administration)
Day 29 or Day 57 2 hours post-dose (reference time, but within the range of 1 hour to 4 hours post-dose is
acceptable) on Reference date ± 7
Minimum on Treatment up to Week 12
Minimum value at allowance Range (Day 2 to Day 92) before first dose of Week 12
study drug
Maximum on Treatment up to Week 12
Maximum value at allowance Range (Day 2 to Day 92) before first dose of Week 12
study drug
*: Day 1 represents the first day of study or reference treatment. The day before the initiation of treatment with the study
drug or reference drug is expressed as Day −1.

Sponsor: Astellas Pharma Inc. SAP Final VersionISN/Protocol 015K-CL-RAJ3
19-Jan-2018 Astellas Page 69 of 108
7.11.7 Handling of Schedule of Assessments of Pharmacodynamic Variables
For data obtained after the end of study treatment, the data obtained within + 2 days after the last dose is taken will be included in analysis. For data after the end of reference treatment, data obtained within + 9 days after the last dose will be included in analysis. Baseline for safety is defined as last non-missing value before the first dose of study drug or reference drug for all subjects including placebo assigned subjects. For Week 12/ET, the values at closest date to reference date will be used. As for the subjects who switched to receive ASP015K instead of placebo, the last observation before first dose of ASP015K at Week 12 will be used for the analysis for visit Week 4, 8, 12, 12/ET. For EOT, the closest value to the reference date will be used regardless of the switching from placebo.
(1) Biomarkers and lymphocyte subsets
Table 17. Visit Window for Pharmacodynamic Variables
Time points defined in analysis Reference date* Acceptable time rangeBaseline Day 1 Before the initiation of treatment with the
study drug or reference drug on Day 1Week 4 to Week 28** Day 7×x+1 Day (7×x − 6) to Day (7×x + 8) and
before the initiation of treatment with the study drug or reference drug on the visit day
Week 52 Day 365 Day 358 to Day 372Week 12/ET (Week 12 or at early
termination before Week 12)Day 85 Day 2 to Day 92
EOT (Week 52 or at early termination)
Day 365 Day 2 to Day 372
*: Day 1 represents the first day of study or reference treatment.
**: Represents the reference date and acceptable time range for Week x.

Sponsor: Astellas Pharma Inc. SAP Final VersionISN/Protocol 015K-CL-RAJ3
19-Jan-2018 Astellas Page 70 of 108
8 DOCUMENT REVISION HISTORY Version Date Changes Comment/rationale for change1.00 26-Dec-2016 NA Document finalized for TFDA
submission2.00 19-Jan-2018 Modifications as
appropriateDocument finalized
2.10 19-Jan-2018 Add multipleimputation to sensitivity analysis
Document finalized
9 REFERENCES
ICH Harmonized Tripartite Guideline E 3. Structure and Content of Clinical Study Reports, November 1995. (www.ich.org; Guidelines; "Efficacy" Topics)
ICH Harmonized Tripartite Guideline E 9. Statistical Principles for Clinical Trials, February 1998. (www.ich.org; Guidelines; "Efficacy" Topics)
Xeljanz® Tablets, 5 mg CTD, 2.7 Clinical Summary, 2.7.3 Summary of Clinical Efficacy, 2.7.3.3 Comparison of Results in Subpopulations, 2.7.3.3.1 Comparison of Japanese Population and Whole Population in Global Studies (Study No. A3921044) 123-139 (2013)
Cimzia Subcutaneous Injection 200 mg Syringe CTD, 2.7 Clinical Summary, 2.7.3 Summary of Clinical Efficacy, 2.7.3.2 Summary of Results of Individual Studies, 2.7.3.2.2 Comparison of Efficacy Results of All Studies, 2.7.3.2.2.1 Japanese Studies (1) Study CDP870-041, (2) Study RA0006 22-35 (2012)
Reilly MC, Zbrozek AS, Dukes EM. The validity and reproducibility of a work productivity and activity impairment instrument. PharmacoEconomics 1993; 4(5):353-65.
Reilly Associates Health Outcomes Research, http://www.reillyassociates.net.
Ernst MD. Permutation methods: a basis for exact inference. Statistical Science 2004;19(4): 676-685.

Sponsor: Astellas Pharma Inc. SAP Final VersionISN/Protocol 015K-CL-RAJ3
19-Jan-2018 Astellas Page 71 of 108
10 APPENDICES
10.1 Appendix 1: Overview of ACR20 response at Week 12/ET
Table 18 summarizes the analyses of the ACR20 response at Week 12/ET, with "X" indicating that the variable will be analyzed. All analyses will be based on the FAS for Initial randomization group, unless otherwise specified.
Table 18. Overview of ACR20 response at Week 12/ET
Analysis Type Analysis Variable Analysis Method
Primary / Sensitivity / Subgroup/ Adjustment for imbalance/
Japanese subjects
Primary:
ACR20 response at Week 12/ET
Primary X1 Logistic regression
Sensitivity2 (see Sections 7.4.1.2 and 7.11.2 for further explanation)
LOCF and NRI X Logistic regressionPPS as analysis set X Logistic regressionObserved data X Logistic regressionMultiple Imputation Assuming Missing at Random
XLogistic regression
Placebo Multiple Imputation (pMI)
XLogistic regression
Interaction3 (see Sections 7.4.1.3 for further explanation)
the prior biologic-DMARD-IR xtreatment group interaction
X Logistic regression4
concomitant DMARD use xtreatment group interaction
X Logistic regression
study region xtreatment group interaction
X Logistic regression
Subgroup5
Sex X
Logistic regression6
Age Group X
Prior Anti-TNF DMARD Use X
Prior Biologic DMARD-IR X
Concomitant DMARD Use at Baseline
X
Study Region X
Baseline DAS28-CRP (<= 3.2, 3.2 <- 5.1, > 5.1)
X
Baseline DAS28-ESR (<= 3.2, 3.2 <- 5.1, > 5.1)
X

Sponsor: Astellas Pharma Inc. SAP Final VersionISN/Protocol 015K-CL-RAJ3
19-Jan-2018 Astellas Page 72 of 108
Duration of RA X
Number of Prior DMARDs Used
X
Number of Prior Biologic DMARDs Used
X
MTX Dose at Baseline X
Baseline CRP (< 1.0, >= 1.0) X
Concomitant DMARD Category at Baseline
X
Protocol Version Number X
Concomitant Steroid at Baseline X
Prednisone Dose at Baseline X
Adjustment for imbalance7
Adjusted analysis XOnly in the case of imbalance presented. Logistic regression8
Japanese subjects9
Analysis for Japanese subjects X Logistic regression
Abbreviations are defined in Section I.1 Based on FAS as analysis set, logistic regression model with treatment group as the factor and the prior biologic-DMARD-IR, concomitant DMARD use, and study region as the covariates, 7.11.2 Table 8. 1. LOCF components will be used.2 For the sensitivity analysis, multiplicity adjustment is not executed.
3 For the interaction analysis, multiplicity adjustment is not executed.4 Logistic regression model including each interaction term separately will be performed.5 Subgroup categories are provided in Section 7.8. For the sensitivity analysis, any statistical testing is not executed.6 Logistic regression model will be performed for each subgroup category.7 The variables in which imbalance is evaluated are provided in Section 7.2.2. For the adjusted analysis, multiplicityadjustment is not executed.8 Logistic regression model with adjusted variable (if imbalance will be detected) added to primary analysis logistic regression model (Section 7.4.1.1).9 For analysis for Japanese subjects, multiplicity adjustment is not executed.

Sponsor: Astellas Pharma Inc. SAP Final VersionISN/Protocol 015K-CL-RAJ3
19-Jan-2018 Astellas Page 73 of 108
10.2 Appendix 2: Overview of Secondary Endpoints
Table 19 summarizes the analyses of the primary and secondary efficacy variables, with "X" indicating that the variable will be analyzed. All analyses will be based on the FAS, unless otherwise specified.
Table 19. Overview of Secondary Endpoints analysis
Analysis Type/Analysis Variable 1 CRP ESR None Treatment Group Analysis Method 2
Categorical Variables
1.1.1.1Percentage of subjects achieving ACR20/50/70 at each visit (Weeks 4, 8, 12)
X X Placebo, 100mg, 150mg, Reference Logistic regression
1.1.1.2
Percentage of subjects achieving ACR20/50/70 at each visit (Weeks 4, 8, 12)Subgroup Analysis (Study Region, Protocol Version Number)
X Placebo, 100mg, 150mg, Reference Logistic regression
1.1.2Percentage of subjects achieving ACR20/50/70 at each visit (Weeks 4, 8, 12, 16, 20, 24, 28, 32, 36, 40, 44, 48, 52, EOT)
X
100mg, 150mg, Placebo to 100mg at Week 12, Placebo to 150mg at Week 12, Reference
No statistical test
1.2.1 Line graph of 1.1.1 X X Placebo, 100mg, 150mg, Reference No statistical test
1.2.2 Line graph of 1.1.2 X
100mg, 150mg, Placebo to 100mg at Week 12, Placebo to 150mg at Week 12, Reference
No statistical test
2.1Percentage of subjects achieving ACR20 response at Week 4 and sustaining response at each visit (Weeks 8, 12)
X Placebo, 100mg, 150mg, Reference Logistic regression

Sponsor: Astellas Pharma Inc. SAP Final VersionISN/Protocol 015K-CL-RAJ3
19-Jan-2018 Astellas Page 74 of 108
2.2Percentage of subjects achieving ACR20 response at Week 8 and sustaining response at Week 12
X Placebo, 100mg, 150mg, Reference Logistic regression
3.1Percentage of subjects achieving DAS28 score < 2.6 at each visit (Baseline, Weeks 4, 8, 12, 12/ET)
X X Placebo, 100mg, 150mg, Reference Logistic regression
3.2Percentage of subjects achieving DAS28 score < 2.6 at each visit (Baseline, Weeks 4, 8, 12, 16, 20, 24, 28, 32, 36, 40, 44, 48, 52, EOT)
X X
100mg, 150mg, Placebo to 100mg at Week 12, Placebo to 150mg at Week 12, Reference
No statistical test
3.3Percentage of subjects achieving DAS28 score <= 3.2 at each visit (Baseline, Weeks 4, 8, 12, 12/ET)
X X Placebo, 100mg, 150mg, Reference Logistic regression
3.4Percentage of subjects achieving DAS28 score <=3.2 at each visit (Baseline, Weeks 4, 8, 12, 16, 20, 24, 28, 32, 36, 40, 44, 48, 52, EOT)
X X 100mg, 150mg, Reference No statistical test
4.1Percentage of subjects achieving "Good Response" using DAS28 EULAR response criterion at each visit (Baseline, Weeks 4, 8, 12, 12/ET)
X X Placebo, 100mg, 150mg, Reference Logistic regression
4.2
Percentage of subjects achieving "Good Response" using DAS28 EULAR response criterion at each visit (Baseline, Weeks 4, 8, 12, 16, 20, 24, 28, 32, 36, 40, 44, 48, 52, EOT)
X X 100mg, 150mg, Reference No statistical test
5.1Percentage of subjects achieving "Good Response" or "Moderate Response" using DAS28 EULAR response criterion at each visit (Baseline, Weeks 4, 8, 12, 12/ET)
X X Placebo, 100mg, 150mg, Reference Logistic regression
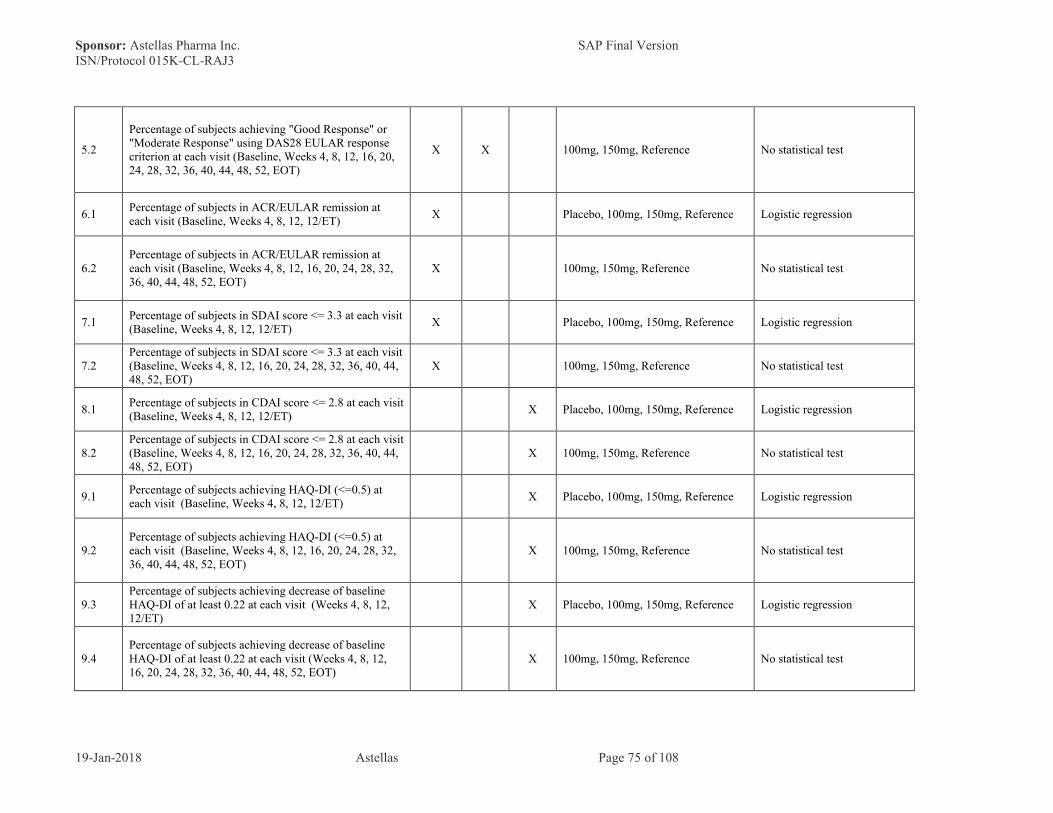
Sponsor: Astellas Pharma Inc. SAP Final VersionISN/Protocol 015K-CL-RAJ3
19-Jan-2018 Astellas Page 75 of 108
5.2
Percentage of subjects achieving "Good Response" or "Moderate Response" using DAS28 EULAR response criterion at each visit (Baseline, Weeks 4, 8, 12, 16, 20, 24, 28, 32, 36, 40, 44, 48, 52, EOT)
X X 100mg, 150mg, Reference No statistical test
6.1Percentage of subjects in ACR/EULAR remission at each visit (Baseline, Weeks 4, 8, 12, 12/ET)
X Placebo, 100mg, 150mg, Reference Logistic regression
6.2Percentage of subjects in ACR/EULAR remission at each visit (Baseline, Weeks 4, 8, 12, 16, 20, 24, 28, 32, 36, 40, 44, 48, 52, EOT)
X 100mg, 150mg, Reference No statistical test
7.1Percentage of subjects in SDAI score <= 3.3 at each visit (Baseline, Weeks 4, 8, 12, 12/ET)
X Placebo, 100mg, 150mg, Reference Logistic regression
7.2Percentage of subjects in SDAI score <= 3.3 at each visit (Baseline, Weeks 4, 8, 12, 16, 20, 24, 28, 32, 36, 40, 44, 48, 52, EOT)
X 100mg, 150mg, Reference No statistical test
8.1Percentage of subjects in CDAI score <= 2.8 at each visit (Baseline, Weeks 4, 8, 12, 12/ET)
X Placebo, 100mg, 150mg, Reference Logistic regression
8.2Percentage of subjects in CDAI score <= 2.8 at each visit (Baseline, Weeks 4, 8, 12, 16, 20, 24, 28, 32, 36, 40, 44, 48, 52, EOT)
X 100mg, 150mg, Reference No statistical test
9.1Percentage of subjects achieving HAQ-DI (<=0.5) at each visit (Baseline, Weeks 4, 8, 12, 12/ET)
X Placebo, 100mg, 150mg, Reference Logistic regression
9.2Percentage of subjects achieving HAQ-DI (<=0.5) at each visit (Baseline, Weeks 4, 8, 12, 16, 20, 24, 28, 32, 36, 40, 44, 48, 52, EOT)
X 100mg, 150mg, Reference No statistical test
9.3Percentage of subjects achieving decrease of baseline HAQ-DI of at least 0.22 at each visit (Weeks 4, 8, 12, 12/ET)
X Placebo, 100mg, 150mg, Reference Logistic regression
9.4Percentage of subjects achieving decrease of baseline HAQ-DI of at least 0.22 at each visit (Weeks 4, 8, 12, 16, 20, 24, 28, 32, 36, 40, 44, 48, 52, EOT)
X 100mg, 150mg, Reference No statistical test

Sponsor: Astellas Pharma Inc. SAP Final VersionISN/Protocol 015K-CL-RAJ3
19-Jan-2018 Astellas Page 76 of 108
10.1Percentage of subjects achieving SF-36v2 of difference >= 5 at each visit (Baseline, Weeks 4, 8, 12, 12/ET)
X Placebo, 100mg, 150mg, Reference Logistic regression
10.2Percentage of subjects achieving SF-36v2 of difference >= 5 at each visit (Baseline, Weeks 4, 8, 12, 16, 20, 24, 28, 32, 36, 40, 44, 48, 52, EOT)
X 100mg, 150mg, Reference No statistical test
Continuous Variables
11.1.1.1
Raw value and change from baseline in DAS28 score at each visit (Baseline, Weeks 4, 8, 12, 12/ET)
X X Placebo, 100mg, 150mg, ReferenceDescriptive StatisticsANCOVA3 analysis with each visit
11.1.1.2
Raw value and change from baseline in DAS28 score at each visit (Baseline, Weeks 4, 8, 12, 12/ET) Subgroup Analysis (Study Region, Protocol Version Number)
X X Placebo, 100mg, 150mg, ReferenceDescriptive StatisticsANCOVA3 analysis with each visit
11.1.2Raw value and change from baseline in DAS28 score at each visit (Baseline, Weeks 4, 8, 12, 16, 20, 24, 28, 32, 36, 40, 44, 48, 52, EOT)
X X
100mg, 150mg, Reference, Placebo to 100mg at Week 12, Placebo to 150mg at Week 12, Reference
Descriptive Statistics
11.2.1 Mean-standard deviation plot of 11.1.1 X X Placebo, 100mg, 150mg, Reference Descriptive Statistics
11.2.2 Mean-standard deviation plot of 11.1.2 X X
100mg, 150mg, Placebo to 100mg at Week 12, Placebo to 150mg at Week 12, Reference
Descriptive Statistics

Sponsor: Astellas Pharma Inc. SAP Final VersionISN/Protocol 015K-CL-RAJ3
19-Jan-2018 Astellas Page 77 of 108
12.1Raw values and change from baseline in SDAI score at each visit (Baseline, Weeks 4, 8, 12, 12/ET)
X Placebo, 100mg, 150mg, ReferenceDescriptive StatisticsANCOVA3 analysis with each visit
12.2Raw values and change from baseline in SDAI score at each visit (Baseline, Weeks 4, 8, 12, 16, 20, 24, 28, 32, 36, 40, 44, 48, 52, EOT)
X 100mg, 150mg, Reference Descriptive Statistics
13.1Raw values and change from baseline in CDAI score at each visit (Baseline, Weeks 4, 8, 12, 12/ET)
X Placebo, 100mg, 150mg, ReferenceDescriptive StatisticsANCOVA3 analysis with each visit
13.2Raw values and change from baseline in CDAI score at each visit (Baseline, Weeks 4, 8, 12, 16, 20, 24, 28, 32, 36, 40, 44, 48, 52, EOT)
X 100mg, 150mg, Reference Descriptive Statistics
14.1Raw values and change from baseline in SF-36v2 at each visit (Baseline, Weeks 4, 8, 12, 12/ET)
X Placebo, 100mg, 150mg, ReferenceDescriptive StatisticsANCOVA3 analysis with each visit
14.2Raw values and change from baseline in SF-36v2 at each visit (Baseline, Weeks 4, 8, 12, 28, 52, EOT)
X 100mg, 150mg, Reference Descriptive Statistics
15.1Raw values and change from baseline in WPAI at each visit (Baseline, Weeks 4, 8, 12, 12/ET)
X Placebo, 100mg, 150mg, ReferenceDescriptive StatisticsANCOVA3 analysis with each visit
15.2Raw values and change from baseline in WPAI at each visit (Baseline, Weeks 4, 8, 12, 28, 52, EOT)
X 100mg, 150mg, Reference Descriptive Statistics
16.1Raw value and change from baseline in TJC68 at each visit (Baseline, Weeks 4, 8, 12, 12/ET)
X Placebo, 100mg, 150mg, ReferenceDescriptive StatisticsANCOVA3 analysis with each visit
16.2Raw value and change from baseline in TJC68 at each visit (Baseline, Weeks 4, 8, 12, 16, 20, 24, 28, 32, 36, 40, 44, 48, 52, EOT)
X 100mg, 150mg, Reference Descriptive Statistics
17.1Raw value and change from baseline in TJC28 at each visit (Baseline, Weeks 4, 8, 12, 12/ET)
X Placebo, 100mg, 150mg, ReferenceDescriptive StatisticsANCOVA3 analysis with each visit
17.2Raw value and change from baseline in TJC28 at each visit (Baseline, Weeks 4, 8, 12, 16, 20, 24, 28, 32, 36, 40, 44, 48, 52, EOT)
X 100mg, 150mg, Reference Descriptive Statistics

Sponsor: Astellas Pharma Inc. SAP Final VersionISN/Protocol 015K-CL-RAJ3
19-Jan-2018 Astellas Page 78 of 108
18.1Raw value and change from baseline in SJC66 at each visit (Baseline, Weeks 4, 8, 12, 12/ET)
X Placebo, 100mg, 150mg, ReferenceDescriptive StatisticsANCOVA3 analysis with each visit
18.2Raw value and change from baseline in SJC66 at each visit (Baseline, Weeks 4, 8, 12, 16, 20, 24, 28, 32, 36, 40, 44, 48, 52, EOT)
X 100mg, 150mg, Reference Descriptive Statistics
19.1Raw value and change from baseline in SJC28 at each visit (Baseline, Weeks 4, 8, 12, 12/ET)
X Placebo, 100mg, 150mg, ReferenceDescriptive StatisticsANCOVA3 analysis with each visit
19.2Raw value and change from baseline in SJC28 at each visit (Baseline, Weeks 4, 8, 12, 16, 20, 24, 28, 32, 36, 40, 44, 48, 52, EOT)
X 100mg, 150mg, Reference Descriptive Statistics
20.1Raw value and change from baseline in CRP at each visit (Baseline, Weeks 4, 8, 12, 12/ET)
X Placebo, 100mg, 150mg, ReferenceDescriptive StatisticsANCOVA3 analysis with each visit
20.2Raw value and change from baseline in CRP at each visit (Baseline, Weeks 4, 8, 12, 16, 20, 24, 28, 32, 36, 40, 44, 48, 52, EOT)
X 100mg, 150mg, Reference Descriptive Statistics
21.1Raw value and change from baseline in ESR at each visit (Baseline, Weeks 4, 8, 12, 12/ET)
X Placebo, 100mg, 150mg, ReferenceDescriptive StatisticsANCOVA3 analysis with each visit
21.2Raw value and change from baseline in ESR at each visit (Baseline, Weeks 4, 8, 12, 16, 20, 24, 28, 32, 36, 40, 44, 48, 52, EOT)
X 100mg, 150mg, Reference Descriptive Statistics
22.1Raw value and change from baseline in SGAP (100 mm VAS) at each visit (Baseline, Weeks 4, 8, 12, 12/ET)
X Placebo, 100mg, 150mg, ReferenceDescriptive StatisticsANCOVA3 analysis with each visit
22.2Raw value and change from baseline in SGAP (100 mm VAS) at each visit (Baseline, Weeks 4, 8, 12, 16, 20, 24, 28, 32, 36, 40, 44, 48, 52, EOT)
X 100mg, 150mg, Reference Descriptive Statistics
23.1Raw value and change from baseline in SGA (100 mm VAS) at each visit (Baseline, Weeks 4, 8, 12, 12/ET)
X Placebo, 100mg, 150mg, ReferenceDescriptive StatisticsANCOVA3 analysis with each visit

Sponsor: Astellas Pharma Inc. SAP Final VersionISN/Protocol 015K-CL-RAJ3
19-Jan-2018 Astellas Page 79 of 108
23.2Raw value and change from baseline in SGA (100 mm VAS) at each visit (Baseline, Weeks 4, 8, 12, 16, 20, 24, 28, 32, 36, 40, 44, 48, 52, EOT)
X 100mg, 150mg, Reference Descriptive Statistics
24.1Raw value and change from baseline in PGA (100 mm VAS) at each visit (Baseline, Weeks 4, 8, 12, 12/ET)
X Placebo, 100mg, 150mg, ReferenceDescriptive StatisticsANCOVA3 analysis with each visit
24.2Raw value and change from baseline in PGA (100 mm VAS) at each visit (Baseline, Weeks 4, 8, 12, 16, 20, 24, 28, 32, 36, 40, 44, 48, 52, EOT)
X 100mg, 150mg, Reference Descriptive Statistics
25.1Raw value and change from baseline in HAQ-DI at each visit (Baseline, Weeks 4, 8, 12, 12/ET)
X Placebo, 100mg, 150mg, ReferenceDescriptive StatisticsANCOVA3 analysis with each visit
25.2Raw value and change from baseline in HAQ-DI at each visit (Baseline, Weeks 4, 8, 12, 16, 20, 24, 28, 32, 36, 40, 44, 48, 52, EOT)
X 100mg, 150mg, Reference Descriptive Statistics
Time-to-event Variable
26Time to the first occurrence of ACR20/50/70 up to Week 12
X Placebo, 100mg, 150mg, ReferenceCoxKaplan-MeierLog-rank
27Time to the first occurrence of DAS28-CRP <= 2.6 up to Week 12
X Placebo, 100mg, 150mg, ReferenceCoxKaplan-MeierLog-rank
28Time to the first occurrence of SDAI score <= 3.3 up to Week 12
X Placebo, 100mg, 150mg, ReferenceCoxKaplan-MeierLog-rank
29Time to the first occurrence of CDAI score <= 2.8 up to Week 12
X Placebo, 100mg, 150mg, ReferenceCoxKaplan-MeierLog-rank
30Time to the first occurrence of ACR/EULAR score for remission up to Week 12
X Placebo, 100mg, 150mg, ReferenceCoxKaplan-MeierLog-rank
Additional (Graphical Analysis)
31
Two-panel line graphs of DAS28 over time up to Week 12 for ACR20 responders and non-responders at Week 12/ET (responders in 1 panel, non-responders in other panel)
X X Placebo, 100mg, 150mg, Reference Descriptive Statistics

Sponsor: Astellas Pharma Inc. SAP Final VersionISN/Protocol 015K-CL-RAJ3
19-Jan-2018 Astellas Page 80 of 108
1 Abbreviations are defined in Section I, and all analyses will be based on the FAS.
2 See Section 7.4.2 for modeling details on Logistic regression, ANCOVA, Kaplan-Meier, Cox proportional hazards, and Log-rank test.
3 ANCOVA for change only. For raw value, only descriptive statistics will be presented.

Sponsor: Astellas Pharma Inc. SAP Final VersionISN/Protocol 015K-CL-RAJ3
19-Jan-2018 Astellas Page 81 of 108
10.3 Appendix 3: Overview of AE analysis
Table20, Table21 summarize the analyses of AE occurrence, the analysis of SOC, PT analysis, with "X1", and "X2" indicating that the variable will be analyzed by each defined groups defined footnote. All analyses will be based on the SAF.
Table 20. The overview of AE occurrence analysis
OverallWeek 0 to Week 12
Week 12 to Week 52 or Later
Number and percentage of subjects with TEAE X3 X1 X2
Number and percentage of subjects with drug related TEAE
X3 X1 X2
Number and percentage of subjects with death X3 X1 X2
Number and percentage of subjects with serious TEAE
X3 X1 X2
Number and percentage of subjects with Grade 3 or Higher in Severity TEAE
X3 X1 X2
Number and percentage of subjects with drug related serious TEAE
X3 X1 X2
Number and percentage of subjects with TEAE leading to permanent discontinuation of study drug or reference drug
X3 X1 X2
Number and percentage of subjects with drug related TEAE leading to permanent discontinuation of study drug or reference drug
X3 X1 X2
Number and percentage of subjects with serious TEAE leading to permanent discontinuation of study drug or reference drug
X3 X1 X2
Number and percentage of subjects with drug related serious TEAE leading to permanent discontinuation of study drug or reference drug
X3 X1 X2
Regarding the overview of AE occurrence analysis described above, subgroup analysis based on study region will be also presented.X1: Placebo, 100mg, 150mg, ReferenceX2: 100mg, 150mg, Placebo to 100 mg at Week 12, Placebo to 150 mg at Week12, ReferenceX3: 100mg, 150mg, Reference
Table 21. The overview of the number of SOC/PT analysis
OverallWeek 0 to Week 12
Week 12 to Week 52 or Later
TEAEs X3#2 X1#2 X2#2
Drug related TEAEs, defined as any TEAE with possible, probable or missing relationship to study drug
X3#2 X1#2 X2#2

Sponsor: Astellas Pharma Inc. SAP Final VersionISN/Protocol 015K-CL-RAJ3
19-Jan-2018 Astellas Page 82 of 108
as assessed by the investigator.
Serious TEAEs X3#2 X1#1 X2#2
Drug related serious TEAEs X1
TEAEs by severity based on NCI-CTCAE X3 X1
Drug related TEAEs by severity X1
Grade 3 or higher TEAEs by severity X3 X1
TEAEs by relationship to study drug X1
TEAEs leading to death X3 X1 X2
TEAEs leading to permanent discontinuation of study drug or reference drug
X3#2 X1#2 X2#2
Drug related TEAEs leading to permanent discontinuation of study drug or reference drug
X1
Serious TEAEs leading to permanent discontinuation of study drug or reference drug
X1
Drug related serious TEAEs leading to permanent discontinuation of study drug or reference drug
X1
TEAEs excluding serious adverse events that equal to or Exceed a threshold of 5% in Any Treatment Group
X2
Most common TEAEs (> 5% in any treatment group) X3 X1 X2
Most common serious TEAEs (> 5% in any treatment group)
X3 X1 X2
TEAEs by subgroups defined in Section 7.8. X1
The number and percentage of subjects with TEAEs of special interest
X3 X1
Serious Infections X3#1 X1#1
Malignancies X3#1 X1#1
Herpes Zoster Related Disease (Herpes Zoster and Varicella)
X3#1 X1#1
Herpes Zoster X3 X1
Varicella X3 X1
Infections That Require Intravenous Anti-infectious Therapy
X3 X1
Subgroup of TEAEs X1
Sex X1
Age Group X1
Prior Anti-TNF DMARD Use X1
Prior Biologic DMARD-IR X1
Concomitant DMARD Use at Baseline X1
Study Region X1
Duration of RA X1

Sponsor: Astellas Pharma Inc. SAP Final VersionISN/Protocol 015K-CL-RAJ3
19-Jan-2018 Astellas Page 83 of 108
Number of Prior DMARDs Used X1
Number of Prior Biologic DMARDs Used X1
MTX Dose at Baseline X1
Concomitant DMARD Category at Baseline X1
Protocol Version Number X1
Concomitant Steroid at Baseline X1
Prednisone Dose at Baseline X1
Subgroup of TEAEs of special interest X1
Sex X1
Age Group X1
Concomitant Steroid at Baseline X1
Prednisone Dose at Baseline X1X1: Placebo, 100mg, 150mg, ReferenceX2: 100mg, 150mg, Placebo to 100 mg at Week 12, Placebo to 150 mg at Week12, ReferenceX3: 100mg, 150mg, Reference#1: Subgroup analysis based on study region or protocol version number will be also presented.#2: Subgroup analysis based on study region will be also presented.
Table 22. Patient-year analysis
Week 0 to Week 12
Overall Period
TEAEs (provided by “Definition 2” in 7.5.1.2) X1 X3
TEAEs of special interest (provided by “Definition 1” in 7.5.1.2)
X1 X3
Serious Infections X1 X3
Malignancies X1 X3
Herpes Zoster Related Disease (Herpes Zoster and Varicella)
X1 X3
Herpes Zoster X1 X3
Varicella X1 X3
Infections That Require Intravenous Anti-infectious Therapy
X1 X3
Subgroup X3
Sex X3Age Group X3Concomitant Steroid at Baseline X3
Prednisone Dose at Baseline X3X1: Placebo, 100mg, 150mg, ReferenceX3: 100mg, 150mg, Reference

Sponsor: Astellas Pharma Inc. SAP Final VersionISN/Protocol 015K-CL-RAJ3
19-Jan-2018 Astellas Page 84 of 108
10.4 Appendix 4: Overview of Clinical Laboratory Evaluation, Vital Sings, and Electrocardiograms (ECGs) analyses
Table23 summarizes the analyses of Clinical Laboratory Evaluation, Vital Sings, and Electrocardiograms (ECGs), with "X1", "X2", "X3" indicating that the variable will be analyzed by each defined groups defined footnote. All analyses will be based on the SAF.
Table 23. The overview of Clinical Laboratory Evaluation, Vital Sings, and Electrocardiograms (ECGs) analyses
Screening, Baseline, Weeks 4, 8, 12, 12/ET
Screening, Baseline, Weeks 4, 8, 12, 16, 20, 24, 28, 32, 36, 40, 44, 48, 52, EOT
Clinical Laboratory Evaluation
Quantitative Laboratory Test Results in SI Units, Hematology X1#1 X2#1
Actual and Change from Baseline
Quantitative Laboratory Test Results in SI Units, Biochemistry X1#1 X2#1
Actual and Change from Baseline
Quantitative Laboratory Test Results in SI Units, Urinalysis X1#1 X2#1
Actual and Change from Baseline
Qualitative Laboratory Test Results, UrinalysisX1#2 X2#2
Quantitative Laboratory Test Results in SI Units,Fasting Lipids Profile X1#1 X2#1
Actual and Change from Baseline
Quantitative Laboratory Test Results in SI Units, T-Chol/HDL, LDL/HDL Ratio X1#1 X2#1
Actual and Change from Baseline
Quantitative Laboratory Test Results in SI Units, Erythrocyte Sedimentation Rate (ESR) X1#1 X2#1
Actual and Change from Baseline
Shift-from-Baseline Table for Laboratory Test Results, Hematology X1 X3Baseline to Lowest Value up to Week 12 /EOT
Shift-from-Baseline Table for Laboratory Test Results, Hematology X1 X3Baseline to Highest Value up to Week 12 /EOT
Shift-from-Baseline Table for Laboratory Test Results, Biochemistry X1 X3Baseline to Lowest Value up to Week 12 /EOT

Sponsor: Astellas Pharma Inc. SAP Final VersionISN/Protocol 015K-CL-RAJ3
19-Jan-2018 Astellas Page 85 of 108
Shift-from-Baseline Table for Laboratory Test Results, Biochemistry X1 X3Baseline to Highest Value up to Week 12 /EOT
Shift-from-Baseline Table for Laboratory Test Results, Urinalysis X1 X3Baseline to Lowest Value up to Week 12 /EOT
Shift-from-Baseline Table for Laboratory Test Results, Urinalysis X1 X3Baseline to Highest Value up to Week 12 /EOT
Shift-from-Baseline Table for Laboratory Test Results, Fasting Lipid Profile X1 X3Baseline to Lowest Value up to Week 12 /EOT
Shift-from-Baseline Table for Laboratory Test Results, Fasting Lipid Profile X1 X3Baseline to Highest Value up to Week 12 /EOT
Shift-from-Baseline Table in Pre-Specified Reference Range Laboratory test Results by Visit, Selected Laboratory Variables
X1#1 X2#1
Aspartate Aminotransferase (AST) X1#1 X2#1
Alanine Aminotransferase (ALT) X1#1 X2#1
Alkaline Phosphatase (ALP) X1#1 X2#1
Total Bilirubin Category 1 X1#1 X2#1
Total Bilirubin Category 2 X1#1 X2#1
Low-Density Lipoprotein (LDL) Category 1 X1#1 X2#1
Low-Density Lipoprotein (LDL) Category 2 X1#1 X2#1
Hemoglobin (HGB) Category 1 X1#1 X2#1
Hemoglobin (HGB) Category 2 X1#1 X2#1
Hemoglobin (HGB) Category 3 X1#1 X2#1
Creatine Phosphokinase (CPK) Category 1 X1#1 X2#1
Creatine Phosphokinase (CPK) Category 2 X1#1 X2#1
Creatine Phosphokinase (CPK) Category 3 X1#1 X2#1
Creatinine X1#1 X2#1
Absolute Neutrophil Count (ANC) X1#1 X2#1
Lymphocytes Category 1 X1#1 X2#1
Lymphocytes Category 2 X1#1 X2#1
Platelets Category 1 X1#1 X2#1
Platelets Category 2 X1#1 X2#1
Shift-from-Baseline Table for Selected Laboratory Variables using NCI-CTCAE Toxicity Grade (version 4.0) Baseline to Week 12/ET /EOT
X1 X3

Sponsor: Astellas Pharma Inc. SAP Final VersionISN/Protocol 015K-CL-RAJ3
19-Jan-2018 Astellas Page 86 of 108
Liver Function Analysis up to Week 12/ for Overall Period
X1#1 X2#1
Clinically Significant Values in Liver Function Tests X1#1 X2#1
Summary of Moderate and Marked Liver Abnormalities by Visit
X1#1 X2#1
Liver Functions Plots X1#1 X2#1
Vital Signs
Vital SignsX1 X2
Actual and Change from Baseline
ECG ResultsInterpretation of 12- Lead ECG Results, Assessment by Investigator X1 X2Shift-from-Screening Table for 12-Lead ECG
X1: Placebo, 100mg, 150mg, ReferenceX2: 100mg, 150mg, Placebo to 100 mg at Week 12, Placebo to 150 mg at Week 12, ReferenceX3: 100mg, 150mg, Reference#1: Subgroup analysis based on study region will be also presented.#2: Subgroup analysis based on study region will be presented only.

Sponsor: Astellas Pharma Inc. SAP Final VersionISN/Protocol 015K-CL-RAJ3
19-Jan-2018 Astellas Page 87 of 108
10.5 Appendix 5: Computation of HAQ-DI Score
The HAQ-DI is composed of 20 items in 8 categories (Dressing and Grooming, Arising, Eating, Walking, Hygiene, Reach, Grip, and Activities). Each category has at least two questions. Within each category, subjects report the amount of difficulty they have in performing the specific question items.
Table 24. Classification of HAQ Question and Checkbox for computation of HAQ-DI Score
Category Question Checkbox
1. Dressing and Grooming
1) Dress yourself, including shoelaces and buttons
2) Shampoo your hair
● 1 "aids or devices" check box: o Devices used for dressing
(button hook, zipper pull, etc.)
● 1 "help from another person"checkbox: o Dressing and grooming
2. Arising 1) Stand up from a straight chair
2) Get in and out of bed
● 1 "aids or devices" checkbox: o Special or built up chair
● 1 "help from another person"checkbox: o Arising
3. Eating 1) Cut your own meat2) Lift a full cup or glass to
your mouth3) Open a new milk carton
● 1 "aids or devices" checkbox: o Built up or special utensils
● 1 "help from another person"checkbox: o Eating
4. Walking 1) Walk outdoors on flat ground
2) Climb up five steps
● 4 "aids or devices" checkboxes: o Cane
o Walkero Crutcheso Wheelchair
● 1 "help from another person"checkbox: o Walking
5. Hygiene 1) Wash and dry your body2) Take a tub bath3) Get on and off the toilet
● 4 "aids or devices" checkboxes: o Raised toilet seato Bathtub seato Bathtub baro Long-handled appliances in
bathroom● 1 "help from another person"
checkbox:o Hygiene

Sponsor: Astellas Pharma Inc. SAP Final VersionISN/Protocol 015K-CL-RAJ3
19-Jan-2018 Astellas Page 88 of 108
Category Question Checkbox
6. Reach 1) Reach and get down a 5 pound object (such as a bag of sugar) from above your head
2) Bend down to pick up clothing from the floor
● 1 "aids or devices" checkbox: o Long-handled appliances for
reach● 1 "help from another person"
checkbox:o Reach
7. Grip 1) Open car doors2) Open previously opened
jars 3) Turn faucets on and off
● 1 "aids or devices" checkbox:o Jar opener (for jars previously
opened)● 1 "help from another person"
checkbox:o Gripping and opening things
8. Activities 1) Run errands and shop2) Get in and out of a car3) Do chores such as
vacuuming or yard work
● 1 "help from another person"checkbox:o Errands and chores
For each question, there are four response options ranging from "Without Any Difficulty" to "Unable to Do", scored 0 - 3. Details are as follows.
Response Score
Without Any Difficulty 0
With Some Difficulty 1
With Much Difficulty 2Unable to Do 3
The patient must have a score for >= 6 of the 8 categories. If there are less than 6 categories completed, a HAQ-DI cannot be computed, whether the missing categories are due to missing values or they do not apply to the respondent. Individual questions within a category are not imputed. Therefore the maximum score in each category is based on non-missing questions, and a category score is missing when all questions within a category are missing.
There are three steps to compute the HAQ-DI score.
1. For each category, compute the category score by using the highest question score. ● For example, in the category "Eating" there are 3 questions, a subject responds with a 1,
2, and 0, respectively.

Sponsor: Astellas Pharma Inc. SAP Final VersionISN/Protocol 015K-CL-RAJ3
19-Jan-2018 Astellas Page 89 of 108
Category QuestionSubject Reported
ResponseEating 1) Cut your own meat 1
2) Lift a full cup or glass to your mouth
2
3) Open a new milk carton 0
● The highest score is 2, so the category score is 2 for this subject. 2. Adjust for use of "aids or devices" and/or "help from another person" when indicated in
the checkbox(es)● If the category score is < 2 but at least one "aids or devices" or "help from another
person" box is checked, the category score is set equal to 2. ● If the category score is < 2 and none of the "aids or devices" or "help from another
person" boxes is checked, the category score remains. ● If the category score is 2, it remains 2, and if a three, it remains a three.
3. Divide the summed category scores by the number of categories answered (must be a minimum of 6) to obtain a HAQ-DI score of 0 – 3, with higher scores indicating greater disability (3 = worst functioning).

Sponsor: Astellas Pharma Inc. SAP Final VersionISN/Protocol 015K-CL-RAJ3
19-Jan-2018 Astellas Page 90 of 108
10.6 Appendix 6: Computation of SF-36v2® Score
The SF-36v2® will be scored for the 8 scales according to the standard SF-36v2® scoring algorithm (0-100 scale) explained in the SF-36v2® Japanese Manual (Fukuhara et al., 2011). The physical component score (PCS), mental component score (MCS), role/social component score (RCS) will be scored according to the standard SF-36v2® scoring algorithm (0-100 scale) explained in the same Manual. A higher score indicates a better health state. Prior to the analysis, the responses will be scored according to the following four steps.
1. Item recoding for the 10 items which require recoding2. Computing raw scale scores by summing across items within the same scale (raw scale
scores)3. Transforming the raw scale scores into a 0-100 scale (transformed scale scores) 4. Normalizing the transformed scale scores with a mean of 50 and a standard deviation of
10 in the general Japanese population (norm-based scale scores)
Questions, coding and scoring of the 8 scales (Physical Functioning, Role-Physical, Bodily Pain, General Health, Vitality, Social Functioning, Role-Emotional, Metal Health), PCS and MCS are presented below.
Table 25.1. Physical Functioning: Verbatim Items and Scoring InformationQuestionNumber Verbatim Items
3.The following questions are about activities you might do during a typical day. Does your health now limit you in these activities? If so, how much?
3a.Vigorous activities, such as running, lifting heavy objects, participating in strenuous sports
3b.Moderate activities, such as moving a table, pushing a vacuum cleaner, bowling, or playing golf
3c. Lifting or carrying groceries3d. Climbing several flights of stairs3e. Climbing one flight of stairs3f. Bending, kneeling, or stooping3g. Walking more than a mile3h. Walking several hundred yards3i. Walking one hundred yards3j. Bathing or dressing yourself
Precoded and Final Values for Items 3a through 3jResponse Choices Precoded Item Value Final Item Value
Yes, limited a lot 1 1Yes, limited a little 2 2No, not limited at all 3 3

Sponsor: Astellas Pharma Inc. SAP Final VersionISN/Protocol 015K-CL-RAJ3
19-Jan-2018 Astellas Page 91 of 108
Table 25.2. Role-Physical: Verbatim Items and Scoring InformationQuestion Number Verbatim Items
4. During the past 4 weeks, how much of the time have you had any of the following problems with your work or other regular daily activities as a result of your physical health?
4a. Cut down the amount of time you spent on work or other activities4b. Accomplished less than you would like4c. Were limited in the kind of work or other activities4d. Had difficulty performing the work or other activities (for example, it took
extra effort)
Precoded and Final Values for Items 4a through 4dResponse Choices Precoded Item Value Final Item Value
All of the time 1 1Most of the time 2 2Some of the time 3 3A little of the time 4 4None of the time 5 5
Table 25.3. Bodily Pain: Verbatim Items and Scoring InformationQuestion Number Verbatim Items7. How much bodily pain have you had during the past 4 weeks?8. During the past 4 weeks, how much did pain interfere with your normal
work (including both work outside the home and housework)?
Precoded and Final Values for Item 7Response Choices Precoded Item Value Final Item Value
None 1 6.0Very mild 2 5.4Mild 3 4.2Moderate 4 3.1Severe 5 2.2Very Severe 6 1.0

Sponsor: Astellas Pharma Inc. SAP Final VersionISN/Protocol 015K-CL-RAJ3
19-Jan-2018 Astellas Page 92 of 108
Scoring for Item 8 if both Items 7 and 8 are AnsweredResponse Choices
If Item 8 Precoded Item Value
And Item 7 Precoded
Item ValueThen Final Item
Value
Not at all 1 1 61 2 through 6 5
A little bit 2 1 through 6 4Moderately 3 1 through 6 3Quite a bit 4 1 through 6 2Extremely 5 1 through 6 1
Scoring for Item 8 if Item 7 is Not AnsweredResponse Choices Precoded Item Value Then Final Item Value
Not at all 1 6.0A little bit 2 4.75Moderately 3 3.5Quite a bit 4 2.25Extremely 5 1.0
Table 25.4. General Health: Verbatim Items and Scoring InformationQuestion Number Verbatim Items1. In general, would you say your health is :11. How TRUE or FALSE is each of the following statements for
you?11a. I seem to get sick a little easier than other people11b. I am as healthy as anybody I know11c. I expect my health to get worse11d. My health is excellent

Sponsor: Astellas Pharma Inc. SAP Final VersionISN/Protocol 015K-CL-RAJ3
19-Jan-2018 Astellas Page 93 of 108
Precoded and Final Values for Items 1 and 11a through 11dItem 1 Response Choices Precoded Item Value Final Item Value
Excellent 1 5.0Very good 2 4.4Good 3 3.4Fair 4 2.0Poor 5 1.0
Items 11a and 11c Response Choices Precoded Item Value Final Item ValueDefinitely True 1 1Mostly True 2 2Don't Know 3 3Mostly False 4 4Definitely False 5 5
Items 11b and 11d Response Choices Precoded Item Value Final Item Value
Definitely True 1 5Mostly True 2 4Don't Know 3 3Mostly False 4 2Definitely False 5 1
Table 25.5. Vitality: Verbatim Items and Scoring InformationQuestion Number Verbatim Items
9. These questions are about how you feel and how things have been with you during the past 4 weeks. For each question, please give the one answer that comes closest to the way you have been feeling. How much of the time during the past 4 weeks …
9a. Did you feel full of life?9e. Did you have a lot of energy?9g. Did you feel worn out?9i. Did you feel tired?

Sponsor: Astellas Pharma Inc. SAP Final VersionISN/Protocol 015K-CL-RAJ3
19-Jan-2018 Astellas Page 94 of 108
Precoded and Final Values for Items 9a, 9e, 9g and 9iItem 9a and 9e Response Choices Precoded Item Value Final Item Value
All of the time 1 5Most of the time 2 4Some of the time 3 3A little of the time 4 2None of the time 5 1
Items 9g and 9i Response Choices Precoded Item Value Final Item ValueAll of the time 1 1Most of the time 2 2Some of the time 3 3A little of the time 4 4None of the time 5 5
Table 25.6. Social Functioning: Verbatim Items and Scoring InformationQuestion Number Verbatim Items6. During the past 4 weeks, to what extent has your physical health or
emotional problems interfered with your normal social activities with family, friends, neighbors, or groups?
10. During the past 4 weeks, how much of the time has your physical health or emotional problems interfered with your social activities (like visiting with
friends, relatives, etc.)?
Precoded and Final Values for Items 6 and 10Item 6 Response Choices Precoded Item Value Final Item Value
Not at all 1 5Slightly 2 4Moderately 3 3Quite a bit 4 2Extremely 5 1
Item 10 Response Choices Precoded Item Value Final Item ValueAll of the time 1 1Most of the time 2 2Some of the time 3 3A little of the time 4 4None of the time 5 5

Sponsor: Astellas Pharma Inc. SAP Final VersionISN/Protocol 015K-CL-RAJ3
19-Jan-2018 Astellas Page 95 of 108
Table 25.7. Role-Emotional: Verbatim Items and Scoring InformationQuestion Number Verbatim Items5. During the past 4 weeks, how much of the time have you had any of the
following problems with your work or other regular daily activities as a result of any emotional problems (such as feeling depressed or anxious)?
5a. Cut down on the amount of time you spent on work or other activities5b. Accomplished less than you would like5c. Did work or other activities less carefully than usual
Precoded and Final Values for Items 5a through 5cItem 5a through 5c Response Choices Precoded Item Value Final Item Value
All of the time 1 1Most of the time 2 2Some of the time 3 3A little of the time 4 4None of the time 5 5
Table 25.8. Mental Health: Verbatim Items and Scoring InformationQuestion Number Verbatim Items9. These questions are about how you feel and how things have been with you
during the past 4 weeks. For each question, please give the one answer that comes closest to the way you have been feeling. How much of the time during the past 4 weeks …
9b. Have you been very nervous?9c. Have you felt so down in the dumps that nothing could cheer you up?9d. Have you felt calm and peaceful?9f. Have you felt downhearted and depressed?9h. Have you been happy?

Sponsor: Astellas Pharma Inc. SAP Final VersionISN/Protocol 015K-CL-RAJ3
19-Jan-2018 Astellas Page 96 of 108
Precoded and Final Values for Items 9b, 9c, 9d, 9f and 9hItems 9b, 9c and 9f Response Choices Precoded Item Value Final Item Value
All of the time 1 1Most of the time 2 2Some of the time 3 3A little of the time 4 4None of the time 5 5
Item 9d and 9h Response Choices Precoded Item Value Final Item ValueAll of the time 1 5Most of the time 2 4Some of the time 3 3A little of the time 4 2None of the time 5 1
Table 25.9. Reported Health Transition: Verbatim Items and Scoring InformationQuestion Number Verbatim Items2. Compared to one year ago, how would you rate your health in general now?
Precoded and Final Values for Item 2
Item 2Response Choices Precoded
Item ValueFinal Item
ValueMuch better now than one year ago 1 1Somewhat better now than one year ago 2 2About the same as one year ago 3 3Somewhat worse now than one year ago 4 4Much worse now than one year ago 5 5
Use Table 25.10 to compute simple algebraic sums of the presented final item scores.

Sponsor: Astellas Pharma Inc. SAP Final VersionISN/Protocol 015K-CL-RAJ3
19-Jan-2018 Astellas Page 97 of 108
Table 25.10. Formulas for Scoring and Transforming Scales
SF-36v2 Scale
Sum Final Item Values (after recoding items as
in Tables 7.1-7.9)
Lowest and Highest Possible
Raw ScoresPossible Raw Score Range
Physical Functioning
3a + 3b + 3c + 3d + 3e + 3f + 3g + 3h + 3i + 3j
10, 30 20
Role-Physical 4a + 4b + 4c + 4d 4, 20 16Bodily Pain 7 + 8 2, 12 10General Health 1 + 11a + 11b + 11c +
11d5, 25 20
Vitality 9a + 9e + 9g + 9i 4, 20 16Social Functioning 6 + 10 2, 10 8Role-Emotional 5a + 5b + 5c 3, 15 12Mental Health 9b + 9c + 9d + 9f + 9h 5, 25 20
Formula for transformation of raw scale scores to 0-100 scale scores
Transformed Scale =(Actual raw score – lowest possible raw score)
× 100(Possible raw score range)
After calculating the transformed scale score, the next step is to compute a z-score transformation. A z-score for each scale is computed by subtracting the 2007 General Japanese Population Means for each SF-36v2® scale and dividing the difference by the corresponding scale standard deviation (Table 20) from the 2007 General Japanese Population Means and Standard Deviations Used to Derive SF-36v2® Z-score. Formulas are listed below.
Table 25.11. 2007 General Japanese Population Means and Standard Deviations Used to Derive SF-36v2® Z-score
SF-36v2 Scale Mean Standard DeviationPhysical Functioning (PF) 89.13446 13.85045Role-Physical (RP) 89.24007 18.80773Bodily Pain (BP) 73.77098 22.39818General Health (GH) 62.91007 18.76562Vitality (VT) 62.82787 19.46255Social Functioning (SF) 86.38347 19.40441Role-Emotional (RE) 87.84637 20.01521Mental Health (MH) 71.60598 18.62983

Sponsor: Astellas Pharma Inc. SAP Final VersionISN/Protocol 015K-CL-RAJ3
19-Jan-2018 Astellas Page 98 of 108
Step 1.Formulas for Z-score Standardization of SF-36v2® ScalesPF_Z = (PF – 89.13446) / 13.85045RP_Z = (RP – 89.24007) / 18.80773BP_Z = (BP – 73.77098) / 22.39818GH_Z = (GH – 62.91007) / 18.76562VT_Z = (VT – 62.82787) / 19.46255SF_Z = (SF – 86.38347) / 19.40441RE_Z = (RE – 87.84637) / 20.01521MH_Z = (MH – 71.60598) / 18.62983
Means and standard deviations are from Table 25.11.
Step 2.Norm-based Transformation of SF-36v2® Z-scores
The next step involves transforming each SF-36v2® z-score to the norm-based (50, 10) scoring. This is accomplished by multiplying each z-score from Step 1 by 10 and adding the resulting product to 50. Formulas are listed below.
Norm-Based Physical Functioning (PF) = 50 + (PF_Z × 10)Norm-Based Role-Physical (RP) = 50 + (RP_Z × 10)Norm-Based Bodily Pain (BP) = 50 + (BP_Z × 10)Norm-Based General Health (GH) = 50 + (GH_Z × 10)Norm-Based Vitality (VT) = 50 + (VT_Z × 10)Norm-Based Social Functioning (SF) = 50 + (SF_Z × 10)Norm-Based Role-Emotional (RE) = 50 + (RE_Z × 10)Norm-Based Mental Health (MH) = 50 + (MH_Z × 10)
PCS, MCS and RCS are scored in three steps as explained below:
Step 1.Z-score Standardization of SF-36v2® Scales
The first consists of standardizing each of the 8 SF-36v2® scales using a z-score transformation. This is the same as Step 1 used in the norm-based scoring of the 8 SF-36 scales.
Step 2.Aggregating Scales in Estimating Aggregate Physical,Mental, and Role/socialComponent Scores
After a z-score has been computed for scale, the second step involves computation of aggregate scores for the physical, mental and role/social components using the physical and mental factor score coefficients from 2002 survey as given in Table 25.12.

Sponsor: Astellas Pharma Inc. SAP Final VersionISN/Protocol 015K-CL-RAJ3
19-Jan-2018 Astellas Page 99 of 108
Table 25.12. 2002 Factor Score Coefficients Used to Derive PCS, MCS, and RCS Scale Scores SF-36v2 Scale PCS MCS RCS
Physical Functioning (PF) 0.67908 -0.20472 -0.13048Role Physical (RP) 0.22298 -0.27243 0.40393Bodily Pain (BP) 0.37244 0.14644 -0.21786General Health (GH) 0.36992 0.33933 -0.41710Vitality (VT) -0.08420 0.46413 -0.13120Social Functioning (SF) -0.30769 0.06727 0.49261Role Emotional (RE) -0.14256 -0.15597 0.61022Mental Health (MH) -0.33155 0.44572 0.10326
Computation of an aggregate physical component score consists of multiplying each SF-36v2® scale z-score by its respective physical factor score coefficient and summing the eight products, as shown below. Similarly, an aggregate mental, and role/social component score is obtained by multiplying each SF-36v2® scale z-score by its respective mental factor score coefficient and summing the eight products.
Formulas for Aggregating Scales in Estimating Aggregate Physical, Mental, and Role/social Component Scores (Standard Form)AGG_PHYS = (PF_Z × 0.67908) + (RP_Z × 0.22298) + (BP_Z × 0.37244) + (GH_Z × 0.36992) +
(VT_Z × -0.08420) + (SF_Z ×-0.30769) + (RE_Z × -0.14256) + (MH_Z × -0.33155)AGG_MENT = (PF_Z × -0.20472) + (RP_Z × -0.27243) + (BP_Z × 0.14644) + (GH_Z × 0.33933) +
(VT_Z × 0.46413) + (SF_Z ×0.06727) + (RE_Z × -0.15597) + (MH_Z × 0.44572)AGG_ROLE = (PF_Z × -0.13048) + (RP_Z × 0.40393) + (BP_Z × -0.21786) + (GH_Z × -0.41710) +
(VT_Z × -0.13120) + (SF_Z × 0.49261) + (RE_Z × 0.61022) + (MH_Z ×0.10326)
Step 3.Formulas for T-score Transformation of Component Scores (Standard Form)
The third step involves transforming each component score to the norm-based (50, 10) scoring. This is accomplished by multiplying each aggregate component scale score by 10 and adding the resulting product to 50.
Transformed Physical (PCS) = 50 + (AGG_PHYS × 10)Transformed Mental (MCS) = 50 + (AGG_MENT × 10)Transformed Mental (RCS) = 50 + (AGG_ROLE × 10)
Missing Data in an Individual Questionnaire
In the event that data is missing for an individual item from the scales of the SF-36v2® Health Status Survey, the average value of the completed items in the corresponding scale will be used as an estimate of the missing item. If more than 50 percent of the items from a scale are missing for an individual questionnaire, the corresponding deficient scale(s) will be excluded from analyses.

Sponsor: Astellas Pharma Inc. SAP Final VersionISN/Protocol 015K-CL-RAJ3
19-Jan-2018 Astellas Page 100 of 108
Items in each scale are given below:
SF-36v2 Scale
No. Items Items
Minimum No. Non-Missing Items for Imputation of Missing Values
PF 10 3a, 3b, 3c, 3d, 3e, 3f, 3g, 3h, 3i, 3j 5
RP 4 4a, 4b, 4c, 4d 2
BP 2 7, 8 1
GH 5 1, 11a, 11b, 11c, 11d 3
VT 4 9a, 9e, 9g, 9i 2
SF 2 6, 10 1
RE 3 5a, 5b, 5c 2
MH 5 9b, 9c, 9d, 9f, 9h 3
Example Showing the Mechanics of Imputation Technique:
Suppose for a subject the items 1, 3b, 3e, 3f, 4a, 4b, 11b, 11d, 5a and 5b are missing. First group the missing items according to the scale:
● GH: Items 1, 11b, 11d ● PF: Items 3b, 3e, 3f ● RP: Items 4a and 4b● RE: Items 5a and 5b
GH consists of 5 items and 3 are missing. That is only 2 have non-missing scores. Since at least half of the items are not non-missing, missing items 1, 11a and 11d cannot be imputed. Therefore for this subject, the General Health scale score will be missing.
PF consists of 10 items. So, for this subject 7 of the items are non-missing. That is, at least half of the items are non-missing. Therefore replace the missing Items 3b, 3e and 3f scores by the average score of the non-missing items, i.e., replace by (3a + 3c + 3d + 3g + 3h + 3i + 3j) / 7.
RP consists of 4 items and two are missing. So at least half are non-missing. Therefore replace the missing item scores 4a and 4b by (4c+4d) / 2.
RE consists of 3 and two are missing. That is, more than half of the item scores are missing. Therefore, missing scores 5a and 5b cannot be imputed for this subject and thus RE scale score for this subject will be missing.

Sponsor: Astellas Pharma Inc. SAP Final VersionISN/Protocol 015K-CL-RAJ3
19-Jan-2018 Astellas Page 101 of 108
10.7 Appendix 7: Computation of WPAI Scale Score
Work Productivity and Activity Impairment Questionnaire: WPAI
In this study, the following scoring methods are applied. These scoring methods are based on the specific health problem version of WPAI (WPAI:SHP).
Question Number Contents
1. 1. Are you currently employed (working for pay)?
2. 2. During the past seven days, how many hours did you miss from work because of problems associated with your rheumatoid arthritis?
3. 3. During the past seven days, how many hours did you miss from work because of any other reason, such as vacation, holidays, time off to participate in this study?
4. 4. During the past seven days, how many hours did you actually work?
5. 5. During the past seven days, how much did your rheumatoid arthritis affect your productivity while you were working?
6. 6. During the past seven days, how much did your rheumatoid arthritis affect your ability to do your regular daily activities, other than work at a job?
Scores:
Multiply scores by 100 to express in percentages.
● Percent work time missed due to problem: Q2/(Q2+Q4)
● Percent impairment while working due to problem: Q5/10
● Percent overall work impairment due to problem:Q2/(Q2+Q4)+[(1-(Q2/(Q2+Q4))x(Q5/10)]
● Percent activity impairment due to problem: Q6/10

Sponsor: Astellas Pharma Inc. SAP Final VersionISN/Protocol 015K-CL-RAJ3
19-Jan-2018 Astellas Page 102 of 108
10.8 Appendix 8: AE of Special Interest1. Serious Infections
• AE which belongs to SOC of Infections and infestations (10021881) and regarded as serious.
2. MalignanciesFollowing PT terms are included.Diffuse large B-cell lymphoma (10012818), Bladder cancer (10005003), Breast cancer (10006187), Carcinoma in situ (10061450), Colon cancer (10009944), Gastric cancer (10017758), Renal cancer (10038389), Squamous cell carcinoma (10041823), Small cell lung cancer stage unspecified (10041071), Extraskeletal chondrosarcoma (10015838), Lymphoma (10025310), Thyroid cancer (10066474).
3. Herpes Zoster Related Disease (Herpes Zoster and Varicella)Following PT terms are included.Herpes zoster (10019974), Herpes zoster iridocyclitis (10019980), Herpes zoster ophthalmic (10019983), Herpes zoster multi-dermatomal (10058428), Herpes zoster infection neurological (10061208), Herpes zoster oticus (10063491), Herpes zoster disseminated (10065038), Encephalitis post varicella (10014603), Varicella (10046980), Varicella post vaccine (10063522).
4. Herpes ZosterFollowing PT terms are included.Herpes zoster (10019974), Herpes zoster iridocyclitis (10019980), Herpes zoster ophthalmic (10019983), Herpes zoster multi-dermatomal (10058428), Herpes zoster infection neurological (10061208), Herpes zoster oticus (10063491), Herpes zoster disseminated (10065038).
5. VaricellaFollowing PT terms are included.Encephalitis post varicella (10014603), Varicella (10046980), Varicella post vaccine(10063522).
6. Infections That Require Intravenous Anti-infectious TherapyAll PTs which belong to SOC of Infections and Infestations (10021881) for which there is an intravenous concomitant medication (antibiotics, antivirals, antifungals, etc.) associated with that event for that patient.

Sponsor: Astellas Pharma Inc. SAP Final VersionISN/Protocol 015K-CL-RAJ3
19-Jan-2018 Astellas Page 103 of 108
10.9 Appendix 9: Standard Toxicity Grading for Laboratory Tests According to National Cancer Institute Common Terminology Criteria for Adverse Events (NCI-CTCAE) v4.0
Table 26. Standard Toxicity Grading for Laboratory Tests According to National Cancer Institute Common Terminology Criteria for Adverse Events (NCI-CTCAE) v4.0
Test Name
Direction of Change /
CTCAE Grade 2 NCI Ref.
Test
Code
Units 1 AE Term
0 1 2 3 4 Version
Page
Units
Alanine Aminotransferase(ALT/SGPT)
ALT n/a Increase/Alanine
aminotransferase increased
WNL >ULN -≤
3.0×ULN
>3.0×ULN - ≤5.0×UL
N
>5.0×ULN - ≤20.0×U
LN
>20.0×ULN
4.0 107 n/a
Albumin ALB g/dL Decrease/Hypoalbumine
mia
WNL ≥3 -<LLN
≥2 - <3 <2 4.0 116 g/dL
Alkaline Phosphatas
e
ALKP
n/a Increase/Alkaline
phosphatase increased
WNL >ULN -≤
2.5×ULN
>2.5×ULN - ≤5.0×UL
N
>5.0×ULN - ≤20.0×U
LN
>20.0×ULN
4.0 107 n/a
Amylase AMY
n/a Increase/Serum amylase
increased
WNL >ULN -≤
1.5×ULN
>1.5×ULN - ≤2.0×UL
N
>2.0×ULN - ≤5.0×UL
N
>5.0×ULN
4.0 112 n/a
Aspartate Aminotransferase(AST/SGOT)
AST n/a Increase/Aspartate
aminotransferase increased
WNL >ULN -≤3.0×UL
N
>3.0×ULN -
≤5.0×ULN
>5.0×ULN -
≤20.0×ULN
>20.0×ULN
4.0 107 n/a
Calcium Corrected 3
CACOR
mg/dL Increase/Hypercalcemia
WNL >ULN -≤ 11.5
>11.5 -≤12.5
>12.5 -≤ 13.5
>13.5 4.0 115 mg/dL
CalciumCorrected 3
CACOR
mg/dL Decrease/Hypocalcemia
WNL ≥8.0 -<LLN
≥7.0 -<8.0
≥6.0 -<7.0
<6.0 4.0 116 mg/dL
Total Cholesterol
TCHOL
mg/dL Increase/Cholesterol
high
WNL >ULN -≤300
>300 -≤400
>400-≤500
>500 4.0 109 mg/dL
Creatine Phosphoki
nase
CPK n/a Increase/CPK increased
WNL >ULN -≤
2.5×ULN
>2.5×ULN - ≤5×ULN
>5×ULN - ≤
10×ULN
>10×ULN
4.0 109 n/a
Creatinine CREAT
n/a Increase/Creatinine increased
WNL >ULN -≤
1.5×ULNor
>ULN-≤1.5×bas
eline
>1.5×ULN - ≤3.0×UL
Nor
>1.5×ULN -
≤3.0×baseline
>3.0×ULN -
≤6.0×ULNor
>3.0×baseline
>6.0×ULN
4.0 109 n/a
Estimated glomerular filtration
rate
GFR mL/min per 1.73 m^2
Decrease/Chronic kidney
disease
Not applicable
8
Not applicab
le8
30 - 59 15 - 29 <15 4.0 147 mL/min per 1.73 m^2

Sponsor: Astellas Pharma Inc. SAP Final VersionISN/Protocol 015K-CL-RAJ3
19-Jan-2018 Astellas Page 104 of 108
Gamma Glutamyl
Transferase (GGT)
GGT n/a Increase/GGT increased
WNL >ULN -≤2.5×UL
N
>2.5×ULN -
≤5.0×ULN
>5.0×ULN -
≤20.0×ULN
>20.0×ULN
4.0 110 n/a
Glucose GLUC
mg/dL Decrease/Hypoglycemia
WNL ≥55 -<LLN
≥40 -<55
≥30-<40
<30 4.0 117 mg/dL
Hemoglobin
HGB g/dL Increase/Hemoglobin
increased
WNL Increase in >0 - 2
g/dL above
ULN or above
baseline if
baseline is above
ULN
Increase in >2- 4 g/dL above
ULN or above baselin
e if baselin
e is above ULN
Increase in >4 g/dL
above ULN or above baselin
e if baselin
e is above ULN
4.0 111 g/dL
Hemoglobin
HGB g/dL Decrease/Anemia
WNL ≥10 -<LLN
≥8 -<10.0
<8 4.0 3 g/dL
Leukocytes (WBC)
WBC
103/μL
Decrease/White blood
cell decreased
WNL ≥3.0 -<LLN
≥2.0 -<3.0
≥1.0 -<2.0
<1.0 4.0 113 103/μL
Lymphocytes,
Absolute Units
LYMP
HAB
103/μL
Decrease/Lymphocyte
count decreased
Not applicable
8
Not applicab
le8
≥0.5 -<0.8
≥0.2 -<0.5
<0.2 4.0 111 103/μL
Lymphocytes,
Absolute Units
LYMP
HAB
103/μL
Increase/ Lymphocyte
count increased
Not applicable
8
>4 - 20 >20 4.0 111 103/μL
Magnesium
MG mg/dL Increase/Hypermagnese
-mia
WNL >ULN -≤3.0
>3.0 -≤8.0
>8.0 4.0 115 mg/dL
Magnesium
MG mg/dL Decrease/Hypomagnese
mia
WNL ≥1.2 -<LLN
≥0.9 -<1.2
≥0.7 -<0.9
<0.7 4.0 117 mg/dL
Absolute Neutrophil
Count
ANC 103/μL
Decrease/Neutrophil
count decreased
Not applicable
8
Not applicab
le8
≥1.0 -<1.5
≥0.5 -<1.0
<0.5 4.0 112 103/μL
Phosphate (Phosphoru
s)
PHOS
mg/dL Decrease/Hypophosphat
emia
WNL Not applicab
le8
≥2.0 -<2.5
≥1.0 -<2.0
<1.0 4.0 117 mg/dL
Platelets PLT 103/μL
Decrease/Platelet count
decreased
WNL ≥75.0 -<LLN
≥50.0 -<75.0
≥25.0 -<50.0
<25.0 4.0 112 103/μL
Potassium K mEQ/L
Increase/Hyperkalemia
WNL >ULN -≤5.5
>5.5 -≤6.0
>6.0 -≤7.0
>7.0 4.0 115 mEQ/L 7
Potassium 4 K mEQ/L
Decrease/ Hypokalemia
WNL ≥3.0 -<LLN
≥2.5 -<3.0
<2.5 4.0 117 mEQ/L 7
Urine Protein5
UPROT
Increase/Proteinuria
WNL + ++ +++ or ++++
4.0 149 n/a
Sodium NA mEQ/L
Increase/Hypernatremia
WNL >ULN -≤150
>150 -≤155
>155 -≤160
>160 4.0 116 mEQ/L 7

Sponsor: Astellas Pharma Inc. SAP Final VersionISN/Protocol 015K-CL-RAJ3
19-Jan-2018 Astellas Page 105 of 108
Sodium NA mEQ/L
Decrease/Hyponatremia
WNL ≥130 -<LLN
≥120 -<130
<120 4.0 117 mEQ/L 7
Total Bilirubin
TBILI
n/a Increase/Blood bilirubin
increased
WNL >ULN -≤1.5×UL
N
>1.5×ULN -
≤3.0×ULN
>3.0×ULN -
≤10.0×ULN
>10.0×ULN
4.0 107 n/a
Triglycerides
TRIG
mg/dL Increase/Hypertriglyceri
demia
WNL > ULN 9
- ≤300>300 -≤500
>500 -≤1000
>1000 4.0 116 mg/dL
Uric Acid 6 UACID
mg/dL Increase/Hyperuricemia
WNL >ULN -10
>10 4.0 116 mg/dL
1 "n/a" is specified if the criteria are based strictly on a comparison of the value to its reference range.
2 WNL = Within Normal Limits; LLN = Lower Limit of Normal; ULN = Upper Limit of Normal.
3 Calcium Corrected will be derived using the following formula: Calcium Corrected = 0.8 × (4.0 – Albumin) + Calcium, where 4.0 represents the average albumin level in g/dL, Albumin is measured in unit of g/dL, and Calcium is measured in unit of mg/dL.
4 Hypokalemia Grade 2 is the same as Grade1 but has additional clinical criteria that cannot be assessed. Therefore, it was decided to grade all criteria falling within ≥3.0 - <LLN as grade 2.
5 For Urine Protein, the maximum category is "++++", while NCI CTCAE version4.0 doesn't define "+++", "++++". So, these are defined as grade 3 per internal discussion.
6 Hyperuricemia Grade 3 is the same as Grade1 but has additional clinical criteria that cannot be assessed. Therefore, it was decided to grade all criteria falling within >ULN – 10 mg/dL as grade 3.
7 For hyperkalemia, hypokalemia, hypernatremia and hyponatremia, the unit in the NCI reference is mmol/L, which has been converted to mEQ/L by multiplying 1.
8 For ANC, LYMPHAB, GFR, there are no reference range in central laboratory, so, NCI CTCAE grading scale is only defined for not-related reference range category. For PHOS, LLN=2.5mg/dL, while NCI Grade 1 is defined "≥2.5 - <LLN", so Grade 1 can’t be defined.
9 For TRIG, the upper limit of normal range is 149 mg/dL. Therefore, WNL for Grade 0 is up to 149 mg/dL. But the lower limit of Grade 1 is originally more than 150 mg/dL. So, the definition for the lower limit of grade 1 is changed from 150 mg/dL to ULN.
● Hyperuricemia (see pg. 116 of NCI document) cannot be assessed accurately without knowing whether or not the subject was experiencing physiologic consequences, so it is not included in the table.
● Hemoglobinuria (see pg. 148 of NCI document) cannot be assessed accurately without knowing clinical or diagnostic observations, so it is not included in the table.
● Troponin T (see pg. 109 of NCI document) cannot be assessed accurately without knowing manufacturer ranges, so it is not included in the table.

Sponsor: Astellas Pharma Inc. SAP Final VersionISN/Protocol 015K-CL-RAJ3
19-Jan-2018 Astellas Page 106 of 108
10.10 Appendix 10: Key Contributors and Approvers
List of Key Contributors and Approvers
Key Contributors
The following contributed to or reviewed this Statistical Analysis Plan as relevant to their indicated discipline or role.
Primary author (s)
Contributors and Reviewers
, Medical Advisor
, Statistical Advisor

Sponsor: Astellas Pharma Inc. SAP Final VersionISN/Protocol 015K-CL-RAJ3
19-Jan-2018 Astellas Page 107 of 108

Sponsor: Astellas Pharma Inc. SAP Final VersionISN/Protocol 015K-CL-RAJ3
19-Jan-2018 Astellas Page 108 of 108
Author and Approver Signatories
(E-signatures are attached at end of document)
This Statistical Analysis Plan was prepared by:
This Statistical Analysis Plan was prepared by:
This Statistical Analysis Plan was approved by:
This Statistical Analysis Plan was approved by: