Phase II Experiment 4 – An Exploratory Study of Driver...
71
Massachusetts Institute of Technology > AgeLab > 77 Massachusetts Ave, E40-291, Cambridge, MA 02139 Phone: 617.452.2177 > fax: 617.258.7570 > reimer@mit.edu > agelab.mit.edu MIT/CSRC Project on Assessing the Demands of Voice Based In-Vehicle Interfaces Technical Report 2015-15 Phase II Experiment 4 – An Exploratory Study of Driver Behavior With and Without Assistive Cruise Control (ACC) (2015a) Updated: December 10, 2015 Initial Draft Submitted: November 24, 2015 Bryan Reimer, Bruce Mehler, Jonathan Dobres, & Joseph F. Coughlin Abstract – Experiment 4 was undertaken as an exploratory study of driver behavior with and without ACC active during single-task baseline driving and when interacting with voice- involved and primary visual-manual infotainment secondary tasks. An analysis sample of 24 participants, equally balanced by gender and two age groups (20-29 and 60-69), was given training exposure to a production ACC system in a 2014 Chevrolet Impala under highway driving conditions through controlled interaction with a confederate lead vehicle. Assessment periods with and without ACC followed. While participants reported high levels of trust in this automated technology, heart rate and skin conductance levels showed modest but highly consistent and statistically significant elevations when ACC was active. Self-report measures suggested that participants felt more support from the assistive technology when engaged in voice-based tasks that generally allowed for continued visual orientation toward the roadway than during visual-manual secondary tasks. ACC status had no significant effect on glance activity during secondary tasks, but visual scanning was observed to change during single task driving when ACC was active. Specifically, drivers shifted more of their visual attention off the forward roadway. Although the observed shift in the distribution of glances and time looking off of the forward roadway may well be appropriate to the conditions, developing a better understanding of how automation influences the distribution of attention seems appropriate. Lead Project Contact: Bryan Reimer, Ph.D. Phone (617) 452-2177 ([email protected])
Transcript of Phase II Experiment 4 – An Exploratory Study of Driver...

Massachusetts Institute of Technology > AgeLab > 77 Massachusetts Ave, E40-291, Cambridge, MA 02139 Phone: 617.452.2177 > fax: 617.258.7570 > [email protected] > agelab.mit.edu
MIT/CSRC Project on Assessing the Demands of Voice Based In-Vehicle Interfaces
Technical Report 2015-15
Phase II Experiment 4 – An Exploratory Study of Driver Behavior With and Without Assistive Cruise Control (ACC) (2015a)
Updated: December 10, 2015 Initial Draft Submitted: November 24, 2015
Bryan Reimer, Bruce Mehler, Jonathan Dobres, & Joseph F. Coughlin Abstract – Experiment 4 was undertaken as an exploratory study of driver behavior with and without ACC active during single-task baseline driving and when interacting with voice-involved and primary visual-manual infotainment secondary tasks. An analysis sample of 24 participants, equally balanced by gender and two age groups (20-29 and 60-69), was given training exposure to a production ACC system in a 2014 Chevrolet Impala under highway driving conditions through controlled interaction with a confederate lead vehicle. Assessment periods with and without ACC followed. While participants reported high levels of trust in this automated technology, heart rate and skin conductance levels showed modest but highly consistent and statistically significant elevations when ACC was active. Self-report measures suggested that participants felt more support from the assistive technology when engaged in voice-based tasks that generally allowed for continued visual orientation toward the roadway than during visual-manual secondary tasks. ACC status had no significant effect on glance activity during secondary tasks, but visual scanning was observed to change during single task driving when ACC was active. Specifically, drivers shifted more of their visual attention off the forward roadway. Although the observed shift in the distribution of glances and time looking off of the forward roadway may well be appropriate to the conditions, developing a better understanding of how automation influences the distribution of attention seems appropriate. Lead Project Contact: Bryan Reimer, Ph.D. Phone (617) 452-2177 ([email protected])

AgeLab Technical Report 2015-15
©MIT AgeLab 2015 Page 2 of 71
REPORT DOCUMENTATION PAGE
RECEIVING ORGANIZATION
Toyota Collaborative Safety Research Center
REPORT DATE
December 10, 2015
REPORT TYPE + DATES COVERED
Technical Report
TITLE AND SUBTITLE
Assessing the Demands of Voice Based In-Vehicle Interfaces: Phase II Experiment 4 – An Exploratory Study of Driver Behavior With and Without Assistive Cruise Control (ACC) (2015a)
FUNDING NUMBERS
AUTHOR(S)
Bryan Reimer, Bruce Mehler, Jonathan Dobres & Joseph F. Coughlin PERFORMING ORGANIZATION NAME(S) AND ADDRESS(ES)
MIT AgeLab Massachusetts Institute of Technology 77 Massachusetts Avenue, E40-279 Cambridge, MA 02139 USA
PERFORMING ORGANIZATION REPORT NUMBER
Technical Report 2015-15
SPONSORING/MONITORING AGENCY NAME(S) AND ADDRESS(ES)
Toyota Collaborative Safety Research Center Collaborative Safety Research Center Toyota Technical Center USA, Inc. 1555 Woodridge Ave Ann Arbor, MI 48105
SPONSORING/MONITORING AGENCY REPORT NUMBER
SUPPLEMENTARY NOTES
DISTRIBUTION/AVAILABILITY STATEMENT
DISTRIBUTION CLASSIFICATION
ABSTRACT
Please see cover page. SUBJECT TERMS Voice-command, visual-manual demand, TEORT, driver-vehicle interface, DVI, HMI, automation, assistive cruise control, ACC, workload, cognitive demand, glance behavior, heart rate, skin conductance, driving performance.
NUMBER OF PAGES 71
Recommended Citation: Reimer, B., Mehler, B., Dobres, J., & Coughlin, J.F. (2015). Assessing the Demands of Voice Based In-Vehicle Interfaces - Phase II Experiment 4 – An Exploratory Study of Driver Behavior With and Without Assistive Cruise Control (ACC) (2015a). MIT AgeLab Technical Report 2015-15 (December 10, 2015 Update). Massachusetts Institute of Technology, Cambridge, MA.
AgeLab Technical Report 2015-15
©MIT AgeLab 2015 Page 3 of 71
Glossary of Terms (or Acronyms)
ACC Adaptive / autonomous cruise control ANOVA analysis of variance CAMP Crash Avoidance Metrics Partnership CAN controller area network CSRC Toyota Collaborative Safety Research Center DVI driver vehicle interface ISO International Organization for Standardization FOT field operational trial M mean MIT Massachusetts Institute of Technology NHTSA National Highway Transportation Safety Administration SCL skin conductance level SD standard deviation SE standard error SWR steering wheel reversals RA Research assistant The Alliance Alliance of Automotive Manufacturers TEORT total eyes-off-road time - the sum of all glances off the forward roadway during
a specific period

AgeLab Technical Report 2015-15
©MIT AgeLab 2015 Page 4 of 71
MIT/CSRC Project on Assessing the Demands of Voice Based In-Vehicle Interfaces
An Exploratory Study of Driver Behavior With and Without Assistive Cruise Control (ACC)
Contents Glossary of Terms (or Acronyms) ................................................................................................................ 3 Introduction ................................................................................................................................................... 6
Brief Background on Project .................................................................................................................... 6 Conceptual Design of Phase II Study 4 .................................................................................................... 6
Technology Exposure Prior to Assessment .......................................................................................... 7 Methods ........................................................................................................................................................ 8
Participants ............................................................................................................................................... 8 Apparatus .................................................................................................................................................. 8
Vehicle ................................................................................................................................................. 8 Instrumentation................................................................................................................................... 10
Tasks ....................................................................................................................................................... 11 Voice and Visual-Manual Phone Contact Calling ............................................................................. 11 Manual Radio Tuning Reference Task ............................................................................................... 12
Procedure ................................................................................................................................................ 12 Data Reduction and Analysis ................................................................................................................. 15
Results ......................................................................................................................................................... 17 Analysis Sample ..................................................................................................................................... 17
Previous Experience with Cruise Control and ACC .......................................................................... 18 Organization of Results .......................................................................................................................... 19 Self-Reported Workload ......................................................................................................................... 19 Task Completion Time ........................................................................................................................... 20 Physiology .............................................................................................................................................. 21
Heart Rate ........................................................................................................................................... 21 Skin Conductance Level ..................................................................................................................... 23
Glance Behavior ..................................................................................................................................... 25 Mean Single Off-Road Glance Duration ............................................................................................ 25 Percentage of Single Off-Road Glances Greater than 2.0s ................................................................ 26 Total Eyes Off-Road Time (TEORT) ................................................................................................ 27 Number of Glances Off-Road ............................................................................................................ 28

AgeLab Technical Report 2015-15
©MIT AgeLab 2015 Page 5 of 71
Percentage of Time Glancing Off-Road ............................................................................................. 29 Off-Road Glances per Minute ............................................................................................................ 30 Glance Metric Monte Carlo Analysis ................................................................................................. 31 Orienting Behavior ............................................................................................................................. 33
Driving Performance .............................................................................................................................. 35 Mean Velocity .................................................................................................................................... 35 Variability in Velocity ........................................................................................................................ 36 Steering Wheel Reversals ................................................................................................................... 37
Task Performance / Error Analysis......................................................................................................... 38 Self-Report on Post-Experimental Questionnaire .................................................................................. 44 Participant Choice on Option to Continue or Discontinue use of ACC ................................................. 45
Discussion ................................................................................................................................................... 46 Limitations .............................................................................................................................................. 49 Conclusions & Next Steps ...................................................................................................................... 50 Acknowledgements ................................................................................................................................ 50
References ................................................................................................................................................... 51 Appendix A: Descriptive Statistics (Summary Tables) .............................................................................. 53
Baseline Driving and Radio Manual Periods .......................................................................................... 53 Contact Phone Calling (Voice and Manual Modalities) ......................................................................... 53
Appendix B: Selected Graphs in Alternate Formats ................................................................................... 55 Heart Rate in BPM ................................................................................................................................. 55 Skin Conductance in Absolute Units ...................................................................................................... 55 Mean Velocity in MPH ........................................................................................................................... 56
Appendix C: Item Content in Post-Experimental Questionnaire ................................................................ 57 Appendix D: Responses to Open-ended Questions in Post-Experimental Questionnaire .......................... 61 Appendix E: Detailed Protocol Followed by Confederate Lead Vehicle ................................................... 66

AgeLab Technical Report 2015-15
©MIT AgeLab 2015 Page 6 of 71
Introduction
Brief Background on Project
Included in the original Phase II work-plan was the charge to begin to examine how workload associated with voice-command DVI’s varies with the level of automation. We proposed initiating work in this area by looking at drivers’ experiences with adaptive / autonomous cruise control (ACC). In specific, we proposed examining whether a sample of drivers who were given a relatively brief but guided exposure to ACC, and an opportunity to develop some initial trust in the technology, behave any differently during single task driving and when engaged in interaction with selected vehicle DVIs, when ACC is and is not active. We also proposed stratifying the sample into a younger (20-29) and older (60-69) age group. This was intended to support a targeted consideration of the extent to which age / generational cohort considerations impact the degree to which drivers may vary in their comfort and trust in this level of automation.
Conceptual Design of Phase II Study 4
The study design built off a number of elements from the previous experiments. Intake and pre-experimental questionnaires were administered in the research space at the MIT AgeLab. Physiological sensors were then attached for recording heart rate and skin conductance signals. In the MIT parking lot, participants received training on the secondary tasks to be carried out during the drive and an orientation provided on how to engage the ACC controls on the vehicle.
The central portion of the protocol was divided into 2 blocks: ACC on and ACC off. During each block, the participant was exposed to:
• voice based contact phone calling (2 calls) • baseline single task driving reference period (4 minutes) before next task • visual-manual radio tuning reference task (radio “hard”, 2 sequential tasks) • baseline single task driving reference period (4 minutes) before next task • visual-manual interface contact phone calling (2 calls)
Presentation order of ACC on and ACC off blocks was counterbalanced across the sample (see Figure 1). Within blocks, the ordering of voice and visual-manual phone calling was randomized. The radio reference task was always presented in the middle, separating the phone calling tasks. A verbal workload rating was made immediately after each task period (not each task, i.e. one rating following a set of two phone calls). A 30 second separator was allowed for making the workload rating and provide a brief “cool-down” prior to starting timing of the 4 minute single task driving reference periods.

AgeLab Technical Report 2015-15
©MIT AgeLab 2015 Page 7 of 71
Figure 1: Overview of the Experimental Protocol for Phase II Study 4.
Technology Exposure Prior to Assessment
A key component of the study design was to provide drivers with targeted and controlled exposure to the functional experience of ACC technology prior to formally evaluating their behavior with and without the technology engaged. After providing participants with a conceptual overview of the technology in the laboratory (viewing a publically available manufacturer provided video explaining the technology) and in the parking lot (explaining steering wheel based controls), participants were provided with approximately a 30 minute adaptation period to get comfortable with the basic handling characteristics of the vehicle (see Figure 1 above). Participants were then given controlled, active experience of ACC controlled vehicle slowing and acceleration in response to lead vehicle decelerations and accelerations on the highway through interactions with a confederate vehicle driven by a member of the research staff in coordination with a senior research staff member in the primary vehicle. Under these conditions, drivers were informed by the senior research staff member when the lead vehicle was about to engage in a slowing event (which was then followed by an acceleration to highway speed), and then later when the lead vehicle was going to engage in a slowing event in which the brake lights would briefly go on). A minimum of three slowing events was presented prior to moving on to the series of a minimum of three moderate braking events. Participants were given

AgeLab Technical Report 2015-15
©MIT AgeLab 2015 Page 8 of 71
the option to experience more events if they desired to become comfortable with them. Additional details are provided in the Procedure section and in Appendix E.
Methods
Participants
The research plan for Study 4 called for obtaining 24 usable participant cases equally balanced by gender and across two age groups (20-29 and 60-69 years). Participants had to meet the same criteria as other participants in Phase II studies:
• A valid driver’s license for more than three years • Driving on average three or more times per week • Being in self-reported reasonably good health for their age and meeting a set of health
exclusion criteria (see Appendix in previous Phase II technical reports) • Clearly understanding and speaking English • No police reported accident in the past year • Not actively using any medications causing drowsiness • Not having been a participant in an on-road driving study in the past 6 months
Apparatus
Vehicle
The vehicle employed in the study was a standard production 2014 Chevrolet Impala that was purchased by MIT for use in Phase II Study 1. The infotainment system, including the voice-command interface, was a standard production MyLink system as supplied with a 2014 Chevrolet Impala. A specific build date for the infotainment software release was not indicated; however, the following reference codes were displayed on the Software Information screen: Software: 23431666, Gracenote: 22993544, Map: 23152950.

AgeLab Technical Report 2015-15
©MIT AgeLab 2015 Page 9 of 71
Figure 2: Basic layout of the 2014 Chevrolet Impala DVI showing the main components of MyLink system interface.
In Figure 2 above, note the primary infotainment touch/display screen in the center console and a small additional display in the instrument cluster between the tachometer and speedometer. A push-to-talk button and other support controls are present on the steering wheel. See Figures 2 through 6 below for additional detail of each of these interface components.
Figure 3: Location of the push-to-talk button on the steering wheel.
Figure 4: DVI display located in the center of the instrument cluster.

AgeLab Technical Report 2015-15
©MIT AgeLab 2015 Page 10 of 71
Figure 5: Center console display during selection of a phone number to call from a list of stored contacts.
Figure 6: Manual radio tuning on the center console interface.
Instrumentation
The vehicle was instrumented with a custom data acquisition system for time synchronized recording of data from:
• vehicle information via the controller area network (CAN) bus, • a Garmin 18X Global Positioning system (GPS) unit, • a MEDAC System/3™ physiological monitoring unit to provide EKG (for heart rate
determination) and skin conductance level (SCL) signals, • video cameras, • a wide area microphone to capture driver speech and audio from the vehicle’s speech
system.
The five video cameras provided views intended to capture the driver’s face for primary glance behavior analysis, the driver’s interactions with the vehicle’s steering wheel and center console, the forward roadway (narrow and wide-angle images), and a rear roadway view. Data were captured at:
• 10 Hz for the CAN bus and GPS, • 30 Hz for the face and narrow forward roadway cameras, • 15 Hz for the remaining cameras, • 250 Hz for the physiological signals to support EKG feature extraction for heart beat
interval detection.

AgeLab Technical Report 2015-15
©MIT AgeLab 2015 Page 11 of 71
Phone connectivity was supported by pairing a Samsung Galaxy S4 smartphone (model SCH-1545) to the vehicle’s embedded system via the vehicle’s Bluetooth wireless interface.
Tasks
Voice and Visual-Manual Phone Contact Calling
The DVI interface was used to place two calls from a stored phone contact list. Both involved calling a specific phone for contacts having multiple phone numbers. These were the same two “hard” tasks that were used in Studies 1 through 3 and in the MIT/IIHS study (Mehler, Kidd, et al., 2015). Details on the structure of the phone contact list is provided in the latter paper.
The two contacts were:
• Pat Griffin on mobile
• Frank Scott at work
Steps involved using the voice interface. Audio from system in bold.
Press the [voice button]. Command Please. → “Call Pat Griffin on mobile.” (Call Pat Griffin on mobile, correct? → “Yes.”) {System begins calling.}
The () symbols indicate that system did not always request confirmation, presumably if confidence in correct identification was high. Activity is terminated by touching End on center console display screen or pressing “hang-up phone” button on steering wheel.
Steps involved using the manual interface. Task always started with home menu screen displayed.
Press the [phone icon] on center cluster touch screen. Rotate Menu knob in center stack to scroll down through an alphabetical listing of all contacts in list (i.e. scroll down to “Pat Griffin”.) Touch listing for “Pat Griffin” on display screen. {This brings-up a listing of two numbers for “Pat Griffin” showing small icons for mobile, work, home, followed by actual phone number.} Touch listing showing mobile phone icon. {System begins calling.}
Activity is terminated by touching End on center console display screen or pressing “hang-up phone” button on steering wheel. Note that participants were trained to scroll through the list using the Menu knob; however, the display supported a slider control on the touch screen and participants were not prevented from using the alternative screen controls if they did so on their own.

AgeLab Technical Report 2015-15
©MIT AgeLab 2015 Page 12 of 71
Manual Radio Tuning Reference Task
The manual radio tuning reference task used in the other Phase II studies was again employed here. This “hard” task in the Impala required 2 touch screen button engagements and manual rotation of the fine tuning knob to obtain a specified frequency. The goal was to have the driver interact with the radio in a manner as close as possible to the NHTSA (2013) specified manual radio reference task in terms of the number and type of manual engagements required. Conceptually this was used to establish a reasonably “standard” visual-manual load reference point for comparing against the other tasks.
The two target stations were: 1470 AM and 100.7 FM
Steps (manual radio tuning reference task (“hard”).
The task was initiated from a neutral menu screen with the radio on. Press the [Radio] hard button to activate radio interface. Press the [Radio] hard button to switch from AM to FM
Rotate the (Tuning knob) from 107.9 to 100.7.
Note: In Study 2 in the CLA, the target radio station was changed from 1470 AM used in earlier studies due to an inability of the CLA’s radio to lock into this station. AM station 1030 was substituted and the set-up adjusted so that a comparable number of manual turns of the fine adjustment knob were required for tuning. This same station selection was carried over to Study 3 in the Corolla. AM 1470 was again used in Study 4 for consistency with Study 1.
Procedure
Potential participants were initially screened either by phone or through an on-line questionnaire. In addition to the criteria already listed, an attempt was made to select individuals with previous experience with cruise control technology. In specific, the screening asked: “Do you use cruise control at least once a month when you are driving?” and “On average, how many days a month do you use cruise control?” The intent was to enroll individuals who used cruise control of some form at least once a month. Individuals who reported to MIT reviewed and signed and informed consent and a structured face-to-face interview was employed to confirm eligibility. A pre-experimental questionnaire covering demographic information, attitudes toward driving, and technology experience was completed, an explanation of the verbal workload rating scale that would be used during the drive was provided, and physiological sensors attached. A short, publically available video from Chevrolet demonstrating the basic operation of the ACC technology was then shown to the participant and they were given an opportunity to ask any initial questions they might have.

AgeLab Technical Report 2015-15
©MIT AgeLab 2015 Page 13 of 71
Consistent with previous work, participants received training on how to complete each of the tasks in the MIT parking lot prior to being asked to consider engaging with them while driving. Training procedures were similar to those provided to the “trained” group in Phase I, Study 2 (Mehler, et al., 2014). Building on the video demonstration of the ACC technology viewed earlier, the on-road RA pointed out each of the controls associated with the ACC system, explained their operation, and guided the participant through manipulating each of the controls to the extent possible under the parked condition so that the participant began to develop experience with orienting to the display elements and manipulating the physical controls. In addition to the live guidance provided by the RA, the following recorded audio was played to reinforce a number of points:
“As you saw in the video in the lab, the adaptive cruise control system, like regular cruise control, allows you to set a cruising speed. But unlike regular cruise control, this system tracks the vehicle in front of you, to maintain a set following gap between the two vehicles. This means that as long as the vehicle in front is traveling at a speed equal to or lower than your set speed, the study vehicle will adjust speed to maintain that the gap. If the vehicle in front slows down, the study vehicle will slow down automatically, without you having to take any additional action except in emergency situations as will be described in a moment.
This vehicle is also equipped with a Collision Eminent Braking System. In the case that the vehicle senses a potential forward collision situation, the system will sound a warning and flash red lights on the windshield. If you see these red lights flash on the windshield, evaluate the situation and apply the brake or adjust your steering if it seems appropriate to do so. The system is also designed to automatically apply the brakes to slow or stop the vehicle as described in the video. This system is intended to serve as a back-up system to the driver and may not work in all conditions, such as curves, highway exit ramps, or hills; or due to poor visibility. The system will not detect another vehicle ahead until it is completely in the driving lane. Therefore, just as you would in a car without such automated features, you should use the brake and steering to avoid any unsafe situation.
Throughout the study you will be following a second AgeLab vehicle, a Toyota Corolla. After this training period, the Toyota will pull out in front of you and lead you to the highway. Once on the highway, you will be given time to become comfortable both with driving this vehicle and then driving with adaptive cruise control active, before you are asked to complete any secondary tasks. Remember, if you do not feel comfortable at any time, please let the research associate know, and they will confer with you about the proper way to proceed, do you have any questions?”
Once participants indicated they had no further questions at this point about the technology, additional recorded orientation was provided. Key elements regarding engaging in tasks included:

AgeLab Technical Report 2015-15
©MIT AgeLab 2015 Page 14 of 71
“In a few moments, you will leave this parking spot and begin following the lead vehicle to I93 North. Unless instructed otherwise, please be sure to always follow the lead vehicle throughout the whole study. Once on I93, you will continue on to the I495 interchange. The drive north will give you plenty of time to become familiar with driving this car before you are asked to do any of the tasks you have practiced. When you reach I495 and have had a few minutes of driving on that highway, short recorded prompts will tell you what task we would like you to consider trying. When you hear these prompts, please do not start a task until you hear the word ‘begin’.
While we would like you to consider doing each task, you should always give priority to safe driving. If you feel for any reason that a task will interfere with your ability to drive safely, delay starting the task until you feel it is safe to do so, or skip the task entirely if you feel that is the best thing to do. Your safety, and the safety of other people around you, is the highest priority. ”
Near the end of the habituation portion of the drive on I93, the RA reviewed the operation of the ACC system and relevant safety systems. The exact exchange with individual participants might vary depending upon whether they had any questions, but generally followed the text below:
On I495, once you reach a speed of 65 mph, you will be asked to set that speed into the cruise control system. To review, this is done by hitting the button labelled “Set”, using the left thumb control. On the ACC display (located in the bar across the bottom of the information cluster, below the speedometer) you can verify that the set speed is 65; if it is not, you can adjust the speed up or down by 1 mph by pressing the RES+ button and the SET- button. As is the case with other cruise control systems, pressing the brake cause the system to disengage. To reset the speed to your previous cruising speed (in this case 65), you can press the RES+ button and the system will automatically set the speed to 65 again.
Remember, the ACC system is designed to maintain a pre-set following distance between you and a car in front of you, if that car slows down, this car will also slow down. In the case of a potential forward collision situation, the Automatic Collision Preparation System will trigger and alarm and brake lights, and will automatically brake or bring the car to a full stop.
Once the participant was able to successfully engage the ACC system, the following orientation to the training period was provided via audio recording:
“We are going to be driving on I495 for approximately 30 minutes. The purpose of this portion of the drive is for you to become familiar with the adaptive cruise control system. At certain intervals, the lead vehicle will purposely slow down a little, which will cause this vehicle to adaptively slow down as well. Both vehicles will then gently increase speed again. We will do this to make sure you get a good sense of how the system works. You will be told in advance when we are doing this so it is not a surprise. Changes in the

AgeLab Technical Report 2015-15
©MIT AgeLab 2015 Page 15 of 71
natural flow of traffic may also result in the system adaptively adjusting the speed. After a couple of slowing only experiences, the lead vehicle will gently brake so that the brake lights come on as well. Again, this is just so you can experience what it is like to let the ACC system control the speed when you see brake lights come on in front of you.
After you turn on the ACC system, you will not normally have to take any additional action to control your speed as the vehicle will slow down and speed back-up automatically in response to the behavior of the lead vehicle. However, remember that you are still responsible for steering and using the brake in emergency situations. The warning and safety assistance systems in the car are not able to detect and respond to all potential collision threats such as a stopped car, bridge structures, guard rails, or pedestrians. Thus, you should always remain alert even if the ACC system is able to manage routine changes in traffic flow. In a moment the RA will instruct you on setting the adaptive cruise control system and will answer any questions that you might have.”
Participants were then exposed to a minimum of three controlled slowing events and at least three controlled braking events. After being presented with the initial three events, participants were asked if they would like additional exposure practice or if they would prefer to proceed. Before each event, the RA in the participant’s vehicle contacted the driver in the lead vehicle by radio to confirm that both RAs felt it was safe to initiate an event. Upon confirmation, the RA would prepare the participant for a slowing event by saying, “In a moment, the lead vehicle will slow down so you can experience the ACC system automatically slowing.” During slowing events, the RA in the lead car used the cruise control to slow the vehicle by 5 mph, from 65-60. By using the cruise control instead of touching the brake, no lead brake lights were experienced. During the breaking events, the RA in the lead vehicle did touch the brake to illuminate the brake lights, and then used the ACC system to decrease from 65 to 60mph slightly more abruptly than was the case during the slowing events. Given its significance to the study design, the detailed protocol instructions followed by the confederate lead vehicle are reproduced in Appendix E.
The follow for the remainder of the protocol follows that outlined in Figure 1 and description in the Introduction concerning the design of the study.
Data Reduction and Analysis
Single task driving reference periods (baselines) were calculated for both the ACC-off and ACC-on conditions. For each condition, 4 minutes of “just driving” was recorded between the first set of phone tasks and the radio tasks and another 4 minutes between the radio task and the next set of phone tasks (see Figure 1). Metrics were calculated and the mean values across the two 4 minute baseline periods (8 minutes total) were used as an overall baseline / “just driving” reference for both ACC-off and ACC-on. For task periods, values for each dependent measure were calculated per trial and mean values across trials were used for analytic purposes. All trials

AgeLab Technical Report 2015-15
©MIT AgeLab 2015 Page 16 of 71
with usable data were included regardless of whether errors due to a user or system issues occurred. Including trials with errors in the analysis was seen as more representative of the actual user experience than only considering error-free trials. (See Reimer et al. 2013 for a consideration of the extent to which including trials with and without errors impacted the overall pattern of results in the first MKS study.)
As in the Phase I studies, eye glance measures were quantified following ISO standards (ISO 15007-1, 2002; ISO 15007-2, 2001) with a glance to a region of interest defined to include the transition time to the object / region. In the manual coding of video images, the timing of glance is labeled from the first video frame illustrating movement to a “new” location of interest to the last video frame prior to movement to a “new” location. Glance data were manually coded based on video of the driver following the taxonomy and procedures outlined in Reimer et al. (2013, Appendix G). Software that allowed for rapid frame-by-fame review and coding is now available as open source (Reimer, Gruevski, & Couglin, 2014). Each task period of interest was independently coded by two evaluators. Discrepancies between the evaluators (the identification of conflicting glance targets, missed glances, or glance timings that differed by more than 200ms) were mediated by a third researcher. (Smith, Chang, Glassco, Foley et al. (2005) is recommended for a discussion of the importance of multiple coders.)
Physiological data were handled in the same manner as the in the Phase I studies. In specific, R-wave peaks in the EKG signal were identified to calculate inter-beat intervals and calculate instantaneous heart rate using software developed at the MIT AgeLab. Consistent with existing standards (Task Force, 1996), automated detection of R-wave peaks were visually reviewed and misidentified and irregular intervals manually corrected. Another MIT AgeLab developed data processing package removed high-frequency noise in the skin conductance signal as per Reimer and Mehler (2011) and substantive identified motion artifacts were manually edited.
Statistical analyses were performed in R (R Core Team, 2014) and an alpha level of 0.05 was used for statistical significance assessment. A majority of analyses were carried using a two factor repeated measures ANOVA, which included task type (phone voice, phone manual, radio manual, and, where appropriate, baseline / single task driving) and ACC status as factors. Due to the non-normal distribution of the data and/or the use of ratio data (percentages) for several dependent measures, in some cases non-parametric statistics - the Wilcoxon signed rank test and the Friedman test - were used (similar to the t-test and repeated-measures ANOVA, respectively). These tests have been shown to be more robust against Type I error in cases where data are non-normal (Conover & Iman, 1981; Friedman, 1937). Additionally, analysis of responses to the post-experimental questionnaire were carried out using the SPSS (Release 23) statistical software package.

AgeLab Technical Report 2015-15
©MIT AgeLab 2015 Page 17 of 71
Results
Analysis Sample
A total of 36 participants were enrolled in the study. A breakdown of the development of the analysis sample is provided in Figure 7 below. To be included in the analysis sample, participants had to demonstrate the ability to complete each task under controlled conditions in the parking lot and engage in each task type during the drive. Further, driving performance data from the CAN bus and video recordings of sufficient quality to code eye glance behavior had to be available. Usable physiological recordings were considered desirable, but were not required in this sample. In addition, cases were excluded if non-optimal weather conditions (e.g. heavy rain) or heavy traffic was encountered. Finally, the research associate in the vehicle was able to withdraw participants from the study due to erratic or otherwise unsafe driving behavior.
Figure 7: Summary presentation of the development of the analysis sample for the study.
The analysis sample of 24 was balanced between the two genders and distributed across the two age groups (20-29 and 60-69), six participants per group. Demographic summary statistics are given in Table 1. Age distributions did not differ significantly between genders (t(22) = 0.097, p = 0.923).

AgeLab Technical Report 2015-15
©MIT AgeLab 2015 Page 18 of 71
Table 1: Summary statistics by age and gender.
Gender Mean Age SD Minimum Maximum N Older Female 63.2 2.6 61 68 6 Older Male 64.8 2.8 60 68 6 Younger Female 24.2 3.2 20 28 6 Younger Male 24.2 1.8 21 26 6 24
Previous Experience with Cruise Control and ACC
In addition to the recruitment requirements already described, an effort was made to recruit participants who already had some experience with ACC or at least standard cruise control to maximize the likelihood that could become at least somewhat comfortable with the technology during the training period. In the prescreening process and again during a structured interview on-site, potential participants were asked to attest as to whether they used cruise control at least once a month when they were driving. We felt it was highly likely that many drivers without prior experience with ACC might not appreciate the differences between standard cruise control and ACC until they were exposed to it. Therefore, in addition to asking about experience with cruise control during the recruitment process, we asked again about frequency of both cruise control and ACC use in the post-experimental questionnaire. In the post-questionnaire, when asked how often they used ACC (not including the experimental experience), all of the participants in the analysis dataset indicated “never”, i.e. none of them had experienced ACC previously. All but one of the participants had had some experience with basic cruise control previously and the majority reported using cruise control in the range of a few times a month to a few times a week as detailed in Table 2. The relative experience with cruise control was closely distributed across the older and younger age groups.
Table 2: Frequency of previous experience with cruise control by age group.
Age group Never Few times
a year Few times
a month Few times
a week About
once a day More than once a day
Older 1 0 6 4 0 1 Younger 0 1 5 4 1 1 Combined 1 1 11 8 1 2

AgeLab Technical Report 2015-15
©MIT AgeLab 2015 Page 19 of 71
Organization of Results
This report presents data on self-reported workload, task completion time, off-road glance metrics (mean single glance duration, percentage of glances greater than 2 seconds, cumulative total glance time), physiological metrics (heart rate and SCL), and driving performance metrics (mean and SD of velocity, steering wheel reversals). In the sections below, figures provide graphical summaries of the data and present relevant statistical analysis. An error analysis follows. A set of tables in Appendix A provide descriptive statistics (means & standard errors) for each of the dependent measures (Table 8 and Table 9).
Self-Reported Workload
Figure 8: Self-reported workload ratings for each task under study in both adaptive cruise control (ACC) conditions. Bars represent mean performance while error bars represent the mean-adjusted standard error. Numbers at the top of each column represent the number of data points available per task.
Participants were asked to rate how much workload they experienced while engaged in each task while driving on a scale of 0 (low) to 10 (high). Summary statistics are presented graphically in Figure 8. Mean and standard error values are detailed in Appendix A.
An analysis was carried using a two factor repeated measures ANOVA, which included task and ACC status as factors. Workload ratings differed significantly across all tasks (F(2, 46) = 18.21, p < 0.001), but not by ACC condition (F(1, 23) = 0.03, p = 0.864). These factors did not interact

AgeLab Technical Report 2015-15
©MIT AgeLab 2015 Page 20 of 71
significantly (F(2, 46) = 0.63, p = 0.539). Workload ratings ranged from a low of 3.2 during manual contact phone calling, to a high of 4.4 during the manual reference radio tuning task.
Task Completion Time
Figure 9: Task completion times for each task under study. Note that completion times for the baseline driving periods are not included, as these always had a fixed duration.
Task completion times varied significantly across tasks (F(2, 46) = 12.78, p < 0.001), but not between ACC conditions (F(1, 23) = 3.35, p = 0.080), nor did the factors interact significantly (F(2, 46) = 2.07, p = 0.138). Task completion times were shortest, on average, for the manual reference radio tuning task (23.53s), and longest for manual phone contact calling (35.08s).

AgeLab Technical Report 2015-15
©MIT AgeLab 2015 Page 21 of 71
Physiology
Heart Rate
Figure 10: Percentage change in mean heart rate relative to mean baseline driving for each task under study. Labeling as in Figure 8.
Measures of mean heart rate were normalized as the percentage change from the mean heart rate observed during baseline single-task driving periods without adaptive cruise control. (Alternate representation in beats per minute is presented in Appendix B.) Heart rate data is limited to 17 participants in the analysis due to recording issues and/or excessive artifact in 7 of the cases.
Changes in heart rate were significantly affected by task (F(3, 48) = 10.82, p < 0.001), with the small changes evident for the voice based phone contact calling tasks (M = 1.09%), and the largest for the manual phone contact calling tasks (M = 5.84%). Changes in heart rate were also affected by ACC (with ACC M = 3.37%, without ACC M = 1.73%; F(1, 16) = 5.34, p = 0.035). The two factors did not interact significantly (F(3, 48) = 0.60, p = 0.616), indicating that ACC was associated with a consistent elevation in heart rate in all task periods.
AgeLab Technical Report 2015-15
©MIT AgeLab 2015 Page 22 of 71
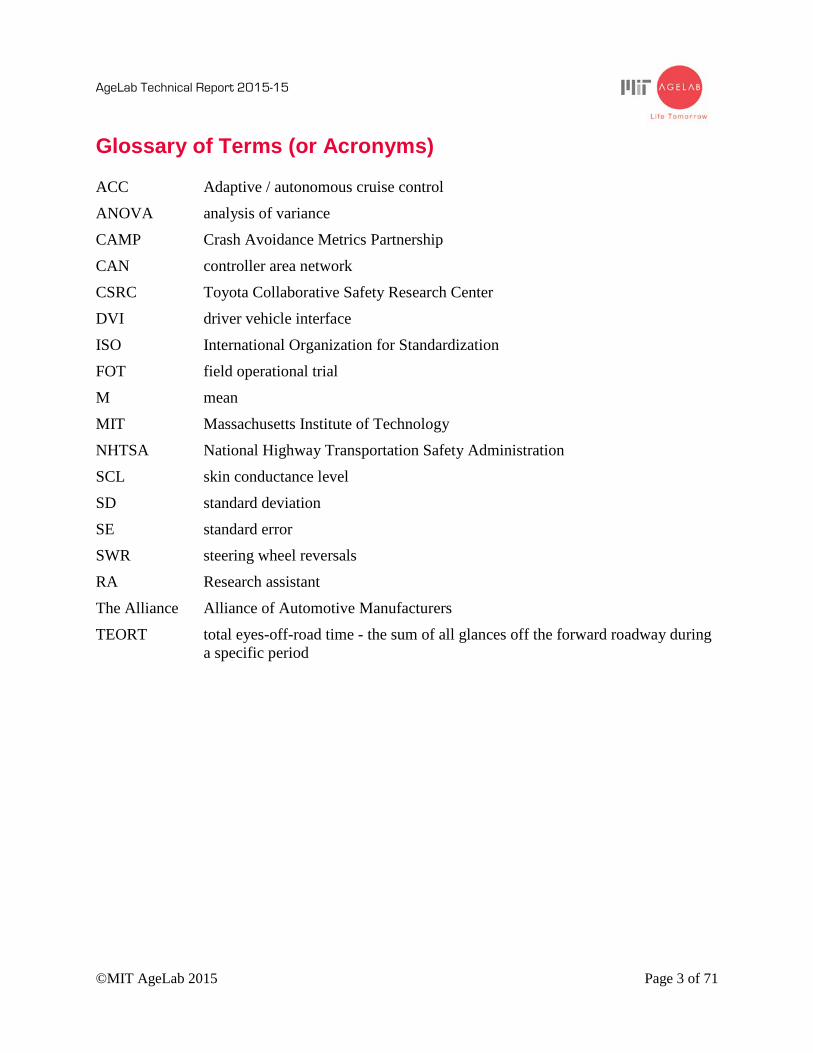
Figure 11: Percentage change in heart rate, faceted by age group and ACC status. All other labeling as in Figure 8.
An analysis of heart rate that added age group (older vs. younger) as a factor found a significant three-way interaction between task, ACC status, and age group (F(3, 45) = 4.26, p = .010). Overall, older adults showed greater arousal as measured by heart rate in response to engaging in secondary tasks and to driving with ACC engaged.
AgeLab Technical Report 2015-15
©MIT AgeLab 2015 Page 23 of 71
Skin Conductance Level
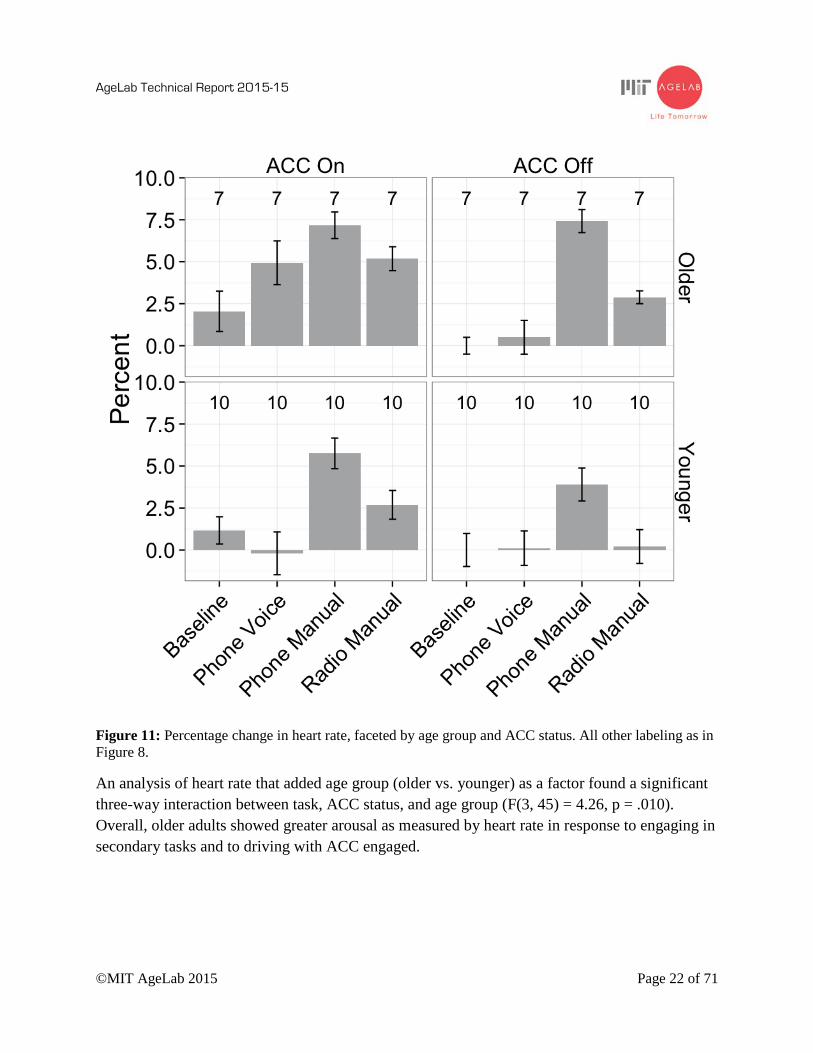
Figure 12: Percentage change in mean skin conductance level relative to mean baseline driving in all tasks periods under study. Labeling as in Figure 8.
Skin conductance measures could not be analyzed for 4 participants due to technical issues and/or high levels of motion artifact in the recordings. An analysis of the remaining 20 participants follows.
As with heart rate, skin conductance level measurements were normalized against measurements from the baseline driving reference period without adaptive cruise control (see Figure 12). (Alternate presentation in physiological units is presented in Appendix B.) Paralleling the results seen for changes in heart rate, changes in skin conductance levels were significantly affected by task (F(3, 57) = 6.10, p = 0.001) and by ACC (F(1, 19) = 4.44, p = 0.049), with no interaction (F(3, 57) = 0.62, p = 0.604). Across task periods, skin conductance changes were lowest during voice-base contact phone calling, and highest during manual contact calling (8.14% and 15.22%, respectively). Skin conductance changes were elevated with ACC (13.01%) compared to without ACC (6.66%).

AgeLab Technical Report 2015-15
©MIT AgeLab 2015 Page 24 of 71
Figure 13: Percentage change in skin conductance level, faceted by age group and ACC status. All other labeling as in Figure 8.
An analysis of skin conductance level that included age as a factor found a significant main effect of age group (F(1, 18) = 9.94, p = .006) and a significant interaction between age group and task (F(3, 54) = 3.65, p = .018). Overall, older adults showed greater arousal as measured by skin conductance level in response to engaging in secondary tasks and to driving with ACC engaged.

AgeLab Technical Report 2015-15
©MIT AgeLab 2015 Page 25 of 71
Glance Behavior
Following NHTSA guidelines (2013), glance behavior is quantified in the section that follows considering glances off-the-forward-roadway. Descriptive statistics (mean and standard deviation) for both off-the-forward-roadway measures and glance-to-device measures are provided in the tables in Appendix A. Glance coding was carried out as per the description in the section on Data Reduction and Analysis.
Mean Single Off-Road Glance Duration
Figure 14: Mean single off-road glance duration during each task under study. Points represent individual participant performance and bars represent task means. Short line segments indicate the 87.5th percentile of performance (21/24 participants), while the large dashed line represents NHTSA’s recommended criterion for this metric. For any task, if the short line segment is below the large dashed line, that task meets NTHSA’s recommended criteria for a visual-manual interface if it was to be applied to these tasks and data the collection methodology employed.
Mean single glance duration differed significantly across tasks (F(3, 69) = 79.79, p < 0.001), but was not affected by ACC (F(1, 23) = 1.09, p = 0.308) or the interaction of these factors (F(3, 69) = 0.10, p = 0.962). The full range of mean single glance durations was fairly constrained, from a low of 0.68s during single-task driving periods to a high of 1.04s during manual phone dialing.
Reference points for NHTSA’s suggested guidelines for maximal visual demand associated with visual-manual tasks are provided in the figure above. Note that these reference points are

AgeLab Technical Report 2015-15
©MIT AgeLab 2015 Page 26 of 71
formally intended to be applied to a specified simulation protocol and a different age distribution than the one used in this study.
Percentage of Single Off-Road Glances Greater than 2.0s
Figure 15: Percentage of long duration off-road glances (in excess of 2.0s) in all tasks under study. Labeling as in Figure 14.
The percentage of long duration glances differed significantly across tasks (F(3, 69) = 11.20, p < 0.001), but not ACC status (F(1, 23) = 0.79, p = 0.384) or their interaction (F(3, 69) = 0.63, p = 0.596). The percentage of long duration glances was lowest during phone voice task (0.23%) and single-task driving (0.43%); it was highest during the manual radio tuning reference task (5.45%).
Reference points for NHTSA’s suggested guidelines for maximal visual demand associated with visual-manual tasks are provided in the figure above. Note that these reference points are formally intended to be applied to a specified simulation protocol and a different age distribution than the one used in this study. Note that the metric for percentage of long duration glances was higher than the NHTSA recommended threshold during the manual radio tuning task during the ACC on condition if it was to be applied to this dataset and testing conditions.

AgeLab Technical Report 2015-15
©MIT AgeLab 2015 Page 27 of 71
Total Eyes Off-Road Time (TEORT)
Figure 16: Mean total off-road glance time (TEORT) for each dual-task period under study. Labeling as in Figure 14.
TEORT, the cumulative duration of off-road glances, differed significantly across secondary task periods (F(2, 46) = 64.83, p < 0.001), but not by ACC status (F(1, 23) = 1.68, p = 0.208). On average, TEORT was lowest during phone voice dialing (6.8s) and highest during phone manual dialing (20.6s). Task and ACC status did not interact significantly, again excluding single-task driving (F(2, 46) = 1.27, p = 0.289).
Reference points for NHTSA’s suggested guidelines for maximal visual demand associated with visual-manual tasks are provided in the figure above. Note that these reference points are formally intended to be applied to a specified simulation protocol and a different age distribution than the one used in this study.

AgeLab Technical Report 2015-15
©MIT AgeLab 2015 Page 28 of 71
Number of Glances Off-Road
Figure 17: Mean number of glances off-the-forward-roadway for each task period under study. Labeling as in Figure 14.
The mean total number of glances off-the-forward-roadway during a task period (see Figure 17) closely resembles the results seen for TEORT. The number of glances differed significantly across tasks (F(2, 46) = 43.43, p < 0.001 ), but not by ACC status (F(1, 23) = 1.60, p = 0.219). The number of glances was lowest during phone voice dialing (9.59) and highest during phone manual dialing (20.16), excluding consideration of single-task driving periods. Task and ACC status did not interact significantly, (F(2, 46) = 1.53, p = 0.227).

AgeLab Technical Report 2015-15
©MIT AgeLab 2015 Page 29 of 71
Percentage of Time Glancing Off-Road
Figure 18: Percentage of time spent glancing off the forward roadway for each task period under study. Labeling as in Figure 14.
Absolute measures of total eyes off-road time are in some ways confounded by the fact that TEORT and total task interaction time are correlated. Therefore, here we present TEORT normalized by task completion time, in other words, the percentage of time spent glancing off the forward roadway. Percent off-road time differed significantly by task (F(3, 69) = 317.65, p < 0.001), with the lowest percentages observed during single-task driving (11.1%), and the highest during the radio manual tuning tasks (61.91%). Percent off-road time did not differ by ACC status (F(1, 23) = 0.90, p = 0.353) or its interaction with task (F(3, 69) = 0.27, p = 0.843) during dual-task driving periods.
While task and ACC status did not interact significantly, inspection of Figure 18 suggests that the largest difference in percent of time spent glancing off of the forward roadway appears during single-task driving (baseline). Considering this effect independently of other factors, a significant difference appears across the average of the two 4 minute long baseline periods (with ACC M = 29.62s, without ACC M = 23.64s, W = 42.0, p = 0.001). Figure 19 on the next page breaks-down glance locations during baseline driving. There is an overall pattern of nominally more glance time off the forward roadway per minute during ACC-on conditions, and this difference reaches statistical significance for the center stack (p= .051) and left side (left mirror and blind spot) (p=.046) glance locations.

AgeLab Technical Report 2015-15
©MIT AgeLab 2015 Page 30 of 71
Figure 19: Total glance time off the forward roadway per minute during baseline driving. Note the higher degree of differentiation between ACC On & Off for the center stack and left locations.
Off-Road Glances per Minute
Figure 20: Glances per minute off the forward roadway. Labeling as in Figure 14.

AgeLab Technical Report 2015-15
©MIT AgeLab 2015 Page 31 of 71
As we normalized TEORT in the previous section, here we normalize glance frequency as the number of off-road glances per minute (glance rate). Glance rate differed significantly by task (F(3, 69) = 114.24, p < 0.001), with the lowest rate observed during single-task driving (9.77 glances/min), and the highest during the radio manual tuning tasks (37.13 glances/min). Glance rate did not differ by ACC status (F(1, 23) = 0.93, p = 0.344) or its interaction with task (F(3, 69) = 0.69, p = 0.563) when considering all periods.
However, as was the case with TEORT, a significant difference between ACC conditions is observed for glance frequency when single-task driving is considered alone (with ACC M = 10.54, without ACC M = 9.01; W = 55.0, p = 0.012). Figure 21 breaks-down glance locations during baseline driving. There is an overall pattern of nominally more frequent glances off the forward roadway during ACC-on conditions, and this difference reaches statistical significance for the center stack (p= .017) and might be considered to represent a trend for the left side (left mirror and blind spot) (p=.086) glance locations.
Figure 21: Glances per minute off the forward roadway during baseline driving. Note the higher degree of differentiation between ACC On & Off for the center stack and left locations.
Glance Metric Monte Carlo Analysis
While this study examines the performance of a total of 24 participants (6 per age/gender cell, with a 2 age cell split), NHTSA’s guidelines for the evaluation of visual-manual distraction recommend a balanced sample of 24 participants split equally across 4 age groups (3 per age/gender cell). The present study employs a simpler age split (20s and 60s), and thus does not

AgeLab Technical Report 2015-15
©MIT AgeLab 2015 Page 32 of 71
precisely follow the NHTSA guidelines. To test the reliability of these results, a Monte Carlo analysis was performed, in which 3 participants are sampled with replacement from every cell, to produce a randomized subsample.
Two thousand randomized subsamples were created, and their pattern of pass/fail criteria compared to the full reference sample. Table 3 presents the percentage of subsamples that agree with the pass/fail findings in the main reference sample. Subsample agreement was 100% for mean single glance durations, and quite high for TEORT. Agreement for the percentage of long duration glances during radio manual tuning with ACC was low (31.35%), suggesting that the particular pass/fail result obtained in the present study may result from a low number of outlier data points.
Table 3: Percentage of subsamples with pass/fail criteria in agreement with the main reference sample.
ACC Task Percentage of Glances > 2.0s
Mean Single Off-Road Glance Duration
Cumulative Off-Road Glance Time
Off Phone Manual 84.25% 100.00% 100.00% Phone Voice 100.00% 100.00% 93.25% Radio Manual 93.85% 100.00% 100.00% Just Drive 100.00% 100.00% 100.00% On Phone Manual
Phone Voice Radio Manual Just Drive
99.50% 100.00%
31.35% 100.00%
100.00% 100.00% 100.00% 100.00%
100.00% 94.05% 98.75%
100.00%

AgeLab Technical Report 2015-15
©MIT AgeLab 2015 Page 33 of 71
Orienting Behavior
Analysis of orienting behavior toward the center stack was included here as a carry-over from previous studies in this overall project. The analysis employed the same single coder methodology as the previous studies in which the coder watched muted video recorded from the camera mounted on the vehicle dashboard, facing the driver. This camera recorded the participant’s face and upper torso, providing a clear view of their posture and head orientation. Participant’s behaviors were coded according to the guide below. It should be noted that the analysis does not explicitly distinguish glances for visual confirmation from glances associated with orienting response (OR) behavior, and it is recognized that this is a partial confounding factor in the coding.
Table 4: Coding guide for orienting behavior including color codes used in graphic figures.
Category Color Code
Description
Unknown gray Participant did not perform the task or its corresponding data are missing.
None dark green
Participant exhibits no orienting response (OR) towards the center console display. This means there is no head tilting or leaning of the body towards the device (center console display).
Slight light green
Participant exhibits some mild OR towards the device. The participant leans his/her head towards the device periodically throughout the task, or briefly leans his/her body toward the device.
Moderate yellow Participant exhibits a fair amount of OR towards the device. This means the participant leans his/her head or body towards the device or speaks directly at the device for a sustained period of time.
Prioritizing red Participant exhibits a clear and sustained OR toward the device. This means that the participant fully leans his/her head towards the device or repositions his/her body toward the device. The participant may also appear to be speaking directly at the device while also glancing for prolonged periods of time at the screen.
Note that the visible Impala interface was distributed across the press to speak button on the steering wheel, the center console display, and the small display in the center of the instrument cluster. Orienting behavior in this analysis considered just the center console display as was the case in the Lincoln MKS in the initial studies. The addition of the small display in the instrument cluster for presenting some of the interface information was anticipated to reduce the likelihood that participants might orient toward the center console during voice-command based tasks.

AgeLab Technical Report 2015-15
©MIT AgeLab 2015 Page 34 of 71
Figure 22: Orienting responses during voice-based contact phone calling, divided across age groups and genders, as assessed by a single coder. This graphic visualizes each participant’s greatest degree of orienting for each trial.
As is evident from Figure 22, there was almost no evidence of orienting behavior during vocal phone contact calling tasks in the Impala. The low rate of orienting behaviors is generally consistent with what was observed for voice-base phone contact calling in the Impala is Study 1.

AgeLab Technical Report 2015-15
©MIT AgeLab 2015 Page 35 of 71
Driving Performance
Mean Velocity
Figure 23: Mean vehicle velocity during all task periods under study. Labeling as in Figure 8.
Velocity readings are included for all participants except one who experienced substantial traffic during manual phone dialing periods. Mean velocity was not significantly affected by task (F(3, 66) = 1.61, p = 0.195), ACC status (F(1, 22) = 2.03, p = 0.168), or their interaction (F(3, 66) = 0.93, p = 0.429). (This plot is also provided in mph in Appendix B.)

AgeLab Technical Report 2015-15
©MIT AgeLab 2015 Page 36 of 71
Variability in Velocity
Figure 24: Standard deviation in velocity in all task periods under study. Labeling as in Figure 8.
Standard deviation values for longitudinal velocity (Figure 24) differed significantly across tasks (F(3, 66) = 13.49, p < 0.001), and shows a borderline influence of ACC (F(1, 22) = 3.49, p = 0.075). These two factors interacted significantly (F(3, 66) = 4.12, p = 0.010). Posthoc testing indicates that, while the effect of ACC was not significant during the lengthy single-task driving periods (ACC M = 3.72km/hr, noACC M = 3.07km/hr; W = 148.0, p = 0.777), the effect was significant during all dual-task periods, including phone voice dialing (ACC M = 0.96km/hr, noACC M = 1.85km/hr; W = 256.0, p < 0.001), phone manual dialing (ACC M = 1.48km/hr, noACC M = 2.39km/hr; W = 221.0, p = 0.010), and radio manual tuning (ACC M = 1.34km/hr, noACC M = 2.26km/hr; W = 241.0, p < 0.001).

AgeLab Technical Report 2015-15
©MIT AgeLab 2015 Page 37 of 71
Steering Wheel Reversals
Steering wheel reversals were considered as a control metric and classified as proposed in the final report of the European Union AIDE project (deliverable D2.2.5, section 7.12) (Östlund et al., 2005). (See also SAE (2015) standard document J2994 for additional discussion of this metric.) Major steering wheel reversals captures the number of steering wheel inputs exceeding an angular reversal gap of 3°. For minor steering wheel reversals, an angular reversal gap of 0.1° was used. The rate of steering wheel reversals per minute was obtained by dividing the raw reversal count by the task trial duration.
Major Steering Wheel Reversals
Figure 25: Major steering wheel reversal rates in all task periods under study. Labeling as in Figure 8.
Major steering wheel reversals differed significantly across all tasks (F(3, 69) = 14.44, p < 0.001), but did not differ by ACC status (F(1, 23) = 0.17, p = 0.688), or their interaction (F(3, 69) = 1.45, p = 0.235). Major wheel reversal rates were lowest during vocal phone dialing (2.26 reversals/min) and higher during the manual radio tuning reference task and manual phone contact calling (6.37 reversals/min).
AgeLab Technical Report 2015-15
©MIT AgeLab 2015 Page 38 of 71
Minor Steering Wheel Reversals
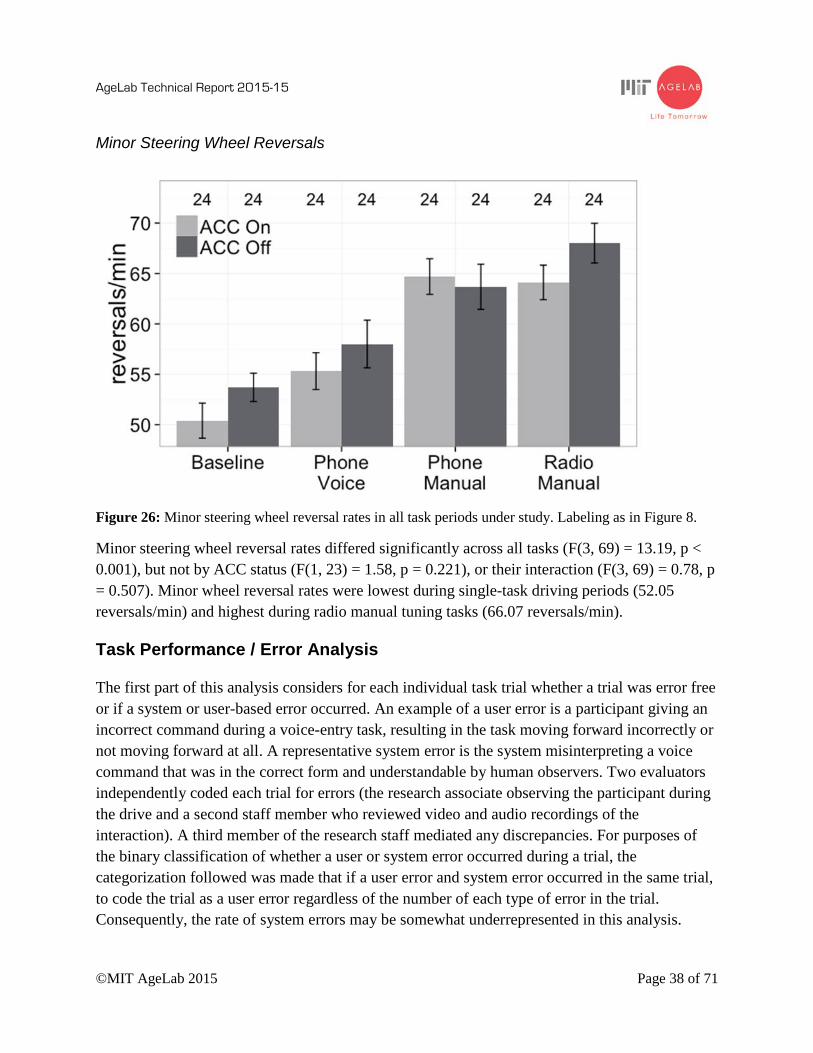
Figure 26: Minor steering wheel reversal rates in all task periods under study. Labeling as in Figure 8.
Minor steering wheel reversal rates differed significantly across all tasks (F(3, 69) = 13.19, p < 0.001), but not by ACC status (F(1, 23) = 1.58, p = 0.221), or their interaction (F(3, 69) = 0.78, p = 0.507). Minor wheel reversal rates were lowest during single-task driving periods (52.05 reversals/min) and highest during radio manual tuning tasks (66.07 reversals/min).
Task Performance / Error Analysis
The first part of this analysis considers for each individual task trial whether a trial was error free or if a system or user-based error occurred. An example of a user error is a participant giving an incorrect command during a voice-entry task, resulting in the task moving forward incorrectly or not moving forward at all. A representative system error is the system misinterpreting a voice command that was in the correct form and understandable by human observers. Two evaluators independently coded each trial for errors (the research associate observing the participant during the drive and a second staff member who reviewed video and audio recordings of the interaction). A third member of the research staff mediated any discrepancies. For purposes of the binary classification of whether a user or system error occurred during a trial, the categorization followed was made that if a user error and system error occurred in the same trial, to code the trial as a user error regardless of the number of each type of error in the trial. Consequently, the rate of system errors may be somewhat underrepresented in this analysis.

AgeLab Technical Report 2015-15
©MIT AgeLab 2015 Page 39 of 71
Figure 27: Error rates for each task across all trials and participants.
As shown in Figure 27, error rates were quite low overall, with the highest percentage of errors occurring during radio manual tuning without adaptive cruise control. The majority of trials recorded as having errors involved user errors, as opposed to system-based, although it should be kept in mind that precedence was given to coding user errors of both type occurred in the same trial.
The next analysis is a more fine-grained characterization of the extent to which participants experienced difficulty completing a task. Individual trials were classified as: 1) completed without error or backtracking, 2) completed with backtracking, 3) completed with one instance of the research associate providing a prompt to assist the participant, 4) completed with more than one prompt by the research associate, or 5) failure to complete the task. An example of “backtracking” is the situation where the system did not recognize or misinterpreted a street name, but the dialog allowed another opportunity for entry by asking for confirmation or indicating that it did not understand. In other words, a backtracking classification indicates that the system successfully supported error recovery (arising from either user error or system recognition error) and did not require the participant to begin the entire task again from the start. Backtracking could also occur when a participant recognized that they made an error (such as giving a wrong street name) and used an option provided by the system to correct the error. If the research associate judged that a participant was not progressing through a task on their own, one or more limited prompts was provided. The intent was to provide participants, as needed, with further assistance in learning how to use the system so that they might gain additional familiarity

AgeLab Technical Report 2015-15
©MIT AgeLab 2015 Page 40 of 71
and potentially be more successful on subsequent trials. If a participant restarted a task more than twice or otherwise failed to progress in the interaction despite assistance, then they were guided through terminating the trial and moved-on. Failure to progress could be due to either user or system errors. Trials that failed to progress or were terminated due to either user or system errors were categorized as a failure.
Figure 28: Graphical counts of error level for each trial of the manual phone calling task. Note that each column fully represents the 24 participants under consideration.

AgeLab Technical Report 2015-15
©MIT AgeLab 2015 Page 41 of 71
Figure 29: Graphical counts of error level for each trial of the voice phone calling task. Note that each column fully represents the 24 participants under consideration.
Figure 30: Graphical counts of error level for each trial of the radio manual tuning task.
As the previous figures indicate, error rates were low among the tasks studied here, with a slightly higher proportion of errors occurring during radio manual tuning tasks.

AgeLab Technical Report 2015-15
©MIT AgeLab 2015 Page 42 of 71
Table 5 and Table 6 provide a numerical breakdown of error rates by level of assistance required and source of error.
Table 5: Number of tasks/participants requiring a given level of assistance to complete a task.
ACC Task Unknown > 1 RA Assist 1 RA Assist Backtracking Error-Free (all)
On Phone Manual 0 2 1 1 44 48 Phone Voice 0 0 0 3 45 48 Radio Manual 1 0 3 1 43 48 (all) 1 2 4 5 132 144 Off Phone Manual 0 1 0 1 46 48 Phone Voice 0 1 1 0 46 48 Radio Manual 2 2 3 1 40 48 (all) 2 4 4 2 132 144 (all) (all) 3 6 8 7 264 288

AgeLab Technical Report 2015-15
©MIT AgeLab 2015 Page 43 of 71
Table 6: Task performance by trial tabulated by error type.
ACC Task Unknown None System User (all) On Phone Manual 0 44 0 4 48 Phone Voice 0 45 3 0 48 Radio Manual 1 43 0 4 48 (all) 1 132 3 8 144 Off Phone Manual 0 46 0 2 48 Phone Voice 0 46 1 1 48 Radio Manual 2 40 0 6 48 (all) 2 132 1 9 144 (all) (all) 3 264 4 17 288
Figure 31: “Worse case” experience by task type at the individual participant level.
Across the 24 participants, color bars in Figure 31 indicate the highest level of difficulty experienced per participant during each task type.

AgeLab Technical Report 2015-15
©MIT AgeLab 2015 Page 44 of 71
Self-Report on Post-Experimental Questionnaire
Table 7: Descriptive statistics (mean, SD, and range) and test for age group differences.
Item (See Appendix for full text of each item.) Descriptive Stats with Test for Age
Younger Older Combined ANOVA F & p-values1
1 How awake or drowsy do you feel now? (1=very awake, 10 =Extremely drowsy)
4.1 (2.3) [1 – 8]
2.1 (1.2) [1 – 4]
3.3 (2.2) [1 – 8]
F = 9.48 p = .005*
2 How would rate your stress level now? (1=not stressed at all, 10=very stressed)
2.2 (1.2) [1 – 5]
2.2 (1.7) [1 – 6]
2.2 (1.5) [1 – 6]
0.00 p = 1.00
3 Overall impression of vehicle driven? (1=not at all positive, 10=very positive)
8.6 (1.2) [6 – 10]
7.3 (2.0) [4 – 10]
7.9 (1.7) [4 – 10]
3.66 p = 0.069+
4a How likely to use voice calling? (1=not at all, 10=very)
9.4 (1.1) [7 – 10]
9.8 (0.4) [9 – 10]
9.6 (0.8) [7 – 10]
1.57 P = 0.223
4b How likely to use manual calling? (1=not at all, 10=very)
3.1 (2.4) [1- 8]
2.4 (1.3) [1 – 5]
2.8 (1.9) [1 – 8]
0.72 p = 0.406
4c How likely to use manual radio? (1=not at all, 10=very)
7.0 (2.4) [1 – 10]
4.5 (1.8) [2 – 8]
5.6 (2.6) [1 – 10]
6.20 p =0.021*
7 How likely to recommend to friend? (1=not at all, 10=a lot)
8.3 (0.7) [3 – 10]
8.7 (0.8) [6 – 10]
8.5 (1.0) [3 – 10]
0.51 p = 0.482
8 Like to have if technology perfected? (1=not at all, 10=a lot)
9.1 (0.5) [5 – 10]
9.3 (0.7) [7 – 10]
9.2 (1.0) [5 – 10]
0.25 p =0.625
9 How much did you trust ACC? (1=not at all, 10=a lot)
9.1 (0.8) [8 – 10]
8.9 (0.8) [8 – 10]
9.0 (0.8) [8 – 10]
0.27 p = 0.612
10 How much did you like the concept? (1=not at all, 10=a lot)
8.8 (1.1) [7 – 10]
9.2 (0.8) [8 – 10]
9.0 (1.0) [7 – 10]
0.69 p =0.416
11a Did ACC make you more comfortable driving in general? (1=not at all, 10=very)
7.5 (1.2) [6 – 10]
7.7 (2.2) [3 – 10]
7.6 (1.7) [3 – 10]
0.10 p = 0.757
11b …with other vehicles changing speed in front of you? (1=not at all, 10=very)
7.9 (1.4) [5 – 10]
8.1 (1.9) [4 – 10]
8.0 (1.7) [4 – 10]
0.06 p = 0.813
11c …using voice interface to place a call? (1=not at all, 10=very)
7.4 (2.8) [1 – 10]
8.4 (2.0) [3 – 10]
7.9 (2.4) [1 – 10]
1.02 p = 0.324
11d …using manual interface to place a call? (1=not at all, 10=very)
6.0 (2.8) [2 – 10]
4.1 (2.3) [1 – 9]
5.0 (2.7) [1 – 10]
3.39 p = 0.079+
11e …using manual radio controls? (1=not at all, 10=very)
5.9 2.6() [2 – 10]
4.6 (2.4) [2 – 9]
5.3 (2.5) [2 – 10]
1.73 p = 0.202
13 Impact on ability to learn new technologies (1=decreased, 10=increased)
6.4 (1.7) [4 – 10]
7.1 (1.7) [5 – 10]
6.8 (1.7) [4 – 10]
0.92 p = 0.348

AgeLab Technical Report 2015-15
©MIT AgeLab 2015 Page 45 of 71
1One-way ANOVAs with LSD correction, F(1,23) except for item 9 in which 1 older participant did not provide a response.
The full text and format of the post-experimental questions are provided in Appendix C. The responses to scaled questions (Table 7) indicate no dramatic overall differences by age group in the individuals considered in the analysis sample. Only two items showed statistical differences (1 and 4c) for age relationships. On average, participants in their 60s rated themselves as somewhat less drowsy (M= 2.1) at the end of the study than participants in their 20s (M= 4.1) on a very awake (1) to extremely drowsy (10) scale. Interestingly, the only other item to show a statistically significant effect of age was the question asking how likely a participant would be to use the manual radio controls available in the study vehicle to fine tune the radio as they did during the study if they were driving on their own. The older participants indicated that they would be much less likely to engage in this activity (M= 4.5) than younger participants (M= 7.0) on a not at all likely (1) to very likely (10) scale. Possible interpretations of this and other patterns appearing in the post-experimental questionnaire are taken-up in more detail in the Discussion that follows.
In addition to the responses summarized in Table 7, four open-ended questions were asked. The full text of participants’ individual responses to these items are provided in Appendix D.
Participant Choice on Option to Continue or Discontinue use of ACC
After the completion of the main assessment period, participants were directed back to I93 South toward MIT. Once on this highway, they were instructed that they were to continue driving with the ACC system engaged but would no longer be following the confederate vehicle. The confederate vehicle remained in the right lane and the participant was instructed to move to the center lane and pass the confederate vehicle. After 3 minutes of driving with the ACC system active without the confederate lead vehicle, the participants were given the following instruction: “We will now continue driving back to MIT. If you would like, you may now turn the ACC system off; otherwise you may leave the ACC system on.” The RA would verbally confirm the participant’s decision to keep the system active or deactivate it. The remainder of the drive consisted of just driving until nearing the exit to Cambridge, at which point the RA instructed the subject to deactivate the system if they had not already. Of the 24 participants in the analysis sample, 22 elected to leave the ACC system active and 2 elected to disengage the ACC system. Both of the participants who elected to disengage the ACC system were from the younger group.
AgeLab Technical Report 2015-15
©MIT AgeLab 2015 Page 46 of 71
Discussion
As noted in the Introduction, the original Phase II work-plan included a charge for the research team to begin to examine whether the demand / workload associated with a voice-command DVI might differ or otherwise influence driver behavior in the presence of automation in the vehicle. In developing the study design for this portion of the project, we elected to take a somewhat broader look at this question by evaluating drivers’ behavior and self-reported experiences with and without adaptive / autonomous cruise control (ACC) active under single-task (baseline) highway driving, when interacting with a voice-based DVI for contact phone calling, a visual-manual based DVI for contact phone calling, and when engaging in a visual-manual radio turning reference task. Given that the evaluation was built-around a single visit exposure as opposed to an extended field operational trial (FOT) or naturalistic study, a key component of the study design was providing participants with guided exposure to ACC and an opportunity to develop some initial level of trust in the technology before commencing the formal assessment period. In addition, the research sample was deliberately stratified into younger (20-29) and older (60-69) age groups to support an exploratory look at the extent to which age / generational cohort considerations might impact the degree to which drivers may vary in their comfort and trust in this level of automation.
None of the analysis sample of 24 participants had experience with ACC prior to the study, although the majority reported using basic cruise control in the range of a few times a month to a few times a week. Note – even though participants were asked in both the prescreening and in an in-person interview at the research site whether they used cruise control at least once a month, one older participant reported after the experiment that they had never used cruise control previously and a younger adult reported using cruise control only a few times a year. The degree to which this divergence in reported behavior (pre- vs. post-experiment) is due to an increased understanding of what cruise control is, or other factors, is an open question. Otherwise, the overall distribution of experience between the older and younger samples with cruise control was quite similar (see Table 2). Not included in the analysis sample are one older participant (age 67) who was unable to grasp the concept of the ACC interface during the parking lot orientation, one older participant (age 69) who did not understand the functional operation of the system during the on-road training segment and did not progress to the assessment phase, and one older participant (age 64) who was not able to develop sufficient trust in the function of ACC during the on-road training period to progress to the assessment phase. Keeping these age associated exclusions in mind, overt differences in behavior by age group were generally limited, although the pattern of differences, when they appear, were of interest as will be discussed shortly.
Secondary task completion times varied by task type, with voice-based phone contact calling taking on average a third less (10.5s) than using the primary visual-manual interface, but no overall statistically significant effect of ACC status appeared for task completion time. Mean

AgeLab Technical Report 2015-15
©MIT AgeLab 2015 Page 47 of 71
velocity was slightly lower by approximately a km/hr when ACC was active; however, this difference was not statistically significant. Variability of velocity showed an interesting pattern likely reflecting differences in control capability of automated vs. manual control. During the longer single task driving periods, variability of velocity was nominally higher when ACC was on vs. when the driver was controlling the throttle. In contrast, during the secondary task periods when the driver had to divide attention between driving and the secondary task, variation in speed control was lower when ACC was controlling the throttle. Both major and minor steering wheel reversals showed no overall effect of ACC status.
Mean single glance durations and percentage of longer duration off-road glances (> 2s) showed no overall effect of ACC status across baseline driving and secondary task periods. Similarly, total eyes off-road time (TEORT) showed no effect of ACC status across the three secondary tasks. TEORT for baseline driving was considered separately from the secondary task periods since these periods were significantly longer in duration than the secondary task periods and has a different conceptual relevance than during discrete time limited secondary tasks. Comparing TEORT during the ACC-on and ACC-off baseline driving periods directly shows a significant effect of ACC. On average, participants spent approximately 6 seconds longer looking off the forward roadway per 4 minute baseline driving period when ACC was on (M = 29.6s) vs. when ACC was off (M = 23.6s). Considering the data from the perspective of glance frequency, participants, on average, made approximately 1.5 more glances per minute off the forward roadway when ACC was on (M = 10.5) vs. when ACC was off (M = 9.0).
The question of why glance frequency off the forward roadway and TEORT would be higher when ACC is active is quite intriguing. From a conceptual standpoint, one of the functions of ACC is to relive the driver of some of the demand of attending to moment-to-moment activity on the forward roadway. This is not to say that the driver has been fully relieved of responsibility maintaining awareness of what is happening directly ahead, but the immediate fine control of forward separation discipline is being managed by the ACC system. This reduction in (as opposed to removal of) immediate demand for forward centered attention might be expected to open the driver-up somewhat to alternate draws on peripheral attention. If ACC is in actuality having this effect, the pattern of glance allocation shift observed during the ACC baseline periods makes functional sense. Recall that while glance allocation across all regions trended to being higher during the ACC-on periods, this reached statistical significance for the left side (left mirror and blind spot) and the region of the center stack display. In reviewing the environment in which this data was collected, two observation stood out. First, the vehicle was traveling in the middle of three lanes of highway traffic and following a confederate lead vehicle that was also traveling with its ACC system set to the posted speed limit of 65mph. Consequently, traffic in the high speed lane to the left was often approaching from the rear and overtaking the participant vehicle, as many other drivers drove above the posted speed limit. Such overtaking traffic would set-off the blind spot warning indicator in the left side mirror, making for a periodic draw on

AgeLab Technical Report 2015-15
©MIT AgeLab 2015 Page 48 of 71
attention that might well be all that more salient if ACC was relieving some of the attentional demand on the forward roadway. Second, while the radio sound was muted / off during the baseline periods, the radio display was “on” to allow for interaction with other telematics features such as phone dialing. A review of video from the drives confirmed that the radio display was frequently updating with Radio Data System text indicating the name of the currently playing song and other related content. Again, with some of the perceived attentional demand of the forward roadway reduced, the relative salience of this constantly changing visual content would be expected to increase. Both types of peripheral stimuli would tend to pull driver attention somewhat more frequently if ACC was in fact reducing some aspects of attentional demand. This would tend to suggest that some degree of behavioral adaption to the ACC system was in fact taking place during the course of the relatively brief exposure developed during the experimental drive.
Other data on adaptation to the ACC system presents an interesting mix of findings. Overall, participants generally reported a very positive response to the technology. The mean trust rating was 9.0 on a not at all (1) to a lot (10) rating scale. The same 9.0 rating was given to the likelihood of recommending a vehicle with a similar technology to a friend or family member. In contrast, the overall rating of their general impression of the vehicle, while quite positive, was a more modest 7.9. Self-reported ratings of comfort levels with the technology were also positive but, like the overall vehicle rating, somewhat more reserved than for the trust rating. In specific, when asked to rate on the scale of not at all (1) to a lot (10) of the extent to which ACC made participants more comfortable than driving without the technology, the mean rating value for driving in general was 7.6. The degree to which having ACC increased comfort showed an interesting relationship with the secondary tasks. The extent to which ACC increased comfort in using the voice-based interface to place a phone call was given, on average, a positive rating of 7.9 while the improvement in comfort with having ACC-on when using the manual-interface to place a phone call was more moderate (M = 5.0), as it was for manually tuning the radio (M = 5.3). Verbal self-reported workload levels made by the drivers immediately following each task set showed a similar pattern. While there was no overall main effect of ACC status across the secondary task sets, self-reported workload was nominally lower during voice- phone contact calling with ACC on relative to when ACC was off. The reverse was seen during the two visual-manual secondary tasks – self-reported workload levels were nominally higher during visual- manual contact selection and radio tuning with ACC was on vs. when it was not. One interpretation of these results is that the drivers were more comfortable with letting the ACC support them in a secondary task while they were still able to remain largely oriented toward the roadway.
The physiology data appears to support the view that the participants, on average, felt intellectually positive about the capabilities of the ACC system while not yet fully feeling comfortable with the technology at the “gut” level. Relative to driving without ACC, heart rate

AgeLab Technical Report 2015-15
©MIT AgeLab 2015 Page 49 of 71
was elevated across the periods with ACC engaged. This effect was modest in terms of absolute levels, falling somewhere in the range of the demand associated with the addition of a 0-back task to the drivers’ concurrent load (as observed in Phase II Study 1 in this vehicle), but was highly consistent across task periods and statistically significant. The same pattern appears in the skin conductance level data, again showing added arousal in the range of that added by a 0-back task. This pattern was again highly consistent and statistically significant. These combined data suggest that physiology may a more accurate method for assessing how long it takes drivers to fully adapt to a new technology than based on self-reported trust alone.
Finally, some further observations regarding the age related data are in order. It seems clear that somewhat older adults (those in their 60s) can be as accepting and able to learn how to use a semi-autonomous technology such as ACC as much younger adults (those in their 20s). At the same time, this relatively small sample does suggest that some older adults will find this more challenging. In specific, the three participants who were excluded from the analysis sample due to difficulties with understanding or adapting to ACC under the training protocol where all in their 60s. In addition, while the older participants reported, on average, a very similar level of trust in the ACC technology relative to the younger participants (M = 8.9, M = 9.1 respectively; p = 0.612), the older participants showed significantly greater elevation in heart rate and skin conductance level differentials than the younger participants during the ACC-on vs. ACC-off periods. In this regard, it can be noted in our previous work comparing younger and older adults in these age ranges during highway driving, older adult samples generally show equivalent or lower percentile changes in arousal in heart rate and skin conductance to the same levels of overt cognitive demand (n-back tasks). Thus, the greater reactivity seen in the older adults would tend to suggest that they were not as fully comfortable at this “gut” level than the younger participants. This indicates that older drivers may require somewhat greater support and exposure to a technology similar to ACC to reach full adaptation.
Based on the behaviors observed in this study, we do not at the current time see any reason to propose fundamentally changing the basic concept of operation of the type of voice-command interface considered here under the level of automation represented by the ACC system. However, the degree to which this will continue to hold for higher levels of automation is unknown. On the other hand, the changes in attention allocation observed during baseline driving when ACC was engaged may suggest that the salience of alerts, alarms, and information displays may differ under various levels of automation and that this should be taken into account in the conceptualization of attention in this context. A broader study of these factors is warranted.
Limitations
It is recognized that the present study is based on a limited sample size of 24 participants in the analysis sample and should be consider exploratory in nature. While extensive efforts were made

AgeLab Technical Report 2015-15
©MIT AgeLab 2015 Page 50 of 71
to provide participants with a conceptual understanding of the principles of operation of the ACC system and to provide practical exposure to system function through the training period with interactions with a confederate vehicle, subsequent exposure to the ACC system was still relatively brief. Consequently, observations concerning adaptation patterns should be interpreted conservatively.
Conclusions & Next Steps
The glance patterns observed during single task (baseline) driving with ACC active suggest that visual scanning behavior may well change somewhat under increasing levels of automation. While the shifts in the distribution of glances and time looking off of the forward roadway observed in this study may well be quite appropriate to the conditions, developing a better understanding of how automation influences the distribution of attention seems appropriate. More extensive FOT and/or naturalistic study of the impact of such semi-autonomous technologies on the distribution of attention seems indicated. Similarly, the data on heightened physiological arousal during the ACC-on periods in participants who generally indicate a high level of trust in the ACC technology suggests that objective measures of adaptation in addition to self-report are warranted. A more detailed understanding of the length of time required for drivers to fully adapt to the experience of autonomous technologies should be considered. While older participants learned to engage with the semi-autonomous ACC technology, there are indications that age may be a factor in the ease with which drivers adapt to such new technologies and a better understanding of how best to support such drivers should be considered.
Acknowledgements
Acknowledgement is extended to the Toyota Collaborative Safety Research Center (CSRC) which provided the primary funding for this project. In addition, we are particularly grateful for the valuable, constructive comments provided by James Foley and Kazutoshi Ebe of CSRC during the development of the study. Appreciation is also extended to Fred Lupton and Tuhin Diptiman for insightful comments and input during the study design process.
Supplemental / matching support was provided United States Department of Transportation’s Region I New England University Transportation Center at MIT.
This work would not have been possible without the support of AgeLab staff including: Hale McAnulty, Alea Mehler, Hillary Abraham, Dan Brown, Tom McWilliams, and Anthony Pettinato in study management, participant recruitment, the development and refinement of data analysis and extraction tools, data collection, and exhaustive reduction and coding of eye glance and other data.

AgeLab Technical Report 2015-15
©MIT AgeLab 2015 Page 51 of 71
The interpretive aspects of this report reflect the views of the authors, who are also responsible for the factualness and accuracy of the information presented herein.
References
Conover, W. J., & Iman, R. L. (1981). Rank transformations as a bridge between parametric and nonparametric statistics. American Statistician, 35(3), 124–129.
Friedman, M. (1937). The use of ranks to avoid the assumption of normality implicit in the analysis of variance. Journal of the American Statistical Association, 32(200), 675–701.
ISO 15007-1. (2002). Road vehicles - Measurement of driver visual behaviour with respect to transport information and control systems - Part 1: Definitions and parameters. Geneva, Switzerland: International Standards Organization.
ISO 15007-2. (2001). Road vehicles - Measurement of driver visual behaviour with respect to transport information and control systems - Part 2: Equipment and procedures. Geneva, Switzerland: International Standards Organization.
Mehler, B., Kidd, D., Reimer, B., Reagan, I., Dobres, J. & McCartt, A. (2015). Multi-modal assessment of on-road demand of voice and manual phone calling and voice navigation entry across two embedded vehicle systems. Ergonomics. DOI:10.1080/00140139.2015.1081412.
Mehler, B., Reimer, B., Dobres, J., McAnulty, H., Mehler, A., Munger, D., & Coughlin, J.F. (2014). Further evaluation of the effects of a production level “voice-command” interface on driver behavior: replication and a consideration of the significance of training method. MIT AgeLab Technical Report No. 2014-2 (July 9, 2014). Massachusetts Institute of Technology, Cambridge, MA.
National Highway Traffic Safety Administration. (2013). (Issued Guidelines) Visual-Manual NHTSA Driver Distraction Guidelines for In-Vehicle Electronic Devices (Docket No. NHTSA-2010-0053). Washington, DC: U.S. Department of Transportation National Highway Traffic Safety Administration (NHTSA).
Östlund, J., Peters, B., Thorslund, B., Engström, J., Markkula, G., Keinath, A., Horst, D., Juch, S., Mattes, S., & Foehl, U. (2005). Adaptive Integrated Driver-Vehicle Interface (AIDE): Driving performance assessment - methods and metrics. (Report No. IST-1-507674-IP). Information Society Technologies (IST) Programme, Gothenburg, Sweden.
R Core Team. (2013). R: A language and environment for statistical computing. Vienna, Austria: R Foundation for Statistical Computing. Retrieved from http://www.R-project.org/
Reimer, B., Gruevski, P., & Coughlin, J.F. (2014). MIT AgeLab Video Annotator, Cambridge, MA. https://bitbucket.org/agelab/annotator
Reimer, B., & Mehler, B. (2011). The impact of cognitive workload on physiological arousal in young adult drivers: A field study and simulation validation. Ergonomics, 54(10), 932–942.

AgeLab Technical Report 2015-15
©MIT AgeLab 2015 Page 52 of 71
Reimer, B., Mehler, B., Dobres, J. & Coughlin, J.F. (2013). The effects of a production level “voice-command” interface on driver behavior: reported workload, physiology, visual attention, and driving performance. MIT AgeLab Technical Report No. 2013-17A (November 18, 2012). Massachusetts Institute of Technology, Cambridge, MA.
SAE (2015). SAE International Surface Vehicle Recommended Practice, “Operational definitions of driving performance measures and statistics,” SAE Standard J2944, June 2015.
Smith, D.L., Chang, J., Glassco, R., Foley, J., & Cohen, D. (2005). Methodology for capturing driver eye glance behavior during in-vehicle secondary tasks. Transportation Research Record: Journal of the Transportation Research Board, 1937(1), 61-65.
Task Force of the European Society of Cardiology and the North American Society of Pacing and Electrophysiology (1996). Heart rate variability: standards of measurement, physiological interpretation, and clinical use. European Heart Journal, 17, 354-381.

AgeLab Technical Report 2015-15
©MIT AgeLab 2015 Page 53 of 71
Appendix A: Descriptive Statistics (Summary Tables)
Baseline Driving and Radio Manual Periods Table 8: Means (and standard errors) for each single-task driving (baseline) driving period and radio manual tuning period, and variable of interest. Cells marked “N/A” indicate no applicable data for that task and variable (for example, there are no baseline periods for any of the “percentage change” metrics, as these are normalized against the baselines).
ACC Off Baseline
ACC Off Radio Manual
ACC On Baseline
ACC On Radio Manual
Self-Reported Workload N/A 4.21 (0.37) N/A 4.54 (0.42) Task Completion Time N/A 24.08 (1.65) N/A 22.98 (1.71) Mean Glance Time (to Device) 0.69 (0.05) 1.04 (0.05) 0.72 (0.05) 1.08 (0.06) Mean Glance Time (Off-Road) 0.67 (0.03) 1.02 (0.05) 0.69 (0.03) 1.03 (0.05) Glances Longer than 2.0s (to Device) 0.48 (0.39) 4.81 (1.28) 0.87 (0.48) 6.94 (2.02) Glances Longer than 2.0s (Off-Road) 0.39 (0.19) 4.64 (1.25) 0.48 (0.17) 6.25 (1.89) Total Glance Time (to Device) N/A 15.00 (1.38) N/A 13.77 (1.30) Total Glance Time (Off-Road) N/A 15.29 (1.37) N/A 14.18 (1.26) Number of Glances to Device N/A 14.21 (1.07) N/A 13.25 (1.38) Number of Off-Road Glances N/A 14.75 (1.05) N/A 14.17 (1.29) Percentage of Glance Time to Device 1.76 (0.33) 60.18 (2.33) 2.77 (0.46) 60.07 (2.43) Percentage of Off-Road Glance Time 9.87 (1.05) 61.64 (2.23) 12.33 (1.37) 62.17 (2.34) Glance Number Per Minute to Device 1.25 (0.17) 35.53 (1.08) 2.04 (0.32) 34.28 (1.53) Glance Number Per Minute Off-Road 9.01 (0.93) 37.16 (1.19) 10.54 (1.12) 37.11 (1.34) Heart Rate 68.71 (2.69) 69.72 (2.91) 69.64 (2.66) 71.05 (2.89) Change in Heart Rate 0.00 (0.00) 1.31 (1.11) 1.53 (0.87) 3.71 (1.42) Skin Conductance Level 13.48 (1.34) 14.57 (1.32) 14.13 (1.32) 14.79 (1.27) Change in SCL 0.00 (0.00) 10.92 (3.49) 6.71 (2.98) 14.37 (5.71) Mean Velocity (mph) 63.28 (0.16) 63.12 (0.31) 62.18 (0.59) 62.18 (0.88) Mean Velocity (kph) 101.84 (0.26) 101.59 (0.49) 100.07 (0.94) 100.06 (1.42) Change in Mean Velocity 0.00 (0.00) -0.25 (0.43) -1.72 (0.98) -1.72 (1.46) Velocity Range 15.81 (0.95) 7.61 (0.60) 16.13 (2.41) 4.83 (0.83) Change in Velocity Range 0.00 (0.00) -50.74 (3.43) 3.29 (13.60) -68.38 (5.08) SD of Velocity 3.07 (0.25) 2.26 (0.18) 3.72 (0.79) 1.34 (0.23) Change in SD of Velocity 0.00 (0.00) -22.30 (5.92) 19.61 (20.09) -53.52 (7.50) Major Steering Wheel Reversals 3.88 (0.34) 4.77 (0.66) 3.84 (0.27) 5.92 (0.79) Change in Major SWRs 0.00 (0.00) 38.02 (28.18) 6.44 (6.19) 48.96 (20.98) Minor Steering Wheel Reversals 53.70 (3.23) 68.02 (4.30) 50.40 (3.25) 64.12 (4.07) Change in Minor SWRs 0.00 (0.00) 29.29 (6.17) -5.57 (2.60) 23.31 (8.19)
Units: All of the change scores represent % change from baseline (single task) driving and were calculated individually by subject and the resulting values averaged. Heart rate is in beats per minute, skin conductance level (SCL) is in microsiemens, velocity metrics are in kph unless otherwise indicated, and steering wheel reversals (SWRs) are normalized as number per minute.

AgeLab Technical Report 2015-15
©MIT AgeLab 2015 Page 54 of 71
Contact Phone Calling (Voice and Manual Modalities) Table 9: Means (and standard errors) for contact calling (voice and manual), and variable of interest. Cells marked “N/A” indicate no applicable data for that task and variable (for example, there are no baseline periods for any of the “percentage change” metrics, as these are normalized against the baselines).
ACC Off Phone Manual
ACC Off Phone Voice
ACC On Phone Manual
ACC On Phone Voice
Self-Reported Workload 3.00 (0.48) 3.75 (0.50) 3.44 (0.50) 3.06 (0.45) Task Completion Time 38.03 (3.45) 24.74 (2.44) 32.12 (1.81) 24.50 (1.74) Mean Glance Time (to Device) 1.07 (0.05) 0.43 (0.06) 1.08 (0.05) 0.37 (0.06) Mean Glance Time (Off-Road) 1.03 (0.04) 0.68 (0.03) 1.04 (0.05) 0.71 (0.04) Glances Longer than 2.0s (to Device) 4.41 (1.41) 0.00 (0.00) 4.25 (1.11) 0.00 (0.00) Glances Longer than 2.0s (Off-Road) 3.90 (1.20) 0.23 (0.23) 3.86 (1.04) 0.51 (0.36) Total Glance Time (to Device) 21.15 (2.12) 0.97 (0.20) 18.28 (1.56) 2.01 (1.02) Total Glance Time (Off-Road) 22.06 (2.16) 6.39 (1.08) 19.23 (1.49) 7.14 (1.09) Number of Glances to Device 19.96 (1.82) 1.50 (0.30) 16.79 (1.31) 2.65 (1.20) Number of Off-Road Glances 21.65 (1.87) 9.31 (1.31) 18.67 (1.28) 9.88 (1.27) Percentage of Glance Time to Device 56.52 (1.96) 4.09 (0.77) 56.51 (2.75) 5.74 (1.64) Percentage of Off-Road Glance Time 58.66 (1.94) 26.10 (2.91) 59.48 (2.19) 26.68 (2.75) Glance Number Per Minute to Device 32.57 (1.21) 3.75 (0.68) 31.52 (1.58) 7.50 (3.75) Glance Number Per Minute Off-Road 35.03 (1.17) 22.67 (2.34) 35.04 (1.31) 25.76 (3.95) Heart Rate 72.46 (3.03) 68.84 (2.77) 72.84 (2.93) 70.46 (2.89) Change in Heart Rate 5.35 (1.22) 0.27 (0.79) 6.33 (1.34) 1.92 (1.46) Skin Conductance Level 14.48 (1.30) 13.81 (1.21) 15.53 (1.36) 14.58 (1.32) Change in SCL 10.35 (3.56) 5.38 (2.69) 20.08 (6.02) 10.90 (3.24) Mean Velocity (mph)) 63.00 (0.31) 63.45 (0.19) 62.93 (0.32) 63.40 (0.21) Mean Velocity (kph) 101.38 (0.50) 102.12 (0.30) 101.28 (0.52) 102.03 (0.33) Change in Mean Velocity -0.44 (0.49) 0.28 (0.31) -0.53 (0.58) 0.21 (0.46) Velocity Range 8.77 (0.79) 6.55 (0.49) 5.19 (0.64) 3.46 (0.28) Change in Velocity Range -42.13 (5.02) -56.39 (3.62) -67.19 (3.37) -76.32 (2.56) SD of Velocity 2.39 (0.20) 1.85 (0.13) 1.48 (0.22) 0.96 (0.09) Change in SD of Velocity -16.34 (7.30) -34.19 (5.98) -50.20 (6.52) -64.95 (4.10) Major Steering Wheel Reversals 6.74 (0.96) 2.16 (0.52) 6.00 (0.81) 2.36 (0.45) Change in Major SWRs 82.63 (25.20) -38.86 (13.58) 49.38 (15.77) -33.97 (15.73) Minor Steering Wheel Reversals 63.68 (4.05) 58.00 (3.55) 64.70 (3.18) 55.32 (3.94) Change in Minor SWRs 22.50 (7.80) 9.55 (4.74) 25.88 (7.44) 4.95 (6.35)
Units: All of the change scores represent % change from baseline (single task) driving and were calculated individually by subject and the resulting values averaged. Heart rate is in beats per minute, skin conductance level (SCL) is in microsiemens, velocity metrics are in kph unless otherwise indicated, and steering wheel reversals (SWRs) are normalized as number per minute.

AgeLab Technical Report 2015-15
©MIT AgeLab 2015 Page 55 of 71
Appendix B: Selected Graphs in Alternate Formats
Heart Rate in BPM
Figure 32: Mean heart rate for sample in beats per minute (BPM) for each task under study. Labeling as in Figure 8.
Skin Conductance in Absolute Units
Figure 33: Mean skin conductance level for sample in microsiemens (micromhos) for each task under study. Labeling as in Figure 8.
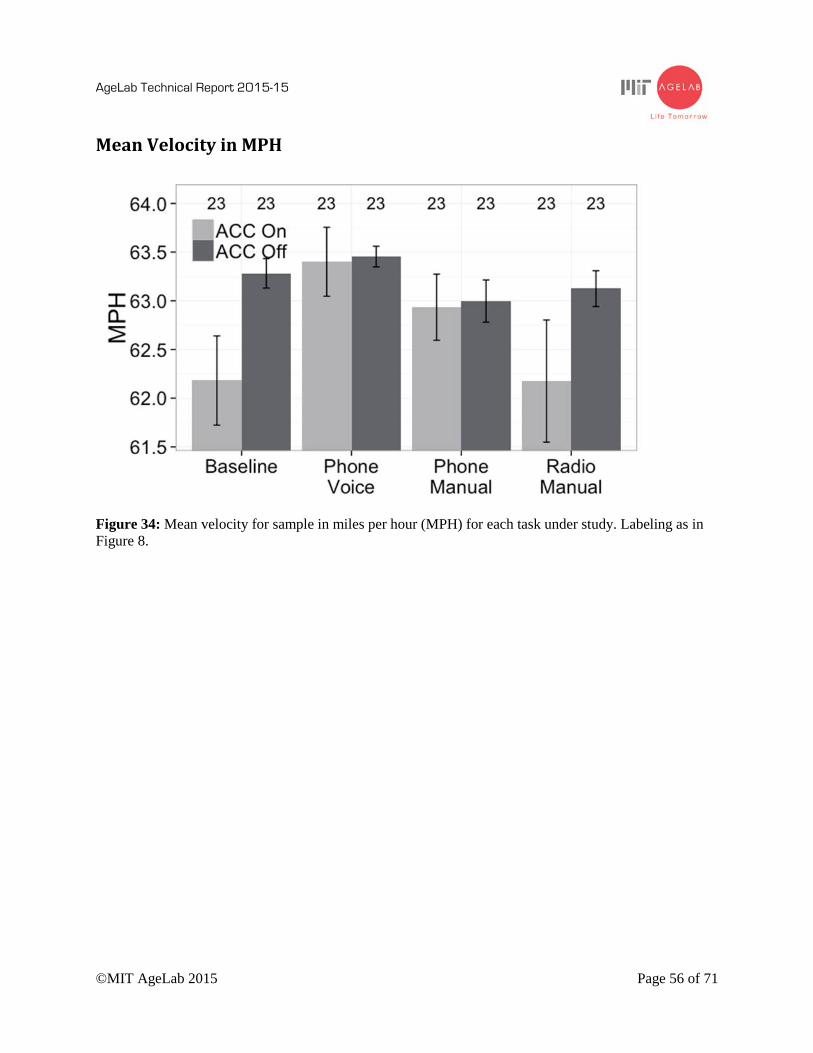
AgeLab Technical Report 2015-15
©MIT AgeLab 2015 Page 56 of 71
Mean Velocity in MPH
Figure 34: Mean velocity for sample in miles per hour (MPH) for each task under study. Labeling as in Figure 8.

AgeLab Technical Report 2015-15
©MIT AgeLab 2015 Page 57 of 71
Appendix C: Item Content in Post-Experimental Questionnaire Note: The following represents the phrasing and content of the items used in the post-experimental questionnaire; however, the layout has been compressed somewhat for space considerations.
Post-Experimental Questionnaire
Please fill in blanks or circle the one best response unless otherwise noted. Remember, filling out this questionnaire is voluntary. Skipping any question that makes you feel uncomfortable will not exclude you from the study.
Current State 1. On a scale of 1 to 10 with 1 being very awake and 10 being extremely drowsy, how do you
feel right now?
1 2 3 4 5 6 7 8 9 10 Very Extremely Awake Drowsy
2. On a scale of 1 to 10 where 1 is not at all stressed and 10 is very stressed how would you rate
your stress level right now?
1 2 3 4 5 6 7 8 9 10 Not at all Very Stressed Stressed General Impressions: 3. What was your overall impression of the vehicle you drove today?
1 2 3 4 5 6 7 8 9 10 Not at All Very Positive Positive

AgeLab Technical Report 2015-15
©MIT AgeLab 2015 Page 58 of 71
4. If you had access to the same technologies (controls, displays, interfaces) that you used today, how likely would you be to use each one while driving on your own:
Not at All Very a. Use the car’s voice based interface to
place a call?
1
2
3
4
5
6
7
8
9
10
b. Use the car’s manual interface to place a call?
1
2
3
4
5
6
7
8
9
10
c. Use the manual radio controls to tune to a specific radio station as you did today?
1
2
3
4
5
6
7
8
9
10
5. Not including today’s experience, how often do you use any form of cruise control while
driving a car (including both standard and adaptive cruise control)?
a. More than once a day b. About once a day c. A few times a week d. A few times a month e. A few times a year (at most) f. Never
6. Not including today’s experience, how often do you use an adaptive cruise control system,
similar to the one you drove today, that adjusts the vehicle’s speed to try to maintain a set distance between the car you are driving and the leading car?
a. More than once a day b. About once a day c. A few times a week d. A few times a month e. A few times a year (at most) f. Never
7. How likely is it that you would recommend to a friend or family member that they consider
buying a car with the adaptive cruise control technology you used today?
1 2 3 4 5 6 7 8 9 10 Not at All A Lot

AgeLab Technical Report 2015-15
©MIT AgeLab 2015 Page 59 of 71
8. If the adaptive cruise control system you used today worked perfectly, to what extent would you like to have an adaptive cruise control system in your next car?
1 2 3 4 5 6 7 8 9 10 Not at All A Lot
9. Thinking specifically about the adaptive cruise control system you used today, how much did you trust it by the end of the drive?
1 2 3 4 5 6 7 8 9 10
Not at all A Lot 10. Regardless of your experiences today, how much do you like the idea of the car
automatically adjusting vehicle speed to maintain the distance between you and the vehicle ahead?
1 2 3 4 5 6 7 8 9 10
Not at all A Lot 11. Compared to driving without the cruise control, did having the adaptive cruise control on
make you any more comfortable about the following:
Not at All Very a. driving in general
1
2
3
4
5
6
7
8
9
10
b. other vehicles changing speed in front of you
1
2
3
4
5
6
7
8
9
10
c. using the car’s voice based interface to place a call
1
2
3
4
5
6
7
8
9
10
d. using the car’s manual controls and displays to place a call
1
2
3
4
5
6
7
8
9
10
e. using the manual radio controls to tune to a specific radio station as you did today
1
2
3
4
5
6
7
8
9
10

AgeLab Technical Report 2015-15
©MIT AgeLab 2015 Page 60 of 71
12. How has today’s experience influenced your level of trust in new automotive technologies?
a. Much less trusting b. Somewhat less trusting c. About the same d. Somewhat more trusting e. Much more trusting
13. Based on your experience today, do you feel your ability to learn new technologies increased,
stayed about the same, or decreased?
1 2 3 4 5 6 7 8 9 10 Decreased Increased

AgeLab Technical Report 2015-15
©MIT AgeLab 2015 Page 61 of 71
Appendix D: Responses to Open-ended Questions in Post-Experimental Questionnaire
The following are the verbatim written responses to four open-ended questions at the end of the questionnaire that was completed back at the laboratory following the completion of the drive. The specific questions were:
Thinking about the adaptive cruise control system you used today: 14. What did you like most about the adaptive cruise control system? 15. What did you like least about the adaptive cruise control system? 16. Do you have any suggestions for changes that would make the systems easier to use,
understand, or otherwise improve the overall experience? 17. Please use the space below or the back of this page to write any comments or suggestions
you have regarding your experiences today: ID Age M/F #14 Like Most #15 Like Least #17 Suggestions for
Designers #18 Comments on
Experience 1 24 F The consistent gap
between my car and the car in front of me that was kept without problems, and without sudden braking or speeding up. I also appreciated that there was a backup indicator in case of collision risk.
Nothing comes to mind. Though if I had this tech on my own car, I would want to make sure I was familiar with limitations (high bed trucks? cars coming in and out of lanes? etc.)
I felt comfortable and knew what was expected at any given time. Perhaps a small marker on the lead car would be helpful.
2 62 F Sense of "trust" that sudden changes in traffic flow or pattern will be accommodated by the car. Increased safety.
Felt it didn't resume speed quickly enough.
More prominent display on the dashboard. Larger icons. For manual calling - easier way to select first letter of name.
I have voice activated commands in my car & do not use them! Today convinced me to use them going forward. The reason I haven’t used them? Impatience with setting them up and then taking the time to learn how to use them. Improve the education (and make it easy to be trained) and adoption will surely increase.
3 65 M I was impressed with how it handled off ramp and on ramp
At times acceleration was a bit sluggish and delayed.
Make touch area bigger when selecting letter to find a name.
Screens are difficult to see in certain bright lighting situations.
4 64 M I liked that it detected Needs reset when It is simple to use Prefer console display

AgeLab Technical Report 2015-15
©MIT AgeLab 2015 Page 62 of 71
ID Age M/F #14 Like Most #15 Like Least #17 Suggestions for Designers
#18 Comments on Experience
various size vehicles, including motorcycle, and reduced my vehicles speed accordingly. It makes driving on the highway easier and safer.
vehicle comes to 0 mph as in construction traffic.
for manual choices be closer to vehicle gauge for purpose of not looking to right. I prefer looking straight ahead and can move eyes up and down if necessary. Also prefer controls for radio on steering wheel.
5 25 M The ability to slow down for whatever reason without then having to track my speed and carefully get back up to cruising speed, which I would otherwise often forget to do, at least immediately.
I liked it.. One thing: Because it doesn't work in emergency situations (extremely fast stops) there is a real danger of getting distracted daydreaming or w/o and then being to intervene. In a way, I'd either like to be paying close attn. all the time, or 0 attention all the time.
I think after an adjustment period, this would really change my driving; make it easier to think about/do other things. However, that adjustment period would certainly be longer than a few hours - thus, today I felt I was concentrating even harder on my speed when the ACC was active, because I was trying to discern how (well) it worked.
6 21 M How the car would react to any speed changes before I even noticed the car ahead was slowing down.
Doesn't work well on turns.
none
8 62 F Removed the annoying part of regular cruise control - when the car in front slows etc.
Could be dangerous if I think it is on and it isn't
Interesting but long!
13 21 F It was able to ensure to the best of its ability a controlled gap distance.
Sometimes it is a little to trusted, but full attention still has to be kept of course.
I really enjoyed being a part of this experiment and would definitely do something like it again!
14 23 M That it allows the driver to have one less thing to focus on and could devote that extra potential focus to other activities.
n/a Perhaps have average distance that the gaps were to be described in car lengths somewhere.
Love that car.
15 28 F I really liked not having to constantly adjust and readjust my cruising speed as I
I felt most nervous when traffic occurred and I wasn't sure what the car was going to do
The turn knob for adjusting radio stations and selecting call names is delayed and

AgeLab Technical Report 2015-15
©MIT AgeLab 2015 Page 63 of 71
ID Age M/F #14 Like Most #15 Like Least #17 Suggestions for Designers
#18 Comments on Experience
have to now with cruise control.
or how it would react. It was hard to have faith the car would stop or slow down fast enough. That said, the one time we did hit traffic, the car slowed down great and boosted my faith/confidence immediately. I think using the ACC more often would make me feel better about it.
finicky. This could be greatly improved.
17 65 M Simplicity - easy to activate and adjust. Stability - keeps vehicle distance at a safe distance regardless of the traffic flow and speed.
I cannot think of anything. I will definitely have ACC on my next vehicle.
18 62 F I like that it allows you to change lanes. I like that it accommodates vehicles changing lanes in front of you.
Like any cruise control, I find that I can become inattentive or bored as I don't have to make adjustments.
19 25 F Reduced stiffness in my right knee. Relaxed a little bit more than usual. Felt more confident that should I have been in accident, I would not have been the one at fault
It might make (hypothetically, I didn't pass anyone) passing on the left a more drastic transition, because it felt like it slowed the car down before I would have had the chance to pass someone appropriately (maintaining my speed)
If possible, make the manual interface screen less prone to glare from the sun!
Very positive but took longer than expected. I think I missed the email and thought it was supposed to take 90 minutes - got a little hungry and grouchy by the end!
20 25 M Ability to deal with other cars changing lanes in front of me. This can be really helpful in long drives.
As driving is a reflex action of human body I felt a slight disturbance on my steering wheel every time brakes were applied using ACC. This happened as I was not the one applying the brakes and my hands in a reflex are reacting to the decrease in speed. This issue can probably be solved
Apart from ACC I am just not sure whether this research is about out of lane sensors, as I would like to point out a general observation based on my testing experience. I am assuming out of lane alarm works by sensor sensing the point on road an
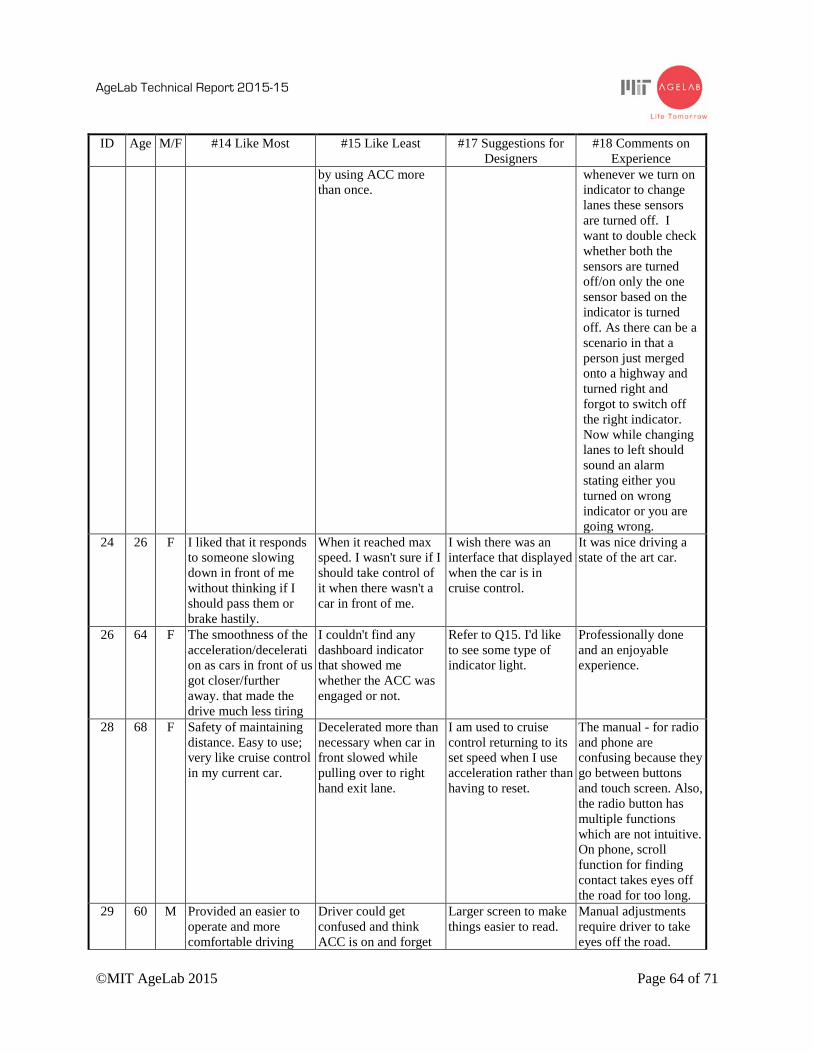
AgeLab Technical Report 2015-15
©MIT AgeLab 2015 Page 64 of 71
ID Age M/F #14 Like Most #15 Like Least #17 Suggestions for Designers
#18 Comments on Experience
by using ACC more than once.
whenever we turn on indicator to change lanes these sensors are turned off. I want to double check whether both the sensors are turned off/on only the one sensor based on the indicator is turned off. As there can be a scenario in that a person just merged onto a highway and turned right and forgot to switch off the right indicator. Now while changing lanes to left should sound an alarm stating either you turned on wrong indicator or you are going wrong.
24 26 F I liked that it responds to someone slowing down in front of me without thinking if I should pass them or brake hastily.
When it reached max speed. I wasn't sure if I should take control of it when there wasn't a car in front of me.
I wish there was an interface that displayed when the car is in cruise control.
It was nice driving a state of the art car.
26 64 F The smoothness of the acceleration/deceleration as cars in front of us got closer/further away. that made the drive much less tiring
I couldn't find any dashboard indicator that showed me whether the ACC was engaged or not.
Refer to Q15. I'd like to see some type of indicator light.
Professionally done and an enjoyable experience.
28 68 F Safety of maintaining distance. Easy to use; very like cruise control in my current car.
Decelerated more than necessary when car in front slowed while pulling over to right hand exit lane.
I am used to cruise control returning to its set speed when I use acceleration rather than having to reset.
The manual - for radio and phone are confusing because they go between buttons and touch screen. Also, the radio button has multiple functions which are not intuitive. On phone, scroll function for finding contact takes eyes off the road for too long.
29 60 M Provided an easier to operate and more comfortable driving
Driver could get confused and think ACC is on and forget
Larger screen to make things easier to read.
Manual adjustments require driver to take eyes off the road.

AgeLab Technical Report 2015-15
©MIT AgeLab 2015 Page 65 of 71
ID Age M/F #14 Like Most #15 Like Least #17 Suggestions for Designers
#18 Comments on Experience
experience. to brake. 30 27 M That it automatically
adjusted to keep a safe distance between me and the car in front. I always try to leave enough space between me and another car but this really helped. it also put me a little at ease that it would adjust so that when I had to look elsewhere momentarily I knew it was keeping a distance from the other car.
Not having to be consciously making decisions about accelerating/braking made me tired/not as alert.
voice commands for changing radio, directions, etc.
I was impressed by the technology.
32 61 F Distance- gap control was terrific
Decreasing speed at exit ramp wasn't fast enough (with lead car)
For contacts - alphabetize by last name. Also remembering stranger's names wasn't so easy at first.
Driving in the middle lane with big trucks behind us wanting to pass was a bit uncomfortable even though we were driving the speed limit. Would have preferred the lead car to get in the right lane.
33 25 M Its ability to adjust the gap space between myself and the car in front.
Buttons are too small. I would like them bigger.
Instructions were clear and easy to follow. Overall it was a very fun and interesting experience.
34 67 M Easy to operate Speed not constant. Heads up voice display Try to let driver know vehicle make in advance. Often missed controls because they were not familiar.
35 20 M It allowed me to focus on other things like steering, placing calls, etc. w/o compromising safety.
- Would have liked to know the rate/length of time spent on each highway before starting to get an idea of how long I would be driving each stretch.
36 68 Very easy to set and maintain.
0 I thought the manual phone would be better if it had an alphabet guide- less scrolling though the menu.
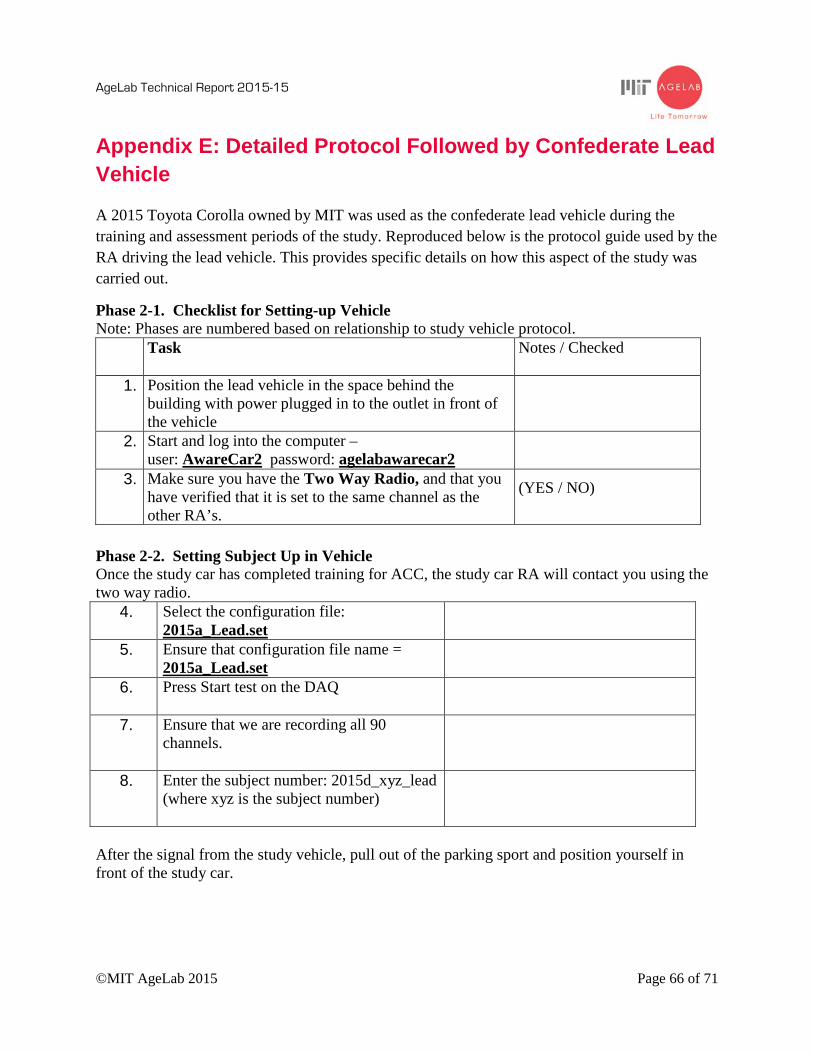
AgeLab Technical Report 2015-15
©MIT AgeLab 2015 Page 66 of 71
Appendix E: Detailed Protocol Followed by Confederate Lead Vehicle
A 2015 Toyota Corolla owned by MIT was used as the confederate lead vehicle during the training and assessment periods of the study. Reproduced below is the protocol guide used by the RA driving the lead vehicle. This provides specific details on how this aspect of the study was carried out.
Phase 2-1. Checklist for Setting-up Vehicle Note: Phases are numbered based on relationship to study vehicle protocol.
Task Notes / Checked
1. Position the lead vehicle in the space behind the building with power plugged in to the outlet in front of the vehicle
2. Start and log into the computer – user: AwareCar2 password: agelabawarecar2
3. Make sure you have the Two Way Radio, and that you have verified that it is set to the same channel as the other RA’s.
(YES / NO)
Phase 2-2. Setting Subject Up in Vehicle Once the study car has completed training for ACC, the study car RA will contact you using the two way radio.
4. Select the configuration file: 2015a_Lead.set
5. Ensure that configuration file name = 2015a_Lead.set
6. Press Start test on the DAQ
7. Ensure that we are recording all 90 channels.
8. Enter the subject number: 2015d_xyz_lead (where xyz is the subject number)
After the signal from the study vehicle, pull out of the parking sport and position yourself in front of the study car.

AgeLab Technical Report 2015-15
©MIT AgeLab 2015 Page 67 of 71
Phase 3-1. Introduction The lead vehicle RA must be responsible for committing the following sections of the protocol to memory, as he/she will not be able to follow this as a checklist while driving. The lead vehicle RA is responsible for leading the study vehicle throughout the study. This means guiding the study vehicle to 93North, and then to 495 North (Exit 44A). For both training and task periods on 495 the lead vehicle will be using cruise control to maintain a cruising speed on 65MPH (highway legal speed limit). The lead vehicle does NOT have adaptive cruise control, maintaining safety while driving is more important that maintaining a speed of 65 mph. Ideally for the training exposure periods the speed should be 65 and go to 60, but during the rest of the drive, traffic flow is the accepted speed.
Setting ACC System: -The Cruise Control stalk is located behind the steering wheel at about 5 O’clock; it is below the windshield wiper stalk. -Once at desired cruising speed, lock that speed in my pressing the stalk up or down. -Adjusting speed: The stalk can be used to increase a set speed by increments of 1 mph or 5 mph. To adjust up and down by 1mph, hit the stalk up. This will be used in the slowing tasks. -Set speed will be cancelled if the brake is engaged, or if the stalk is pushed away from the driver. -To resume a previously set cruising speed, after cancelling the system, the stalk can be pulled toward the driver.
During the training period on 495 North there will be sections where the study vehicle, using a two way radio, will contact the lead vehicle to set up controlled slowing down events and controlled braking events, to help the subject experience how ACC system works and build trust. For all these tasks, the lead vehicle must take responsibility for ensuring this is completed safely. Do not start braking events if it is not safe for both vehicles. If, after the training period the study vehicle RA deems it appropriate, the study will continue on 495 South. Otherwise, he will withdraw the subject and drive back on 93S. Once all the tasks have been completed on 495, the study vehicle will be instructed to pass the lead vehicle. The lead vehicle will follow the study vehicle onto 93 South and remain following until returning to MIT.

AgeLab Technical Report 2015-15
©MIT AgeLab 2015 Page 68 of 71
Phase 3-2. Start Driving 1. Take a right onto Amherst Street.
2. Take a left onto Ames Street
3. Take a right onto Memorial Dr and continue in the left lane until you reach the first U-Turn on the left. Take the left and get back on Memorial heading the other direction.
4. When Memorial Drive splits up take the right lane onto Edwin H Land Blvd
5. Take a right onto Monsignor Obrien Hwy/RT-28S – Sign to Boston
6. Get into left lane and bear left after intersection to get onto I-93 North ramp
7. Take right lane to I-93 North in the direction of Concord NH
8. Continue driving until you reach exit 44A to get on 495 North Approx. 25m
During this section, you will be driving without the cruise control, as will the study vehicle. The study vehicle will be instructed to follow the lead car. While safe driving is the first priority, driving such that the study vehicle can stay with you is also important. For this part, drive in either of the 2 middle lanes (93 has 4 lanes for much of the drive) as the traffic flow permits (you don’t want to create a stressful situation where people are beeping/tailgating/passing aggressively. Phase 3-3. Training with ACC System
9. Once on 495North, make your way to the middle lane and begin accelerating until you are travelling at 65MPH
10. Once at 65 MPH, lock the speed in using the Cruise Control system
11. Once you have set the speed, use the two way radio to confirm this with the study vehicle.
12. Shortly following this, the study vehicle will use the two way radio confirm that they too have successfully set the ACC system to 65MPH.
At this point the study vehicle will enter a training phase. This will mostly consist of the study car following the lead car with ACC active. At intervals of approximately 5 minutes, the study car RA will speak to both the subject and the lead car, instructing the subject:
“In a moment, the lead vehicle will slow down without braking, so you can experience the ACC system automatically slowing this vehicle”

AgeLab Technical Report 2015-15
©MIT AgeLab 2015 Page 69 of 71
The purpose of the 5 minute spacing is to ensure that the subject experiences at least 2 slowing events, but leaves more time if the subject wants to practice further. Before the slowing event, it is important for the lead car RA to evaluate the safety of the situation. DO NOT start the braking event until it is safe to do so.
13. For the slowing events, the lead car will use the Cruise control to reduce speed by 5 mph. This is done by flipping the stalk down. This must be done 5 times in a row, as quickly as possible.
14. There will be at least 2 repetitions of this task, unless it is evaluated that more are needed.
15. Continue driving until you reach exit 53
16. Take exit 53 to loop around and get back on 495 heading South.
17. Once back on 495, accelerate to 65mph and set the ACC system.
18. Confirm speed with study vehicle, and that study vehicle has set ACC cruising speed to 65mph
This is the second leg of the training phase. This will again consist of the study car following the lead car with ACC active. This time, instead of slowing events, there will be controlled braking events where the lead vehicle engages the brakes, so that the tail lights are illuminated. Before actually engaging the braking event, it is important for the lead car RA to evaluate the safety of the situation. DO NOT start the braking event until it is safe to do so.
19. For the braking events, the lead car will reduce speed by 5 mph by engaging the brake. Press the brake very lightly to the point that the cruise control switches off. Do not press the brake any harder than this, it is sufficient to activate the brake light. After decreasing speed by 5 mph, pull the stalk toward you to reset the cruising speed the 65 MPH. The purpose of this task is to build trust for the following vehicle
20. There will be at least 2 repetitions of this task, unless it is evaluated that more are needed.

AgeLab Technical Report 2015-15
©MIT AgeLab 2015 Page 70 of 71
Phase 3-4. Approaching Exit 40 21. As you pass exit 41 the study vehicle will deactivate the ACC
system but continue to follow lead.
22. Was subject able to complete the controlled breaking events without applying the brakes his/herself? (At least 2 concurrent braking events without the driver disengaging the ACC system leading up to this point. RA must evaluate if they feel it is worth running the rest of the study)
NO: If the subject has been unable to be trained on using the ACC, and failed in demonstrating trust in the system to brake, then the subject vehicle will contact the lead car and instruct them to prepare to take exit 40A to get onto 93 South. At this point move to section 5 – 93 South. YES: Subject will move onto Section 4A or 4B (protocol order as indicated in the calendar. This will be randomized and counterbalanced). Sections 4 - A/B Task Periods 495 South:
23. For the duration of the drive South, ensure that the cruise control system speed is set to 65mph
After passing exit 40A, the study vehicle will begin the task completion section. They will be doing manual phone, manual radio, and voice radio tasks, plus a few just drive periods, amounting to around 25 minutes. Depending on the randomization the study vehicle may be using ACC or may not be. If traffic slows to the point of suspending the task period, use the two way radio to re-establish the driving protocol. Again, the lead vehicle should be monitoring for safety. The lead vehicle can drive slower than 65 during the training periods as long as there is still a consistent traffic flow.
24. When the study vehicle has completed the task periods, the study vehicle RA will open the two way radio and give the following instruction
“We have completed the task periods; please prepare to take the next exit, while still following the lead vehicle”
25. Loop around and get back on 495 heading North.
26. Once back on 495, accelerate to 65mph and set the cruise control system.

AgeLab Technical Report 2015-15
©MIT AgeLab 2015 Page 71 of 71
The study vehicle will be completing tasks at this time. Whether the ACC system is active will be counterbalanced against the conditions of the drive south. If traffic slows to the point of suspending the task period, use the two way radio to re-establish the driving protocol. Again, the lead vehicle should be monitoring for safety.
27. When approaching exit 40A, confirm with the study RA that all tasks have been completed. If NOT continue driving on 495N until it is confirmed that tasks are complete.
28. After the study RA has confirmed that the tasks have been completed, the lead car must allow the study car to pass. For the duration of the study the lead car will be following the study car while it completes the 93 South section of the protocol.
29. Take exit 40A onto 93 South returning to MIT
Phase 5-1 - 93 South
30. Continue following the study vehicle while on 93 South. The study vehicle section will be made up of 2 parts.
31. First the subject will drive with ACC on for 5 minutes but without the lead vehicle.
32. Second, the lead car will be instructed on either leaving ACC on or turning it off for the ride back.


![Experiment: Single-Phase Full-Bridge Inverter [1] AC Inverters ...Page 1 of 9 10/9/2020 14:37 Experiment: Single-Phase Full-Bridge Inverter Objective The objective of this lab is to](https://static.fdocuments.in/doc/165x107/6099615a00915a1a2478b6b9/experiment-single-phase-full-bridge-inverter-1-ac-inverters-page-1-of-9-1092020.jpg)