Autonomous Vehicles, Trust, and Driving...
16
Massachusetts Institute of Technology > AgeLab > 77 Massachusetts Ave, E40-279, Cambridge, MA 02139 Phone: 617.253.4978 > fax: 617.258.7570 > agelab.mit.edu White Paper (2016-6) Autonomous Vehicles, Trust, and Driving Alternatives: A survey of consumer preferences Hillary Abraham, Chaiwoo Lee, Samantha Brady, Craig Fitzgerald, Bruce Mehler, Bryan Reimer, & Joseph F. Coughlin 1 1. Introduction Automated vehicle systems (pilot assist, etc.), fully autonomous (self-driving) vehicles, and alternative transportation services (ride sharing, car sharing, etc.) are now constantly in the news. A range of technology companies, automotive manufacturers and suppliers, startups, and academic organizations are leading various technological efforts to develop the systems necessary to make transportation more responsive, accessible and ultimately safer for all consumers across generations. With technological advancements in external sensing, path planning, vehicle control and more, innovations around autonomous and highly automated vehicle development are increasingly finding their way into consumer vehicles in the form of active safety, driver assistance systems, and limited automated driving features. One of the primary obstacles confronting the adoption of automated driving is the very definition of what constitutes “an automated system.” For example, one can conceivably place automated transmissions into the definition of a core technology that automated a major component of vehicle operations, freeing the driver to do other things instead of paying attention to shifting. The National Highway Transportation Safety Administration (NHTSA) (NHTSA, 2013) has proposed a set of operational definitions for vehicle automation, and the Society of Automotive Engineers (SAE) (SAE, 2014) put forth an expanded set. While these definitions detail different levels of automation, they largely 1 Abraham, Lee, Brady, Mehler, Reimer, & Coughlin are with the MIT AgeLab & New England University Transportation Center. Craig Fitzgerald is an automotive writer, President of the New England Motor Press Association (NEMPA), and originally proposed the survey in conjunction with the May 2016 Annual NEMPA technology conference at MIT.
Transcript of Autonomous Vehicles, Trust, and Driving...
Massachusetts Institute of Technology > AgeLab > 77 Massachusetts Ave, E40-279, Cambridge, MA 02139 Phone: 617.253.4978 > fax: 617.258.7570 > agelab.mit.edu
White Paper (2016-6)
Autonomous Vehicles, Trust, and Driving Alternatives: A survey of consumer preferences Hillary Abraham, Chaiwoo Lee, Samantha Brady, Craig Fitzgerald, Bruce Mehler, Bryan Reimer, & Joseph F. Coughlin1
1. Introduction
Automated vehicle systems (pilot assist, etc.), fully autonomous (self-driving) vehicles, and alternative transportation services (ride sharing, car sharing, etc.) are now constantly in the news. A range of technology companies, automotive manufacturers and suppliers, startups, and academic organizations are leading various technological efforts to develop the systems necessary to make transportation more responsive, accessible and ultimately safer for all consumers across generations.
With technological advancements in external sensing, path planning, vehicle control and more, innovations around autonomous and highly automated vehicle development are increasingly finding their way into consumer vehicles in the form of active safety, driver assistance systems, and limited automated driving features. One of the primary obstacles confronting the adoption of automated driving is the very definition of what constitutes “an automated system.” For example, one can conceivably place automated transmissions into the definition of a core technology that automated a major component of vehicle operations, freeing the driver to do other things instead of paying attention to shifting. The National Highway Transportation Safety Administration (NHTSA) (NHTSA, 2013) has proposed a set of operational definitions for vehicle automation, and the Society of Automotive Engineers (SAE) (SAE, 2014) put forth an expanded set. While these definitions detail different levels of automation, they largely
1Abraham, Lee, Brady, Mehler, Reimer, & Coughlin are with the MIT AgeLab & New England University Transportation Center. Craig Fitzgerald is an automotive writer, President of the New England Motor Press Association (NEMPA), and originally proposed the survey in conjunction with the May 2016 Annual NEMPA technology conference at MIT.
2
MIT AgeLab White Paper 2016-6 (May 30, 2016)
Massachusetts Institute of Technology > AgeLab > 77 Massachusetts Ave, E40-278, Cambridge, MA 02139 Phone: 617.253.0753 > fax: 617.258.7570 > [email protected] > agelab.mit.edu
speak to an engineering audience charged with developing and regulating such systems.
While today’s conversations on automated vehicle technologies often refer to systems that support a greater level of vehicle control (e.g. longitudinal and lateral moment-to-moment inputs), it is not clear that consumers fully understand the range of capabilities that systems under development provide. Also, while alternatives to driving and car ownership are increasingly being introduced to consumers, whether such services are readily available given vast regional differences in availability or considered and used by consumers as effective ways to replace driving and car ownership is still a very open question. A number of efforts (The Hartford, University of Iowa, The University of Michigan Transportation Research Institute, as well as others (see bibliography)) have surveyed consumer perceptions about vehicle safety systems, vehicle automation and alternative transportation. These efforts, however, have yet to cohesively consider the potential interrelationships of factors as they impact older adults, who are one of the groups who might experience the greatest potential benefit from such systems.
A number of different types of vehicle automation can reduce accident severity and increase mobility, two core needs of an aging global population (Reimer, 2014). However, it is not clear if consumers have a clear grasp of the complexity involved with various types of automation, and how the wide array of developments based upon these systems may be used to support their mobility needs. To effectively develop and deploy systems that enhance driver safety and mobility through greater degrees of automation, consumers’ understanding, trust and desire for these systems will need to be developed to support the marketplace. For consumers to optimally leverage the advances of many technologies, adequate technology training may be required. Little is established about how consumers are currently acquiring this training for new vehicle technologies. What is not yet fully understood, is how drivers across the lifespan acquire information about technological and service alternatives, view today’s automotive technologies, see future automation systems supporting them, look to learn about these systems, and consider options for alternative transportation. To explore these topics, a survey instrument was developed to gain deeper insight into key questions including:
1. Are consumers satisfied with technology that is already in their vehicle? 2. How are consumers learning about in-vehicle technologies? How would they
prefer to learn? 3. Are consumers willing to use various alternatives to driving? Do they currently
use them?
3
MIT AgeLab White Paper 2016-6 (May 30, 2016)
Massachusetts Institute of Technology > AgeLab > 77 Massachusetts Ave, E40-278, Cambridge, MA 02139 Phone: 617.253.0753 > fax: 617.258.7570 > [email protected] > agelab.mit.edu
4. Are consumers willing to use automation in vehicles? 5. Are older adults willing to use autonomous vehicles and / or alternatives to
driving in order to increase mobility?
2. Methods
2.1 Participants
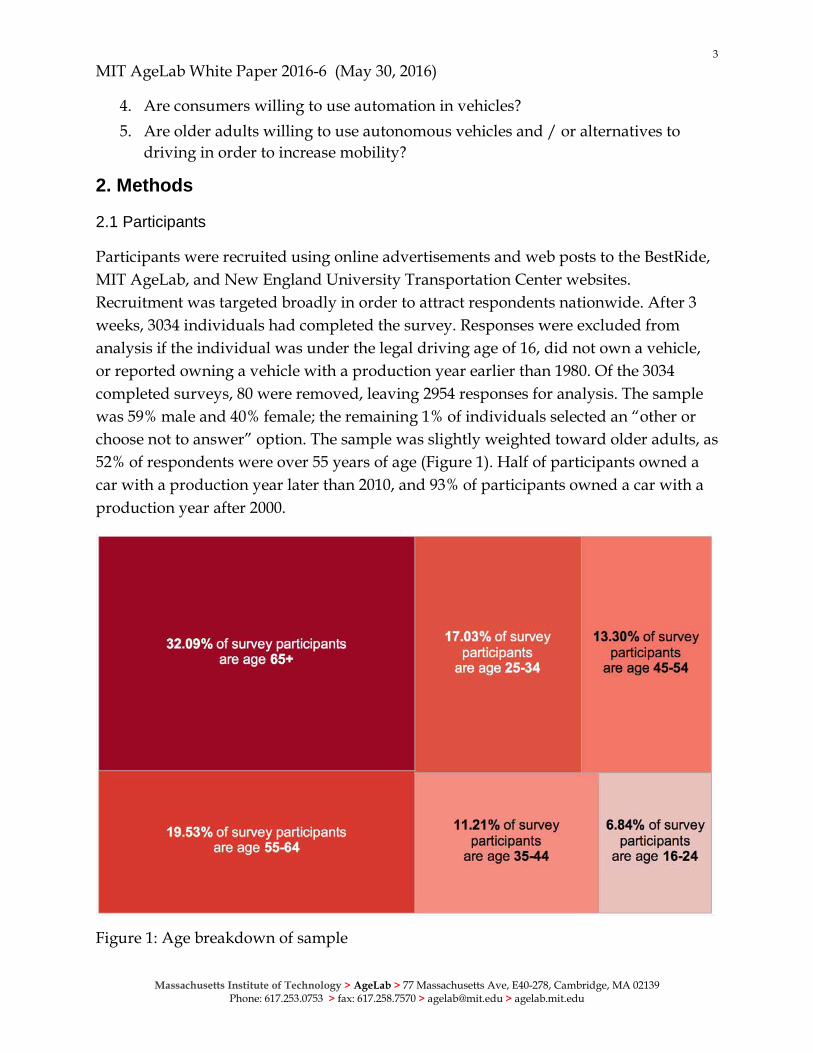
Participants were recruited using online advertisements and web posts to the BestRide, MIT AgeLab, and New England University Transportation Center websites. Recruitment was targeted broadly in order to attract respondents nationwide. After 3 weeks, 3034 individuals had completed the survey. Responses were excluded from analysis if the individual was under the legal driving age of 16, did not own a vehicle, or reported owning a vehicle with a production year earlier than 1980. Of the 3034 completed surveys, 80 were removed, leaving 2954 responses for analysis. The sample was 59% male and 40% female; the remaining 1% of individuals selected an “other or choose not to answer” option. The sample was slightly weighted toward older adults, as 52% of respondents were over 55 years of age (Figure 1). Half of participants owned a car with a production year later than 2010, and 93% of participants owned a car with a production year after 2000.
Figure 1: Age breakdown of sample
4
MIT AgeLab White Paper 2016-6 (May 30, 2016)
Massachusetts Institute of Technology > AgeLab > 77 Massachusetts Ave, E40-278, Cambridge, MA 02139 Phone: 617.253.0753 > fax: 617.258.7570 > [email protected] > agelab.mit.edu
2.2 Survey procedure and instrument
Participants were told the survey would take less than 10 minutes and would involve answering questions related to their preferences and opinions regarding automated driving technologies. Participants were not offered compensation for responding, but were told their involvement would help researchers understand the impact of emerging safety technologies on driver performance, attention, distraction, and safety.
The survey consisted of 15 fixed-response forced-choice questions focusing on automation preferences, technology in the respondent’s current vehicle, and alternatives to driving. Participants were first asked the year, make, and model of their vehicle; if they did not currently own a vehicle, they were unable to proceed to the remainder of the survey. The survey continued with 6 questions on varying levels of autonomy, 3 questions on perceptions of alternatives to driving, and 5 questions on the technology that exists in their current vehicle. Three additional questions were posed to collect the following demographic information: age, gender identity, and zip code. The full survey instrument is included in Appendix A. The survey was constructed in Qualtrics, allowing participants to take it online via computer or mobile device.
3. Results
3.1 Technology in Current Vehicle
Participants were asked two questions about their feelings regarding the technology in their current vehicles: 1) select the closest response from five options – very unhappy, like some but don’t use most, no opinion, like most of the features, very happy – to the question “how do you feel about the technology in the car you drive today,” and 2) select their level of happiness, on an 11-point scale from very unhappy to very happy, to the question “are you happy with how that technology is integrated with the design of your car today?”
5
MIT AgeLab White Paper 2016-6 (May 30, 2016)
Massachusetts Institute of Technology > AgeLab > 77 Massachusetts Ave, E40-278, Cambridge, MA 02139 Phone: 617.253.0753 > fax: 617.258.7570 > [email protected] > agelab.mit.edu
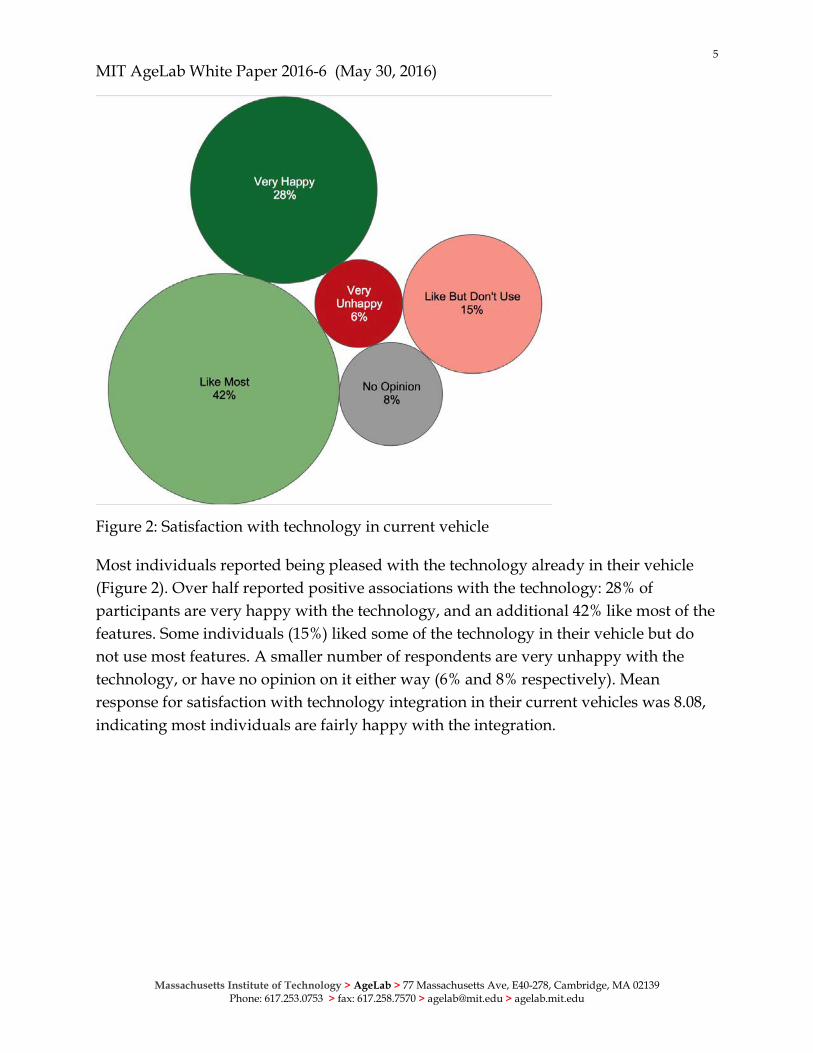
Figure 2: Satisfaction with technology in current vehicle
Most individuals reported being pleased with the technology already in their vehicle (Figure 2). Over half reported positive associations with the technology: 28% of participants are very happy with the technology, and an additional 42% like most of the features. Some individuals (15%) liked some of the technology in their vehicle but do not use most features. A smaller number of respondents are very unhappy with the technology, or have no opinion on it either way (6% and 8% respectively). Mean response for satisfaction with technology integration in their current vehicles was 8.08, indicating most individuals are fairly happy with the integration.
6
MIT AgeLab White Paper 2016-6 (May 30, 2016)
Massachusetts Institute of Technology > AgeLab > 77 Massachusetts Ave, E40-278, Cambridge, MA 02139 Phone: 617.253.0753 > fax: 617.258.7570 > [email protected] > agelab.mit.edu
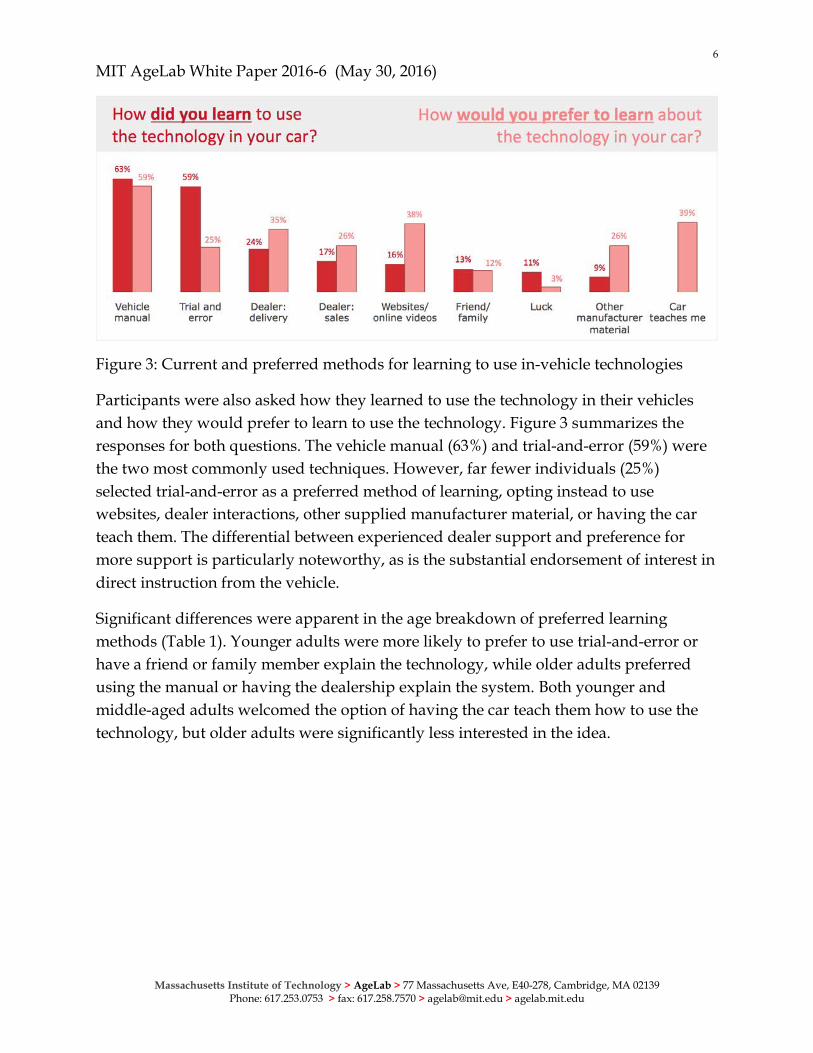
Figure 3: Current and preferred methods for learning to use in-vehicle technologies
Participants were also asked how they learned to use the technology in their vehicles and how they would prefer to learn to use the technology. Figure 3 summarizes the responses for both questions. The vehicle manual (63%) and trial-and-error (59%) were the two most commonly used techniques. However, far fewer individuals (25%) selected trial-and-error as a preferred method of learning, opting instead to use websites, dealer interactions, other supplied manufacturer material, or having the car teach them. The differential between experienced dealer support and preference for more support is particularly noteworthy, as is the substantial endorsement of interest in direct instruction from the vehicle.
Significant differences were apparent in the age breakdown of preferred learning methods (Table 1). Younger adults were more likely to prefer to use trial-and-error or have a friend or family member explain the technology, while older adults preferred using the manual or having the dealership explain the system. Both younger and middle-aged adults welcomed the option of having the car teach them how to use the technology, but older adults were significantly less interested in the idea.
7
MIT AgeLab White Paper 2016-6 (May 30, 2016)
Massachusetts Institute of Technology > AgeLab > 77 Massachusetts Ave, E40-278, Cambridge, MA 02139 Phone: 617.253.0753 > fax: 617.258.7570 > [email protected] > agelab.mit.edu
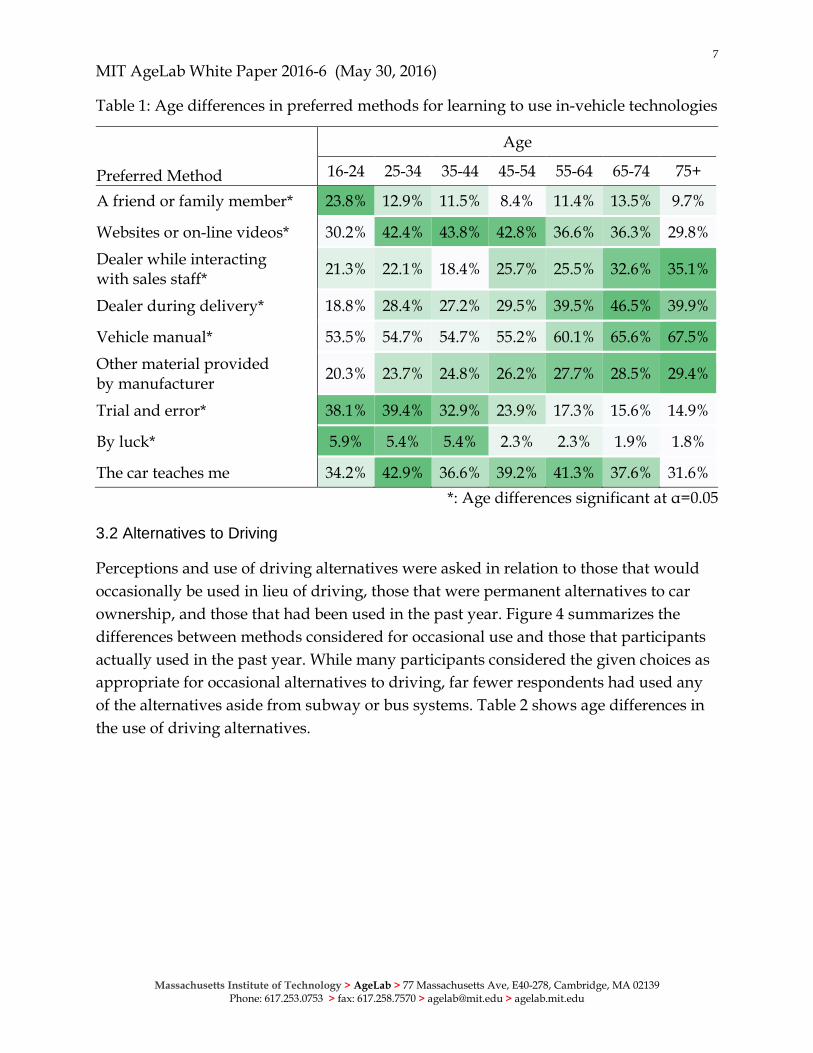
Table 1: Age differences in preferred methods for learning to use in-vehicle technologies
Preferred Method
Age
16-24 25-34 35-44 45-54 55-64 65-74 75+
A friend or family member* 23.8% 12.9% 11.5% 8.4% 11.4% 13.5% 9.7%
Websites or on-line videos* 30.2% 42.4% 43.8% 42.8% 36.6% 36.3% 29.8% Dealer while interacting with sales staff* 21.3% 22.1% 18.4% 25.7% 25.5% 32.6% 35.1%
Dealer during delivery* 18.8% 28.4% 27.2% 29.5% 39.5% 46.5% 39.9%
Vehicle manual* 53.5% 54.7% 54.7% 55.2% 60.1% 65.6% 67.5% Other material provided by manufacturer 20.3% 23.7% 24.8% 26.2% 27.7% 28.5% 29.4%
Trial and error* 38.1% 39.4% 32.9% 23.9% 17.3% 15.6% 14.9%
By luck* 5.9% 5.4% 5.4% 2.3% 2.3% 1.9% 1.8%
The car teaches me 34.2% 42.9% 36.6% 39.2% 41.3% 37.6% 31.6% *: Age differences significant at α=0.05
3.2 Alternatives to Driving
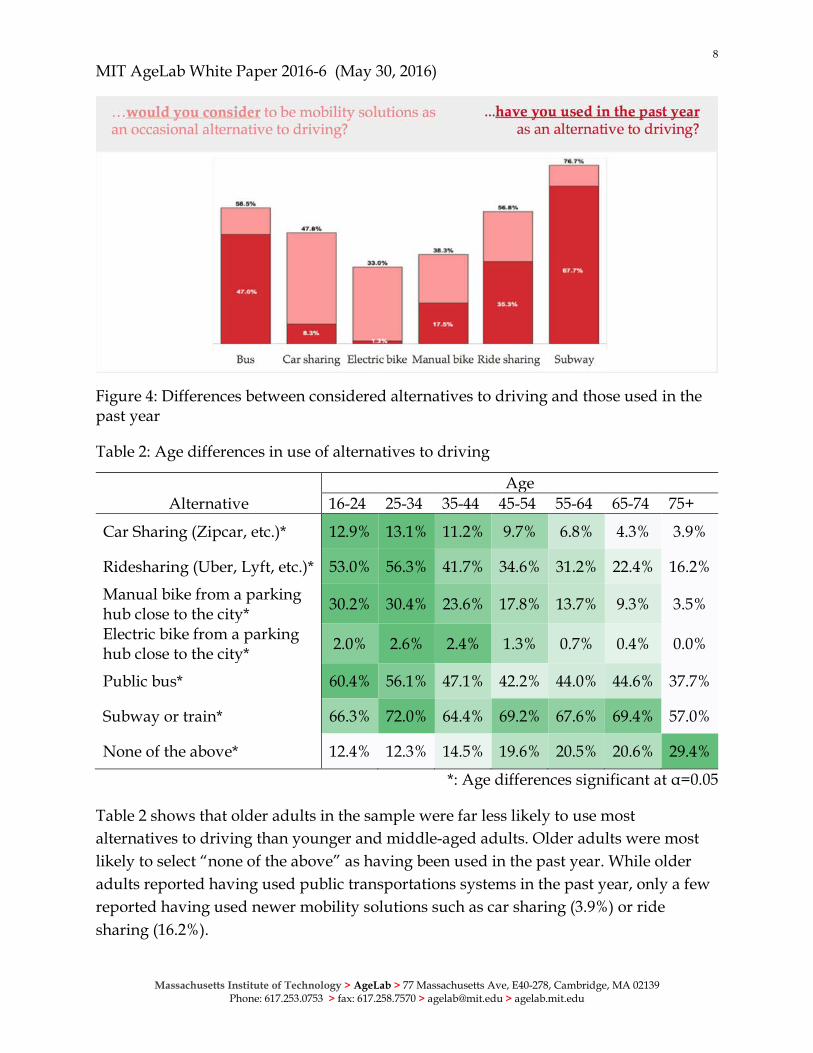
Perceptions and use of driving alternatives were asked in relation to those that would occasionally be used in lieu of driving, those that were permanent alternatives to car ownership, and those that had been used in the past year. Figure 4 summarizes the differences between methods considered for occasional use and those that participants actually used in the past year. While many participants considered the given choices as appropriate for occasional alternatives to driving, far fewer respondents had used any of the alternatives aside from subway or bus systems. Table 2 shows age differences in the use of driving alternatives.
8
MIT AgeLab White Paper 2016-6 (May 30, 2016)
Massachusetts Institute of Technology > AgeLab > 77 Massachusetts Ave, E40-278, Cambridge, MA 02139 Phone: 617.253.0753 > fax: 617.258.7570 > [email protected] > agelab.mit.edu
Figure 4: Differences between considered alternatives to driving and those used in the past year
Table 2: Age differences in use of alternatives to driving
Alternative Age
16-24 25-34 35-44 45-54 55-64 65-74 75+
Car Sharing (Zipcar, etc.)* 12.9% 13.1% 11.2% 9.7% 6.8% 4.3% 3.9%
Ridesharing (Uber, Lyft, etc.)* 53.0% 56.3% 41.7% 34.6% 31.2% 22.4% 16.2%
Manual bike from a parking hub close to the city* 30.2% 30.4% 23.6% 17.8% 13.7% 9.3% 3.5%
Electric bike from a parking hub close to the city* 2.0% 2.6% 2.4% 1.3% 0.7% 0.4% 0.0%
Public bus* 60.4% 56.1% 47.1% 42.2% 44.0% 44.6% 37.7%
Subway or train* 66.3% 72.0% 64.4% 69.2% 67.6% 69.4% 57.0%
None of the above* 12.4% 12.3% 14.5% 19.6% 20.5% 20.6% 29.4%
*: Age differences significant at α=0.05
Table 2 shows that older adults in the sample were far less likely to use most alternatives to driving than younger and middle-aged adults. Older adults were most likely to select “none of the above” as having been used in the past year. While older adults reported having used public transportations systems in the past year, only a few reported having used newer mobility solutions such as car sharing (3.9%) or ride sharing (16.2%).
9
MIT AgeLab White Paper 2016-6 (May 30, 2016)
Massachusetts Institute of Technology > AgeLab > 77 Massachusetts Ave, E40-278, Cambridge, MA 02139 Phone: 617.253.0753 > fax: 617.258.7570 > [email protected] > agelab.mit.edu
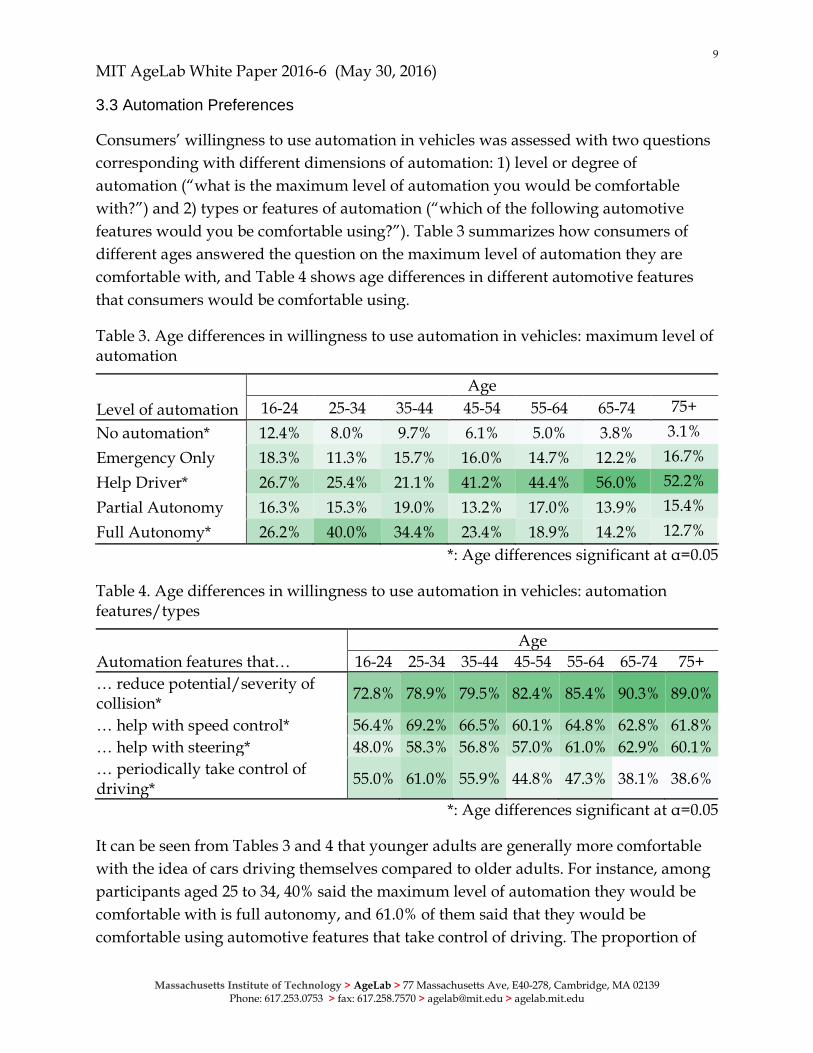
3.3 Automation Preferences
Consumers’ willingness to use automation in vehicles was assessed with two questions corresponding with different dimensions of automation: 1) level or degree of automation (“what is the maximum level of automation you would be comfortable with?”) and 2) types or features of automation (“which of the following automotive features would you be comfortable using?”). Table 3 summarizes how consumers of different ages answered the question on the maximum level of automation they are comfortable with, and Table 4 shows age differences in different automotive features that consumers would be comfortable using.
Table 3. Age differences in willingness to use automation in vehicles: maximum level of automation
Level of automation Age
16-24 25-34 35-44 45-54 55-64 65-74 75+ No automation* 12.4% 8.0% 9.7% 6.1% 5.0% 3.8% 3.1% Emergency Only 18.3% 11.3% 15.7% 16.0% 14.7% 12.2% 16.7% Help Driver* 26.7% 25.4% 21.1% 41.2% 44.4% 56.0% 52.2% Partial Autonomy 16.3% 15.3% 19.0% 13.2% 17.0% 13.9% 15.4% Full Autonomy* 26.2% 40.0% 34.4% 23.4% 18.9% 14.2% 12.7%
*: Age differences significant at α=0.05
Table 4. Age differences in willingness to use automation in vehicles: automation features/types
Automation features that… Age
16-24 25-34 35-44 45-54 55-64 65-74 75+ … reduce potential/severity of collision* 72.8% 78.9% 79.5% 82.4% 85.4% 90.3% 89.0%
… help with speed control* 56.4% 69.2% 66.5% 60.1% 64.8% 62.8% 61.8% … help with steering* 48.0% 58.3% 56.8% 57.0% 61.0% 62.9% 60.1% … periodically take control of driving* 55.0% 61.0% 55.9% 44.8% 47.3% 38.1% 38.6%
*: Age differences significant at α=0.05
It can be seen from Tables 3 and 4 that younger adults are generally more comfortable with the idea of cars driving themselves compared to older adults. For instance, among participants aged 25 to 34, 40% said the maximum level of automation they would be comfortable with is full autonomy, and 61.0% of them said that they would be comfortable using automotive features that take control of driving. The proportion of
10
MIT AgeLab White Paper 2016-6 (May 30, 2016)
Massachusetts Institute of Technology > AgeLab > 77 Massachusetts Ave, E40-278, Cambridge, MA 02139 Phone: 617.253.0753 > fax: 617.258.7570 > [email protected] > agelab.mit.edu
participants who indicated that they would be comfortable with full autonomy and automation features that take control of driving were significantly lower for older segments.
Older adults, on the other hand, were comfortable with some of the automation features presented in the questions, but were likely to draw the line at some point. As shown in Table 3, adults 45 and older were comfortable with active assist that help the driver while the driver remains in control, but less comfortable with partial or full autonomy. Older adults were more comfortable with younger segments with collision avoidance/mitigation features and slightly more comfortable with features that help with steering, but far less comfortable with giving up control of driving compared to younger participants.
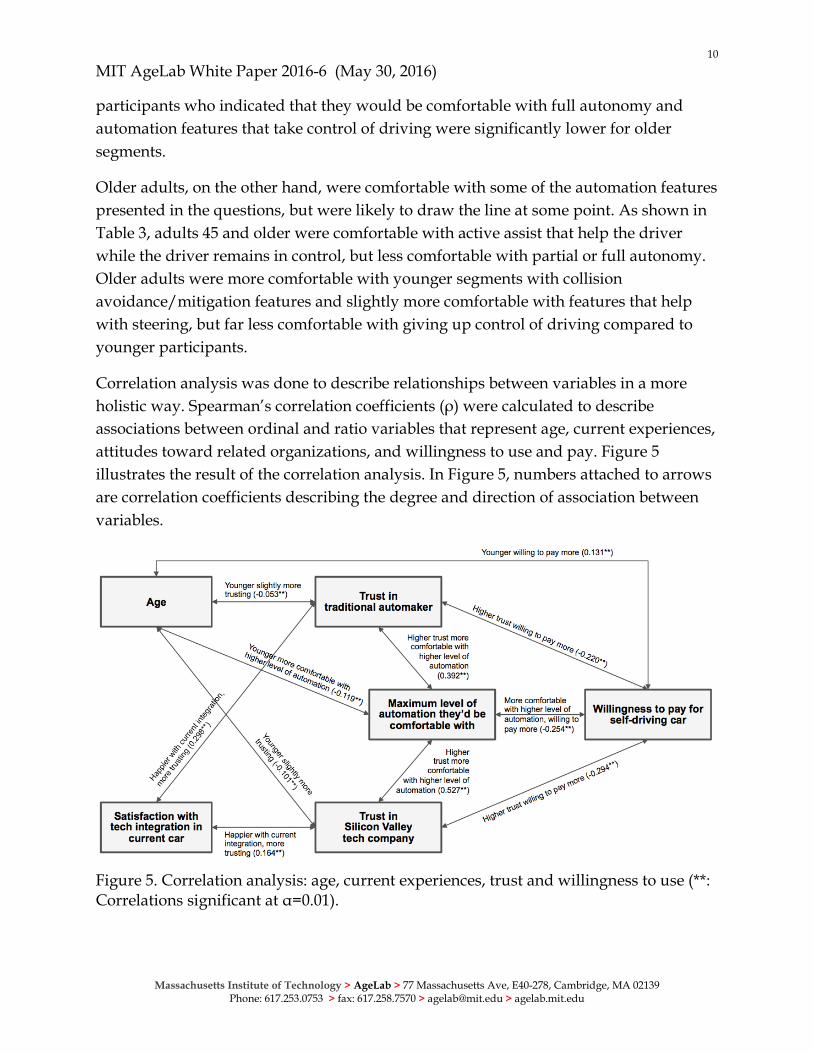
Correlation analysis was done to describe relationships between variables in a more holistic way. Spearman’s correlation coefficients (ρ) were calculated to describe associations between ordinal and ratio variables that represent age, current experiences, attitudes toward related organizations, and willingness to use and pay. Figure 5 illustrates the result of the correlation analysis. In Figure 5, numbers attached to arrows are correlation coefficients describing the degree and direction of association between variables.
Figure 5. Correlation analysis: age, current experiences, trust and willingness to use (**: Correlations significant at α=0.01).
11
MIT AgeLab White Paper 2016-6 (May 30, 2016)
Massachusetts Institute of Technology > AgeLab > 77 Massachusetts Ave, E40-278, Cambridge, MA 02139 Phone: 617.253.0753 > fax: 617.258.7570 > [email protected] > agelab.mit.edu
The correlation analysis showed that younger adults in the sample report a willingness to pay more for a self-driving car, are more comfortable with higher levels of automation, and have higher trust in the different entities that are working to build a self-driving car (i.e. traditional automakers and Silicon Valley technology companies) compared to older adults. Also, consumers who are more satisfied with the technology in their current car indicated higher trust toward entities working to build a self-driving car compared to those who are less happy with what they currently have in their car. Furthermore, higher trust in the different entities to build a self-driving car and more comfort with higher levels of automation were associated with willingness to pay more for a self-driving car, indicating a significant association between attitudes toward autonomous vehicles and behavioral intentions to use them.
4. Initial Conclusions
Transportation continues to be a challenge for adults as they age and become unable to drive safely. A number of transportation alternatives are present to supplement or replace driving. While most respondents would consider using any of the proposed alternatives, few are actively taking advantage of newer programs such as car or ride sharing. This may reflect the spotty availability of these services in suburban and rural areas where a higher concentration of older adults live as well as the still nascent comfort with using on-demand alternatives.
Fully autonomous vehicles have enormous potential to enhance mobility. However, the trust to adopt these technologies is not yet here for a many potential users and may need to be built-up over time. The survey results suggest there may be some hesitation around one's comfort with full automation among the older adult population who could benefit it the most. The good news, however, is that greater than 50% of the older adult market responding to the survey appears comfortable with the concept of technological innovations that help the driver. Training and perceived ease-of-use of a technology directly correlate with eventual adoption of the technology. Improved training methods that more closely align with preferred learning strategies may help by allowing drivers to become more comfortable with progressing levels of automation at their own pace, eventually leading to adoption of fully autonomous vehicles.
Future research might examine how attitudes may differ by region to account for availability of transportation alternatives in suburban and rural areas. In addition, future exploration may assess possible differences in attitudes related to education, income and gender.

12
MIT AgeLab White Paper 2016-6 (May 30, 2016)
Massachusetts Institute of Technology > AgeLab > 77 Massachusetts Ave, E40-278, Cambridge, MA 02139 Phone: 617.253.0753 > fax: 617.258.7570 > [email protected] > agelab.mit.edu
5. Acknowledgment
Support for this work was provided by the US DOT’s Region I New England University Transportation Center at MIT and the Toyota Class Action Settlement Safety Research and Education Program. The views and conclusions being expressed are those of the authors, and have not been sponsored, approved, or endorsed by Toyota or plaintiffs’ class counsel.
Bibliography
Deloitte. (2014). Global Automotive Consumer Study Exploring consumers’ mobility choices and transportation decisions. Retrieved May 29, 2016, from https://www.autonews.com/assets/PDF/CA92618116.PDF.
NHTSA. (2013, May 30). Preliminary Statement of Policy Concerning Automated Vehicles. Retrieved May 24, 2016, from http://www.nhtsa.gov/About+NHTSA/Press+Releases/U.S.+Department+of+Transportation+Releases+Policy+on+Automated+Vehicle+Development
Reimer, B. (2014). Driver Assistance Systems and the Transition to Automated Vehicles: A Path to Increase Older Adult Safety and Mobility? Public Policy & Aging Report, 24(1), 27-31.
SAE. (2014, Jan 16). Taxonomy and Definitions for Terms Related to On-Road Motor Vehicle Automated Driving Systems. J 3016 . SAE International.
Schoettle, B., & Sivak, M. (2015). Motorists' Preferences for Different Levels of Vehicle Automation. University of Michigan Transportation Research Institute (UMTRI) Report Number UMTRI-2015-22. Ann Arbor, Michigan.
The Hartford: https://www.thehartford.com/resources/mature-market-excellence/vehicle-technology-adoption
University of Iowa: http://ppc.uiowa.edu/tvs/study/national-consumer-survey-driving-safety-technologies
University of Michigan Transportation Research Institute (2016, May 25). Vehicle automation: Most drivers still want to retain at least some control. Retrieved May 29, 2016, from http://www.umtri.umich.edu/what-were-doing/news/vehicle-automation-most-drivers-still-want-retain-least-some-control.
13
MIT AgeLab White Paper 2016-6 (May 30, 2016)
Massachusetts Institute of Technology > AgeLab > 77 Massachusetts Ave, E40-278, Cambridge, MA 02139 Phone: 617.253.0753 > fax: 617.258.7570 > [email protected] > agelab.mit.edu
About the AgeLab
The Massachusetts Institute of Technology AgeLab conducts research in human behavior and technology to develop new ideas to improve the quality of life of older people. Based within MIT's Center for Transportation & Logistics, the AgeLab has assembled a multidisciplinary team of researchers, as well as government and industry partners, to develop innovations that will invent how we will live, work and play tomorrow. For more information about AgeLab, visit agelab.mit.edu.
Appendix A:
1. What is the Year, Make and Model of your current car?
2. What is the maximum level of automation you would be comfortable with? ( ) No automation ( ) Features that are usually inactive, but active only in certain events such as a
collision ( ) Features that actively help the driver while the driver remains in control ( ) Features that that relieve the driver of all control for periods of time ( ) Features that completely relieve the driver of all control for the entire drive
(e.g. fully autonomous car)
3. Which of the following automotive features would you be comfortable using? Select all that apply. [ ] Features that reduce the potential or severity of a collision (e.g. automatic
emergency braking, reverse collision mitigation) [ ] Features that help with speed control (e.g. adaptive cruise control) [ ] Features that help with steering (e.g. lane keeping assistance) [ ] Features that periodically take control of driving (e.g. highway automation,
traffic-jam assist)
4. In the future, should fully automated vehicles become available, which of the following options for primary control of the vehicle in the case of automation failure would be acceptable? ( ) An operator in the vehicle takes control (e.g., like today’s driver) ( ) A remote operator takes control of the vehicle (e.g., like a drone operator) ( ) The vehicle automatically pulls to the side of the road and awaits service
14
MIT AgeLab White Paper 2016-6 (May 30, 2016)
Massachusetts Institute of Technology > AgeLab > 77 Massachusetts Ave, E40-278, Cambridge, MA 02139 Phone: 617.253.0753 > fax: 617.258.7570 > [email protected] > agelab.mit.edu
6. How would you rate your overall level of trust in a traditional automaker (e.g., Ford, Toyota, GM, etc.) to produce an autonomous car?
-5 -4 -3 -2 -1 0 1 2 3 4 5 Very Very
Distrustful Neutral Trustful
7. How would you rate your overall level of trust in a Silicon Valley tech company (e.g., Apple, Google, etc.) to produce an autonomous car?
-5 -4 -3 -2 -1 0 1 2 3 4 5 Very Very
Distrustful Neutral Trustful 8. How much would you consider paying for a car that completely drives itself?
( ) $100,000 to $150,000 plus ( ) $75,000 to $99,999 ( ) $50,000 to $74,999 ( ) $25,000 to $49,999 ( ) $24,999 and under
9. Which of the following would you consider to be mobility solutions as an occasional alternative to driving? (Select all that apply.) [ ] Car Sharing (Zipcar, etc.) [ ] Ridesharing (Uber, Lyft, etc.) [ ] Manual bike from a parking hub close to the city [ ] Electric bike from a parking hub close to the city [ ] Public Bus [ ] Subway or train [ ] Other _________________________ [ ] None of the above
10. Which of the following would you consider to be mobility solutions as a permanent alternative to car ownership? (Select all that apply.) [ ] Car Sharing (Zipcar, etc.) [ ] Ridesharing (Uber, Lyft, etc.) [ ] Manual bike from a parking hub close to the city [ ] Electric bike from a parking hub close to the city [ ] Public Bus [ ] Subway or train [ ] Other _________________________ [ ] None of the above
15
MIT AgeLab White Paper 2016-6 (May 30, 2016)
Massachusetts Institute of Technology > AgeLab > 77 Massachusetts Ave, E40-278, Cambridge, MA 02139 Phone: 617.253.0753 > fax: 617.258.7570 > [email protected] > agelab.mit.edu
11. Which of the following have you used in the past year as an alternative to driving? (Select all that apply.) [ ] Car Sharing (Zipcar, etc.) [ ] Ridesharing (Uber, Lyft, etc.) [ ] Manual bike from a parking hub close to the city [ ] Electric bike from a parking hub close to the city [ ] Public Bus [ ] Subway or train [ ] Other _________________________ [ ] None of the above
12. How do you feel about the technology in the car you drive today? (Select the closest answer.) ( ) I'm very unhappy with the technology ( ) I like some features, but don't use most ( ) I have no opinion ( ) I like most of the features ( ) I'm very happy with the technology
13. For your most recent car purchase, do you feel that the sales staff encouraged
you to buy technology that was not needed? ( ) Yes ( ) No ( ) Don’t know or Unsure
14. How did you learn to use the technology in the car you drive today? (Select all
that apply.) [ ] A friend or family member [ ] Websites or on-line videos [ ] Dealer while interacting with sales staff [ ] Dealer during delivery [ ] Vehicle manual [ ] Other material provided by the manufacture [ ] Trial and error [ ] By luck [ ] Other (please specify) [ ] I don’t know how to use the technology in my car
16
MIT AgeLab White Paper 2016-6 (May 30, 2016)
Massachusetts Institute of Technology > AgeLab > 77 Massachusetts Ave, E40-278, Cambridge, MA 02139 Phone: 617.253.0753 > fax: 617.258.7570 > [email protected] > agelab.mit.edu
16. How would you prefer to learn about the technology in the car you drive today? [ ] A friend or family member [ ] Websites or on-line videos [ ] Dealer while interacting with sales staff [ ] Dealer during delivery [ ] Vehicle manual [ ] Other material provided by the manufacture [ ] Trial and error [ ] By luck [ ] The car teaches me [ ] Other (please specify)
17. Are you happy with how that technology is integrated with the design of your car today?
-5 -4 -3 -2 -1 0 1 2 3 4 5 Very Very
Unhappy Neutral Happy
18. What age range do you fit in? ( ) 16 to 24 ( ) 25 to 34 ( ) 35 to 44 ( ) 45 to 54 ( ) 55 to 64 ( ) 65 to 74 ( ) 75 plus
19. What gender do you identify with?
( ) Male ( ) Female ( ) Other or prefer not to answer
20. What is your zip code? (For general demographic purposes; skip if preferred.)
_________


![Autonomous vehicles[1]](https://static.fdocuments.in/doc/165x107/55d4dd37bb61eb1a2a8b4577/autonomous-vehicles1-55d6c4dce222e.jpg)