
Phase 2: Systems Analysis Chapter 4 Enterprise Modeling.
44
Phase 2: Systems Analysis Chapter 4 Enterprise Modeling
-
Upload
ashlyn-blair -
Category
Documents
-
view
230 -
download
2
Transcript of Phase 2: Systems Analysis Chapter 4 Enterprise Modeling.

Phase 2: Systems Analysis
Chapter 4
Enterprise Modeling

Chapter Objectives • Describe enterprise modeling concepts
and tools, including entity-relationship diagrams, data flow diagrams, a data dictionary, and process descriptions
• Explain how ERDs provide an overview of system interactions
• Describe the symbols used in data flow diagrams and explain the rules
• Draw data flow diagrams in a sequence, from general to specific
Chapter Objectives
• Explain how to level and balance a set of data flow diagrams
• Describe how a data dictionary is used and what it contains
• Use process description tools, including structured English, decision tables, and decision trees
• Describe the relationship between logical and physical models

Enterprise Modeling Tools
• Systems analysts use many graphical techniques to describe an information system
• Two popular tools are entity-relationship diagrams and data flow diagrams

Entity-Relationship Diagrams
• An entity is a person, place, thing, or event for which data is collected and maintained
• An initial ERD helps you understand the interaction among system entities and provides an overall view of the system
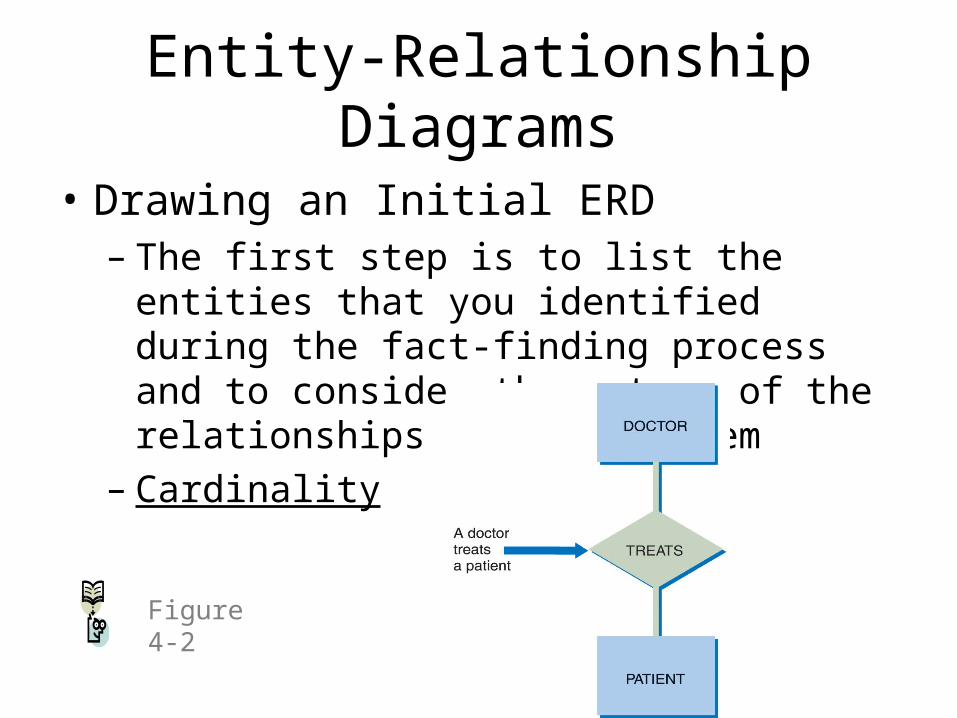
Entity-Relationship Diagrams
• Drawing an Initial ERD– The first step is to list the entities that you
identified during the fact-finding process and to consider the nature of the relationships that link them
– Cardinality
Figure 4-2
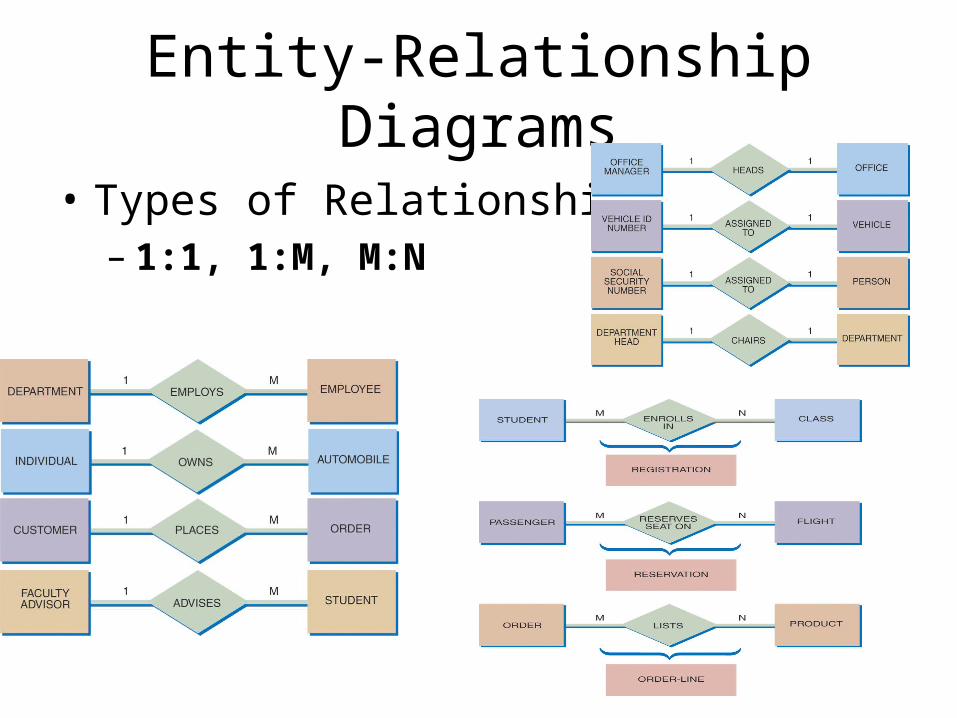
Entity-Relationship Diagrams
• Types of Relationships– 1:1, 1:M, M:N

Data Flow Diagrams
• A data flow diagram (DFD) shows how data moves through an information system but does not show program logic or processing steps
• A set of DFDs provides a logical model that shows what the system does, not how it does it

Data Flow Diagrams
• DFD Symbols– DFDs use four basic symbols that represent
processes, data flows, data stores, and entities
• Gane and Sarson symbol set• Yourdon symbol set
– Symbols are referenced by using all capital letters for the symbol name
Figure 4-7

Data Flow Diagrams
• DFD Symbols
Figure 4-7

Data Flow Diagrams
• DFD Symbols– Process symbol and Data flow symbols
Figure 4-8

Data Flow Diagrams
• Data store symbol
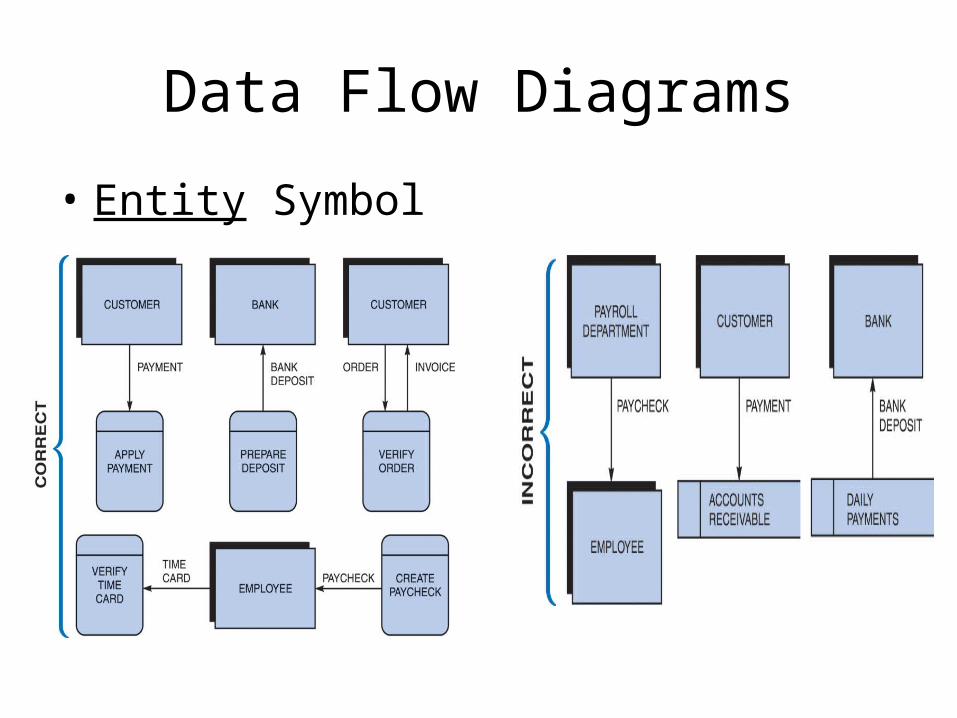
Data Flow Diagrams
• Entity Symbol
Data Flow Diagrams
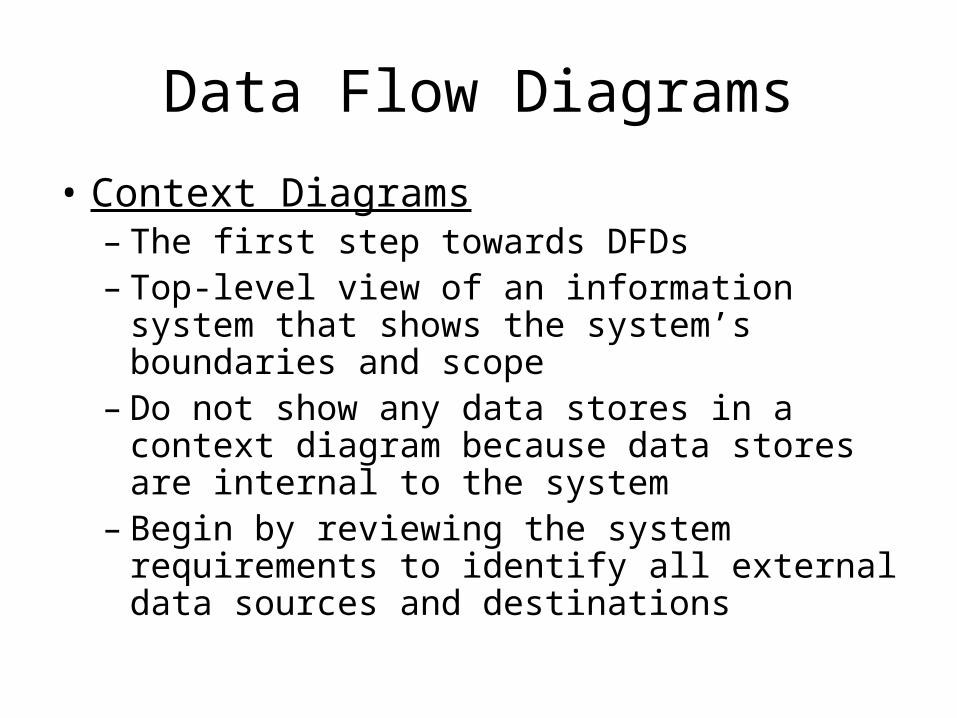
• Context Diagrams– The first step towards DFDs– Top-level view of an information system that
shows the system’s boundaries and scope– Do not show any data stores in a context
diagram because data stores are internal to the system
– Begin by reviewing the system requirements to identify all external data sources and destinations
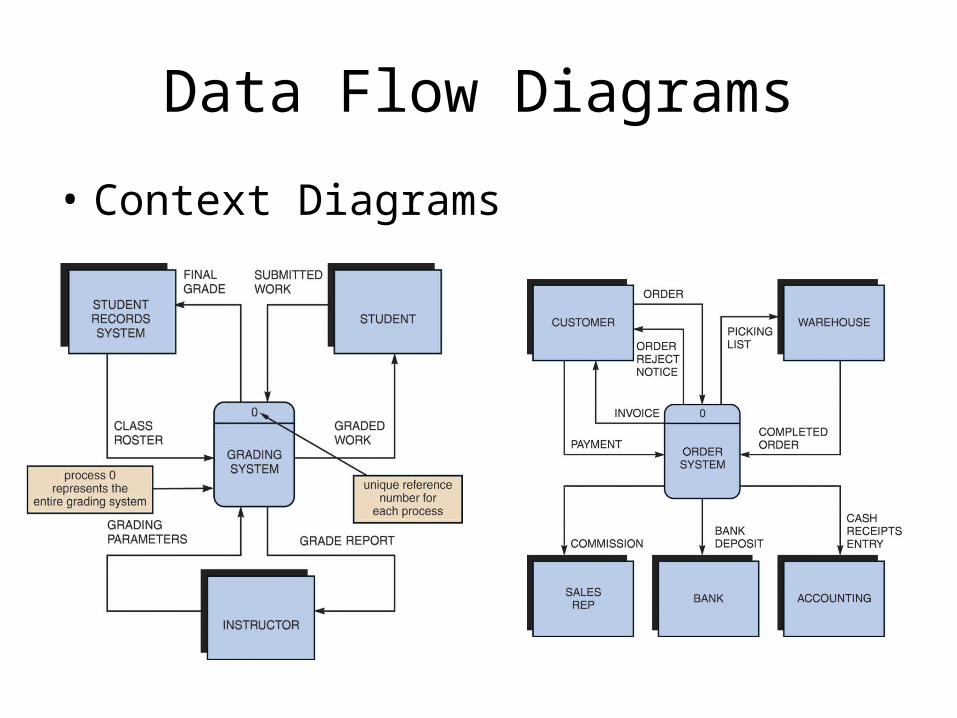
Data Flow Diagrams
• Context Diagrams
Data Flow Diagrams
• Conventions for DFDs1. Each context diagram must fit on one page2. The process name in the context diagram
should be the name of the information system
3. Use unique names within each set of symbols
4. Do not cross lines5. Use a unique reference number for each
process symbol

Data Flow Diagrams
• Diagram 0– Zooms in on the context diagram and shows
major processes, data flows, and data stores– Must retain all the connections that flow into
and out of process 0– Each process has a reference number– Diverging data flow
Figure 4-19

Data Flow Diagrams
• Diagram 0– If same data flows in both directions, you can
use a double-headed arrow– Diagram 0 represents exploded view of
process 0– Parent diagram– Child diagram– Functional primitive
Figure 4-20

Data Flow Diagrams
• Diagram 0 for the Grading System

Data Flow Diagrams
• Lower-Level Diagrams– Created using leveling and balancing
techniques– Leveling
• Uses a series of increasingly detailed DFDs to describe an information system
• Exploding, partitioning, or decomposing
Figure 4-21
Figure 4-22

Data Flow Diagrams
• Lower-Level Diagrams– Balancing
• Ensures that the input and output data flows of the parent DFD are maintained on the child DFD
Figure 4-23
Figure 4-24
Figure 4-25

Data Flow Diagrams
• Strategies for Developing DFDs– A set of DFDs is a graphical, top-down model– With a bottom-up strategy, you first identify all
functional primitives, data stores, entities, and data flows
– The main objective is to ensure that your model is accurate and easy to understand

Data Flow Diagrams
• Strategies for Developing DFDs– General rule of thumb is that a diagram
should have no more than nine process symbols
– To construct a logical model of a complex system, you might use a combination of top-down and bottom-up strategies
– The best approach depends on the information system you are modeling
Figure 4-26
Figure 4-27
Figure 4-28

Data Dictionary
• A data dictionary, or data repository, is a central storehouse of information
• An analyst uses the data dictionary to collect, document, and organize specific facts about the system
• The data dictionary also defines and describes all data elements and meaningful combinations of data elements

Data Dictionary
• A data element, also called a data item or field, is the smallest piece of data that has meaning
• Data elements are combined into records, also called data structures
• A record is a meaningful combination of related data elements that is included in a data flow or retained in a data store
Figure 4-29
Data Dictionary
• Documenting the Data Elements– You must document every data element in the
data dictionary– The objective is to provide clear,
comprehensive information about the data and processes that make up the system
Figure 4-30
Figure 4-31

Data Dictionary
• Documenting the Data Elements– The following attributes usually are recorded
and described• Data element name and label• Alias• Type and length• Default value• Acceptable values - Domain and validity rules

Data Dictionary
• Documenting the Data Elements– The following attributes usually are recorded
and described• Source• Security• Responsible user(s)• Description and comments

Data Dictionary
• Documenting the Data Flows– The typical attributes are as follows
• Data flow name or label• Description• Alternate name(s)• Origin• Destination• Record• Value and frequency
Figure 4-32

Data Dictionary
• Documenting the Data Stores– Typical characteristics of a data store are
• Data store name or label• Description• Alternate name(s)• Attributes• Volume and frequency
Figure 4-33

Data Dictionary
• Documenting the Processes– Typical characteristics of a process
• Process name or label• Description• Process number• Process description
Figure 4-34

Data Dictionary
• Documenting the Entities– Typical characteristics of an entity include
• Entity name• Description• Alternate name(s)• Input data flows• Output data flows
Figure 4-35

Data Dictionary
• Documenting the Records– Typical characteristics of a record include
• Record or data structure name• Definition or description• Alternate name(s)• Attributes
Figure 4-36

Data Dictionary
• Data Dictionary Reports– You can obtain many valuable reports from
a data dictionary• An alphabetized list of all data elements by name• A report by user departments of data elements
that must be updated by each department• A report of all data flows and data stores that
use a particular data element• Detailed reports showing all characteristics

Process Description Tools
• A process description documents the details of a functional primitive, which represents a specific set of processing steps and business logic

Process Description Tools
• Modular Design– Based on combinations of three logical
structures, sometimes called control structures which serve as building blocks for the process1. Sequence
2. Selection
3. Iteration - looping
Figure 4-37
Figure 4-38
Figure 4-39

Process Description Tools
• Structured English– Must conform to the following rules
• Use only the three building blocks of sequence, selection, and iteration
• Use indentation for readability• Use a limited vocabulary, including standard terms
used in the data dictionary and specific words that describe the processing rules

Process Description Tools
• Structured English– Might look familiar to programming students
because it resembles pseudocode
Figure 4-40
Figure 4-41

Process Description Tools
• Decision Tables– Shows a logical structure, with all possible
combinations of conditions and resulting actions
– It is important to consider every possible outcome to ensure that you have overlooked nothing
Figure 4-42
Figure 4-43

Process Description Tools
• Decision Tables– Can have more than two possible outcomes– Often are the best way to describe a complex
set of conditions
Figure 4-44

Process Description Tools
• Decision Trees– Graphical representation of the conditions,
actions, and rules found in a decision table– Whether to use a decision table or tree often
is a matter of personal preference
Figure 4-45
Figure 4-46

Logical Versus Physical Models
• While structured analysis tools are used to develop a logical model for a new information system, such tools also can be used to develop physical models of an information system
• A physical model shows how the system’s requirements are implemented

Logical Versus Physical Models
• Sequence of Models– Many systems analysts create a physical
model of the current system and then develop a logical model of the current system before tackling a logical model of the new system
– Performing that extra step allows them to understand the current system better

Logical Versus Physical Models
• Four-Model Approach– Develop a physical model of the current
system, a logical model of the current system, a logical model of the new system, and a physical model of the new system
– The only disadvantage of the four-model approach is the added time and cost