pg. Ascentis Express UHPLC Columns
32
pg. 18 ANALYSIS OF PAHS IN OLIVE OIL pg. 29 SUPELCO SLB-IL60 UNIQUE SELECTIVITY Applications Newsletter Volume 32.2 pg. 3 Ascentis Express UHPLC Columns
Transcript of pg. Ascentis Express UHPLC Columns

pg. 18ANALYSIS OF PAHS
IN OLIVE OIL
pg. 29SUPELCO SLB-IL60
UNIQUE SELECTIVITY
Applications Newsletter Volume 32.2
pg. 3Ascentis Express UHPLC Columns

sigma-aldrich.com/analytical
Reporter 32.2 |2
Table of Contents
Pharmaceutical
Ascentis Express UHPLC Columns Available with 2.0 µm Fused-Core Particles . . . . . . . . . . . . . 3
Re-equilibration in HILIC Chromatography . . . .7
Flash Chromatography Using Supel Flash Cartridges . . . . . . . . . . . . . . . . . . . . 11
Clinical/Bioanalytical
Sample Prep Method Development and Optimization for the LC/MS/MS Analysis of Steroid Hormones in Plasma . . . 12
Food
Aminoglycoside Analysis in Pork Muscle . . . . . . . . . . . . . . . . . . . . . . . . . . . . 15
Improved Recoveries and Lower Background of PAHs in Olive Oil . . . . . . . . . . . . . 18
Environmental
Determination of Triclosan in Environmental Waters . . . . . . . . . . . . . . . . . . . . 22
SPME Method for MCHM in Water . . . . . . . . . 24
Standards
Variables that Impact Immunosuppressant LC/MS/MS Analysis . . . . . . . . . . . . . . . . . . . . . . . 26
Combating the Rise of New Designer Drugs . . . . . . . . . . . . . . . . . . . . . . 27
Reagents
New Silylation Reagents for GC Derivatization . . . . . . . . . . . . . . . . . . . . . . 28
Research & Technology
Supelco SLB-IL60 Ionic Liquid GC Columns: Unique Selectivity . . . . . . . . . . . 29
ReporterVolume 32.2
No Time or Budget to Attend an Off-Site Seminar? Try a Cost-Free On-Demand Webinar!
Dear Colleague:
Scientists use a variety of means to stay on top of the latest developments in their field and to build knowledge or expertise within a specific area. They subscribe to relevant journals and other publications, and they periodically attend conferences, workshops and seminars.
An increase in demand for workplace efficiency, coupled with budgetary limitations, often make it difficult to justify the travel time and expense to attend an educational seminar or workshop that satisfies a professional development goal but does not align with the needs of the organization. To help overcome this challenge, Supelco is pleased to offer a collection of (cost-free) chromatography-related webinars, which can be accessed online and at your convenience.
For the past two years, Supelco scientists and their research collaborators have partnered with a handful of leading online information and learning resources – notably, Separation Science, Bioanalysis Zone, LCGC and Lab Manager – to deliver globally broadcasted webinars pertaining to the fundamentals, best practices, troubleshooting, technology advances and applications in chromatography.
Through some of our recently completed webinars, you can learn about:
• Achieving higher efficiency UHPLC performance for small-molecule separation with the new line of Ascentis® Express columns based on 2-μm Fused-Core® particles, which also happens to be the featured topic of this Reporter edition
• U/HPLC reversed-phase separation of biomolecules using new BIOshell™ columns
• Applications for ionic liquid GC columns, demonstrating their unique selectivity benefits
• GC column selection and method development basics; also, the principles of fast GC
• SPE fundamentals and recent developments, including novel phases for difficult sample matrices
Each presentation is given by an (academic, agency or industry) expert in the field. The full-length recording is available to you with the same on-demand ease of watching a video from the convenience of your desk or the comfort of your home; most importantly, without the travel time, expense and effort involved with attending an off-site seminar or workshop.
I urge you to access our useful webinar resources to help broaden your chromatography knowledge, to keep up with separation technology trends, and to seek solutions for challenging applications in the clinical, pharmaceutical, food and environmental fields.
To access the Analytical Video & Webinar portal, visit sigma-aldrich.com/videos
Best regards,
Errol Fernandes Market Segment Manager Marketing Operations [email protected]
Errol Fernandes, PhD
sigma-aldrich.com/analytical
Visit us on the web at sigma-aldrich.com/thereporter
Cover Photo: Ascentis Express 2.0 µm columns are the best Fused-Core UHPLC columns -- an optimized solution for high throughput small molecule analysis.
Reporter is published four times a year by Supelco, 595 North Harrison Road, Bellefonte, PA 16823-0048.

3Order: 800-325-3010 (U.S.) 814-359-3441 (Global)
Ascentis Express UHPLC Columns Available with 2.0 µm Fused-Core Particles
(continued on next page)
Richard A. Henry, Technical Advisor to Supelco, Division of Sigma-Aldrich Gaurang Parmar, HPLC Product Manager
• Proven column performance and ruggedness using the latest Fused-Core® particles
• Lower operating pressure than typical sub-2 µm particle columns
• Selective C18 and F5 phases available; other phases in preparation
Column PerformanceThe new Supelco Ascentis® Express column line has been designed specifically for UHPLC instruments with 2.0 µm Fused-Core silica, as diagrammed in Figure1. Ascentis Express 2.0 µm UHPLC columns are optimized to preserve efficiency advantages of using sub-2 µm particles while minimizing pressure disadvantages. As shown in Figure 2, the plot of reduced plate height vs flow velocity for Fused-Core 2.0 µm particle columns matches a Fused-Core 2.7 µm particle column by delivering h values that are consistently below 2 (typically ~ 1.7). This is significantly lower than typical commercial sub-2 µm UHPLC columns that employ either porous or core-type particles.
P4 – AcQuity should have ®, UPLC should have ®
P6 – Aeris™ should be Aeris ®
P17- Agilent does not need ® (Figure 2)
Figure 1. Ascentis Express Fused-Core Silicas for Small Molecule Separations
Fused-Core
2.7 µmFused-Core
5 µmFused-Core
0.4 µm
1.2 µm2.0 µm
Columns with lower reduced plate heights demonstrate higher efficiency for a given particle size. Ascentis Express columns with 2.0 µm particles show comparable efficiency at significantly lower pressure than competitor columns that use smaller particles. Achieving high performance at lower pressures can extend useful column life and minimize selectivity changes created by frictional heating that creates temperature variation inside the column bed. Ascentis Express 2.0 µm columns will show highest performance when used in Waters ACQUITY, Agilent Infinity, Thermo Scientific™ Dionex UltiMate™ and Vanquish™, Shimadzu® Nexera, and other modern UHPLC instruments. Figure 3 plots pressure drop vs flow rate for the columns compared in Figure 2. Figure 4 shows a chromatographic QC chromatogram for Ascentis Express 10 cm x 2.1 mm, 2.0 µm column, and Table 2 compares test results to other Supelco and competitor columns. The bar chart in Figure 5 illustrates column performance in plates per pressure unit. Note that Supelco Ascentis Express columns easily outperform typical commercial C18 columns when ranked by a plates/pressure measurement. The only other column that compares favorably to Ascentis Express C18, 2.0 µm in plates/pressure is the new Supelco Titan C18, 1.9 µm column which features a similar, narrow particle distribution.
Figure 2. Reduced Plate Height van Deemter Plots Showing Performance of Ascentis Express Columns with 2.0 µm and 2.7 µm Fused-Core Particles Compared to Columns with sub-2 µm Particles at Various Flow Velocities columns: as listed, 5 cm x 2.1 mm I.D. solute: naphthalene mobile phase: 50:50 acetonitrile:water instrument: Shimadzu Nexera
0.00
1.00
2.00
3.00
4.00
5.00
6.00
7.00
8.00
0.00 2.00 4.00 6.00 8.00 10.00 12.00
Redu
ced
Plat
e H
eigh
t, h
Linear Mobile Phase Velocity, mm/sec
Porous, 1.7 µm
Core-Type, 1.7 µm
Core-Type, 1.6 µm
Fused-Core, 2.0 µm
Fused-Core, 2.7 µm
Porous, 1.7 µm
Core - 1.7 μmand 1.6 μmFused - Core, 2.0 μmand 2.7 μm
Figure 3. Pressure Drop (flow resistance) for Ascentis Express 5 cm x 2.1 mm Columns with 2.0 µm and 2.7 µm Fused-Core Particles Compared to sub-2 µm Columns at Various Flow Rates columns: as listed, 5 cm x 2.1 mm I.D. solute: naphthalene mobile phase: 50:50 acetonitrile:water instrument: Shimadzu Nexera
0
100
200
300
400
500
600
700
800
900
0.00 0.20 0.40 0.60 0.80 1.00 1.20
Colu
mn
Pres
sure
, bar
Mobile Phase Flow Rate, mL/min
Porous, 1.7 μm andCore-Type, 1.6 μm
Core-Type, 1.7 μm
Fused-Core, 2.0 μm
Fused-Core, 2.7 μm
Porous, 1.7 µm
Core-Type, 1.6 µm
Core-Type, 1.7 µm
Fused-Core, 2.0 µm
Fused-Core, 2.7 µm

Reporter 32.2 |4 Pharmaceutical
sigma-aldrich.com/express
Figure 4. Suitability Test Chromatogram columns: Ascentis Express C18, 10 cm x 2.1 mm I.D., 2.0 µm (50813-U) mobile phase: (A) water, (B) acetonitrile, (50:50, A:B) flow rate: 0.4 mL/min pressure and performance: see Table 2 system background pressure: 370 psi column temp.: 35 °C detector: UV, 250 nm injection: 0.5 µL sample: 75:25 water:acetonitrile Instrument: Dionex UltiMate 3000
0
1
2 34
5
1.0 2.0 3.0 4.0
Min
Figure 6. Log k Plots Showing Equivalent Selectivity for Ascentis Express C18, 2.0 and 2.7 µm Columns at Two Different Solvent and pH Conditions columns: Ascentis Express C18 as indicated, 10cm x 2.1mm I.D. mobile phase 1 (M1): 10 mM ammonium formate (70:30 water:acetonitrile), pH 7.0 mobile phase 2 (M2): 10 mM ammonium formate (70:30 water:acetonitrile), pH 4.0 mobile phase 3 (M3): 10 mM ammonium formate (50:50 water:methanol), pH 7.0 mobile phase 4 (M4): 10 mM ammonium formate (50:50 water:methanol), pH 4.0 flow rate: 0.3 mL/min column temp: 35° C injection: 2 µL instrument: Agilent 1290 Infinity with 6210 TOF MS in ESI+ mode, 100-1000m/z
2.52.01.51.00.50.0-0.5-1.0
2.5
2.0
1.5
1.0
0.5
0.0
-0.5
-1.0
S 0.0211446R-Sq 99.9%R-Sq(adj)99.9%
Asc
entis
Exp
ress
C18
2.7
μm
M1
Ascentis Express C18 2.0 μm M1
2.52.01.51.00.50.0-0.5-1.0
2.5
2.0
1.5
1.0
0.5
0.0
-0.5
-1.0
S 0.0156182R-Sq 100.0%R-Sq(adj) 100.0%
Asc
entis
Exp
ress
C18
2.7
μm
M3
Ascentis Express C18 2.0 μm M3
2.52.01.51.00.50.0-0.5-1.0
2.5
2.0
1.5
1.0
0.5
0.0
-0.5
-1.0
S 0.0099259R-Sq 100.0%R-Sq(adj) 100.0%
Asc
entis
Exp
ress
C18
2.7
μm
M2
Ascentis Express C18 2.0 μm M2
2.52.01.51.00.50.0-0.5-1.0
2.5
2.0
1.5
1.0
0.5
0.0
-0.5
-1.0
S 0.0306074R-Sq 99.8%R-Sq(adj) 99.8%
Asc
entis
Exp
ress
C18
2.7
μm
M4
Ascentis Express C18 2.0 μm M4
1. Uracil 2. Acetophenone 3. Benzene 4. Toluene 5. Ethylbenzene
Figure 5. Performance Ranking for Modern UHPLC Columns in Plates per Pressure Unit columns: as listed, 10 cm x 2.1 mm I.D. mobile phase: (A) water, (B) acetonitrile, (50:50, A:B) flow rate: 0.4 mL/min pressure and performance: see Table 2 system background pressure: 370 psi column temp.: 35 °C detector: UV, 250 nm injection: 0.5 µL sample: 75:25 water:acetonitrile Instrument: Dionex UltiMate 3000
8.9
6.4
4.7 5.1
4.0 3.73.4
4.0
0.0
1.0
2.0
3.0
4.0
5.0
6.0
7.0
8.0
9.0
10.0
Ascentis Express
C18, 5.0 µm
Ascentis Express
C18, 2.7 µm
Ascentis Express
C18, 2.0 µm
Titan C18, 1.9 µm
Porous, 1.8 µm
Core-Type C18,1.7 µm
Porous, 1.7 µm
Core-Type, 1.6 µm
Plat
es/p
si
270910 N/m 5744 psi

5Order: 800-325-3010 (U.S.) 814-359-3441 (Global)
(continued on next page)
Figure 7. Sulfa Drug Comparison
column: as listed, 10 cm x 2.1 mm I.D. mobile phase: (A) water with 0.1% acetic acid; (B) acetonitrile with 0.1%
acetic acid, (90:1 A:B) flow rate: 0.8 mL/min pressure: see below column temp.: 45 °C detector: UV, 250 nm injection: 0.5 µL sample: 25 µg/mL in 90:10 water:methanol instrument: Agilent 1200
0 0.2 0.4 0.6 0.8 1.0 1.2 1.4
12
34
Min
0 0.2 0.4 0.6 0.8 1.0 1.2 1.4
12
34
Min
1 23
4
0 0.2 0.4 0.6 0.8 1.0 1.2 1.4
Min
1. Sulfacetamide2. Sulfadiazine3. Sulfathiazole4. Sulfamerazine
7A. Ascentis Express C18, 2.0 µm 18229 plates peak 4 10721 psi
Column SelectivityAscentis Express C18 and F5 (pentafluoropropyl or PFP) columns are currently available in the 2.0 µm particle size, with a complete range of phases under development (for latest details, refer to sigma-aldrich.com/express. C18 phases with flexible alkyl chains are extremely versatile because solutes are retained by a simple partition mechanism where dispersive interactions and solubility in organic solvent controls retention and selectivity. Ascentis Express F5 phase behaves differently because sample components can interact not only by dispersive forces but also with the aromatic ring that becomes highly polarized by five fluorine substituent groups. C18 and PFP phases typically show very large selectivity differences so they are complementary choices for method development.
Different particle sizes in the Ascentis Express 90 Å Fused-Core column family are designed to have the same retention and selectivity for easy method development or method transfer. Log k values for a 60-component sample containing acidic, basic and neutral pharmaceuticals are compared in Figure 6 between the new Ascentis Express C18, 2.0 µm column and the popular Ascentis Express C18, 2.7 µm column that has become well-established in many HPLC methods; acetonitrile and methanol conditions were investigated at pH 4.0 and 7.0. Note correlation is essentially 100% for all four conditions, indicating that a C18 phase bonded to either the 2.0 µm or 2.7 µm Fused-Core particle will produce the same selectivity factor (α = k2/k1) for a wide range of different chemical structures. Note also the slopes for each log k plot are essentially unity, indicating that two C18 columns will also match one another in retention factor (k). This identical selectivity and retention performance is demonstrated in Figures 7A and 7B for Ascentis Express C18, 2.0 µm and 2.7 µm columns using a mixture of sulfa drugs. Performance is also compared to a commercial core-type C18, 1.7 µm column (Figure 7C) to demonstrate that Ascentis Express columns have similar retention and selectivity to other C18 columns regardless of particle size or design. Note that the Ascentis Express C18 2.0 µm column matches the sub-2 µm C18 core-type in efficiency, but operates at lower pressure.
Table 1. Fused-Core Silica Specifications
Particle Size 2.0 µm
Pore Size 90 Å
Surface Area m2/g 120
Max Temp 60 °C
Pressure 1000 bar (14500 psi)
Operating pH 2-9
Other Features End-capped phases unless specified
Frit Size 1 μm
7B. Ascentis Express C18, 2.7 µm 11772 plates peak 4 6100 psi
7C. Core-Type C18, 1.7 µm 18096 plates peak 4 12490 psi

Reporter 32.2 |6
sigma-aldrich.com/express
Pharmaceutical
Figure 8. Steroid Comparison column: as indicated, 10 cm x 2.1 mm I.D., 2.0 µm mobile phase: (A) water, (B) methanol (50:50, A:B) flow rate: 0.5 mL/min pressure: 11430 psi (788 bar) system background pressure: 420 psi column temp.: 35 ° C detector: UV, 240 nm injection: 0.5 µL sample: 50 µg/mL in 85:15, water:methanol) instrument: Dionex UltiMate 3000 1. Hydrocortisone 2. Prednisolone 3. Prednisone
12 3
0 0.1 0.2 0.3
Min
3
1, 2
0.20.1 0.30Min
Table 2. Comparison of Theoretical Plates and Pressure for Ascentis Express C18 Columns Compared to other Commercial C18 sub-2 µm Columns columns: as listed, 10 cm x 2.1 mm mobile phase: (A) water, (B) acetonitrile, (50:50, A:B) flow rate: 0.4 mL/min pressure and performance: as listed in Table 2 system background pressure: 370 psi column temp.: 35 °C detector: UV, 250 nm injection: 0.5 µL sample: 75:25 water:acetonitrile Instrument: Dionex UltiMate 3000
Part
icle
(µm
)
ColumnAscentis Express C18 5.0 0.447 1.251 1.80 1.01 12822 1433 8.9
Ascentis Express C18 2.7 0.438 2.292 4.23 1.06 20149 3165 6.4
Ascentis Express C18 2.0 0.453 2.319 4.12 1.03 27091 5744 4.7
Titan C18 1.9 0.502 3.689 6.35 1.00 24034 4677 5.1
Porous C18 1.8 0.506 2.987 4.90 1.06 22259 5585 4.0
Core-Type C18 1.7 0.469 2.087 3.45 1.04 24849 6712 3.7
Porous C18 1.7 0.536 2.583 3.82 1.06 23092 6751 3.4
Core-Type C18 1.6 0.460 2.230 3.85 1.07 31643 7860 4.0
Ura
cil R
t (m
in)
Tolu
ene
Rt (m
in)
Tolu
ene
k
Tolu
ene
As
Tolu
ene
Effic
ienc
y (N
)
Back
pres
sure
(psi
)
Plat
es/p
si
Featured Products
Particle Size ID LengthCat. No.
C18Cat. No.
F5Ascentis Express HPLC Columns2.0 µm 2.1 mm 2 cm 50805-U 50857-U2.0 µm 2.1 mm 3 cm 50809-U 50858-U2.0 µm 2.1 mm 5 cm 50811-U 50859-U2.0 µm 2.1 mm 7.5 cm 50812-U 50861-U2.0 µm 2.1 mm 10 cm 50813-U 50863-U2.0 µm 2.1 mm 15 cm 50814-U 50867-U2.0 µm 3.0 mm 3 cm 50815-U 50869-U2.0 µm 3.0 mm 5 cm 50816-U 50871-U2.0 µm 3.0 mm 7.5 cm 50817-U 50876-U2.0 µm 3.0 mm 10 cm 50819-U 50879-U2.0 µm 3.0 mm 15 cm 50821-U 50881-UAscentis Express Guard Cartridges, Package of 32.0 µm 2.1 mm 0.5 cm 50822-U 50884-U2.0 µm 3.0 mm 0.5 cm 50823-U 50886-U
Figure 8 illustrates the selectivity difference between Ascentis Express C18 and F5 columns using a steroid example. Hydrocortisone and prednisolone differ by only one double bond and have nearly identical solubility. Since the main difference between these rigid solutes is shape rather than solubility, C18 columns typically show poor selectivity because alkyl chains can readily change conformation to provide nearly equivalent amounts of solute interaction. For rigid isomers, the PFP column can provide additional selectivity because one isomer may approach the planar aromatic ring differently and interact more strongly. Aromatic phases, such as PFP, often show different, enhanced selectivity over C18 between closely-related, rigid compounds in any sample.
Ascentis Express F5
Ascentis Express C18
Conclusion• Fused-Core particles have revolutionized U/HPLC performance.
Ascentis Express 2.0 μm Fused-Core particles are designed to provide UHPLC performance for practical small molecule analysis.
• Ascentis Express column line now features three 90 Å Fused-Core particle sizes for high speed separation of small molecules.
• Ascentis Express 2.0, 2.7 and 5 µm Fused-Core columns represent the best selection of phases and geometries for every analytical application and instrument.
7Order: 800-325-3010 (U.S.) 814-359-3441 (Global)
(continued on next page)
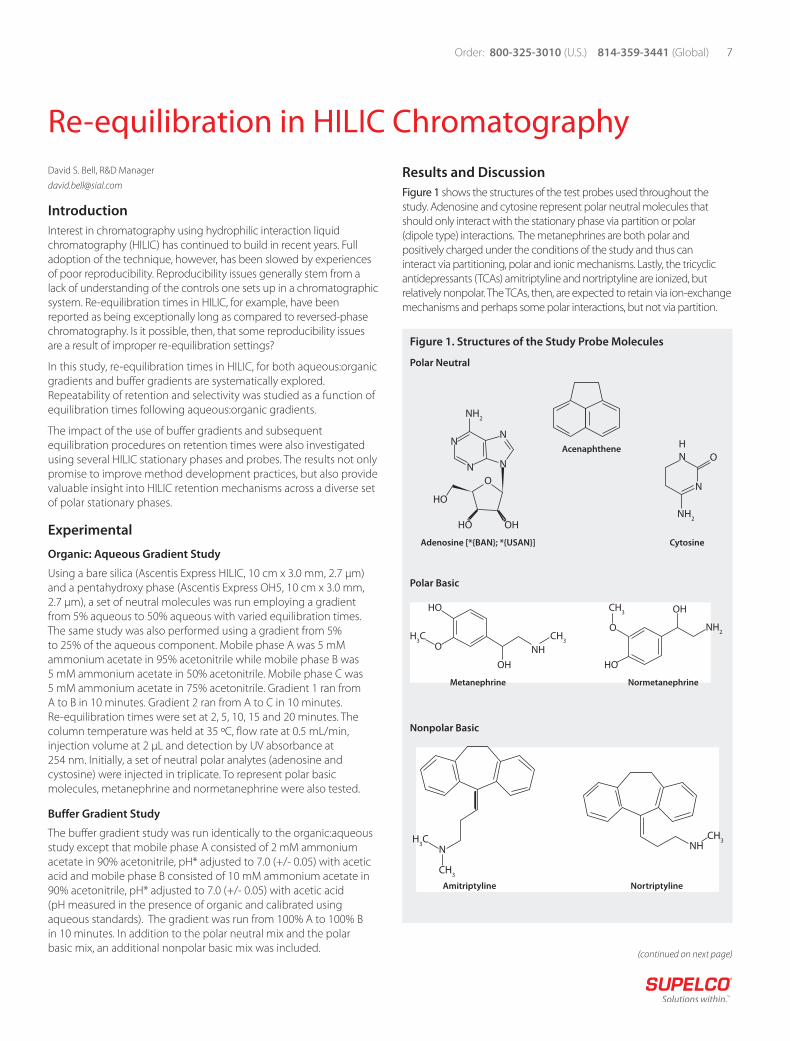
Figure 1. Structures of the Study Probe Molecules
Polar Neutral
NH2
NH2
HN
NAcenaphthene
Adenosine [*{BAN}; *{USAN}] Cytosine
N N
O
O
NHO
HO OH
N
Polar Basic
HO
OH
Metanephrine Normetanephrine
NH
O
HO
OH
OH3C CH3
NH2
CH3
Nonpolar Basic
H3C
CH3
N
Amitriptyline Nortriptyline
NHCH3
David S. Bell, R&D Manager
IntroductionInterest in chromatography using hydrophilic interaction liquid chromatography (HILIC) has continued to build in recent years. Full adoption of the technique, however, has been slowed by experiences of poor reproducibility. Reproducibility issues generally stem from a lack of understanding of the controls one sets up in a chromatographic system. Re-equilibration times in HILIC, for example, have been reported as being exceptionally long as compared to reversed-phase chromatography. Is it possible, then, that some reproducibility issues are a result of improper re-equilibration settings?
In this study, re-equilibration times in HILIC, for both aqueous:organic gradients and buffer gradients are systematically explored. Repeatability of retention and selectivity was studied as a function of equilibration times following aqueous:organic gradients.
The impact of the use of buffer gradients and subsequent equilibration procedures on retention times were also investigated using several HILIC stationary phases and probes. The results not only promise to improve method development practices, but also provide valuable insight into HILIC retention mechanisms across a diverse set of polar stationary phases.
Experimental
Organic: Aqueous Gradient Study
Using a bare silica (Ascentis Express HILIC, 10 cm x 3.0 mm, 2.7 µm) and a pentahydroxy phase (Ascentis Express OH5, 10 cm x 3.0 mm, 2.7 µm), a set of neutral molecules was run employing a gradient from 5% aqueous to 50% aqueous with varied equilibration times. The same study was also performed using a gradient from 5% to 25% of the aqueous component. Mobile phase A was 5 mM ammonium acetate in 95% acetonitrile while mobile phase B was 5 mM ammonium acetate in 50% acetonitrile. Mobile phase C was 5 mM ammonium acetate in 75% acetonitrile. Gradient 1 ran from A to B in 10 minutes. Gradient 2 ran from A to C in 10 minutes. Re-equilibration times were set at 2, 5, 10, 15 and 20 minutes. The column temperature was held at 35 ºC, flow rate at 0.5 mL/min, injection volume at 2 µL and detection by UV absorbance at 254 nm. Initially, a set of neutral polar analytes (adenosine and cystosine) were injected in triplicate. To represent polar basic molecules, metanephrine and normetanephrine were also tested.
Buffer Gradient Study
The buffer gradient study was run identically to the organic:aqueous study except that mobile phase A consisted of 2 mM ammonium acetate in 90% acetonitrile, pH* adjusted to 7.0 (+/- 0.05) with acetic acid and mobile phase B consisted of 10 mM ammonium acetate in 90% acetonitrile, pH* adjusted to 7.0 (+/- 0.05) with acetic acid (pH measured in the presence of organic and calibrated using aqueous standards). The gradient was run from 100% A to 100% B in 10 minutes. In addition to the polar neutral mix and the polar basic mix, an additional nonpolar basic mix was included.
Results and DiscussionFigure 1 shows the structures of the test probes used throughout the study. Adenosine and cytosine represent polar neutral molecules that should only interact with the stationary phase via partition or polar (dipole type) interactions. The metanephrines are both polar and positively charged under the conditions of the study and thus can interact via partitioning, polar and ionic mechanisms. Lastly, the tricyclic antidepressants (TCAs) amitriptyline and nortriptyline are ionized, but relatively nonpolar. The TCAs, then, are expected to retain via ion-exchange mechanisms and perhaps some polar interactions, but not via partition.
Re-equilibration in HILIC Chromatography

Reporter 32.2 |8 Pharmaceutical
sigma-aldrich.com/express
Plots of retention time versus organic-aqueous re-equilibration time are shown in Figure 2 for the neutral probes. For the steeper gradient (to 50% aqueous) there exists some slight irreproducibility at 2 minutes re-equilibration time; however, at 5 minutes and above, highly reproducible results are obtained. For the shallower gradient just two minutes appears to be sufficient to generate reproducible results. In both plots the retention drifts upwards as re-equilibration times increase; however, at each given time point, reproducible results are obtained.
Figure 3 shows the results from the polar basic probes using the steep gradient on the HILIC phase. Again the retention times are shown to be highly reproducible at a given re-equilibration time. In the case of the polar bases the retention drifts downward as a function of re-equilibration time. In addition, as shown in Figure 4, selectivity and peak shape for the polar bases are significantly impacted by the re-equilibration time on the bare silica phase.
Figure 2. Retention as a Function of Re-equilibration Time
2.00
2.50
3.00
3.50
4.00
4.50
5.00
5.50
6.00
0 5 10 15 20 25
Rete
ntio
n Ti
me
(min
.)
Re-equilibration Time (min.)
AdenosineCytosine
HILIC 5% to 50% Aqueous
2.00
2.50
3.00
3.50
4.00
4.50
5.00
5.50
6.00
0 5 10 15 20 25
Rete
ntio
n Ti
me
(min
.)
Re-equilibration Time (min.)
HILIC - Bases 5% to 50% Aqueous AdenosineCytosine
Figure 3. Retention as a Function of Re-equilibration Time
3.50
4.00
4.50
5.00
5.50
6.00
6.50
7.00
7.50
0 2 4 6 8 10 12
Rete
ntio
n Ti
me
(min
.)
Re-equilibration Time (min.)
NormetanephrineMetanephrine
HILIC - Bases 5% to 50% Aqueous
Figure 4. Chromatographic Traces of Polar Basic Analytes on HILIC Phase at Different Re-equilibration Times
0 2 4 6 8 10
Time (min)
2 Minutes
5 Minutes
10 Minutes
Time (min)
0 2 4 6 8 10
Time (min)
0 2 4 6 8 10

9Order: 800-325-3010 (U.S.) 814-359-3441 (Global)
The chromatographic traces obtained for the polar bases on the OH5 phase are shown in Figure 5. In this case, the re-equilibration times do not appear to significantly impact the retention, selectivity or peak shape.
In previous studies, the OH5 phase has shown less ion-exchange character as compared to bare silica HILIC phases.1 This observation coupled with the faster equilibration of the basic analytes suggests that ion-exchange mechanisms are the main cause of slow equilibration on the bare silica phase. To investigate this further buffer gradients were run on both phases and an additional set of nonpolar, basic probes was added.
Figures 6 and 7 show the plots of retention times versus buffer gradient re-equilibration times for each set of test probes on the bare silica and pentahydroxy phases, respectively. On both phases, the neutral polar molecules are barely affected. For both the polar and nonpolar bases, retention increases as re-equilibration time increased. The magnitude of the increase on the OH5 phase, however, is greatly attenuated as compared to the bare silica phase for both sets of basic compounds. It is also important to note that reproducibility at any given re-equilibration time on both phases was observed.
Figure 5. Chromatographic Traces of Nonpolar Basic Analytes on OH5 Phase at Different Re-equilibration Times
0 2 4 6 8 10
Time (min)
2 Minutes
5 Minutes
10 Minutes
Time (min)0 2 4 6 8 10
Time (min)0 2 4 6 8 10
Figure 6. Retention as a Function of Re-equilibration Time
0.0
0.5
1.0
1.5
2.0
2.5
3.0
3.5
4.0
0 5 10 15 20
Rete
ntio
n Ti
me
(min
)
Re-equilibration Time (min)
Bare Silica (HILIC) Phase
Re-equilibration Time (min)
Re-equilibration Time (min)
Adenosine Cytosine
0.0
2.0
4.0
6.0
8.0
10.0
12.0
0 5 10 15 20
Rete
ntio
n Ti
me
(min
)
Metanephrine Normetanephrine
0.0
1.0
2.0
3.0
4.0
5.0
6.0
0 5 10 15 20
Rete
ntio
n Ti
me
(min
)
Nortriptyline Amitriptyline
(continued on next page)

Reporter 32.2 |10 Pharmaceutical
sigma-aldrich.com/express
ConclusionsHILIC gradient methods are often run to levels of the aqueous component that is well outside the normal HILIC percentages. An initial assumption regarding reproducibility of gradient HILIC methods was that running gradients past the 70% acetonitrile level would have significant impact on the overall reproducibility. The present study shows that running to even 50% aqueous had only a small impact on reproducibility. Interestingly, when re-equilibration times were held constant, reproducible retention, selectivity and peak shapes were observed. Marked changes were, however, observed upon extending re-equilibration times, especially for basic analytes on the bare silica stationary phase. Each of the experiments suggests that the presence of ion-exchange mechanisms results in slower overall equilibration. The use of bonded HILIC phases such as the OH5 may provide additional control of retention times when ion-exchange is present.
During the development of reversed-phase methods it is often assumed that if one allows the system to equilibrate for an extensive amount of time, the results would be the same as if the system were allowed to equilibrate for “just enough” time. The results of this study show that a gradient method in HILIC mode may appear equilibrated by virtue of reproducible retention times, however with extended re-equilibration time, may change. Therefore, it is important that gradient HILIC methods specify the re-equilibration times in order to ensure reproducible and reliable results.
Featured Products
Description Cat. No.Ascentis Express HPLC ColumnsHILIC, 10 cm x 3.0 mm I.D., 2.7 µm particle size 53970-UOH5, 10 cm x 3.0 mm I.D., 2.7 µm particle size 53769-U
Figure 7. Retention as a Function of Re-equilibration Time
Rete
ntio
n Ti
me
(min
) Re
tent
ion
Tim
e (m
in)
Re-equilibration Time (min)
Re-equilibration Time (min)
Re-equilibration Time (min)
Pentahydroxy (OH5) PhaseAdenosine Cytosine
0.0
0.5
1.0
1.5
2.0
2.5
3.0
3.5
4.0
0 5 10 15 20
0.0
1.0
2.0
3.0
4.0
5.0
6.0
7.0
0 5 10 15 20
Metanephrine Normetanephrine
0.0
0.2
0.4
0.6
0.8
1.0
1.2
1.4
1.6
1.8
2.0
0 5 10 15 20
NortriptylineAmitriptyline
Rete
ntio
n Ti
me
(min
)
Reference1. Bell, D. HILIC Chromatography: Theory and Method Development Practices.
http://view6.workcast.net/register?pak=5061956691401502 (accessed Nov 2014)

11Order: 800-325-3010 (U.S.) 814-359-3441 (Global)
Robert F. Wallace, Product Specialist
IntroductionFlash chromatography is a type of preparative chromatography used for the rapid, crude purification of compounds of wide ranging polarity. It is often used on reaction mixtures where the target (synthesized) molecule must be separated from excess reagents and reaction by-products. The most common flash adsorbent is silica. While a majority of flash separations are still performed using hand-packed cartridges; pre-packed, disposable cartridges designed for use on semi-automated flash systems are a popular choice. A significant limitation to these systems is that the flash cartridges are not interchangeable, significantly decreasing the availability of alternative cartridges.
Capacity, Flow Rate Range, and DimensionSupel Flash cartridges are available in a variety of cartridge sizes to be used with multiple sample size and flow rates.
Table 1. Cartridge Specifications
Cartridge Size Sample Size Flow Rate
Dimension
(I.D. x Length mm)4 g 4-400 mg 15-20 16 x 100
12 g 12 mg-1.2 g 20-40 23 x 120
25 g 25 mg-2.5 g 25-50 25 x 140
40 g 40 mg-4 g 30-60 30 x 230
80 g 80 mg-8 g 40-80 37 x 230
120 g 0.12-12 g 60-120 40 x 260
240 g 0.24-24 g 70-180 65 x 200
330 g 0.33-33 g 80-180 65 x 265
Sample LoadingSample loading on flash cartridges can be challenging at times due to the wide range of sample types that can be encountered. There are multiple ways that a sample can be loaded onto a Supel Flash cartridge:
• Direct injection into the sample injector assembly mounted on top of the flash system (on-line).
• Direct syringe injection onto the cartridge (off-line).
• Using a solid sample cartridge prior to the primary cartridge (on-line).
ConclusionFor flash purification of organic compounds with sample loading up to 10% of packed mass, Supel Flash cartridges exhibit higher efficiency than standard flash cartridges. This combination of high quality silica and stringent packing methodologies results in cartridges with better separation capabilities, versatility, and reproducibility.
Featured Products
Description Pkg. Size Cat. No.Supel Flash Cartridge, 4 g, 40-60 μm silica 20 FCISI004Supel Flash Cartridge, 12 g, 40-60 μm silica 20 FCISI012Supel Flash Cartridge, 25 g, 40-60 μm silica 15 FCISI025Supel Flash Cartridge, 40 g, 40-60 μm silica 15 FCISI040Supel Flash Cartridge, 80 g, 40-60 μm silica 12 FCISI080Supel Flash Cartridge, 120 g, 40-60 μm silica 10 FCISI120Supel Flash Cartridge, 240 g, 40-60 μm silica 4 FCISI240Supel Flash Cartridge, 330 g, 40-60 μm silica 4 FCISI330
Flash Chromatography using Supel Flash Cartridges
Supel Flash CartridgesSupel™ Flash cartridges are pre-compressed, disposable flash columns containing 43-60 μm, 60 Å ultrapure silica designed to meet the most stringent flash purification requirements. Cartridge pre-compression reduces particle interstitial spacing to provide even mass transfer and balanced chemical interaction. Pre-compression provides higher efficiency resulting from sharper, more symmetric peaks with no fronting, doubling or overlapping. High yield and sample loading capacity can be achieved with no compound decomposition for consistent purification performance.
These cartridges utilize proprietary column packing technology. The column packing process results in a high-density, uniform bed ensuring the elimination of channeling and an overall efficiency improvement. Supel Flash cartridges are compatible with different flash chromatography systems. The cartridge is resistant to normal phase solvents when used under typical flash chromatography conditions and has a female luer lock inlet fitting and a male slip luer outlet fitting. This configuration makes Supel Flash cartridges compatible with ISCO’s CombiFlash™ Companion™, Retrieve™, and OptiX™ systems, along with the Analogix SimpliFlash™ and IntelliFlash™ systems.

Reporter 32.2 |12
sigma-aldrich.com/bioanalysis
Clinical/Bioanalytical
Sample Prep Method Development and Optimization for the LC/MS/MS Analysis of Steroid Hormones in Plasma Craig Aurand, Principal Scientist, Bioanalytical Research
HybridSPE®-Phospholipid plates provided excellent analyte recovery of these difficult compounds from plasma samples with subsequent LC/MS/MS analysis on Ascentis® Express Fused-Core® C18 columns. The extracts were free of endogenous phospholipids that can interfere with quantitation, decrease sample throughput and reduce column lifetime.
IntroductionThere is a growing trend toward converting some clinical methods from immunoassay to LC/MS/MS for a variety of reasons. LC/MS/MS improves assay specificity, is not limited by antibody availability, and allows multiplexed analyte assays to be conducted simultaneously. However, LC/MS/MS is not without its limitations, most notably interferences from endogenous sample matrix, which can result in seemingly random and arbitrary discrimination in analyte response, among other effects.1
Objectives of the StudyThe goal of this study was two-fold. First, to develop a simple LC/MS/MS method, including sample preparation using HybridSPE-Phospholipid plates, for the direct analysis of the steroid hormones progesterone, aldosterone, corticosterone, deoxycorticosterone, testosterone, and 17α-methyltestosterone from blood plasma. Second, to compare the background from sample matrix between the resultant sample prep method to standard protein precipitation.
Experimental
Chromatographic (LC/MS/MS) Conditions
The chemical structures of the steroid hormones are shown in Figure 1. Initial evaluation was conducted using a mixture of steroid hormones to establish chromatographic conditions on Ascentis Express C18 column. The gradient profile was extended so matrix monitoring could be conducted for the processed plasma samples.
HybridSPE-Phospholipid Operating Principles
HybridSPE-Phospholipid technology combines simple, standardized methodology of protein precipitation with the specificity of solid phase extraction for the simultaneous removal of proteins and phospholipids from biological samples. The technology is based on hybrid zirconia-silica particles for targeted isolation of phospholipids, while PTFE frit materials act as a depth filter for efficient removal of precipitated protein particles. The zirconia portion of the hybrid particle behaves as a Lewis acid (electron acceptor) which interacts strongly with Lewis bases (electron donors), like the phosphate moiety of phospholipids. This technology allows for highly selective phospholipid matrix removal while remaining non-selective towards a broad range of analytes.2
Sample Prep Method Development: Factors that Impact Analyte Recovery
Sample prep method development consisted of establishing recovery of standard compounds from the HybridSPE-Phospholipid 96-well plates, then transferring those conditions for use with spiked plasma samples. Method optimization consisted of evaluating several precipitation solvent systems. Once sufficient analyte recovery was established for the plasma samples, the final portion of the study was to compare the HybridSPE-Phospholipid technique with the commonly accepted protein precipitation for phospholipid matrix removal.
Figure 1. Steroid Hormones
O
CH3
H
H
OH
H
OO
OH
O
O
CH3OH
CH3
OH
H
H
H
O
O
CH3
C H3
OH
H
H H O
C H 3
C H 3O H
H
HH
O
O H
C H 3
C H 3C H 3
O
O
C H3
C H3
CH3
H
H
H
Aldosterone (Chelating) Corticosterone (Nonchelating)
Deoxycortisone (Nonchelating) Testosterone (Nonchelating)
17α-Methyltestosterone (Nonchelating)
Progesterone (Nonchelating)

13Order: 800-325-3010 (U.S.) 814-359-3441 (Global)
Recovery of Analytes from Standard Solution using HybridSPE-Phospholipid
Method development with the HybridSPE-Phospholipid 96-well plate began with establishing recovery of the six steroids from standard solutions. External standard calibration curves from 10 to 300 ng/mL of each compound in 1% (v/v) formic acid acetonitrile:water (3:1) were developed. A 300 µL aliquot of standard solution (50 ng/mL) was added to the HybridSPE-Phospholipid 96-well plate. Vacuum was applied for 4 minutes at 10” Hg. Samples were then analyzed directly.
Recovery of Analytes from Plasma using HybridSPE-Phospholipid
The primary solvent used with the HybridSPE-Phospholipid for precipitation of plasma samples is 1% (v/v) formic acid in acetonitrile. Used in a 3:1 ratio with the plasma sample, this solution effectively precipitates plasma proteins. Formic acid also disrupts binding of target analytes with proteins, providing increased sensitivity. However, with analytes with chelating properties, the use of 0.5% (w/v) citric acid in acetonitrile as the precipitation additive and in a preconditioning step greatly increases their recovery from the zirconia-silica particles.
Formic acid system: 1% (v/v) formic acid in acetonitrile:water (3:1)
Rat plasma stabilized with K2EDTA (Lampire Biological Laboratories, Pipersville PA) was spiked with the analytes from a standard solution. A 100 µL aliquot was added to the HybridSPE-Phospholipid plate followed by 300 µL of 1% formic acid acetonitrile precipitation solvent. The plate was agitated via vortex for 4 minutes, placed on vacuum manifold and subjected to 10” Hg vacuum for 4 minutes. The filtrate was collected and analyzed directly. The concentration of steroid hormones in the final sample work up was equivalent to 50 ng/mL. Recovery was based on interpolation of a standard curve of analytes in buffer.
Citric acid system: 0.5% (w/v) citric acid in acetonitrile, for chelating compounds
The citric acid procedure was the same as the formic acid procedure described above, except for these two steps: The precipitation solvent was 0.5% (w/v) citric acid in acetonitrile. The HybridSPE-Phospholipid plate was first preconditioned with 300 µL/well of 0.5% (w/v) citric acid in acetonitrile.
Monitoring Phospholipids from the Plasma Sample Matrix
Spiked plasma samples were precipitated using 0.5% citric acid acetonitrile and analyzed directly. Phospholipid monitoring was conducted using Q3 full scan along with precursor ion scan of 104 m/z. Gradient chromatographic conditions utilized for the assay enable elution of phospholipids under high organic conditions.
Results and DiscussionThe gradient elution of the six steroid hormones on the Ascentis Express C18 with LC/MS/MS detection is shown in Figure 2.
Analyte Recovery
Table1 presents the recovery data of the steroid compounds extracted by the HybridSPE-Phospholipid plates from a standard solution using the formic acid system, and from spiked plasma using the formic acid and citric acid systems. The table reports average observed concentration, standard deviation and coefficient of variation (% c.v.) of replicate samples (n=8). (continued on next page)
Table 1. Analyte Recovery from HybridSPE-Phospholipid Plates
Analytical conditions appear in Figure 2. Note higher recovery and reduced variability using the citric acid system
Figure 2. LC/MS/MS Analysis of Steroid Hormones column: Ascentis Express C18, 10 cm x 2.1 mm I.D., 2.7 µm particle size
(53823-U) mobile phase: (A) 5 mM ammonium formate, pH 4.0 with formic acid; (B)
methanol gradient: 60% B for 3 min, to 95% B in 5 min, held at 95% B for 2 min flow rate: 0.3 mL/min column temp: 50 °C pressure: 90 bar detector: ESI(+), MRM injection: 2 µL sample: 50 ng/mL of
each compound system: Shimadzu LC-30AD, LCMS8030
Min
0 2 4 6 8
1 2
3
45
6
1. Aldosterone 361.0/343.1 2. Corticosterone 347.6/109.0 3. 11-Deoxycorticosterone 331.1/109.0 4. Testosterone 289.0/109.0 5. 17α-Methyltestosterone 303.1/97.0 6. Progesterone 315.0/109.1
MRM Transition
AnalyteObserved
Concentration Std. Dev. (n=8) % cv.A. Standards (50 ng/mL) in 1% formic acid acetonitrileAldosterone 2.70 1.83 67.75Deoxycorticosterone 25.13 1.04 4.15Cortocosterone 14.76 2.46 16.65Progesterone 57.27 0.95 1.66Testosterone 59.23 1.16 1.9617α-Methyltestosterone 57.15 1.21 2.11B. Spiked plasma (50 ng/mL) extracted using formic acid systemAldosterone 1.87 0.83 44.39Deoxycorticosterone 54.58 1.10 2.02Cortocosterone 54.31 3.86 7.11Progesterone 54.09 0.99 1.83Testosterone 55.75 0.76 1.3617α-Methyltestosterone 54.30 0.93 1.71C. Spiked plasma (50 ng/mL) extracted using citric acid systemAldosterone 45.03 1.89 7.55Deoxycorticosterone 54.32 2.55 4.10Cortocosterone 56.23 3.91 5.47Progesterone 51.40 1.58 4.30Testosterone 51.66 1.28 3.6217α-Methyltestosterone 61.68 1.53 3.76

Reporter 32.2 |14 Clinical/Bioanalytical
sigma-aldrich.com/bioanalysis
Monitoring Coextracted Phospholipid Matrix
Figure 3 presents the matrix monitoring chromatograms for both the HybridSPE-Phospholipid technique and protein precipitation. Plasma samples processed using the HybridSPE-Phospholipid had no detectable matrix interference compared to the standard protein precipitation technique. Although the phospholipid matrix from the standard protein precipitation technique did not directly co-elute with the target analytes, this would still be a concern for fouling of the MS source. The phospholipid matrix would result in chromatographic carryover into the subsequent samples resulting in random interference and potential column failure.
SummaryThe 0.5% citric acid acetonitrile system on HybridSPE-Phospholipid plates gave excellent analyte recovery and high efficiency phospholipid removal from the plasma samples. This study shows that there are simple and effective approaches to take when faced with particularly difficult analytes. In the example presented here, initially poor recovery of chelating steroid compounds in the formic acid system was overcome using a citric acid system that eliminated chelation interactions. The method gave high recovery and low variability of all tested steroids from both standard solutions and spiked plasma samples. The citric acid system was also very effective in removal of endogenous phospholipids from the matrix. In conclusion, with slight modification of the generic protocol, HybridSPE-Phospholipid was shown to be effective at matrix reduction while providing excellent recovery of difficult, chelating analytes. HybridSPE-Phospholipid is a simple and effective LC/MS sample prep technique for reducing matrix effects in LC/MS analysis of biological samples.
References1. Aurand, C. Understanding, Visualizing, and Reducing the Impact of Phospholipid-Induced
Ion Suppression in LC-MS; Supelco Reporter 30.2: 10-12. http://www.sigmaaldrich.com/content/dam/sigma-aldrich/docs/Supelco/The_Reporter/1/T212002.pdf
2. HybridSPE-Phospholipid Technology Home Page. sigma-aldrich.com/hybridspe-pl (accessed February 11, 2014).
Featured Products
Description Cat. No.HPLC ColumnAscentis Express C18, 10 cm x 2.1 mm I.D., 2.7 µm particle size 53823-USample Prep Plates and AccessoriesHybridSPE-Phospholipid 96-Well Plates, bed wt. 50 mg, volume 2 mL
575656-U
HybridSPE-PLus Plate Essentials Kit (Includes HybridSPE-PLus 96-well plate (575659-U), one plate cap mat (as in 575680-U), one sealing film (Z721581) and one collection plate (Z717266)
52818-U
96 Round/Deep-Well Collection Plate, polypropylene Z71726696 Well-Plate Pre-cut Sealing Films, pk of 100 Z721581Supelco PlatePrep Vacuum Manifold 57192-UMobile Phase ComponentsWater LC/MS Ultra CHROMASOLV®, tested for UHPLC/MS 14263Acetonitrile LC/MS Ultra CHROMASOLV, tested for UHPLC/MS 14261Methanol LC/MS Ultra CHROMASOLV, tested for UHPLC/MS 14262Formic acid, eluent additive for LC/MS 56302Ammonium formate, LC/MS Ultra eluent additive 14266Cerilliant Certified Reference MaterialsAldosterone, 100 µg/mL in acetonitrile A-096Corticosterone, 1.0 mg/mL in methanol C-11711-Deoxycorticosterone, 100 µg/mL in methanol D-105Testosterone, 1.0 mg/mL in acetonitrile T-03717α-Methyltestosterone, 1.0 mg/mL in 1,2-dimethoxyethane M-906Progesterone, 1.0 mg/mL in acetonitrile P-069
Figure 3. Monitoring Coextracted Phospholipid Matrix column: Ascentis Express C18, 10 cm x 2.1 mm I.D., 2.7 µm particle size
(53823-U) mobile phase: (A) 5 mM ammonium formate, pH 4.0 with formic acid;
(B) methanol gradient: 60% B for 3 min, to 95% B in 5 min, held at 95% B for 2 min flow rate: 0.3 mL/min column temp: 50 °C pressure: 90 bar detector: ESI(+), MRM injection: 2 µL sample: 50 ng/mL of each compound system: Shimadzu LC-30AD, LCMS8030
0 2 4 8 10
Time (min)
6
Standard Protein Precipitation
HybridSPE-Phospholipid
In the formic acid system, with the standard solutions, poor recovery and high variability of aldosterone, corticosterone and deoxycorticosterone were observed. This is due to chelation of combined carbonyl/carboxylic acid site on these molecules with the zirconia-silica surface of the HybridSPE- Phospholipid particles. The structures of aldosterone and progesterone can be compared in Figure 1. Note the position of the carbonyl and hydroxyl groups that give aldosterone its chelation tendency. It was anticipated that analyte recoveries from the HybridSPE-Phospholipid would be higher when extracted from serum or plasma compared to standard solutions. This is because phospholipids are in high abundance in the plasma sample and they interact strongly with Lewis acid zirconia molecules on the HybridSPE-Phospholipid particles, thereby, masking these sites from sensitive analytes. Table 1B supports this premise; recovery and variability of corticosterone and deoxycorticosterone extracted from plasma were dramatically improved over extraction of aqueous standards. However, aldosterone recovery from plasma was still very poor in the formic acid system.
By replacing the formic acid with citric acid, the chelation phenomenon is overcome. Citric acid behaves as a chelating agent, and when utilized as an additive for the HybridSPE-Phospholipid it acts to tie up the zirconia surface. Preconditioning the plates with citric acid prevents the retention of chelating compounds, but does not impede the selective retention of the phospholipids. Table 1C shows that the use of citric acid as the precipitation additive along with the preconditions step greatly increases recovery and reproducibility of chelating compounds from the HybridSPE-Phospholipid particle.

15Order: 800-325-3010 (U.S.) 814-359-3441 (Global)
Aminoglycoside Analysis in Pork Muscle using Molecularly Imprinted Polymer Cleanup and LC/MS/MS DetectionEmily Barrey, Senior R&D Scientist and Olga Shimelis, Principal R&D Scientist
IntroductionAminoglycosides are a well-known class of antibiotics that are routinely monitored in animal-derived foods. Many countries have instituted regulatory limits for aminoglycosides. There is growing concern of the impact these microbial resistant compounds have on human health and development. A sensitive and robust analytical method is required in order to enforce the regulations and ensure the safety and quality of the food supply.
The focus of this study is the extraction and analysis of ten aminoglycosides from porcine tissues using molecular imprinted polymer (MIP) solid phase extraction with LC/MS/MS detection. The current USDA method does not reliably quantify levels of these analytes in porcine tissues.1 This study utilized the unique extraction capabilities of MIPs to successfully quantitate ten aminoglycosides by LC/MS/MS at 100 ng/g (400 ng/g for neomycin) with recoveries ≥70%.
Molecularly imprinted polymers (MIPs) are solid phase extraction phases that are prepared by polymerizing either preformed or self-assembled monomer template complexes together with a cross-linking monomer. After removal of the template molecule, a polymer with binding sites for the template is obtained. MIPs exhibit selective target recognition and can be described as artificial receptors. Selectivity is predetermined by the template for a particular analyte or group of analytes. Figure 1 illustrates a generalized synthesis and MIP interaction.
Experimental
Muscle Preparation
Locally obtained pork muscle was homogenized with a commercially purchased food processor. Samples (2 g) were weighed into 50 mL polypropylene centrifuge tubes.* Samples were fortified using a mixed aminoglycoside standard prepared at 10 µg/mL from 1 mg/mL individual stock solution standards. The stock solutions were prepared from neat materials obtained from Sigma-Aldrich®. Ten milliliters of the extraction solvent, 10 mM of potassium phosphate monobasic (KH2PO4) with 0.4 mM ethylenediaminetetraacetic acid (EDTA) and 2% trichloroacetic acid (TCA) were added, and samples shaken for 2 min. Samples were then centrifuged for 5 min. at 3200 rpm, and the supernatant was decanted into a clean 50 mL polypropylene centrifuge tube. An additional 10 mL of extraction solvent was added to the pork muscle sample, and the shaking and centrifuge steps were repeated. The supernatant was combined with the previous supernatant, and then 20 mL of 50 mM potassium phosphate in water (pH = 7.8) was added. The pH of the sample was adjusted to 7.5 with concentrated ammonium hydroxide.
MIP SPE Sample Cleanup
The SupelMIP® SPE-Aminoglycoside cartridge was conditioned with 1 mL of methanol followed by 1 mL of 50 mM potassium phosphate in water (pH = 7.8). Three milliliters of extracted pork sample were passed through the cartridge. The cartridge was then washed with 3 mL of water, dried on high vacuum for 2-3 min, washed with 1 mL of 60:40 water:acetonitrile (v/v) and dried with slight vacuum for 10 sec. The cartridge was finally washed with 1 mL of 50:50 dichloromethane:methanol (v/v) and dried with slight vacuum for 10 sec. Analytes were eluted with 1 mL of 1% formic acid containing 5 mM heptafluorobutyric acid (HFBA) in 80:20 acetonitrile:water (v/v).
Sample Analysis
Eluted samples were vortexed and transferred to 750 µL polypropylene HPLC vials. Analytical separation was performed using an Ascentis® Express C18, 10 cm x 2.1 mm I.D., 2.7 µm HPLC column. Figure 2 depicts chromatograms of the analytes in pork muscle extracts. Quantitation was performed using matrix matched calibration standards, ranging from concentrations of 10 ng/mL to 1000 ng/mL.
(continued on next page)
Polymerization around template
molecule
Removal of template molecule
Sample Introduction
Selective Interaction
Template
Figure 1. A Generalized Diagram of MIP Synthesis and Selective Analyte Interaction
* Because aminoglycosides can bind to untreated glass surfaces, polypropylene vessels were used throughout the procedure.

Reporter 32.2 |16
sigma-aldrich.com/supelmip
Food and Beverage Analysis
Figure 2. LC/MS/MS Analysis of Aminoglycosides after SupelMIP SPE Cleanup
column: Ascentis Express C18, 10 cm x 2.1 mm I.D., 2.7 µm (53823-U) mobile phase: (A) 5 mM HFBA in water; (B) 5 mM HFBA in acetonitrile gradient: 20 to 90% B in 3.0 min; held at 90% B for 1 min; 90 to 20%
B in 0.1 min; held at 20% B for 5.9 min flow rate: 0.4 mL/min column temp.: 40 °C detector: MS/MS, ESI(+), MRM injection: 10 µL
Analyte Precursor ProductGentamicin C1 478.1 157.2Streptomycin 582.1 263.2Neomycin 615.0 161.1Kanamycin 485.2 163.1Tobramycin 468.1 163.1Amikacin 586.2 163.1Hygromycin B 528.1 177.1Spectinomycin 351.1 333.1Dihydrostreptomycin 584.2 263.1Apramycin 540.2 217.1
1. Spectinomycin 2. Hygromycin B 3. Streptomycin 4. Dihydrostreptomycin 5. Amikacin 6. Kanamycin 7. Apramycin 8. Tobramycin 9. Gentamicin 10. Neomycin
0
200
400
600
800
1000
1200
1400
1600
0.5 1 1.5 2 2.5 3 3.5
12
3
4 5
6 7
89
10
(a) Matrix Matched Standard
0200400600800
1000120014001600
0.5 1 1.5 2 2.5 3 3.5
(b) Pork Muscle Blank
0200400600800
1000120014001600
0.5 1 1.5 2 2.5 3 3.5
12
3
4
5
6
78
9
10
(c) Pork Muscle Spiked with 100 ng/g of Aminoglycosides
Results and DiscussionRecoveries for the 10 aminoglycosides are given in Figure 3. Most of the analyte recoveries were ≥70%, except for neomycin and tobramycin. Low recoveries for neomycin and tobramycin may be attributed to insufficient elution of the analyte from the SPE material. Both of these analytes have a higher number of amino groups which could lead to stronger binding of the analyte to the MIP sorbent.
The use of the SupelMIP SPE-Aminoglycoside cartridge kept the analytes bound to the sorbent while a series of aggressive washes were applied to the sorbent to eliminate matrix interferences. The absence of matrix effects may be an indication of superior sample cleanup. The resulting matrix effects were evaluated by comparing solvent prepared standards to matrix-matched standards. The matrix factor was calculated for each analyte in Figure 4. Matrix factors close to 1.0 indicate little to no matrix influence on analyte detection. Values significantly greater than 1.0 suggest matrix enhancement on the analyte and values less than 1.0 are considered to be the result of matrix suppression. For these analytes, significant matrix enhancement was observed for neomycin and gentamicin with matrix factors greater than 2.
Figure 3. Aminoglycoside Recoveries in Pork Muscle Fortified at 100 ppb (400 ppb*)
0102030405060708090
100
% R
ecov
ery
Gentamicn
Strepto
mycin
Neomycin
Kanamycin
Tobramycin
Amikacin
Hygromycin
B
Spectinomycin
Dihydrostr
eptomycin
Apramycin

17Order: 800-325-3010 (U.S.) 814-359-3441 (Global)
ConclusionA simple and sensitive method for the cleanup, analysis and quantification of aminoglycosides in pork muscle has been developed using SupelMIP SPE-Aminoglycosides and LC/MS/MS analysis. This method was able to successfully obtain recoveries ≥70% for most analytes including amikacin; whereas, the current USDA method does not reliably confirm amikacin in porcine tissues.1 The unique features of the MIP material afforded the ability to wash additional matrix interferences off of the cartridge prior to eluting the analytes of interest.
Reference1. Confirmation of Aminoglycosides by HPLC-MS/MS (Revision 03). United States
Department of Agriculture Food Safety and Inspection Service, Office of Public Health Science www.fsis.usda.gov (accessed Jan 2014)
Featured Products
Description Cat. No.SupelMIP Aminoglycosides SPE Cartridge3 mL, 50 ea 52777-UAscentis Express C18 HPLC Column10 cm x 2.1 mm I.D., 2.7 µm particle size 53823-UAnalytical Standards and ReagentsDihydrostreptomycin sesquisulfate D7253Streptomycin S1277Tobramycin sulfate T1783Kanamycin K4000Amikacin A3650Gentamicin sulfate G1914Neomycin N1876Apramycin A2024Spectinomycin S2647Hygromycin B H3274
Related Products
Description Cat. No.Ascentis Express C18 HPLC Columns
10 cm x 2.1 mm I.D., 2.7 µm particle size 53823-U15 cm x 2.1 mm I.D., 2.7 µm particle size 53825-U
Figure 4. Matrix Factor for Aminoglycosides in Pork Muscle
0.00
0.50
1.00
1.50
2.00
2.50
Gentamicn
Strepto
mycin
Neomycin
Kanamycin
Tobramycin
Amikacin
Hygromycin
B
Spectinomycin
Dihydrostr
eptomycin
Apramycin
Mat
rix F
acto
r

Reporter 32.2 |18 Food and Beverage Analysis
sigma-aldrich.com/food
Improved Recoveries and Lower Background for the Analysis of PAHs in Olive Oil using a Novel SPE CartridgeKatherine K. Stenerson, Principal R&D Scientist
BackgroundPolynuclear aromatic hydrocarbons (PAHs) are a class of compounds found in the environment as a result of natural and man-made process, such as petroleum processing and incomplete combustion of fossil fuels. Some, such as benzo[a]pyrene, have been found to have carcinogenic properties in laboratory animals.1 PAHs can find their way into the human body through direct contact with contaminated surfaces, breathing contaminated air (such as cigarette smoke), and through some foods. Due to the lipophilic nature of PAHs, they can easily migrate into edible oils such as olive oil. Contamination of olives and/or olive-based products can occur during growing, harvesting, storage, and production, with routes of exposure suspected to be due to industrial process and possibly even automobile exhaust.2
Spain and Italy are the largest consumers of olive oil, followed by the United States.3 Olive oil is an essential part of the "Mediterranean Diet," which research has associated with a reduced risk of heart disease, cancer, Alzheimer's and Parkinson's diseases.4 Concern over exposure to these compounds has resulted in some countries within the European Union to set limits on PAH content in olive oil. In 2011, European Union Commission Regulation No. 835/2011 set a maximum limit for PAHs in various foodstuffs, including edible oils. The limits for oils and fats (excluding cocoa butter and coconut oil) are 2 ng/g of benzo[a]pyrene individually, and 10 ng/g combined of benzo[a]pyrene, benzo[b]fluoranthene, chrysene and benzo[a]anthracene.5
Analysis of PAHs in olive oil poses an analytical challenge due to the problem of separating the lipophilic PAHs from fatty matrix. Traditional methods of extraction and cleanup have involved liquid/liquid extraction followed by gel permeation chromatography (GPC), or normal phase SPE on large columns. While GPC provides a very good cleanup technique, it requires the use of special instrumentation and often adds an extra day to the sample preparation time. Extraction and cleanup using normal phase SPE often requires the use of large glass columns, which are expensive and require large volumes of solvent. In this study, a new approach for the extraction and cleanup of PAHs from olive oil was evaluated. The method developed uses Supelclean™ EZ-POP NP, a dual-layer SPE cartridge packed with Florisil® as the top sorbent bed, and a mixture of Z-Sep/C18 as the bottom bed. Florisil retains compounds with polar functionality, such as fatty acids. Z-Sep/C18 acts to retain fatty components by Lewis acid/base interaction (Z-Sep) and hydrophobic interaction (C18). In this way, lipids are preferentially retained, while the PAHs are eluted with acetonitrile. The resulting extract is then suitable for either HPLC/FLD or GC/MS analysis.
In this study, the EZ-POP NP was compared with a conventional silica gel SPE procedure for the extraction of PAHs from spiked olive oil.
Background, as detected by GC/MS analysis, as well as recoveries and reproducibility were compared between the two techniques for PAHs containing from 2-6 rings in their structures.
ExperimentalExtra-light olive oil was spiked at 20 ng/g with PAHs, and allowed to sit for several days prior to analysis. Replicate samples were extracted using EZ-POP NP SPE, and normal phase SPE on 5 g/20 mL silica gel cartridges from two different sources. The sample preparation procedures are listed in Table 1. Analysis was performed by GC/MS in selected ion mode (SIM) using the conditions listed in Figure 1. Conditions were optimized for response and peak shape of the PAHs, especially those with 5 and 6 rings. Quantitation was performed using a 5-point calibration curve prepared in unspiked olive oil extract.
(continued on next page)
Figure 1. GC/MS Analysis of Olive Oil Extracts, full scan (same y-scale) column: SLB®-5ms, 20 m x 0.18 mm I.D., 0.18 µm (28564-U) oven: 60 °C (1 min.), 15 °C/min. to 250 °C, 8 °C/min. to 330 °C (7 min.) inj. temp.: 300 °C MS interface: 330 °C MS source temp.: 250 °C MS quad. temp.: 200 °C injection: 1 µL, pulsed splitless (50 psi until 0.75 min, splitter open at
0.75 min.) carrier gas: helium, 1 mL/min constant flow liner: 4 mm ID FocusLiner™ with taper and quartz wool GC/MS: Agilent® 7890/5975, selected ion mode (SIM)
10 20 30
10 20 30
Min
10 20 30
Supelclean EZ-POP NP Cleanup
Competitor A Silica Gel SPE Cleanup
Competitor B Silica Gel SPE Cleanup

19Order: 800-325-3010 (U.S.) 814-359-3441 (Global)
Table 1. SPE Procedures
Silica Gel SPE, 5 g/20 mL EZ-POP NPCondition 20 mL of hexane (gravity) 10 mL of acetone (gravity),
followed by drying at -10 to -15" Hg for 10 min.
Load 1 mL of 5 g oil diluted to final volume of 10 mL in hexane
0.5 mL of oil, weighed directly onto cartridge
Wash 3 mL of hexane:methylene chloride (70:30)
None
Elute 8 mL of hexane:methylene chloride (70:30)
15 mL of acetonitrile, applied in 2 x 7.5 mL volumes
Flow Rate Gravity Approx. 1 drop / second (using vacuum)
Concentration Final volume = 1 mL, 40 °C under nitrogen
Final volume = 1 mL, 40 °C under nitrogen
Results and DiscussionOlive oil extracts were analyzed by GC/MS in full scan mode. Comparisons of the total ion chromatograms (TICs) generated from both extractions (same Y-scale) are presented in Figure 1. Much higher background was observed for both silica gel extracts compared to EZ-POP NP. During actual sample analysis, the late eluting background present in the silica gel extracts contaminated the GC/MS system, and required extensive bake out to remove. This heavy background also caused retention time shifts of the last 6 eluting PAH peaks, making identification difficult. In the case of brand B silica gel, the last internal standard, perylene-d12, could not be detected.
Recoveries and ReproducibilityA graphical representation of the average recoveries obtained with each extraction is presented in Figure 2. The error bars represent the reproducibility (as %RSD) for each n=3 data set. Overall, recoveries and reproducibilities were better using EZ-POP NP than silica gel. As noted previously, with the silica gel prepared extracts, specific matrix effect problems were encountered with the heavier PAHs. In addition, background made integration of the lighter PAHs difficult, which affected recovery values. Response of some PAHs in the silica gel extracts dropped as the sequence of runs progressed. This was probably due to contamination of the GC system. In comparison, the extracts prepared using EZ-POP NP did not exhibit these issues.
Detection of PAHs at Lower Levels Using a single quadrupole GC/MS system for detection of PAHs at the 2 ng/g level designated in EU Commission Regulation 835/2011 requires some modifications to the method described earlier. Specifically, it may be necessary to concentrate the samples to a lower final volume in order to increase the mass injected into the instrument. A second set of olive oil extracts was prepared using EZ-POP NP. This set was spiked at the EU limit of 2 ng/g with benzo[a]pyrene. The extraction was performed as described in Table 1, except the extract was concentrated to a final volume of 0.2 mL prior to the GC/MS analysis. Quantitation was done using a calibration curve prepared in unspiked olive oil extracts that were also concentrated to this lower final volume.
In addition, these minor changes were made to the GC run conditions to enhance response:
• Substitution of 2 mm I.D. FocusLiner with taper for the 4 mm I.D. liner
• Reduction of the injection volume from 1 µL to 0.5 µL
The smaller ID liner increased response of the heaviest PAHs, and reduction of the injection volume was necessary to ensure that the vapor cloud resulting from the acetonitrile injection did not exceed the liner's capacity.
The resulting recovery is summarized in Table 2. For comparison, the recovery obtained at 20 ng/g in the previous experiment is included. Recovery of benzo[a]pyrene at the lower spiking level was comparable to the 20 ng/g spikes. In addition, reproducibility was still acceptable, with an RSD value of 17%.
GC/MS Method RuggednessIn GC analysis, a loss of response can occur as a result of residue buildup in the inlet liner and column, and contamination of the detector. In order for the SPE method used to be acceptable, it must produce an extract that will not cause rapid fouling of the GC or detector. The cleanliness of the olive oil extract produced using EZ-POP NP was evaluated by repeated injections (98 total) of a 20 ng/g spiked extract into the GC/MS system. Absolute response of the PAHs was monitored. It was found that response for the PAHs was fairly stable (RSD <10%) up to 45 injections. After this point, response declined gradually. The total decrease in response after 98 injections was generally in the range of 20-30% (Figure 3); however, all PAHs were easily detected at the last injection. After completion of the testing sequence, the liner was removed from the GC system, and found to be free of visible residue (Figure 4).
ConclusionsThe combination of Florisil and Z-Sep/C18 mixture in the 2-bed EZ-POP NP SPE cartridge was able to extract a full range of PAHs (2-6 rings) from olive oil. For the PAHs studied, the recoveries and reproducibility obtained were better than normal phase SPE using silica gel, and the extract was substantially cleaner. Low level analysis was possible, as demonstrated with benzo[a]pyrene at the EU regulated level of 2 ng/g. The EZ-POP NP method contains minimal steps, uses less solvent than silica gel SPE, and produces a final extract in acetonitrile, which is amenable to either HPLC/FLD or GC/MS analysis. In the latter case, the cleanup is sufficient for analysis on single quadrupole MS instrumentation, without the need for MS/MS detection or hardware modifications to the GC system. Ruggedness testing with repeated injections of an olive oil extract did not prematurely foul the GC/MS system, with all PAHs still easily detected after 98 total runs.
(continued on next page)
Table 2. Recovery of Benzo[a]pyrene Spike from Spiked Olive Oil using EZ-POP NP with (%RSD)
2 ng/g Spike Level, n=4 20 ng/g Spike Level, n=3Benzo[a]pyrene 91 (17) 91 (20)

Figure 2. Recoveries and Reproducibility of PAHs Extracted from Olive Oil using Silica Gel and Supelclean EZ-POP NP SPE (n=3 for each data set). Spiking Level of 20 ng/g
0
20
40
60
80
100
120
140
160
180
200
% R
ecov
ery
Polycyclic Aromatic Hydrocarbons (PAHs)
Supelclean™ EZ-POP NP Competitor A Silica Gel Competitor B Silica Gel
Naphthalene
2-Meth
yl naphth
alene
1-Meth
yl naphth
alene
Biphenyl
2,6-Dim
ethyl n
aphthalene
Acenaphth
ylene
Acenaphth
ene
2,3,5-Trimeth
ylnaphthalene
Fluorene
Dibenzoth
iophene
Phenanthrene
Anthrace
ne
1-Meth
yl phenanth
rene
Fluoranthene
Pyrene
Retene
Benzo[a]anth
racene
Chrysene & Trip
henylene
Benzo[b] &
[j] �uoranthenes
Benzo[k]�uoranth
ene
Benzo[e]pyrene
Benzo[a]pyrene
Perylene
Indeno[1,2,3-cd]pyrene
Dibenzo[a,h]anth
racene
Benzo[g,h,i]p
erylene
Figure 3. Change in Absolute Response of PAHs in Olive Oil Extract Produced using the Supelclean EZ-POP NP after 98 Injections into GC/MS System
700000
600000
500000
400000
300000
200000
100000
Naphthalene
2-Meth
yl naphth
alene
1-Meth
yl naphth
alene
Biphenyl
2,6-Dim
ethyl n
aphthylene
Acenaphth
ylene
Acenaphth
ene
2,3,5-Trimeth
ylnaphthalene
Fluorene
Dibenzoth
iophene
Phenanthrene
Anthrace
ne
1-Meth
yl phenanth
rene
Fluoranthene
Pyrene
Retene
Benzo[a]anth
racene
Chrysene & Trip
henylene
Benzo[b] &
[j]�uoranth
ene
Benzo[k] �
uoranthene
Benzo[e]pyrene
Benzo[a]pyrene
Perylene
Indeno[1,2,3-cd]pyrene
Dibenzo[a,h]anth
racene
Benzo[g,h,i]p
erylene0
Start
End
Are
a Co
unts
sigma-aldrich.com/food
Reporter 32.2 |20 Food and Beverage Analysis

21Order: 800-325-3010 (U.S.) 814-359-3441 (Global)
References1. Polynuclear Aromatic Hydrocarbons, US EPA factsheet, January 2008, Office of
Solid Waste, Washington DC. (epa.gov/osw)
2. Moret, S.; Conte, L. Polycyclic aromatic hydrocarbons in edible fats and oils: occurrence and analytical methods. J. Chrom A. 2000, 882, 245-253.
3. Global Olive Oil Market: Trends & Opportunities (2012-2017). Researchand Markets brochure. www.researchandmarkets.com/reports/2399367.
4. "Mediterranean Diet: A Heart-Healthy Eating Plan". mayoclinic.org (accessed 1/13/2014).
5. EU Commission Regulation No 835/2011; Official Journal of the European Union: August 20, 2011 (215), 4-8.
6. More S.; Conte, L. A rapid method for polycyclic aromatic hydrocarbon determination in vegetable oils. J. Sep. Sci. 2002, 25, 96-100.
Figure 4. GC Inlet Liner after Ruggedness Testing with Olive Oil Extract Prepared using Supelclean EZ-POP NP
Featured Products
Description Cat. No.Supelclean SPE CartridgeEZ-POP NP, 12 mL, 20 ea 54341-USLB-5ms Capillary GC Column20 m x 0.18 mm I.D., 0.18 µm 28564-UAnalytical StandardsPolynuclear Aromatic Hydrocarbons Mix, TraceCERT® CRM – 2000 µg/mL each component in methylene chloride:benzene (1:1)
CRM48905
Naphthalene-d8 solution – 2000 µg/mL in methylene chloride
48715-U
Fluoranthene-d10 – 50 mg ampul 442843Perylene-d12 solution – 2000 µg/mL in methylene chloride 48081SolventAcetonitrile, LC-MS CHROMASOLV® 34967
Related Information
Visit our “Food & Beverage Analysis” web portal at: sigma-aldrich.com/food
Did you know . . .
Supelco/Sigma-Aldrich has a whole line of QuEChERS products for cleanup of fatty matrices.
To learn more, visit sigma-aldrich.com/zsep

Reporter 32.2 |22 Environmental
sigma-aldrich.com/spe
Determination of Triclosan in Environmental Waters using Polymeric SPE Cleanup and HPLC with Mass Spectrometric DetectionOlga Shimelis, Principal R&D Scientist; Michael Halpenny, R&D Technician; Ken Espenschied, R&D Technician; and Kristen Schultz, Air Sampling Product Manager
IntroductionTriclosan is a chemical that has been used as an antibacterial agent in many soaps and a variety of other consumer and personal care products for many years. Because of its widespread use and high production volume (exceeding 1 million pounds annually based on a 1998 U.S. EPA assessment), the US FDA is involved in “scientific and regulatory review of this ingredient”. In 2003-2004, the US Centers for Disease Control detected the chemical in the urine of 75% of people tested.2 Recent animal studies have shown that triclosan is a potential endocrine disruptor. With regard to the impact of triclosan on the environment, monitoring programs found the chemical in many tested streams, where it is introduced through the discharge of wastewater treatment plants.3 Triclosan was included in EPA Method 1694 developed for the measurement of pharmaceutical and personal care products by LC/MS/MS.4
In this study, triclosan was detected in the environmental samples of local water using Supel™-Select HLB polymeric SPE for cleanup and an Ascentis® Express C18 HPLC column for detection.
ExperimentalThe water samples were collected from the discharge of the local wastewater treatment plant. The samples were also collected from the creek about 400 yards below the discharge location.
The method was developed by adapting standard EPA method 1694 for analysis of triclosan and using Supel-Select HLB SPE cartridges. The modifications to method 1694 included introduction of an alternate elution solvent -- 1:1 acetonitrile:methanol. It was better suited for elution of the analyte from the HLB cartridge. The sample loading volume was reduced to 50 mL from 500 mL and the elution volume was reduced to 3 mL instead of 6 mL used in the standard method. The final methodology for detection of triclosan is presented in Figure 1.
Both UV and MS/MS detection methods were tested for the environmental water samples. Higher concentration of triclosan in the wastewater plant eluent enabled its detection by UV while lower concentration of triclosan in the stream required MS/MS detection for accurate quantitation. The HPLC method was developed using Ascentis Express C18 HPLC column. The Fused-Core® technology provided good resolution of triclosan peak from the background peaks in the samples, resulting in sharper peaks and lower limits of detections for triclosan. The Ascentis Express columns allowed the separation to be run at low backpressure using existing HPLC instruments (Agilent® 1200 and Agilent 1100 stacks were used).
ResultsFigure 2 shows the resulting UV chromatograms of water samples. Figure 3 shows the MS/MS chromatograms for the same water samples.
Figure 1. Sample Preparation Method for Analysis of Water Samples for Triclosan using Supel-Select HLB SPE 60 mg/3 mL (54182-U)
Collect environmental sample into amber glass container. Analyze within 7 days of collection or freeze.
Acidify 50 mL sample to pH 2 Analyze within 7 days of collection or freeze.
Condition SPE cartridge with 3 mL methanol, 3 mL of distilled water and 3 mL 0.01 M HCL.
Elute using 3 mL acetonitrile:methanol (1:1). Evaporate and constitute into mobile phase.
Load water sample at 5-10 mL/min. Wash with 10 mL distilled water, dry for 5 min under vacuum.
DiscussionLimit of detection for triclosan by UV method was estimated at 100 ng/L when using 50 mL loading water sample. EPA method 1694 specified the detection limit for triclosan as 94 ng/L using 500 mL loading SPE volume and MS/MS detection. The use of Ascentis Express column resulted in sharper peaks and allowed the low detection limit to be met using less sensitive UV detection technique.
The concentration of triclosan in the sample from wastewater plant was found to be high at about 1000 ng/L. This concentration was easily detectable by UV method. MS/MS method confirmed that the UV method provided correct concentration result.
In the samples taken 400 yards downstream, the triclosan levels were further diluted by the creek water, producing results that were below the detection limits for the UV method. The MS/MS methodology allowed the detection of triclosan in the creek below the discharge from wastewater treatment plant. The detection limit for triclosan by MS/MS method was estimated to be 50 ng/L when using 50 mL water sample.
Table 1. Results of Method Validation of Triclosan in Water (n=3)
Sample Conc. By UV RecoveryDistilled water, spiked at 4000 ng/L 3500 ng/L 88%
Creek water, spiked at 4000 ng/L 3300 ng/L 82%
Table 2. Results for Triclosan Identification in Environmental Waters (n=3)
SampleWater Conc. by UV (ng/L)
Water Conc. by MS-MS (ng/L)
Effluent from wastewater plant 943 (6%) 1100 (13%)
Creek water Below LOD 63 (9%)

23Order: 800-325-3010 (U.S.) 814-359-3441 (Global)
Figure 2. UV Chromatograms of Triclosan in Water at 280 nm column: Ascentis Express C18, 15 x 2.1 mm I.D., 2.7 µm (53825-U) mobile phase: 40% methanol, 40% acetonitrile, 20% potassium phosphate
tribasic, pH 2.5 flow rate: 0.150 mL/min temp 30 ˚C detector: UV 280 nm column pressure: 112 bar injector volume: 10.0 µL instrument: Agilent 1200 Series HPLC-UV
2a. Spiked Into Distilled Water at 5000 ng/L
5
4
3
2
1
00 1 2 3 4 5 6 7 8 9 10
Time (min)
mAU
2b. In the Wastewater Plant Eluent
5
4
3
2
1
00 1 2 3 4 5 6 7 8 9 10
Time (min)
mAU
Figure 3. LC/MS/MS Chromatograms of Triclosan in Water column: Ascentis Express C18, 15 cm x 2.1 mm I.D., 2.7 µm (53825-U) mobile phase: 40% methanol, 40% acetonitrile, 20% aqueous 0.1% formic acid flow rate: 0.150 mL/min column temp: 30 ˚C injection: 10.0 µL detector: Q1/Q3 286.8/35.0 ESI negative instrument: Agilent 1100/1200 HPLC and AB SCIEX QTRAP® 3200
3a. In Wastewater Plant Eluent
800
600400
Time (min)
MRM
286
.8/3
5.0
200
0 2 4 6 8 100
3b. In Creek Water
60
40
Time (min)
MRM
286
.8/3
5.0
20
0 2 4 6 8 100
-20
ConclusionsA method for detection of triclosan in environmental water samples was developed using Supel Select SPE cleanup and convenient 50 mL loading sample volume. A Fused-Core Ascentis Express C18 HPLC column allowed sharper peaks, lower detection limits with low backpressure and was used in existing HPLC systems. The triclosan was detected in the wastewater plant discharge by both UV and MS/MS methods at about 1000 ng/L. Triclosan was present in creek water at 63 ng/L and at this level required MS/MS detection.
Featured Products
Description Cat. No.Supel-Select HLB SPE Tube60 mg/3 mL 54182-UAscentis Express HPLC ColumnC18, 15 cm x 2.1 mm I.D., 2.7 μm particle size 53825-UAnalytical SolventsAcetonitrile, CHROMASOLV® Plus, for HPLC, ≥99.9% 34998Methanol, CHROMASOLV Plus, for HPLC, ≥99.9% 34860Acetonitrile, LC-MS Ultra CHROMASOLV 14261Methanol, LC-MS Ultra CHROMASOLV 14262Water with 0.1% formic acid, LC-MS CHROMASOLV 34673Analytical StandardTriclosan, 5 g 72779-5G-F
Related Products
Description Cat. No.Ascentis Express C18 HPLC Column10 cm x 2.1 mm I.D., 2.7 µm particle size 53823-UVialsCertified Vial Kit, Low Adsorption (LA), 2 mL, pk of 100 29652-U
References1. http://www.fda.gov/forconsumers/consumerupdates/ucm205999.htm
2. http://www.dailyfinance.com/2010/04/09/fda-epa-to-review-safety-of-common-antibacterial-ingredient/
3. http://www.epa.gov/oppsrrd1/REDs/factsheets/triclosan_fs.htm
4. US EPA Method 1694 “Pharmaceutical and personal care products in water, soil, sediment and biosolids by HPLC/MS/MS” http://water.epa.gov/scitech/methods /cwa/bioindicators/upload/2008_01_03_methods_method_1694.pdf
(continued on next page)

Reporter 32.2 |24 Environmental
sigma-aldrich.com/spme
Solid Phase Microextraction (SPME) Method for 4-Methyl-1-cyclohexanemethanol (MCHM) in WaterKatherine Stenerson, Principal Scientist
Introduction4-Methylcyclohexanemethanol (MCHM) is a chemical used in the coal cleaning process. On January 9, 2014 there was an accidental release of an estimated 100,000 gallons of a chemical mixture containing MCHM into the Elk River in West Virginia. According to the owners of the tank, the mix contained 88.5% MCHM, 7.3% PPH stripped basic, and 4.2% water. PPH stripped basic consists of a mixture of propylene glycol phenyl ether (PPH) and dipropylene glycol phenyl ether. Consequently, drinking water for the local community of Charleston became contaminated, with the MCHM imparting a “licorice-like” odor to it. The Center for Disease Control (CDC) has set advisory limits in drinking water of 1 ppm maximum for MCHM and 1.2 ppm for PPH. 1,2 Consequently, this initiated an immediate need for water testing. Since there was no established test method for MCHM, labs had to develop their own within a short amount of time. Solid phase microextraction (SPME) is a widely accepted technique for trace level determination of a variety of compounds in many different matrices. Method development can often be more rapid than other techniques such as solid phase extraction (SPE) and liquid-liquid extraction (LLE). In direct comparison to these techniques, it is easier to automate and requires fewer laboratory consumables such as solvents and SPE cartridges. In this application, a rapid extraction method for MCHM from drinking water and surface water was developed. The method, which was a headspace extraction, required a total time of 10 minutes, including equilibration and extraction. Combined with GC/MS-SIM analysis, detection of MCHM was achieved at low part per billion levels. This method was used to analyze samples of surface and tap water collected locally, as well as a sample of tap water from Charleston, WV which was collected several months after the spill incident. PPH was included in the SPME method; however, as will be shown, there were stability issues for this compound in the presence of chlorine.
ExperimentalThe SPME and GC/MS analysis conditions are summarized in Tables 1 and 2. Quantitation was done using an external standard 5-point calibration curve from 0.3 µg/L to 10 µg/L, prepared in deionized water and analyzed with each set of samples. MCHM elutes as two isomers. The relative ratio of the isomers (1:3) was determined by liquid injection of the standard into the GC/MS system. This ratio was used to calculate the amounts of each isomer in the calibration standards. Quantitation was then done separately for each MCHM isomer. Calibration was linear for both MCHM isomers and PPH, with r2 values of >0.995.
For quantitation of MCHM, m/z=110 was used. The most abundant ions in the MS spectrum of MCHM are m/z=55 and m/z=97 (Figure 1); however, there was an interference coeluting with isomer #1 detected in blank samples, which contained these two ions.
ResultsAccuracy and Reproducibility. A summary of the amounts measured in spiked local water samples are presented in Table 3. No MCHM or PPH were detected in the unspiked samples. Accuracy and reproducibility (indicated by %RSD values in parentheses) were very good, with the exception of PPH in the tap water sample. Since this compound was detected easily in the spiked private well and creek water samples, it is believed that the presence of chlorine in the tap water may have degraded the PPH.
A representative chromatogram obtained from the GC/MS-SIM analysis of the creek water is presented in Figure 2. The MCHM and PPH peaks were easily detectable above the sample background. The addition of salt to the samples prior to extraction was found to increase response by 10 times, and thus, is critical to achieving a low detection level. However, data generated during analysis of the
Table 1. SPME ConditionsFiber 100 µm PDMS (57301)Extraction Headspace, 5 min equilibration, 5 min extraction @ 50 °C,
agitation 250 rpmDesorption Process 270 °C, 2 min (splitter open at 0.75 min)Fiber Post Bake 5 min, 270 °CSample/Matrix 6 mL + 1.5 g NaCl (25%) in 10 mL headspace vial
Table 2. GC/MS ConditionsGC Column VOCOL, 20 m x 0.18 mm I.D., 1.0 µm (28463-U)Oven 50 °C (1 min), 15°C/min to 220 °C (5 min)Carrier Gas helium, 1 mL/minLiner 0.75 mm I.D. SPME linerMS Conditions aux at 220 °C, source at 230 °C, quads at 150 °C, SIM: m/z= 110
(quant), 97 for MCHM; m/z=94 (quant), 152 for PPH
Figure 1. MS spectra of MCHM
40 50 60 70 80 90 100 110 120 130 140 150 160 170
05000
10000150002000025000
30000350004000045000500005500060000
m/z-->
Abundance Scan 704 (7.772 min): 0324002.D\data.ms
55
97
81
68110
119 126 133 146154 169 177
9145
75
62
For determination of accuracy and reproducibility, samples of drinking water and surface water were collected locally, and spiked with MCHM and PPH at 1 µg/L. A method detection limit study was conducted using deionized water spiked at 1 µg/L.

25Order: 800-325-3010 (U.S.) 814-359-3441 (Global)
ConclusionSolid phase microextraction can be used to determine MCHM at low level from water. The detection level for the method described was calculated to be 0.08 µg/L for isomer #1 and 0.33 µg/L for isomer #2. The limits of quantitation were 0.25 and 1.0 µg/L, respectively, for the two isomers. Lower limits may be achievable with further optimization of the GC/MS instrument, allowing use of the more abundant ions in the spectrum of MCHM for detection and quantitation.
PPH appears to be unstable in the presence of chlorine, making reliable detection difficult. It could not be recovered from chlorinated tap water, or deionized water that had been treated with sodium chloride and allowed to sit for a prolonged time prior to analysis.
Featured Products
Description Qty. Cat. No.SPME Assembly 100 µm, PDMS FS 24GA Auto (RED) 3 57301VOCOL, 20 m x 0.18 mm I.D., 1.0 µm 1 28463-U
References1. http://www.cnn.com/2014/01/09/us/west-virginia-contaminated-water/index.htmlCNN.com2. http://emergency.cdc.gov/chemical/MCHM/westvirginia2014/index.asp3. 40 CFR Appendix B to Part 136. Definition and Procedure for the Determination of the
Method Detection Limit – Rev. 1.11
Figure 2. TIC of local creek water, spiked at 1 ppb; extracted using SPME
6 7 8 9 10 11 12 13 14 15 16 17 18
5000
10000
15000
20000
25000
30000
35000
40000
45000
Time-->
Abundance
TIC: 0404018.D\data.ms
1-ph
enox
y-2-
prop
anol
(PPH
)
MCH
M #
2M
CHM
#1
Figure 3. Peak corresponding to MCHM isomer #1 in municipal tap water collected in Charleston, WV. The peak was calculated to be above the method detection limit but below the limit of quantitation
7.5 7.6 7.7 7.8 7.9 8 8.1 8.2 8.3 8.4 8.5 8.6 8.7 8.8 8.9200
400
600
800
1000
1200
1400
1600
1800
Time-->
Abundance Ion 110.00 (109.70 to 110.70): 0501010.D\data.ms
7.475
7.556
7.604
7.741
7.792 7.987
8.054 8.109
8.168
8.212
8.278 8.300
8.352
8.433 8.474
8.595
8.672
8.742 8.879
8.949
MCH
M #
1
Table 3. Accuracy and Reproducibility Results Using SPME Method, n=4Local Private Well Water
Local Creek Water
Local Municipal Tap Water
Spiking L evel 1 µg/L* 1 µg/L* 1 µg/L*amt. measured MCHM isomer #1 0.27 (6) 0.30 (6) 0.25 (3)amt. measured MCHM isomer #2 0.84 (9) 0.91 (11) 0.84 (6)MCHM total (two isomers) 1.11 µg/L 1.21 µg/L 1.12 µg/Lamt. measured PPH 0.94 (1) 1.16 (6) ND
*total MCHM
Table 4. Results of Method Detection Limit (MDL) Study (n=7); spiking level 0.5 µg/L total MCHM
Mean Std. Dev MDL (µg/L) LOQ (µg/L)MCHM isomer #1 0.10 µg/L 0.03 0.08 0.25MCHM isomer #2 0.34 µg/L 0.11 0.33 1.0PPH Not determined
Table 5. Analysis Results of Charleston, WV Tap Water SampleWV Tap Water MS MSD LCS
Spiking Level unspiked 1 µg/L* 1 µg/L* 1 µg/L*MCHM isomer #1; average of n=3 0.09 µg/L (9) 0.29 0.28 0.20MCHM isomer #2 <0.33 µg/L 0.67 0.67 0.64PPH ND ND ND ND
*Spiking levels of individual MCHM isomers: MCHM #1–0.25 µg/L and MCHM #2–0.75 µg/L.
method detection limit samples indicates that it is detrimental to the determination of PPH if samples are prepared in advance of analysis.
Method Detection Limit Study. A set of 7 deionized water samples, spiked at 0.5 ug/L total MCHM, were analyzed and used to calculate a method detection limit (MDL). The method used for calculating MDL was as described by EPA in 40 CFR Part 136, Appendix B rev. The results of this study are summarized in Table 4. The MDL for MCHM was calculated to be 0.08 µg/L for isomer #1 and 0.33 µg/L for isomer #2. The limits of quantitation (LOQ) for each isomer were 0.25 and 1.0 µg/L, respectively. PPH results were low with regards to amount measured vs. spiked, and highly variable within the sample set, thus an MDL and LOQ could not be calculated. It is believed that the presence of the salt added for the SPME procedure generated chlorine over time, which resulted in decomposition of the PPH, similar to what was observed in the chlorinated tap water samples.
WV Tap Water Sample. A sample of tap water from Charleston, WV collected approximately 3 months after the spill was tested using the SPME method. Three replicates of sample were analyzed without spiking. Two additional samples were spiked at 1 µg/L of total MCHM and run as matrix spikes (MS/MSD). Spiked deionized water was also analyzed as a laboratory control standard (LCS). The MS/MSD and LCS showed good accuracy for determination of the
MCHM isomers at the spiking levels indicated (Table 5). There was no recovery of the PPH in the matrix spikes, confirming the findings of the effect of chlorination seen with the previous local tap water. A peak corresponding to MCHM isomer #1 was detected in the unspiked WV tap water samples (Figure 3); however, the level calculated was below the LOQ for the method. Isomer #2 was not detected above the MDL.

Reporter 32.2 |26
sigma-aldrich.com/cerilliant
Standards
Variables that Impact Immunosuppressant LC/MS/MS AnalysisExtracted from a paper by Josh Cooper, Beth Marek, Isil Dilek, Uma Sreenivasan; Cerilliant®
Maximilian Magana, Technical Marketing Specialist
Immunosuppressants such as everolimus, sirolimus, tacrolimus, and cyclosporin A are routinely used to prevent organ rejection in transplant patients. These drugs require clinical monitoring since they act within a narrow therapeutic range of concentrations and show large differences among individual patients in drug handling and efficacy.
With improved sensitivity and specificity compared to immunoassay methods, LC-MS/MS techniques have become a clinical laboratory’s method of choice to analyze immunosuppressant levels in patient whole-blood samples. Clinical analysis of immunosuppressant drug levels by LC-MS/MS can be difficult, because the whole-blood matrix requires extensive sample preparation. Additionally, the large size of immunosuppressant molecules makes obtaining reasonable peak shape chromatographically challenging.
LC-MS/MS method development revealed extensive sample-to-sample variability for multicomponent spiking solutions of everolimus, sirolimus, and tacrolimus. Several parameters such as sample preparation, MS interference, and surface interaction between compounds and the glass sample containers were investigated to determine the cause of the observed analytical variability.
An exhaustive investigation revealed that fill volume and to a lesser extent compound-to-compound interactions had contributed to the high sample-to-sample variability observed in the multi-component solutions. Special consideration should be applied during preparation and storage of spiking solutions used in the preparation of matrix calibrators, especially immunosuppressant solutions in low volumes and low concentrations.
These immunosuppressant standards are part of a large catalog of solution certified reference materials (CRMs) developed by Cerilliant to address the stringent and complex requirements of therapeutic drug monitoring and other clinical applications.
Cerilliant Quality
ISO GUIDE 34
ISO/IEC 17025
ISO 13485
ISO 9001
GMP/GLP
Featured Products
Cat. No. Description Package SizeA-094 Ascomycin 1.0 mg/mL in acetonitrile
C-093 Cyclosporin A 1.0 mg/mL in acetonitrile
C-104 Cyclosporin A 100 µg/mL in acetonitrile
C-108 Cyclosporin D 1.0 mg/mL in acetonitrile
E-068 Everolimus 1.0 mg/mL in acetonitrile
E-070 Everolimus-D4 100 µg/mL in acetonitrile
M-106 Mycophenolic acid 1.0 mg/mL in acetonitrile
M-135 Mycophenolic acid-β-D-glucuronide
1.0 mg/mL in acetonitrile
M-137 Mycophenolic acid-D3 100 µg/mL in acetonitrile
M-180 Mycophenolic acid-D3 1.0 mg/mL in acetonitrile
S-015 Sirolimus (Rapamycin) 1.0 mg/mL in acetonitrile
T-049 Tacrolimus 1.0 mg/mL in acetonitrile
A copy of the full paper including mass spectra can be obtained from: cerilliant.com/immuno.aspx
Cerilliant’s extensive catalog of certified reference standards can be viewed at sigma-aldrich.com/cerilliantTo receive notifications of newly developed reference standards, register at sigma-aldrich.com/registercerilliant

27Order: 800-325-3010 (U.S.) 814-359-3441 (Global)
Combating the Rise of New Designer Drugs: Improved GC/MS Derivatization Techniques For Analysis of Methylone, Ethylone, Butylone, Mephedrone and MethedroneExtracted from a paper by Ryan Carrell, Isil Dilek, Ning Chang, Uma Sreenivasan, Yunming Ying, Greg Kirkovits; Cerilliant
Jaspreet Kaur-Nandra
Cathinone-based stimulants emerged as a regulatory and social threat in the European Union, Asia, and US in late 2010. Marketed as “bath salts” at head shops and on the internet, these synthetic cathinones offer recreational highs that mimic the effects of illegal drugs such as cocaine, methamphetamine and LSD. Packaging labels list the compounds as “not for human consumption,” a tactic used to circumvent regulatory control and maintain legal status.
Drugs such as methylone, ethylone, mephedrone, butylone and other methcathinone analogues are commonplace and as they have increased in popularity, toxicologists require certified native and labeled reference materials to accurately identify and quantify the new compounds. There have been problems with use of deuterated internal standards of these drugs due to loss of label in the GC/MS fragmentation of the derivatized compound with PFPA and BSTFA such that an alternative method was required. By freeing the base with 0.1 M sodium bicarbonate and derivatizing with TFAA in controlled temperature conditions, the decomposition of the α-amino ketones was prevented. It also enables butylone and ethylone to be readily distinguished and retains the deuterium label in the fragment ions.
The synthesis of both native and deuterated cathiniones was developed for assays such as this.
These standards are part of a range of ready-to-use solution-based certified reference standards developed by Cerilliant that are packaged in a format that preserves concentration and integrity of the material. Time saving to the toxicologist, they provide a convenient, consistent and cost-effective alternative to the individual preparation of working reference standard solutions in the analytical lab.
Featured Products
Cat. No. Description Package SizeB-045 Butylone HCl 1.0 mg/mL (as free base) in MeOH
B-046 Butylone-D3 HCl 100 µg/mL (as free base) in MeOH
E-071 Ethylone HCl 1.0 mg/mL (as free base) in MeOH
E-072 Ethylone- D5 HCl 100 µg/mL (as free base) in MeOH
M-138 Mephedrone HCl 1.0 mg/mL (as free base) in MeOH
M-139 Mephedrone-D3 HCl 100 µg/mL (as free base) in MeOH
M-140 Methylone HCl, 1.0 mg/mL (as free base) in MeOH
M-141 Methylone-D3 HCl 100 µg/mL (as free base) in MeOH
M-147 Methedrone HCl 1.0 mg/mL (as free base) in MeOH
These CRMs are just a small part of a range of solution standards for forensic and toxicology applications that is continually being updated.
To receive notifications of newly developed standards, register at sigma-aldrich.com/registercerilliant
The current range can also be viewed on sigma-aldrich.com/cerilliantA copy of the full paper including mass spectra can be obtained from sigma-aldrich.com/cerilliant. Previously presented at the Society of Forensic Toxicologists (SOFT)/The International Association of Forensic Toxicologists (TIAFT), San Francisco, CA, September 2011.

Reporter 32.2 |28
sigma-aldrich.com/silylation
Reagents
New Silylation Reagents for GC DerivatizationSilyl methallylsulfinates (SILMAS) – powerful silylation agents generating only volatile by-products
Daniel Weibel, Product Manager
Derivatization of analytes by silylation is a useful technique for chromatographic analysis in order to increase volatility, improve both selectivity and stability, and to enhance detectability.1
Many classical and commonly used silylation reagents require the presence of a stoichiometric amount of base (tertiary amines) or are activated through addition of a catalyst. Frequently, the reaction mixture is heated to an elevated temperature, thus posing a risk of decomposition of sensitive analyte. In addition, non-volatile by-products or salts formed during silylation, or excess reagent or catalyst often have to be tediously removed from the analyte solution prior to injection into a gas chromatograph. These issues can be conveniently overcome using the Fluka’s new class of trialkylsilyl methallylsulfinates (SILMAS) reagents (Figure 1).2 They readily react with functionalized aliphatic, homoallylic, benzylic, phenolic, acidic and sterically hindered hydroxyl groups (Figure 2).
H3C
CH2S
O
O
Si CH3
CH3
CH3
H3C
CH2
SO
O
Si
CH3
CH3H3C
H 3C
CH2
SO
O
Si t-B u
CH3
CH3
SILMAS-TMSCat. No. 79271
SILMAS-TESCat. No. 79264
SILMAS-TBSCat. No.
79262
With SILMAS, neither base nor catalyst is needed. At room temperature, the reaction proceeds within minutes in common solvents, such as dichloromethane, chloroform, acetonitrile or tetrahydrofuran, leading to complete silylation. The reaction is accompanied by fast evolution of SO2 gas and isobutylene as by-products, both being fully volatile, and thus reducing sample preparation to simple solvent evaporation (Figure 3).
References1. Handbook of Analytical Derivatization Reactions, D. R. Knapp, Wiley, 1979.
2. Huang, X.; Craita, C.; Awad, L.; Vogel, P. Chem. Commun. 2005, 1297–1299.
Featured Products
Description Qty. Cat. No.Trimethylsilyl methallylsulfinate 1 mL, 5 mL, 10 x 1 mL 79271Triethylsilyl methallylsulfinate 1 mL, 5 mL, 10 x 1 mL 79264Tert-Butyldimethylsilyl methallylsulfinate
1 mL, 5 mL, 10 x 1 mL 79262
Figure 1. SILMAS – Silylation Reagents
Figure 3. SILMAS Reaction with Alcohols Producing the Desired Silyl Ether and Gaseous Volatile By-Products
Figure 2. Variety of Silylated Hydroxy Compounds with SiR3 Being Either Trimethylsilyl (TMS), Triethylsilyl (TES) or tert-Butyldimethylsilyl (TBS)

29Order: 800-325-3010 (U.S.) 814-359-3441 (Global)
Supelco SLB-IL60 Ionic Liquid GC Columns: Unique SelectivityLeonard M. Sidisky, R&D Manager; Katherine K. Stenerson, Principal Scientist; and Michael D. Buchanan, Product Manager
The SLB®-IL60 gas chromatography (GC) column is based on the ionic liquid stationary phase platform, and displays desirable features that existing non-ionic liquid columns do
not. This is the first of several Reporter articles which explore various aspects of this column.
The SLB-IL60 column is able to undergo the same analyte-phase interactions as polyethylene glycol (PEG) columns, but at different relative amounts. Based on its unique phase structure, the SLB-IL60 column is also able to undergo additional interactions that PEG columns cannot.
• With PEG columns, possible interactions appear to be dispersive, hydrogen bonding, and acid-base interactions
• With the SLB-IL60 column, possible interactions appear to be dispersive, dipole-dipole, dipole-induced dipole, π-π, hydrogen bonding, and acid-base interactions
As such, the SLB-IL60 column will retain some polar and polarizable analytes relatively longer, and some non-polar analytes relatively less. This results in unique and alternate selectivity compared to PEG columns.
The SLB-IL60 column was compared directly to five popular commercially available PEG columns, each from a different manufacturer. All columns were 30 m x 0.25 mm I.D., 0.25 µm dimensions, except the SLB-IL60 column, which has a 0.20 µm film thickness. Table 1 shows the maximum temperature limits for all columns tested. Complete specifications of SLB-IL60 columns are shown in Table 2.
Esters and EthersA 12-component esters and ethers mix was analyzed on each column under identical conditions. All five PEG columns produced almost identical chromatography. Figure 1 shows chromatograms obtained from the PEG 1 and SLB-IL60 columns. Observations are that the SLB-IL60 column provides:
• Resolution of ethyl formate (peak 2) and methyl acetate (peak 3)
• Longer relative retention of isopropyl acetate (peak 6)
• Longer relative retention of isobutyl acetate (peak 8) and shorter relative retention of 1,4-dioxane (peak 9), resulting in an elution order change
• Resolution of a contaminant peak (peak c), suspected to be 2-methylbutyl acetate, from isoamyl acetate (peak 11)
Table 1. Maximum Temperature Limits*
Column Isothermal ProgrammedPEG 1 280 °C 280 °C
PEG 2 260 °C 270 °C
PEG 3 250 °C 260 °C
PEG 4 250 °C 260 °C
PEG 5 280 °C 300 °C
SLB-IL60 300 °C 300 °C* Obtained from paperwork included with commercial columns.
Table 2. SLB-IL60 Column Specifications
Application Modified (deactivated) version of SLB-IL59 provides better inertness. Selectivity more polar than PEG/wax phases, resulting in unique elution patterns. Higher maximum temperature than PEG/wax columns (300 °C compared to 270-280 °C). Excellent alternative to existing PEG/wax columns. Also a good GCxGC column choice.
USP Code None
Phase Non-bonded; 1,12-Di(tripropylphosphonium)dodecane bis(trifluoromethylsulfonyl)imide
Temp. Limits 35 °C to 300 °C (isothermal or programmed)
Figure 1. Esters and Ethers
columns: PEG 1, 30 m x 0.25 mm I.D., 0.25 µm SLB-IL60, 30 m x 0.25 mm I.D., 0.20 µm (29505-U) oven: 40 °C (4 min), 8 °C/min to 200 °C (5 min) inj. temp.: 250 °C carrier gas: helium, 30 cm/sec detector: FID, 250 °C injection: 1 µL, 100:1 split liner: 4 mm I.D., split/splitless type, single taper wool packed
FocusLiner™ design sample: 12-component esters and ethers mix, each analyte at 0.2 % (v/v)
in pentane
2
1
1
2, 3
2
4
567 8
9
1011
12
4 6 8 10
Time (min)
2 4 6 8 10
Time (min)
PEG 1
3
4
56 7
9
810 11
c
SLB-IL60
12
7. n-Propyl acetate8. Isobutyl acetate9. 1,4-Dioxane
10. n-Butyl acetate11. Isoamyl acetate12. n-Amyl acetate
c: Contaminant (2-Methylbutyl acetate)
1. Methyl formate2. Ethyl formate3. Methyl acetate4. Tetrahydrofuran5. Ethyl acetate6. Isopropyl acetate
(continued on next page)

Reporter 32.2 |30
sigma-aldrich.com/il-gc
Research and Technology
Figure 2. Chlorinated Solvents columns: PEG 2, 30 m x 0.25 mm I.D., 0.25 µm SLB-IL60, 30 m x 0.25 mm I.D., 0.20 µm (29505-U) oven: 40 °C (4 min), 8 °C/min to 200 °C (5 min) inj. temp.: 250 °C carrier gas: helium, 30 cm/sec detector: FID, 250 °C injection: 1 µL, 100:1 split liner: 4 mm I.D., split/splitless type, single taper wool packed
FocusLiner™ design sample: 12-component chlorinated solvent mix, each analyte at
0.2 % (v/v) in pentane
2
1
4 6 8 10 12 14 16
Time (min)
2 4 6 8 10 12 14 16
Time (min)
2
3
3,4
5
6
7
9
8 10 11 12
65
9
7 108
5
3
4
1112
4
SLB-IL60
PEG 2
12
7. Trichloroethylene8. Tetrachloroethene9. Chloroform
10. 1,2-Dichloroethane11. 1,1,1,2-Tetrachloroethane12. 1,1,2,2-Tetrachloroethane
1. 1,1-Dichloroethylene2. trans-1,2-Dichloroethylene3. Carbon tetrachloride4. 1,1,1-Trichloroethane5. 1,1-Dichloroethane6. Methylene chloride
Chlorinated HydrocarbonsA 12-component chlorinated hydrocarbon mix was analyzed on each column under identical conditions. All five PEG columns produced very similar chromatography, with the PEG 2 column producing the best overall resolution. Several PEG columns were unable to provide resolution of tetrachloroethene (peak 8) and chloroform (peak 9). Figure 2 shows chromatograms obtained from the PEG 2 and SLB-IL60 columns. Observations are that the SLB-IL60 column provides:
• Significantly less retention (11 minutes compared to 16 minutes)
• Many elution order differences (peaks 3-10)
• Resolution of carbon tetrachloride (peak 3) and 1,1,1-trichloroethane (peak 4)
Fatty Acid Methyl Esters (FAMEs)A 38-component FAME mix was analyzed on each column under identical conditions. All five PEG columns produced very similar chromatography, with the PEG 3 column producing the best overall resolution. Figure 3 shows chromatograms obtained from the PEG 3 and SLB-IL60 columns. Observations are that the SLB-IL60 column provides:
• An overall faster elution (36 minutes compared to 52 minutes)
• Resolution of C18:1n9c (peak 17) and C18:1n9t (peak 18)
• Elution of trans isomers (peaks 18 and 20) before cis isomers (peaks 17 and 19)
• Less relative retention of C20:3n3 (peak 28) resulting in an elution order change
• Elution of C22:6n3 (peak 37) before C22:5n3 (peak 35)
ConclusionColumns based on polyethylene glycol phase chemistry are widely used for a variety of applications (such as solvents and FAMEs). However, modification of PEG phase chemistry to affect selectivity is very limited. The SLB-IL60 column is able to undergo many of the same analyte-phase interactions as PEG columns, plus some additional interactions. This results in the SLB-IL60 column being similar enough to PEG columns to make it useful for many of the same applications, but different enough to impart unique selectivity which can be leveraged to change elution patterns and/or improve resolution.
Featured Products
Description Cat. No.SLB-IL60 GC Columns15 m x 0.10 mm I.D., 0.08 µm 29503-U20 m x 0.18 mm I.D., 0.14 µm 29504-U30 m x 0.25 mm I.D., 0.20 µm 29505-U60 m x 0.25 mm I.D., 0.20 µm 29506-U30 m x 0.32 mm I.D., 0.26 µm 29508-U60 m x 0.32 mm I.D., 0.26 µm 29509-U
Related Information
For more information on the SLB-IL60 and other ionic liquid columns, visit sigma-aldrich.com/il-gc

31Order: 800-325-3010 (U.S.) 814-359-3441 (Global)
30. C20:5n3 31. C22:0 32. C22:1n9 33. C22:2 34. C23:0 35. C22:5n3 36. C24:0 37. C22:6n3 38. C24:1n9
10
1
23 4
5
8
6
7
12
119
15
16
1413
2120 19
23
22 26252429
28
27
31
3032 33 34
35
36
3738
36 min
10 20 30
Min
18
17
10
1
23 4
5
8
6
7
12
119
15
16
1413
2120 19
23
22 26252429
28
27
31
3032 33 34
35
36
3738
36 min
10 20 30
Min
18
17
SLB-IL60
10
1
2
34
5
10 20 30 40 50
Min
8
6
7
12
119
15
16
1413
17,18
212019
23
22 262524 29282731
30 32 33 3435
36
3738
52 min
10
1
2
34
5
10 20 30 40 50
Min
8
6
7
12
119
15
16
1413
17,18
212019
23
22 262524 29282731
30 32 33 3435
36
3738
52 min
PEG 3
21. C18:3n6 22. C18:3n3 23. C20:0 24. C20:1n9 25. C20:2 26. C20:3n6 27. C21:0 28. C20:3n3 29. C20:4n6
1. C4:0 2. C6:0 3. C8:0 4. C10:0 5. C11:0 6. C12:0 7. C13:0 8. C14:0 9. C14:1 10. C15:0
11. C15:1 12. C16:0 13. C16:1 14. C17:0 15. C17:1 16. C18:0 17. C18:1n9c 18. C18:1n9t 19. C18:2n6c 20. C18:2n6t
Figure 3. FAMEs columns: PEG 3, 30 m x 0.25 mm I.D., 0.25 µm SLB-IL60, 30 m x 0.25 mm I.D., 0.20 µm (29505-U) oven: 170 °C, 1 °C/min to 225 °C inj. temp.: 250 °C carrier gas: helium, 1.2 mL/min det.: FID, 260 °C injection: 1 µL, 100:1 split liner: 4 mm I.D., split/splitless type, single taper wool packed FocusLiner™ design sample: Supelco 37-Component FAME Mix (CRM47885) + C22:5n3, in methylene chloride

QZI 12145/ T214002
1094
Solutions within means digging deep to find the right solution, and never sacrificing on quality. Whether in-stock or highly customized, proprietary or ordinary, our products reflect consistent, leading-edge Supelco performance and technical expertise.
To learn more, visitsigma-aldrich.com/analytical
Explore the solutions within.Discover complete application solutions for unique separation challenges.
©2014 Sigma-Aldrich Co. LLC. All rights reserved. SIGMA-ALDRICH and SUPELCO are trademarks of Sigma-Aldrich Co. LLC, registered in the US and other countries. FLUKA is a trademark of Sigma-Aldrich GmbH, registered in the US and other countries. Ascentis, SLB, TraceCERT, HybridSPE, SupelMIP and CHROMASOLV are registered trademarks of Sigma-Aldrich Co. LLC. Supel, Iso-Disc and Supelclean are trademarks of Sigma-Aldrich Co LLC. IKA is a registered trademark of IKA-Werke GmbH & Co. KG. Fused-Core is a registered trademark of Advanced Materials Technology, Inc. Agilent is a registered trademark of Agilent Technologies Inc. Florisil is a registered trademark of U.S. Silica Company. FocusLiner is a trademark of SGE Analytical Science Pty Ltd. CombiFlash, Companion, OptiX and Retrieve are trademarks of Teledyne Isco. IntelliFlash and SimpliFlash are trademarks of Varian Instruments (Analogix). Sigma-Aldrich, Sigma, Aldrich, Supelco and Fluka brand products are sold by Sigma-Aldrich, Inc. Purchaser must determine the suitability of the product(s) for their particular use. Additional terms and conditions may apply. Please see product information on the Sigma-Aldrich website at www.sigmaaldrich.com and/or on the reverse side of the invoice or packing slip.


![Agilent A-Line UHPLC Fittingskromat.hu/UserFiles/files/fogyo/Agilent A-line fittings applikáció.pdfanalysis, especially with modern UHPLC and Fast LC columns [1-2]. Fitting connection](https://static.fdocuments.in/doc/165x107/60160cf3e429bf736779c6fa/agilent-a-line-uhplc-a-line-fittings-applikcipdf-analysis-especially-with.jpg)