Development and Operation of a Nano UHPLC-ESI-MS ….pdf · Development and Operation of a Nano...
1
Development and Operation of a Nano UHPLC-ESI-MS Vented Column Setup with 25 µm ID Columns for Improved Sensitivity Rieux L. 1 , De Pra M. 1 , Köcher T. 2 , Pichler P. 2 , Mechtler K. 2 , Swart R. 1 , Decrop W. 1 1 Thermo Fisher Scientific, Amsterdam, The Netherlands; 2 Research Institute of Molecular Pathology, Vienna, Austria FIGURE 7. Relation between chromatographic peak capacity and number of identified peptides (top) and proteins (bottom) using a 25 μm ID column. Sample: 100 ng HeLa lysate. Conclusion We showcased an user-friendly nano LC operating very reliably at flow rates of 20 nl/min. High performance 25 μm ID columns packed with 2 µm C18 stationary phase were developed and tested. The UltiMate 3000 RSLCnano was configured to efficiently deliver flow between 20 and 50 nL/min without splitting. Peak widths at flow rates 20 nl/min are comparable to regular nanoLCs (operated at ~ 250 nl/min) RSD of retention times of less than 0.2% over three months of operation were observed. Coupling to MS with ESI emitters with 10 µm ID and tip opening 5 µm showed the expected dependence of electrospray ionization on the flow rate. Up to 25000 peptides were identified in a single nano LC-MS run. References 1. Shen, Y.; Zhao, R.; Berger, S.J.; Anderson, G.A.; Rodriguez, N.; Smith, R.D. Anal. Chem. 2002, 74, 4235-4249. 2. Kocher, T.; Swart, R.; Mechtler, K. Anal. Chem. 2011, 83, 2699-2704. Acknowledgements We would like to thank Johannes Fuchs and Gabriela Krssakova from Karl Mechtler‘s lab at the Institute of Molecular Pathology in Vienna, Austria. Overview Purpose: An easier and robust solution to nano LC-ESI-MS at ultra-low flow rates is demonstrated. Methods: 25 μm ID columns were operated with a splitless pump at flow rates lower than any existing commercial system. Results: Performance of the column and UHPLC system are excellent. Preliminary data on MS sensitivity are shown. Introduction Increased sensitivity in nano LC-ESI-MS is generally achieved by decreasing the inner diameter (ID) of the column, resulting in higher peak concentration and more ions detected with mass spectrometry. Consequently, more peptides can be successfully sequenced and thereby improve protein identification. The number of peptides detected in complex samples can increase by more than a factor of 100 just by decreasing the column diameter from 75 µm to 30 µm ID 1 . With the reduction in column ID, the gradient flow delivered by the pump needs to be scaled down accordingly. For columns of 30 µm ID (or less), the required flow rates falls well below those of most commercially available nano-LC pumps. This was traditionally achieved by implementing a custom-made flow splitter in commercial systems. In the present study, we used a splitless pump tailored to the flow requirements of peptide analysis using 25 µm ID columns. Methods Liquid Chromatography •nano UHPLC: Thermo Scientific Dionex UltiMate 3000 RSLCnano system •Column: 25 µm ID x 15 cm, packed with Thermo Scientific Acclaim PepMap RSLC C18, 2 μm, 100 Å •Trap: 50 μm ID x 7 cm (2 cm packed bed), packed with Acclaim™ PepMap™ C18, 3 μm, 100 Å •Mobile Phases: Solvent A: 0.1% Formic acid (FA) in water; Solvent B: 0.1% FA in Water/acetonitrile (ACN) (2/8), gradient 4–55 %B. Loading solvent: 0.1% trifluoroacetic acid (TFA) in water at 1.5 μL/min. Mass Spectrometry •Thermo Scientific Q Exactive Mass Spectrometer •New Objective FS-360-20-5-D-5 Nano-ESI emitter •Peptides are ionized via electrospray and analyzed via data dependent MS/MS Data Analysis • Thermo Scientific Dionex Chromeleon 6.8 Chromatography Data System •Thermo Scientific Xcalibur 2.2 Data Acquisition System •ID with Mascot™ embedded in Thermo Scientific Protein Discoverer; FDR 1% Results Column Performances The 25 μm ID nano columns were packed in silica capillary. Both column inlet and outlet were fritted according to a proprietary protocol. The columns were implemented with fingertight connections capable of withstanding 1000 bar without leaking. Each column was tested after production in a direct injection configuration with UV detection. Tryptic peptide mixtures were separated in gradient mode to evaluate the columns. Peak width and symmetry performances were excellent (Figure 1). FIGURE 1. Direct injection of cytochrome-C digest in a 25 μm ID nano column, UV detection, solvent A: TFA 0.05%, solvent B: 2/8 water/ACN (0.04% TFA), 4─55 %B in 30 minutes at 50 nL/min. The peak label is the width at half height. Splitless Nano Pump Performances The UltiMate™ RSLCnano UHPLC system was adapted to meet the requirements of ultra-low nano flow. The flow selector was replaced with a prototype version suitable for controlling flow rates lower than 70 nL/min. The flow delivery precision of the pump was tested by evaluating the relative standard deviation (RSD) of the retention time of the peptide peaks. The precision was outstanding throughout the flow range used for the experiments (Table 1 and Table 2). The prototype flow selector can be easily and reversibly implemented in any UltiMate 3000 RSLCnano system. TABLE 1. Retention time precision of 6 peptides at 20 nL/min. The rest of the conditions are the same as Figure 1. TABLE 2. Retention time precision of a selected peptide at various flow rates. Conditions are the same as Figure 1 except for the flow rate. Pre-Concentration With Vented Column The plumbing of the system for a pre-concentration experiment can be seen in Figure 2. The pressure regulators are packed capillaries with specific flow resistance (similar to the nano column or trap column pressure). The purpose of the pressure regulator is to mantain the nano pump and the loading pump pressurization during the whole run, irrespective of the valve position. Even when pre-concentration was set up, the precision of the analysis was preserved. The flow restrictors were essential to ensure fast and repeatable pressurization after valve switching. Mascot is a trademark of Matrix Science, Ltd. All other trademarks are the property of Thermo Fisher Scientific Inc. and its subsidiaries. This information is not intended to encourage use of these products in any manners that might infringe the intellectual property rights of others. PO70179_E 06/12S 27.5 30.0 32.5 35.0 37.5 40.0 42.5 45.0 49.5 mAU min 7.6 sec 4.6 sec 5.2 sec 4.4 sec 4.6 sec 5,4 sec 4.9 sec 4.9 sec 5.3 sec 4,5 sec 4.3 sec Peak 1 2 3 4 5 6 RT (min) 49.67 51.72 54.50 54.91 57.36 59.77 RSD (RT, %) 0.06 0.04 0.04 0.03 0.03 0.03 Flow Rate (nL/min) 20 30 40 50 RT (min) 54.50 37.67 30.84 26.22 RSD (%) 0.04 0.03 0.03 0.08 FIGURE 2. Plumbing schematic for vented column pre-concentration. The valve can be switched to either direct the flow of the loading pump through the trap column (top, Loading stage), or to enable the separation of peptides at low nL/ min flow rates (bottom, elution stage). FIGURE 3. Overlay of 6 consecutive injections with sample pre-concentration and 25 μm ID column. Sample: 300 fmol protein mixture digest (cytochrome-C, lysosyme, alcohol dehydrog-enase, BSA, apo-transferrin, ß-galactosidase). Solvent A: TFA 0.05%, solvent B: 2/8 water/ACN (0.04% TFA), 4─55 %B in 60 minutes at 50 nL/min. Sample loading at 2 μL/min, UV detection (214 nm). The efficiency loss when using pre-concentration with the vented column was marginal (Figure 4). Using the same gradient and sample, the analysis of peak width (half height) for 2 hydrophilic and 2 hydrophobic peptides showed that the peak width increase is well below 1 second. Preliminary UHPLC-UV-MS Results In the initial UHPLC-MS experiments, UV detection was used to monitor the chromatographic performances. The column was connected to a 0.75 nL flow cell with 10 μm ID silica capillaries, and the flow cell was connected to the emitter with 20 cm, 20 μm ID silica capillaries. 26.9 30.0 32.5 35.0 37.5 40.0 42.5 45.0 47.5 50.0 52.5 55.0 57.5 60.0 62.5 66.2 mAU min 6 5 4 3 2 1 FIGURE 4. Comparison of the peak width at half height in direct injection and pre-concentration. 30 min gradient from 4 to 55 %B at 50 nL/min, sample loading at 2 μL/min, UV detection (214 nm). Effect of Flow Rate and Gradient Length As was expected from nanospray theory, lowering the flow rate below 50 nL/min resulted in an increase in signal intensity (data not shown). This, consequently, resulted in an increased number of identified peptides and proteins (Figure 5 and 6). Lowering the flow rate from 50 to 20 nL/min resulted in a 20% increase in both peptide and protein identifications. As previously found 2 , the use of long gradients also resulted in an increase in peptide and protein identifications. This can be explained by the increased peak capacity provided by longer gradients. The relation between increased peak capacity and peptide and protein IDs is shown in Figure 7 and 8. FIGURE 5. Number of identified peptides using a 25 μm ID column and different gradient times. Sample: 100 ng HeLa lysate. FIGURE 6. Number of identified proteins using a 25 μm ID column and different gradient times. Sample: 100 ng HeLa lysate. 4 4,5 5 5,5 6 1 2 3 4 PWHH (sec) direct injection Preconcentration R² = 0.9917 R² = 0.9779 0 5000 10000 15000 20000 25000 30000 0 2 4 6 8 10 12 14 16 Unique Peptides Gradient Time / [h] 20 nl / min 50 nl / min R² = 0.99381 R² = 0.97946 0 500 1000 1500 2000 2500 3000 3500 4000 0 2 4 6 8 10 12 14 16 Unique Proteins (grouped) Gradient Time / [h] 20 nl / min 50 nl / min y = 47.1x R² = 0.91 0 5000 10000 15000 20000 25000 30000 0 100 200 300 400 500 600 Unique Peptides Peak Capacity 50 nl / min y = 50.2x R² = 0.95 0 5000 10000 15000 20000 25000 30000 0 100 200 300 400 500 600 Unique Peptides Peak Capacity 20 nl / min
Transcript of Development and Operation of a Nano UHPLC-ESI-MS ….pdf · Development and Operation of a Nano...
Development and Operation of a Nano UHPLC-ESI-MS Vented Column Setup with 25 µm ID Columns for Improved Sensitivity Rieux L.1, De Pra M.1, Köcher T.2, Pichler P.2, Mechtler K.2, Swart R.1, Decrop W.1 1Thermo Fisher Scientific, Amsterdam, The Netherlands; 2Research Institute of Molecular Pathology, Vienna, Austria
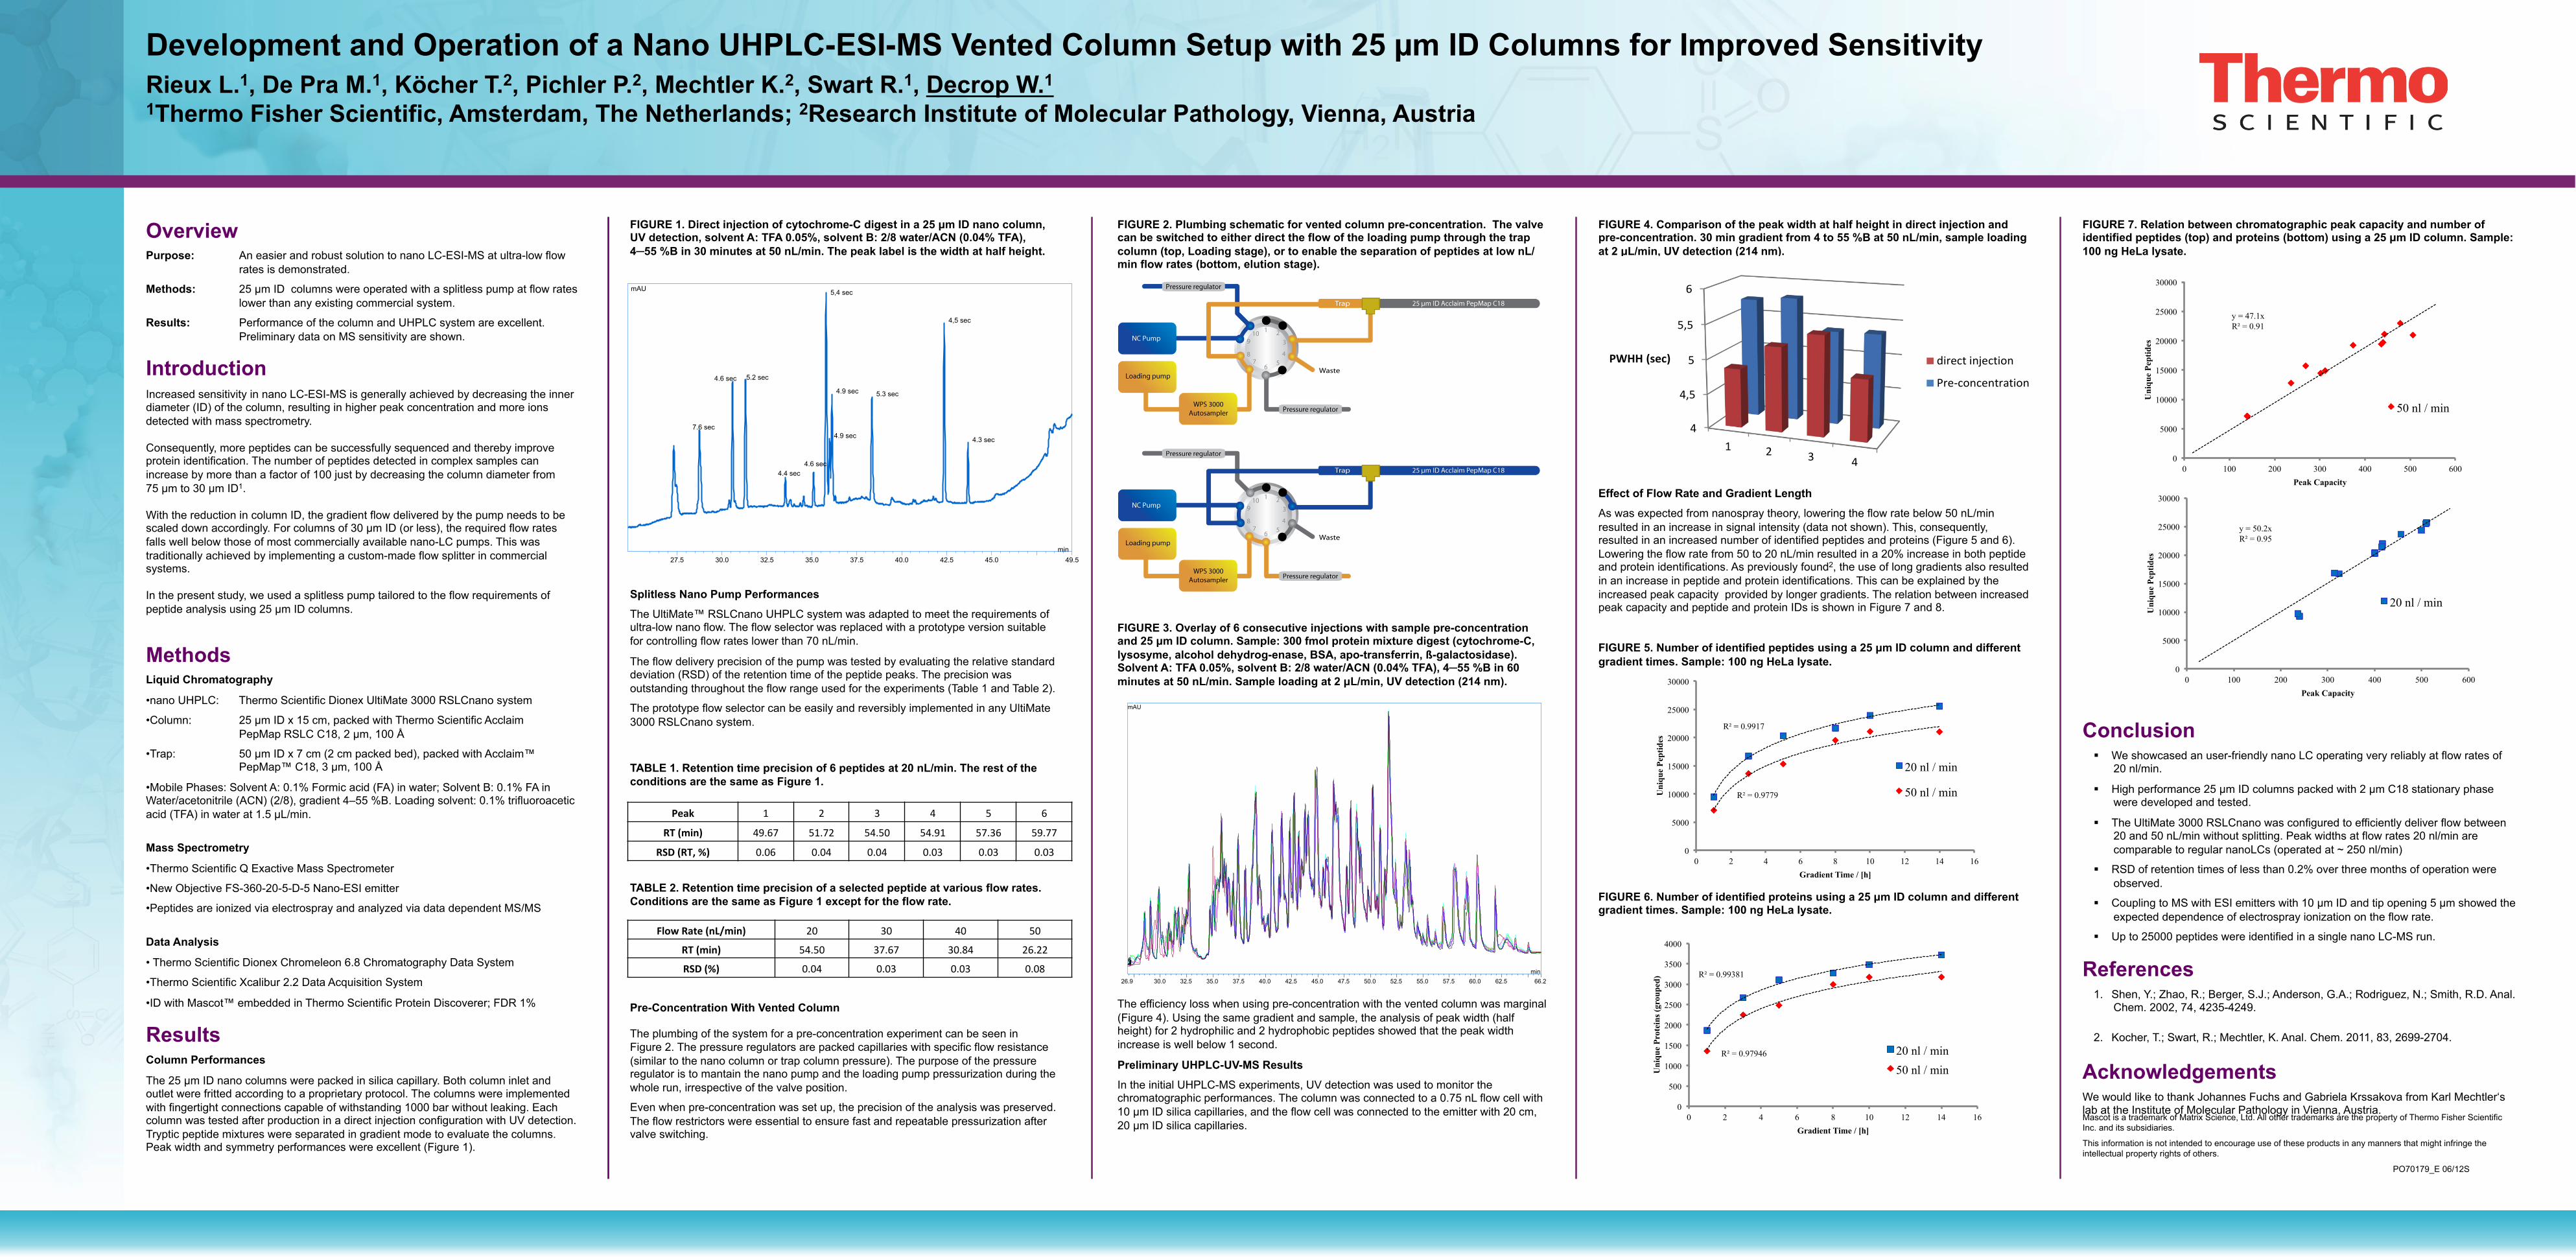
FIGURE 7. Relation between chromatographic peak capacity and number of identified peptides (top) and proteins (bottom) using a 25 µm ID column. Sample: 100 ng HeLa lysate.
Conclusion § We showcased an user-friendly nano LC operating very reliably at flow rates of
20 nl/min.
§ High performance 25 µm ID columns packed with 2 µm C18 stationary phase were developed and tested.
§ The UltiMate 3000 RSLCnano was configured to efficiently deliver flow between 20 and 50 nL/min without splitting. Peak widths at flow rates 20 nl/min are comparable to regular nanoLCs (operated at ~ 250 nl/min)
§ RSD of retention times of less than 0.2% over three months of operation were observed.
§ Coupling to MS with ESI emitters with 10 µm ID and tip opening 5 µm showed the expected dependence of electrospray ionization on the flow rate.
§ Up to 25000 peptides were identified in a single nano LC-MS run.
References 1. Shen, Y.; Zhao, R.; Berger, S.J.; Anderson, G.A.; Rodriguez, N.; Smith, R.D. Anal.
Chem. 2002, 74, 4235-4249.
2. Kocher, T.; Swart, R.; Mechtler, K. Anal. Chem. 2011, 83, 2699-2704.
Acknowledgements We would like to thank Johannes Fuchs and Gabriela Krssakova from Karl Mechtler‘s lab at the Institute of Molecular Pathology in Vienna, Austria.
Overview Purpose: An easier and robust solution to nano LC-ESI-MS at ultra-low flow
rates is demonstrated.
Methods: 25 µm ID columns were operated with a splitless pump at flow rates lower than any existing commercial system.
Results: Performance of the column and UHPLC system are excellent. Preliminary data on MS sensitivity are shown.
Introduction Increased sensitivity in nano LC-ESI-MS is generally achieved by decreasing the inner diameter (ID) of the column, resulting in higher peak concentration and more ions detected with mass spectrometry. Consequently, more peptides can be successfully sequenced and thereby improve protein identification. The number of peptides detected in complex samples can increase by more than a factor of 100 just by decreasing the column diameter from 75 µm to 30 µm ID1. With the reduction in column ID, the gradient flow delivered by the pump needs to be scaled down accordingly. For columns of 30 µm ID (or less), the required flow rates falls well below those of most commercially available nano-LC pumps. This was traditionally achieved by implementing a custom-made flow splitter in commercial systems. In the present study, we used a splitless pump tailored to the flow requirements of peptide analysis using 25 µm ID columns.
Methods Liquid Chromatography
• nano UHPLC: Thermo Scientific Dionex UltiMate 3000 RSLCnano system
• Column: 25 µm ID x 15 cm, packed with Thermo Scientific Acclaim PepMap RSLC C18, 2 µm, 100 Å
• Trap: 50 µm ID x 7 cm (2 cm packed bed), packed with Acclaim™ PepMap™ C18, 3 µm, 100 Å
• Mobile Phases: Solvent A: 0.1% Formic acid (FA) in water; Solvent B: 0.1% FA in Water/acetonitrile (ACN) (2/8), gradient 4–55 %B. Loading solvent: 0.1% trifluoroacetic acid (TFA) in water at 1.5 µL/min.
Mass Spectrometry
• Thermo Scientific Q Exactive Mass Spectrometer
• New Objective FS-360-20-5-D-5 Nano-ESI emitter
• Peptides are ionized via electrospray and analyzed via data dependent MS/MS
Data Analysis
• Thermo Scientific Dionex Chromeleon 6.8 Chromatography Data System
• Thermo Scientific Xcalibur 2.2 Data Acquisition System
• ID with Mascot™ embedded in Thermo Scientific Protein Discoverer; FDR 1%
Results Column Performances
The 25 µm ID nano columns were packed in silica capillary. Both column inlet and outlet were fritted according to a proprietary protocol. The columns were implemented with fingertight connections capable of withstanding 1000 bar without leaking. Each column was tested after production in a direct injection configuration with UV detection. Tryptic peptide mixtures were separated in gradient mode to evaluate the columns. Peak width and symmetry performances were excellent (Figure 1).
FIGURE 1. Direct injection of cytochrome-C digest in a 25 µm ID nano column, UV detection, solvent A: TFA 0.05%, solvent B: 2/8 water/ACN (0.04% TFA), 4─55 %B in 30 minutes at 50 nL/min. The peak label is the width at half height.
Splitless Nano Pump Performances
The UltiMate™ RSLCnano UHPLC system was adapted to meet the requirements of ultra-low nano flow. The flow selector was replaced with a prototype version suitable for controlling flow rates lower than 70 nL/min.
The flow delivery precision of the pump was tested by evaluating the relative standard deviation (RSD) of the retention time of the peptide peaks. The precision was outstanding throughout the flow range used for the experiments (Table 1 and Table 2).
The prototype flow selector can be easily and reversibly implemented in any UltiMate 3000 RSLCnano system.
TABLE 1. Retention time precision of 6 peptides at 20 nL/min. The rest of the conditions are the same as Figure 1.
TABLE 2. Retention time precision of a selected peptide at various flow rates. Conditions are the same as Figure 1 except for the flow rate.
Pre-Concentration With Vented Column
The plumbing of the system for a pre-concentration experiment can be seen in Figure 2. The pressure regulators are packed capillaries with specific flow resistance (similar to the nano column or trap column pressure). The purpose of the pressure regulator is to mantain the nano pump and the loading pump pressurization during the whole run, irrespective of the valve position.
Even when pre-concentration was set up, the precision of the analysis was preserved. The flow restrictors were essential to ensure fast and repeatable pressurization after valve switching.
Mascot is a trademark of Matrix Science, Ltd. All other trademarks are the property of Thermo Fisher Scientific Inc. and its subsidiaries.
This information is not intended to encourage use of these products in any manners that might infringe the intellectual property rights of others.
PO70179_E 06/12S
27.5 30.0 32.5 35.0 37.5 40.0 42.5 45.0 49.5
mAU
min
7.6 sec
4.6 sec 5.2 sec
4.4 sec 4.6 sec
5,4 sec
4.9 sec
4.9 sec 5.3 sec
4,5 sec
4.3 sec
Peak 1 2 3 4 5 6
RT (min) 49.67 51.72 54.50 54.91 57.36 59.77
RSD (RT, %) 0.06 0.04 0.04 0.03 0.03 0.03
Flow Rate (nL/min) 20 30 40 50
RT (min) 54.50 37.67 30.84 26.22
RSD (%) 0.04 0.03 0.03 0.08
FIGURE 2. Plumbing schematic for vented column pre-concentration. The valve can be switched to either direct the flow of the loading pump through the trap column (top, Loading stage), or to enable the separation of peptides at low nL/min flow rates (bottom, elution stage).
FIGURE 3. Overlay of 6 consecutive injections with sample pre-concentration and 25 µm ID column. Sample: 300 fmol protein mixture digest (cytochrome-C, lysosyme, alcohol dehydrog-enase, BSA, apo-transferrin, ß-galactosidase). Solvent A: TFA 0.05%, solvent B: 2/8 water/ACN (0.04% TFA), 4─55 %B in 60 minutes at 50 nL/min. Sample loading at 2 µL/min, UV detection (214 nm).
The efficiency loss when using pre-concentration with the vented column was marginal (Figure 4). Using the same gradient and sample, the analysis of peak width (half height) for 2 hydrophilic and 2 hydrophobic peptides showed that the peak width increase is well below 1 second.
Preliminary UHPLC-UV-MS Results
In the initial UHPLC-MS experiments, UV detection was used to monitor the chromatographic performances. The column was connected to a 0.75 nL flow cell with 10 µm ID silica capillaries, and the flow cell was connected to the emitter with 20 cm, 20 µm ID silica capillaries.
26.9 30.0 32.5 35.0 37.5 40.0 42.5 45.0 47.5 50.0 52.5 55.0 57.5 60.0 62.5 66.2
mAU
min 6 5 4 3 2 1
FIGURE 4. Comparison of the peak width at half height in direct injection and pre-concentration. 30 min gradient from 4 to 55 %B at 50 nL/min, sample loading at 2 µL/min, UV detection (214 nm).
Effect of Flow Rate and Gradient Length
As was expected from nanospray theory, lowering the flow rate below 50 nL/min resulted in an increase in signal intensity (data not shown). This, consequently, resulted in an increased number of identified peptides and proteins (Figure 5 and 6). Lowering the flow rate from 50 to 20 nL/min resulted in a 20% increase in both peptide and protein identifications. As previously found2, the use of long gradients also resulted in an increase in peptide and protein identifications. This can be explained by the increased peak capacity provided by longer gradients. The relation between increased peak capacity and peptide and protein IDs is shown in Figure 7 and 8.
FIGURE 5. Number of identified peptides using a 25 µm ID column and different gradient times. Sample: 100 ng HeLa lysate.
FIGURE 6. Number of identified proteins using a 25 µm ID column and different gradient times. Sample: 100 ng HeLa lysate.
4
4,5
5
5,5
6
1 2 3 4
PWHH (sec) direct injection
Pre-‐concentration
R² = 0.9917
R² = 0.9779
0
5000
10000
15000
20000
25000
30000
0 2 4 6 8 10 12 14 16
Uni
que
Pept
ides
Gradient Time / [h]
20 nl / min
50 nl / min
R² = 0.99381
R² = 0.97946
0
500
1000
1500
2000
2500
3000
3500
4000
0 2 4 6 8 10 12 14 16
Uni
que
Prot
eins
(gro
uped
)
Gradient Time / [h]
20 nl / min 50 nl / min
y = 47.1x R² = 0.91
0
5000
10000
15000
20000
25000
30000
0 100 200 300 400 500 600
Uni
que
Pept
ides
Peak Capacity
50 nl / min
y = 50.2x R² = 0.95
0
5000
10000
15000
20000
25000
30000
0 100 200 300 400 500 600
Uni
que
Pept
ides
Peak Capacity
20 nl / min