Pesticide Data Program - Agricultural Marketing Service PDP Annual... · Pesticide Data Program ......
70
United States Department of Agriculture Agricultural Marketing Service Science & Technology Pesticide Data Program Annual Summary Calendar Year 1995
Transcript of Pesticide Data Program - Agricultural Marketing Service PDP Annual... · Pesticide Data Program ......

United States Department of AgricultureAgricultural Marketing Service
Science & Technology
Pesticide Data ProgramAnnual Summary Calendar Year 1995

Pesticide Data Program - Annual Summary Calendar Year 1995 iii
Contents
Page No.
Preface . . . . . . . . . . . . . . . . . . . . . . . . . . . . . . . . . . . . . . . . . . . . . . . . . . . . . . . . . . vii
Executive Summary . . . . . . . . . . . . . . . . . . . . . . . . . . . . . . . . . . . . . . . . . . . . . . . . . . xi
Section I
Introduction . . . . . . . . . . . . . . . . . . . . . . . . . . . . . . . . . . . . . . . . . . . . . . . . . . . . . . . . . . . . 1
Section II
Sampling Protocol . . . . . . . . . . . . . . . . . . . . . . . . . . . . . . . . . . . . . . . . . . . . . . . . . . . . . . . 6
Section III
Laboratory Operations . . . . . . . . . . . . . . . . . . . . . . . . . . . . . . . . . . . . . . . . . . . . . . . . . . . 10
Section IV
Sample Results and Discussion . . . . . . . . . . . . . . . . . . . . . . . . . . . . . . . . . . . . . . . . . . . . . 11
Appendixes A-F Fruit and Vegetables . . . . . . . . . . . . . . . . . . . . . . . . . . . . . . . . . . . ..17
Appendix A Origin by Grower, Packer, or DistributorAppendix B Quality Assurance Program ElementsAppendix C Distribution of Residues Detected by PesticideAppendix D National Estimates for Concentration Percentiles vs. ToleranceAppendix E Number of Non-Detected Residues by Pesticide/Commodity PairsAppendix F Percentage of Samples vs. Number of Residues Detected per SampleAppendix G Distribution of Pesticide Residues in Wheat Appendix H Commodity History (A Chronological Listing)

Pesticide Data Program - Annual Summary Calendar Year 1995 v
List of Figures and Tables
FiguresPage No.
1 Overview of PDP Operations . . . . . . . . . . . . . . . . . . . . . . . . . . . . . . . . . . . . 2
2 Participating States and Their Geographical Distribution Areas . . . . . . . . . . . . 3
3 Commodity Origin (Percentage Domestic vs. Imported) . . . . . . . . . . . . . . . . . 8
4 Distribution of Wheat Samples . . . . . . . . . . . . . . . . . . . . . . . . . . . . . . . . . . . . 9
Tables
1 Pesticides in Pesticide Data Program . . . . . . . . . . . . . . . . . . . . . . . . . . . . . . . . 4
2 Samples Collected Per Commodity by Each Participating State . . . . . . . . . . . . 7
3A Number of Samples and Residues Detected, by Commodity (Includes Post-Harvest Applications) . . . . . . . . . . . . . . . . . . . . . . . . . . . . 13
3B Number of Samples and Residues Detected, by Commodity (Excludes Post-Harvest Applications) . . . . . . . . . . . . . . . . . . . . . . . . . . . 14

Pesticide Data Program - Annual Summary Calendar Year 1995 vii
Preface
In 1991, the United States Department of Agriculture this report, the Academy recommends that pesticide(USDA) was charged with implementing a program to residue monitoring programs target foods highlycollect data on pesticide residues in food. USDA’s consumed by children, and that analytical testingAgricultural Marketing Service (AMS) was appointed to methods used be standardized, validated, and subject toundertake the creation and implementation of such a strict quality control and quality assurance programs.program, currently known as the Pesticide Data Program PDP is now a critical component of the Food Quality(PDP). PDP has been in operation since May 1991 and Protection Act of 1996. Title III Sec. 301(c) of the Acthas published its findings for calendar years 1991 states: The Secretary of Agriculture shall ensure thatthrough 1994. This is the summary for calendar year the residue data collection activities conducted by the1995. Department of Agriculture in cooperation with the
PDP’s data on pesticides in selected commodities of Health and Human Services, provide for thestrengthen the Government's ability to respond to food improved data collection of pesticide residues,safety and marketing concerns, to protect public health, including guidelines for the use of comparableand to provide the Environmental Protection Agency analytical and standardized reporting methods, and(EPA) with data needed to assess the actual dietary risk increased sampling of foods most likely consumed byposed by pesticides. infants and children. PDP, as a result of the provisions
EPA registers pesticides under a statutory standard that the data needed to evaluate cumulative exposure torequires balancing the benefits of a pesticide use against pesticide residues with a common toxicological effect,its potential risks to human health and the environment. and create a statistically reliable database on endocrineIn making risk estimates, EPA uses a stepwise approach disruptors at minute detection levels needed to assessto minimize resource expenditures. As an initial worst dietary risk to compromised population groups. case assessment, EPA assumes that all acres of all cropsare treated with all pesticides for which they have a The States participating in PDP deserve specialregistered use. EPA also assumes that residues in recognition for their contributions to the program.treated crops are present at the maximum allowable Sample collectors’ vigilance and dedication allow AMSlevel. A theoretical assessment risk based on these to adjust sampling protocols to respond to changingworst case assumptions may significantly exceed the trends in commodity distribution. Laboratory staff haveactual risk of pesticide residues in the food supply and formulated recommendations to increase productivityjeopardize the registration of pesticides important to and improve methodologies. PDP also thanks PhillipAmerican agriculture. Further refinements to the risk Kott of USDA's National Agricultural Statistics Serviceassessment are done if needed. These stepwise (NASS); Edward Zager of EPA; John Jones of the Foodrefinements include the use of percent of crop treated; and Drug Administration (FDA); and the staffs atstatistical analyses of field data; considerations of the USDA’s Animal and Plant Health Inspection Serviceeffects of washing, cooking, processing, storage, and use (APHIS); Grain Inspection, Packers and Stockyardsof monitoring data, if available and reliable. This is Administration (GIPSA); and Agricultural Marketingwhere PDP data are pivotal. PDP’s sampling procedures Service laboratories for providing their support to thewere designed to capture actual residues in the food program. In addition, we acknowledge GIPSA’ssupply as close as possible to the time of consumption, services for the collection and analysis of wheat samplesthereby significantly upgrading the statistical reliability for PDP.and extent of information needed for risk assessment.
PDP continues to focus on the National Academy of presentation. Please send your comments andSciences’ conclusions as shown in the 1993 report suggestions to the Science and Technology DivisionPesticides in the Diets of Infants and Children. In address listed below.
Environmental Protection Agency and the Department
of this Act, will have a more significant role in providing
We welcome any comments on the Summary’s

Pesticide Data Program - Annual Summary Calendar Year 1995 viii
Data presented in this summary were collected and Florida Department of Agriculture andprocessed through the efforts of the following: Consumer Services
U.S. Department of Agriculture 3125 Conner Boulevard
Science and Technology DivisionAgricultural Marketing Service, USDA Florida Department of Agriculture and14th and Independence Avenue, S.W. Consumer ServicesRoom 3507, South Building, Mail Stop 0222 Chemical Residue LaboratoryPost Office Box 96456 500 3rd Street, NorthwestWashington, DC 20090-6456 Winter Haven, FL 33880
Director: William J. Franks, Jr. Michigan Department of AgriculturePhone: (202) 720-5231 Fax: (202) 720-6496 Laboratory DivisionDeputy Director: Robert L. Epstein 1615 South Harrison RoadPhone: (202) 720-2158 East Lansing, MI 48823-5224Pesticide Data Program StaffPhone: (703) 330-2300 Fax: (703) 330-6110 New York Department of Agriculture and Markets
INTERNET HOME PAGE
http://www.usda.gov/ams/index.htm North Carolina Department of Agriculture
Participating State Agencies 4000 Reedy Creek Road
California Department of Food and AgricultureCalifornia Department of Pesticide Regulation Ohio Department of AgricultureColorado Department of Agriculture Consumer Analytical LaboratoryFlorida Department of Agriculture and 8995 East Main Street Consumer Services Reynoldsburg, OH 43068Michigan Department of AgricultureNew York Department of Agriculture and Markets Texas Department of AgricultureNorth Carolina Department of Agriculture Brenham Pesticide LaboratoryOhio Department of Agriculture 200 East Horton StreetTexas Department of Agriculture Brenham, TX 77834Washington State Department of Agriculture
Participating State Laboratories 2017 South First Street
California Department of Food and AgricultureDivision of Inspection ServicesCenter for Analytical Chemistry3292 Meadowview RoadSacramento, CA 95832
Chemical Residue Laboratory, Building #3
Tallahassee, FL 32399-1650
Food LaboratoryState Campus, Building #7Albany, NY 12235
Food and Drug Protection DivisionConstable Laboratory
Raleigh, NC 27607
Washington State Department of AgricultureChemical and Hop Laboratory
Yakima, WA 98903

Pesticide Data Program - Annual Summary Calendar Year 1995 ix
Participating Federal Laboratories
United States Department of AgricultureAnimal and Plant Health Inspection ServiceNational Monitoring and Residue Analysis Laboratory3505 25th Avenue, Building 9Gulfport, MS 39501
United States Department of AgricultureGrain Inspection, Packers and StockyardsAdministrationGrain Inspection ServiceTechnical Services Division10383 North Executive Hills Blvd.Kansas City, MO 64153
United States Department of AgricultureAgricultural Marketing ServiceScience and Technology Division, Eastern Laboratory645 Cox RoadGastonia, NC 28054

Pesticide Data Program - Annual Summary Calendar Year 1995 xi
Executive Summary
The Pesticide Data Program (PDP) was implemented by quality of data that EPA uses to determine the residuethe United States Department of Agriculture (USDA) in levels in foods and estimate exposure to consumers.May 1991 to collect data on pesticide residues in foods. Without actual residue data, initial risk assessments areThe data are used by the Environmental Protection based on the theoretical maximum amounts of pesticideAgency (EPA) for its dietary risk assessment process use and may overstate dietary exposure. A theoreticaland pesticide registration process, the Food and Drug risk based on worst case assumptions may exceed theAdministration (FDA) to refine sampling for actual risk of pesticide residues in the food supply andenforcement of tolerances, Foreign Agricultural Service, jeopardize the registration of pesticides important toUSDA, to support export of U.S. commodities in a American agriculture. Where needed, EPA conductscompetitive global market, the Economic Research further refinements to the risk assessment by usingService, USDA, to evaluate pesticide alternatives, and additional information that includes residue monitoringthe public sector in addressing food safety issues. PDP data, if available and reliable. This is where PDP datahas issued data summaries for calendar years 1991 are pivotal. PDP data, which are collected as close tothrough 1994. This summary contains PDP findings for the point of consumption as possible, followscalendar year 1995. statistically reliable sampling protocols, thereby
During 1995, pesticides monitored by PDP includedinsecticides, herbicides, fungicides, and growth PDP samples are collected without regard for commodityregulators in fresh and processed fruits and vegetables, origin or variety, as close to the point of consumption asand wheat. Pesticides and commodities were chosen for possible. Samples reflect what is available to theinclusion in the program based on EPA's data needs and consumer throughout the year. PDP's sampling protocolUSDA's food consumption surveys. takes into account the different volumes of produce distributed annually by each sampling site, thusPDP planning and policy are coordinated through an removing a potential source of bias for estimates ofExecutive Steering Committee consisting of residues in PDP commodities. Wheat samples wererepresentatives of USDA, EPA, and FDA. USDA collected nationally from GIPSA’s “file” samplesrepresentatives to the committee include: Agricultural submitted for quality assurance evaluation, based onMarketing Service (AMS), National Agricultural state and monthly production.Statistics Service (NASS), Economic Research Service(ERS), and Agricultural Research Service (ARS). PDP's Samples collected during 1995 consisted of 12administrative, sampling, technical, and database commodities: apples, bananas, carrots, grapes, greenactivities are the responsibility of the Science and beans, oranges, peaches, potatoes, spinach, sweet corn,Technology Division of AMS. sweet peas, and wheat. Sweet corn and peas were
PDP operations in 1995 were managed through other PDP samples were fresh. Samples collectedcooperative agreements with nine States, which are originated from 39 States and 17 foreign countries. Ofresponsible for sample collection and analysis. Eight the 6,924 fruit and vegetable samples collected andparticipating States (California, Florida, Michigan, New analyzed: 1,143 (16.5 percent) were imported, withYork, North Carolina, Ohio, Texas, and Washington) bananas, grapes, and peaches accounting for mostcollected and analyzed samples during 1995. imports. In addition, 600 wheat samples were collectedColorado’s samples were shipped to other participating and analyzed. Thirty-seven samples were receivedlaboratories for analysis. Together, these nine States unsuitable for analyses and were discarded. represent approximately 50 percent of the Nation's population. Of the 6,924 fruit and vegetable samples analyzed by the
PDP was designed to provide information on the contained at least one pesticide residue. Also, 79concentrations of pesticides in order to improve the percent of the 600 wheat samples had at least one
upgrading their usefulness for risk assessment.
collected as frozen and canned processed products. All
participating laboratories, approximately 65 percent

Pesticide Data Program - Annual Summary Calendar Year 1995 xii
pesticide residue. About 29 percent of the residuedetections were due to post-harvest uses.
In 1995, there were 316 presumptive violations in 263samples. Nine presumptive violations were for pesticideresidues where the EPA tolerance was exceeded and 307were presumptive violations where there was noestablished tolerance for the pesticide/commodity pair.
Most pesticide residue detections were below tolerancelevels established by EPA. In PDP, the limits ofdetection for each pesticide/ commodity pair in thetesting system are analytically defined at levels lowenough to conduct realistic dietary risk assessments.This enables scientists using PDP data to consider notonly residue detection findings but also the inverse, non-detected residues, in calculating dietary risk. Hence, riskassessment evaluations by EPA in the reregistrationprocess can be based on the range of levels detected,including non-detected residues for each of thepesticide/commodity pairs tested.
PDP continuously strives to improve methodologies forthe collection, testing, and reporting of data. PDP dataare available to EPA and other Federal and Stateagencies charged with regulating and setting policies onthe use of pesticides.
Pesticide Data Program - Annual Summary Calendar Year 19951
Pesticide Data Program (PDP)Annual Summary, Calendar Year 1995
This summary consists of the following sections: (I.) Introduction, (II.) Sampling Protocol, (III.)Laboratory Operations, and (IV.) Sample Results and Discussion.
I. Introduction
To implement the Pesticide Data Program (PDP), theUnited States Department of Agriculture (USDA)utilized the expertise available in four of its agencies:the Agricultural Marketing Service (AMS), the NationalAgricultural Statistics Service (NASS), the EconomicResearch Service (ERS), and the Agricultural ResearchService (ARS). AMS was selected as the lead agency tocoordinate and implement the various facets of theresidue program and manage program operations.NASS provides statistically reliable data on chemicalusage at the State level and collects economic input datathat link chemical usage with economic characteristics.ERS analyzes AMS and NASS data to understandproducer behavior and to determine the impact variousproduction practices and policies might have on theNation's agricultural production, food supply, andconsumers. ARS conducts nationwide surveys ofindividual food intake and household use and isdeveloping a Food Grouping System to translate data onfoods as consumed into forms that can be linked withpesticide residue data. AMS selected its Science andTechnology Division to oversee PDP’s policy planningand program direction with the participating State andFederal facilities.
Figure 1, Overview of PDP Management andOperations, describes the program’s three majorcomponents - sample collection, laboratory analysis, anddatabase management. In 1995, PDP sampling and/oranalytical operations were performed by nine States(California, Colorado, Florida, Michigan, New York,North Carolina, Ohio, Texas, and Washington) through
agreements with their respective State agencies.Accordingly, a significant part of PDP's financialresources (75 percent) went directly to the States foroperating expenses. Ten percent of PDP funding wasgiven to USDA laboratory facilities to support Statetesting activities for analyses requiring selective residuemethods. An additional 2 percent was provided toGIPSA to conduct the wheat sampling and residuetesting program.
Figure 2 shows the States participating in the programfor collection of fresh and processed fruit and vegetablesamples , which together represent about 50 percent ofthe Nation's population. Also shown are nine otherStates (Alaska, Connecticut, Hawaii, Massachusetts,Nevada, New Jersey, New Mexico, Vermont, andWyoming) where a significant amount of produce isdirectly marketed from the participating States. Figure3 shows the distribution of commodities by origin,domestic versus imported. Figure 4 is a map showing thedistribution by State of wheat samples collected in 1995.
AMS works closely with EPA to select the commoditiesand pesticides to be placed in PDP. Commoditieschosen for inclusion are those most often consumed bythe American public, with emphasis on those consumedby infants and children. Twelve commodities (apples,bananas, carrots, grapes, green beans, oranges, peaches,potatoes, spinach, canned and frozen sweet corn andsweet peas, and wheat) were sampled and analyzed in1995. The pesticides EPA suggests for monitoringconsist mainly of those whose toxicities and estimateddietary exposures indicate the need for more refinedexposure estimates. The list is revised periodically

Pesticide Data Program - Annual Summary Calendar Year 19952
Main Objectives
C Provide the Environmental Protection Agency (EPA) with high-quality data on residues in food. The data are used for dietary riskassessments and to address pesticide reregistration and specialreviews.
C Address the recommendations of the National Academy of Sciencereport Pesticides in the Diets of Infants and Children.
C Support Foreign Agricultural Service’s international marketing ofU.S. commodities.
C Address USDA’s Food Quality Protection Act responsibility.
Laboratory Analysis
C Samples prepared as if for consumptionC State-of-the-art instrumentation usedC Detection at very low levelsC QA based on EPA Good Laboratory
PracticesC Confirmation of detected pesticidesC Multiple residue detection methodologyC Standard Operating Procedures
Database Management
C Customized query capabilityC Electronic transmission or dataC Standardized data summaries
Participating States - 1995
C CaliforniaC ColoradoC FloridaC MichiganC New York
C North CarolinaC OhioC TexasC Washington
USDA Laboratories - 1995
C AMS Eastern Laboratory, Gastonia, NCC APHIS, NMRAL, Gulfport, MSC GIPSA, Kansas City, MO
–
C EPAC FDA
Executive Steering Committee
C USDA-AMS-NASS-ERS-ARS
–
Management and Operations
C Science and Technology Division
––
– –
–
–Sample Collection
C Statistically reliable sampling planC Data used to make national estimatesC Collected near consumer levelC Represent about 50% of U.S. populationC Commodities consumed mostly by infants
and childrenC Origin of product retainedC Post-harvest fungicides & minor use
registrationC Standard Operating Procedures
Figure 1. Overview of PDP Management and Operations

Hawaii
Figure 2. Participating States and Their Geographical Distribution Areas
Wyoming
New Mexico
Alaska
Michigan
Massachusetts
Vermont
Connecticut
New Jersey
Florida
Nevada
States Where Produce is Directly
Participating States
Marketed from Participating States
Pesticide Data Program - Annual Summary Calendar Year 19953
to address EPA’s data needs. Table I is a list of Currently, PDP collects data for over 400 pesticide andpesticides included in the 1995 PDP testing profile for commodity combinations whose uses are legal under thefruit and vegetables, and wheat. Federal Insecticide, Fungicide, and Rodenticide Act
Although EPA continues to be a primary recipient of commodity combinations with pending use registrations,PDP data, over the past year PDP has received requests or where uses have been granted under other provisionsfor data from the Foreign Agricultural Service (FAS) and of FIFRA. In many of these cases, these uses are grantedother government and industry sources to promote to alleviate the lack of effective pesticides registered forexporting American agricultural products in internationalmarkets. PDP data have also been solicited by chemicalcompanies surveying use and residues of their products.PDP is now a critical component of the Food QualityProtection Act of 1996, which directs the Secretary ofAgriculture to collect pesticide residue data oncommodities highly consumed by infants and children ina uniform manner.
(FIFRA). Data are also collected for other pesticide and
minor use crops (fruits and vegetables). Consequently,PDP data are also used for reregistration of pesticides forminor use crops.
PDP has also provided information to the CodexAlimentarius Commission and the World HealthOrganization, both of which operate under the auspices

Pesticide Data Program - Annual Summary Calendar Year 19954
Table 1. Pesticides in Pesticide Data Program 1995
PART IA. Fresh and Processed Fruits and Vegetables (F&V)(Quality Assurance Program)
Analyzed by Multiresidue Methods (MRMs)48 Pesticides & 17 Metabolites / Degradates / Isomers
Acephate LindaneAldicarb + sulfone & sulfoxide MalathionAtrazine MethamidophosAzinphos methyl MethidathionCaptan MethomylCarbaryl MethoxychlorCarbofuran + 3-OH Carbofuran MevinphosChlorothalonil MyclobutanylChlorpropham OmethoateChlorpyrifos OxamylDacthal (DCPA) Parathion DDT + DDD + DDE Parathion methylDiazinon Permethrin cis & transDichlorvos (DDVP) Phorate + sulfone & sulfoxideDicloran PhosphamidonDicofol PropargiteDimethoate Quintozene (PCNB)Diphenylamine Hexachlorobenzene (HCB)Disulfoton + sulfone + sulfoxide Pentachloroaniline (PCA)Endosulfan I, II & sulfate Pentachlorobenzene (PCB)Esfenvalerate/Fenvalerate Terbufos + sulfone & O-analogEthion ThiabendazoleFenamiphos + sulfone + sulfoxide Thiodicarb (as methomyl metabolite)Imazalil TrifluralinIprodione Vinclozolin
Analyzed by Selective Residue Methods (SRMs)5 Pesticides + 3 Isomers
2,4-DAbamectin (Avermectin b1a and delta 8,9 isomer)Benomyl (as Carbendazim)Fenbutatin Oxide (Hexakis) + metabolitesFormetanate

Pesticide Data Program - Annual Summary Calendar Year 19955
PART IB. Other Pesticides/Metabolites Analyzed in F&V20 Pesticides + 5 Metabolites / Isomers
Allethrin LinuronAnilazine MCPA (m-chlorophenoxyacetic acid)Azinphos ethyl MetalaxylBenfluralin Methiocarb + sulfoxideCyhalothrin lambda & isomer 1-Napthol (Carbaryl Metabolite)Cypermethrin OvexDemeton-S Phosalone Demeton + sulfone PhosmetDieldrin Piperonyl ButoxideDiuron TecnazineEthoprop Toxaphene 4-OH Diphenylamine Metabolite
PART II. Wheat
Analyzed by Multiresidue Methods (MRMs) - Quality Assurance Program23 Pesticides + 5 Metabolites/Isomers
Atrazine Endosulfan I, II & sulfateAzinphos Methyl ImazalilCarbaryl LinuronCarbofuran + 3 -OH Carbofuran MalathionChlorpyrifios MethomylChlorpyrifos methyl MethoxychlorDemeton S ParathionDiazinon Parathion methylDichlorvos (DDVP) Phorate & sulfoneDiclofop methyl TriallateDimethoate TrifluralinDisulfoton & sulfone
of the United Nations. The information provided was on potential sites granting access and providing informationextraneous residues in foods (environmental to sample collectors. Their cooperation makes it possiblecontaminants), such as DDT and metabolites, pesticide to adjust sampling protocols in response to fluctuationsresidue stability data, and PDP’s Proficiency Check in food distribution. Sample Program.
To obtain pesticide residue data on fruit and vegetable programs (tolerance enforcement) which require quickcommodities as close to the point of consumption as turnaround time for analysis of enforcement samples.possible, samples are collected at distribution points just Under tolerance enforcement, the sampled commoditybefore release to supermarkets and grocery stores. may be detained at the distribution facility while awaitingSampling at these locations allows for residue sample results. PDP places emphasis on searching formeasurements that include fungicides and growth residues at the lowest detectable levels, rather than onregulators, and takes into account degradation of quick sample turnaround; therefore, analysis of PDPpesticides while in storage. Participation of PDP samples may take over a month, and does not affectsampling sites is voluntary, which sets it apart from State commodity distribution.and Federal enforcement programs. There are over 650
PDP differs markedly from regulatory monitoring

Pesticide Data Program - Annual Summary Calendar Year 19956
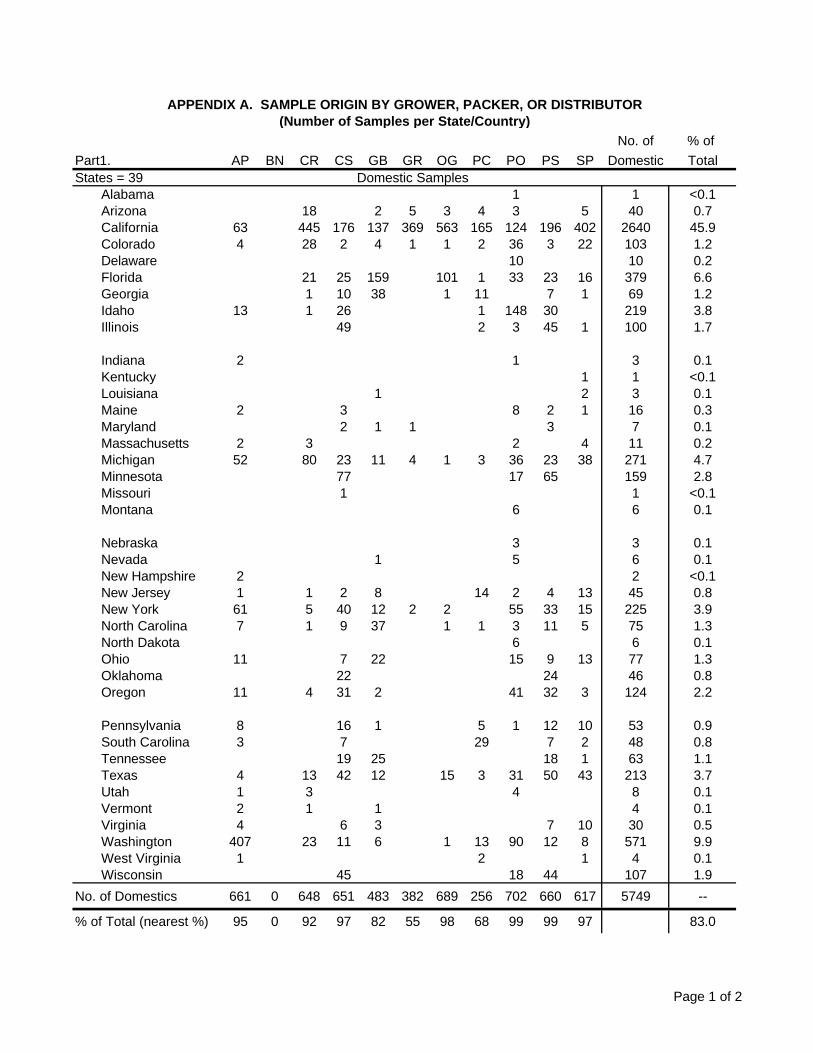
As of the publication date of this Summary, PDP has determine the probability for selection. For example, aconsidered 26 commodities in the testing program. site that distributes 100,000 pounds of produce annuallyAppendix H is a chronological history of the commodities might be given a weight of “10,” and a site thatin PDP from program inception to January 1997. distributes 10,000 pounds might be weighted “1.” The
II. Sampling Protocol
Fruit and Vegetables Sampling Plan
PDP’s statistically reliable sampling protocol for freshand processed fruit and vegetables allows for makingnearly unbiased estimates of pesticide residues forcommodities collected in the participating States andmakes it possible to quantify the accuracy of theestimates for the Nation as a whole. The protocol alsoreflects the relative proportion of imported versusdomestic produce available to the consumer. This hasbeen corroborated by comparing the composition of PDPsamples with import data compiled by the EconomicAnalysis Branch, AMS Fruit and Vegetable Division.
�� Sampling Procedures
Participating States are responsible for compiling andmaintaining lists of sites used for sample collection.Since PDP strives to collect samples as close to theconsumer as possible, while maintaining sample origin,most of the sites for fresh fruits and vegetables are eitherterminal markets or large chain store distribution centers.Both of these locations serve as the last stopover beforeproduce reaches retailers and, ultimately, consumers.This provides a better picture of actual dietary exposureto pesticide residues by taking into account pesticidedegradation that occurs during transit and storage.Sampling at these locations also provides information onpost-harvest application of fungicides and growthregulators.
Processed commodity samples are collected atdistribution centers or large warehouses. To provide PDPwith data on both canned and frozen sweet corn and peas,collection of the two types of processed commodity werealternated monthly.
After establishing their site lists, States are required toprovide AMS and NASS with annual volume informationfor each site (quantity of commodity distributed in oneyear). This information is used to “weight” the site to
probability proportionate to size method of site selectionwould then result in the larger site (distributing 100,000pounds) being 10 times more likely to be selected forsampling than the smaller site (distributing 10,000pounds). Participating States are required to work withNASS to develop their statistical procedures for siteweighting and selection. States are also given the optionof having NASS perform their quarterly site selection forthem. The number of sampling sites and the volume ofproduce distributed by the sites varies greatly from Stateto State.
State population figures are used to assign the number offruit and vegetable samples scheduled for collection percommodity each month. For 1995, these numbers were:California-14, Colorado-2, Florida-7, Michigan-6, NewYork-9, North Carolina-4, Ohio-6, Texas-8, andWashington-4; for an annual total of 720 per commodity.Sample size was approximately 5 pounds for eachapplicable testing facility.
Sampling plans, which were prepared by the States on aquarterly basis, included sampling dates, sites, and fruitand vegetable commodities for collection during eachmonth of the quarter. Although sites could only besampled once per month for the same commodity, Stateswere allowed to collect two different commodities at thesame site on the same date. This “pairing” ofcommodities reduced the number of sampling dates; and,therefore, the cost of sample collection. States were alsoinstructed to collect all samples of the same commodityon one sampling date, or, if needed, within twoconsecutive dates. Collection of commodities wasrandomly assigned to various weeks of the month, priorto selecting specific sampling dates within the week.Since sampling sites were selected for the entire quarter,States were allowed to assign the sites to particularmonths based on geographic location.
In 1995, seven of the participating States formedtransshipment pools, whereby commodities collected bythe paired States were combined into one set foranalytical testing in one State laboratory. Thisarrangement created larger sample sets, increasedproficiency and productivity, and substantially reducedthe mandatory quality assurance costs. These paired

Pesticide Data Program - Annual Summary Calendar Year 19957
States are: Colorado, Michigan, and Washington; Florida States have been given Statement of Procedures (SOPs)and Texas; and North Carolina and Ohio. for PDP sampling, which cover sample administration;
Chain-of-custody for PDP samples is documented documentation. These SOPs, which are updated asthrough the use of “Sample Information Forms.” These needed, are provided to sample collectors, and used as aforms are used by the sample collectors to record all guide for determining compliance during samplingpertinent sample information, such as: (1) the State reviews. where the sample was collected; (2) the date of collection;(3) the 3-digit code for the sampling site; and (4) the �� Synopsis of Sample Collection (Fruit andcommodity code. These four pieces of information are Vegetables) combined to form a unique “sample identificationnumber” for recording in the PDP database. Otherinformation included on the form is: (1) whether thesample is domestic or imported and, if imported, thecountry of origin; (2) the name of the sampling site,grower, packer, or distributor; and (3) a list of potentialor known post-harvest applications. The SampleInformation Forms are also used to keep track of anymissing samples that are not collected, lost in transit, ordamaged and unable to be analyzed when received at thelaboratory. Sampling managers in the participating
collection, packing, and shipping procedures; and
A total of 6,924 samples of fresh and processed fruitsand vegetables were collected and analyzed during 1995.As shown in Table 2, the number of samples collectedper State was: California - 1,607, Colorado - 228,Florida - 772, Michigan - 721, New York - 1,034, NorthCarolina - 477, Ohio - 696, Texas - 933, and Washington- 456. These figures are less than the total number ofassigned samples for 1995 due to the unavailability ofproduct at either the original or alternate sampling site,which is often due to the commodity growing season.
Table 2. Samples Collected & Analyzed per Commodity by Each Participating State
Commodity
State AP BN CR CS GB GR OG PC PO PS SP Total
California 156 121 163 139 146 160 163 91 169 140 159 1607
Colorado 23 17 24 23 17 24 22 12 22 23 21 228
Florida 78 49 80 77 64 76 76 41 81 80 70 772
Michigan 72 49 71 71 62 72 72 45 70 70 67 721
New York 106 74 104 104 82 105 106 60 105 104 84 1034
North Carolina 48 35 48 47 46 46 48 25 47 46 41 477
Ohio 71 46 71 71 56 68 72 36 72 70 63 696
Texas 94 63 96 93 80 95 93 48 95 92 84 933
Washington 47 32 46 46 34 48 48 19 46 45 45 456
Total 695 486 703 671 587 694 700 377 707 670 634 6924
CommoditiesAP - Apples GB - Green Beans PO - PotatoesBN - Bananas (Jan-Sep) GR - Grapes PS - Sweet PeasCR - Carrots OG - Oranges SP - SpinachCS - Sweet Corn PC - Peaches
Figure 3 shows the total number of samples percommodity and the percentage of each that were eitherdomestic, imported, or of unknown origin. Appendix Aprovides a more detailed breakdown of sample origin

Pesticide Data Program - Annual Summary Calendar Year 19958
by State or country. As indicated, samples collectedduring 1995 originated from 39 States and 17 foreigncountries.
Figure 3. COMMODITY ORIGIN (Percentage Domestic vs. Imported)
A. Fresh Commodities

95.1 % Domestic
4.9 % Import
Carrots(703 Samples)
Bananas(486 Samples)
Apples(695 Samples)
Apples(695 Samples)
Oranges(700 Samples)
Green Beans(587 Samples)
Grapes(694 Samples)
Spinach(634 Samples)
Peaches(377 Samples)
Potatoes(707 Samples)
Figure 3. COMMODITY ORIGIN (Percentage Domestic vs. Imported)
A. Fresh Commodities
B. Processed Commodities*

Sweet Peas(670 Samples)
Sweet Corn(671 Samples)
* Forprocessed commodities, percentages were mainly derived from packer and/or distributor information.

Pesticide Data Program - Annual Summary Calendar Year 19959
Wheat Sampling Program
The Grain Inspection, Packers and Stockyards sixteen samples in GIPSA’s 13 regional offices.Administration (GIPSA) collected 600 wheat samples in Numbers of samples collected were based on productcalendar year 1995. Samples were collected from availability on a national basis by State and month,available “file” samples received from grain elevators and encompassing all seven varieties of wheat. Figure 4 is aother storage facilities, but excluded wheat already map of the U.S. showing the distribution of the 600segregated for export. Sample selection was done wheat samples by State.randomly based on predetermined algorithm of one in
Figure 4. Distribution of Wheat Samples A minimum of 500 to 1,000 grams of individuals levels of detection. Major changes in methodology arerepresentative samples of wheat were forwarded for evaluated, and their soundness demonstrated andpesticide analysis to GIPSA’s Technical Services documented in accordance with PDP Standard OperatingDivision laboratory in Kansas City, MO. Chain-of- Procedures (SOPs).custody procedures were the same as for fruit andvegetable samples. The Sample Information Form PDP participating laboratories monitored 48 pesticidesincluded the location of the field office, inspection point, plus 17 metabolites, degradates, and isomers usingwheat variety, and date of inspection. multiresidue methods (MRMs) and 5 pesticides plus 3
III. Laboratory Operations
Twelve laboratories (nine State and three Federal)performed analyses for PDP during 1995. Theselaboratories are equipped with advanced technicalinstrumentation capable of detecting residues at very lowlevels. The laboratory staff receives intensive trainingand must demonstrate analytical proficiency on anongoing basis. Scientists continuously test newtechnologies and develop new techniques to improve the
metabolites by single or selective residue methods(SRMs). Since SRMs are resource intensive, this type ofanalysis was performed only at selected laboratories forspecific commodities as indicated below:
Laboratories Performing SRMs
1. APHIS, NMRAL, Gulfport, MS
Pesticide: BenomylCommodities: Carrots, Grapes, Green Beans,
Oranges (Jan.-Sep.), Peaches, Sweet Corn, and Spinach.

Figure 4. Distribution of Wheat Samples
Montana
Colorado
So. Dakota
Nebraska
Washington
Texas
Missouri
Michigan
States with less than 30 Samples
States with more than 30 Samples
Oregon
Idaho
Utah
No. Dakota
Minnesota
Michigan
LouisianaMississippi
Alabama
Tennessee
Alaska
Oklahoma Arkansas
Kentucky
Iowa
Illinois
Wisconsin
Indiana6
Ohio
6
6
104
1
8
2252
22
23
10
3
1
4
4
7
1
1810
19
10
3

Pesticide Data Program - Annual Summary Calendar Year 199510
2. AMS Eastern Laboratory, Gastonia, NC set is ready to be homogenized.
Pesticide: Abamectin Upon arrival at the testing facility, samples are visuallyCommodities: Oranges examined for acceptability and discarded if determined to
Pesticide: Formetanate samples are then prepared emulating the practices of theCommodities: Apples (Jan.-July), Oranges, and average consumer, to more closely represent actual
Peaches (Jan.-July) exposure to residues. Fresh samples are prepared as 3. APHIS, NMRAL, Gulfport, MS, and Selected State follows: (1) apples and peaches are washed and cored;Laboratories (2) bananas and oranges are peeled; (3) carrots and
Pesticide: 2,4-D (Jan.-June) removed; (5) green beans and grapes are washed andCommodities: Peaches, Sweet Peas, and Sweet stems removed; and (6) wheat is ground and then
Corn analyzed. For processed commodities, the entire contents
4. APHIS, NMRAL, Gulfport MS, and the Washington present.State Laboratory, Yakima, WA
Pesticide: Fenbutatin Oxide (Hexakis) and and separated into analytical portions (aliquots) formetabolites (July-Dec.) analysis. If testing cannot be performed immediately, the
Commodities: Apples, Grapes, Oranges, and entire analytical set (sample set plus all quality controlPeaches samples) is frozen at -40E C, or lower, according to
PDP's QA/QC requirements. Surplus aliquots, not used�� Quality Assurance Program for the initial testing, are retained frozen in the event that
The main objectives of the quality assurance/qualitycontrol (QA/QC) program are to ensure the reliability ofPDP data and the performance equivalency of theparticipating laboratories. Direction for PDP's QAProgram is provided through SOPs based on EPA's GoodLaboratory Practices (GLPs). For day-to-day qualityassurance oversight, PDP relies on the Quality AssuranceUnit (QAU) at each participating facility. As requiredunder EPA’s GLPs, the QAU operates independentlyfrom their laboratory staff. Preliminary QA/QC reviewprocedures are performed on-site by each laboratory'sQAU. Final review procedures are performed by PDPstaff, who are responsible for collating and reviewingdata for conformance with SOPs. Additionally, PDPstaff also monitors the participants' performance throughproficiency samples, QAU quarterly internal reviews, andon-site visits. Additional information on PDP's QAProgram is provided in Appendix B.
�� Sample Preparation
Laboratories are permitted to refrigerate fresh incomingsamples of the same commodity for up to 72 hours, toallow for different sample arrival times from thecollection sites. Frozen and canned commodities can be
held in storage (freezer or shelf) until the entire sample
be inedible (decayed, extensively bruised). Accepted
potatoes are washed; (4) spinach is washed with inedibles
of the sample is homogenized--including any liquid
Samples are homogenized using choppers and/or blenders
replication of analysis or verification testing is needed.
�� Sample Analysis
For analysis of fruit and vegetables, variations of theLuke I and II extraction procedures developed by FDAwere used by Florida, Michigan, New York, NorthCarolina, Ohio, and Texas. California and Washingtonused the multiresidue method developed by the CaliforniaDepartment of Food and Agriculture. These two methodswere determined to produce equivalent data for PDPanalytical purposes. Residues are extracted from samplesusing organic solvents followed by various cleanupprocedures. Selective residue methods, used for 2,4-D,abamectin, benomyl, fenbutatin oxide (hexakis), andformetanate, were independently validated by thelaboratory(ies) performing analysis.
Various types of chromatography are used for the initialidentification and quantitation of pesticides.Confirmation is accomplished by mass spectrometry orby alternate detection systems, depending on theconcentration reported. Limits of detection for variousselective detectors are lower than those achieved by massspectrometry detectors. Confirmation is deemednecessary due to the complexity of commodity matrices

Pesticide Data Program - Annual Summary Calendar Year 199511
and the low concentration levels of detected residues. PDP sampling procedures require that the same numberThe confirmatory analysis provides an extra measure of of samples be collected each month. As a result, theconfidence in the identification of both the pesticide relative sample composition for these seasonalresidue and its concentration. commodities may not exactly match product availability
Analysis of wheat samples were performed by the GIPSA pronounced example of this (limited availability in Aprillaboratory for 23 pesticides and 5 metabolites/isomers in and November, including both domestically grown andPDP. Extraction was accomplished using supercritical imported peaches). According to independent USDAfluid extraction (a solventless system) coupled with mass data (Fresh Fruit and Vegetable Arrival Totals for 22spectrometry detection or post-column high performance Cities-FVAS-3 Calendar Year 1995, published in 1996liquid chromatography detection. by Fruit and Vegetable Division, AMS, Washington, DC)
IV. Sample Results and Discussion
�� Sample Results
During 1995, most pesticide residue detections werebelow tolerance levels established by EPA. A toleranceis the maximum allowable quantity of a pesticide residuefor a particular commodity. In PDP, the limits ofdetection for each pesticide/commodity pair in the testingsystem is analytically defined at levels low enough toconduct realistic dietary risk assessments. This enablesscientists using PDP data to consider not only residuedetection findings, but also the inverse, non-detectedresidues, in calculating dietary risk. Hence, riskassessment evaluations by EPA in the reregistrationprocess can be based on the range of levels detected,including non-detected residues for each of thepesticide/commodity pairs tested. This is illustrated inAppendixes C, D, E, and G.
Appendix C shows the distribution of detected residuesper pesticide per commodity. Also shown are theminimum and maximum concentrations detected,tolerances, and samples for which there is no toleranceestablished or for which the concentration detectedexceeds the tolerance. Non-detected residues for each ofthe pesticide/commodity pairs tested are shown inAppendix E.
�� National Estimates
One objective of PDP is to use the data collected by thenine participating States, which represent approximately50 percent of the Nation’s population (Figure 2), toproject national estimates of pesticide residues forProgram commodities. Some of these national estimatesare shown in Appendix D. Although the availability ofcertain commodities may vary, depending on the season,
throughout the year. Availability of peaches is the most
approximately 88 percent of all peaches available forconsumption in 1995 arrived at wholesalers during theMay-September time period. However, during this 5-month time period, PDP collected only 65 percent of theyearly total, or 23 percent less than what USDA’s figuresindicate was nationally available. This percentage is stillsubstantially higher than the 42 percent scheduled forcollection if peaches were readily available throughoutthe year. Consequently, the fact that peaches are notavailable consistently from month-to-month actuallyprovides an automatic adjustment to the monthly samplenumbers, causing them to more closely represent nationalavailability. To further adjust for the remainingdifference in actual sample numbers versus availability,the sampling data have been weighted to reflect U.S.wholesale arrivals. For more information on theweighting process used to determine national estimates,and on the statistical attributes of those estimates, refer toKott, P.S., 1996, Estimating Pesticide Residues inSelected Fruits and Vegetables for the 1994 PesticideData Program; National Agricultural Statistics Service;Washington, DC. (The methods used in the 1994 and1995 programs were identical.)
Appendix D focuses on the 52 pesticide/commodity pairswith detectable residues in at least 10 percent of thesamples tested. A range of values for the estimatednational mean (or average) level of residue concentrationfor each pair is provided. The lower value for the rangewas determined by treating a sample without detectableresidues as if it had a residue concentration equal to zero.The upper value for the range was determined by treatingsuch a sample as if it had a residue concentration equal tothe limit of detection. In addition, Appendix D alsoprovides national estimates for the 50th, 75th, and 90thpercentiles for each of the pairs. The ratio of the 90thpercentile to the tolerance, as a normalization factor, isalso shown. This demonstrates that, in most cases, thelevels of detected residues are a small fraction of thetolerances for the listed pesticide/commodity pairs.

Pesticide Data Program - Annual Summary Calendar Year 199512
been prohibited in the United States since 1972.�� Post-Harvest Applications However, due to the persistence of this chemical in the
Before PDP began collecting data, most availableinformation on pesticide use in the United States waslimited to pesticides applied to sustain agriculturalproduction (pre-harvest applications). Little was known
about pesticides applied to preserve the fruit andvegetable products after harvest (post-harvestapplications). PDP’s database has since become one ofthe most comprehensive sources of post-harvest pesticideuse patterns because samples are collected at pointswhere such uses have already taken place. Most post-harvest applications are confined to fungicides (to controlmold and fungus) and growth regulators (to preventsprouting). PDP compounds with mostly post-harvestapplications are the fungicides diphenylamine, o-phenylphenol, thiabendazole, and the growth regulatorchlorpropham. Other compounds with post-harvest useson selected commodities are the fungicides dicloran(carrots and peaches) and imazalil (citrus).Consequently, residues from these pesticides can beassumed to result from post-harvest applications. Toillustrate the impact of post-harvest uses, detectionsincluding and excluding residues of these compounds arelisted in Tables 3A and 3B, respectively. Significantdifferences in the number of residue detections as a resultof post-harvest uses are in apples, bananas, oranges,potatoes, and, to a lesser extent, peaches. As these tablesindicate, the 5 fungicides listed above, along withchlorpropham, accounted for 2,870 detections (29percent of the number of residue detections in fruit andvegetables). The pesticide most frequently found in fruitand potatoes (1,146 detections) was the fungicidethiabendazole, representing about 11 percent of alldetections. Wheat data presented in Appendix Gindicates that the most frequently pesticides found werechlorpyrifos, chlorpyrifos methyl, and malathion. Thesethree pesticides have pre- and post-harvest uses in wheat.These three pesticides account for 868 (96 percent) of the904 residue detections in the 600 wheat samples tested.Malathion, the most prevalently detected residue, wasfound in 71 percent of the wheat samples tested.
�� Environmental Contaminants
DDT, DDD, and DDE
A total of 6,873 fruit and vegetable samples werescreened for DDE metabolite of DDT. Use of DDT has
environment, residues of the DDE metabolite weredetected in 10 percent of all samples tested. In somesamples, the parent DDT and the DDD metabolite werealso reported. Residues were found primarily in soilcrops, carrots (37.6 percent), potatoes (15.0 percent),

Pesticide Data Program - Annual Summary Calendar Year 199513
Table 3A. Number of Samples and Residues Detected (Includes Post-Harvest Applications)
Total Samples % of Samples Different TotalSamples with Residues with Pesticides Residues ResidueAnalyzed Detected Detected Detected Detections
Fresh Fruits and Vegetables:
Apples 695 657 95 30 2,097
Bananas 486 300 62 3 325
Carrots 703 498 71 29 1,005
Grapes 694 552 80 31 1,331
Green Beans 587 332 57 28 696
Oranges 700 589 84 17 1,086
Peaches 377 347 92 31 1,076
Potatoes 707 588 83 18 987
Spinach 634 526 83 34 1,254
Processed Vegetables:
Sweet Corn 671 3 0 2 3
Sweet Peas 670 106 16 9 155
Number of Samples Analyzed = 6,924Number of Samples with Pesticides Detected = 4,498Percent with Pesticide Detections = 65.0%Total Number of Residue Detections = 10,015Total Number of Different Residues = 69
Grain:*
Wheat 600 475 79 10 904
* Includes pre- and post-harvest uses for chlorpyrifos, chlorpyrifos methyl and malathion

Pesticide Data Program - Annual Summary Calendar Year 199514
Table 3B. Number of Samples and Residues Detected (Excludes Post-harvest Applications)*
Total Samples % of Samples Different TotalSamples with Residues with Pesticides Residues ResidueAnalyzed Detected Detected Detected Detections
Fresh Fruits and Vegetables:
Apples 695 556 80 27 1,215
Bananas 486 73 15 1 73
Carrots 703 498 71 26 997
Grapes 694 552 80 28 1,328
Green Beans 587 325 55 27 677
Oranges 700 167 24 14 197
Peaches 377 344 91 26 914
Potatoes 707 225 32 14 343
Spinach 634 526 83 34 1,253
Processed Vegetables:
Sweet Corn 671 1 0 1 1
Sweet Peas 670 98 15 8 147
Number of Samples Analyzed = 6,924Number of Samples with Pesticides Detected = 3,365Percent with Pesticide Detections = 48.6%Total Number of Residue Detections = 7,145Total Number of Different Residues = 65
* Chlorpropham, Dicloran (carrots and peaches), Diphenylamine, Imazalil (citrus), o-Phenylphenol, and Thiabendazole

Pesticide Data Program - Annual Summary Calendar Year 199515
and spinach 49.2 percent). No findings were above the Appendices E and G (Part II) show the number of non-allowable levels established by FDA. DDE was not in detected residues by pesticide/commodity pair. Therethe testing profile for wheat. were other pesticide/commodity pairs with non-detected
�� Single/Selective Residue Analyses they did not meet the criteria given above (i.e.,
2,4-D
A total of 722 samples were tested for 2,4-D.Commodities tested were peaches, peas, potatoes, andsweet corn. No 2,4-D residues were detected.
ABAMECTIN
A total of 688 samples of oranges were tested forabamectin. No residues were detected in any of thesamples tested.
BENOMYL
A total of 3,575 samples of carrots, grapes, oranges, �� Multiple Residues Detectionspeaches, spinach, and sweet corn were tested forbenomyl, as the carbendazim metabolite. Carbendazim The PDP database provides information that can be usedresidues were detected in 0.5 percent of the samples by EPA in evaluating the incidence of multiple residues.tested. These residues found in carrots, grapes, and These mutiple residues may derive from various sources,peaches were at levels below the established tolerances. such as applications of more than one pesticide on a crop
FENBUTATIN OXIDE (HEXAKIS) persistent environmental residues. The multiple residue
A total of 1,187 samples of apples, grapes, oranges, and 1993 National Research Council report, Pesticides inpeaches were tested for Fenbutatin Oxide, and 2 of its the Diets of Infants and Children, which recommendedmetabolites. Fenbutatin Oxide residues were found in that coordinated recording of multiple residue scans6.5 percent of the samples tested. None were above would make possible more accurate evaluation ofEPA established tolerances. exposure distributions for multiple chemicals.
FORMETANATE The distribution of multiple residues in PDP’s database
A total of 1,019 samples of apples, oranges, and peaches individual or multiple residues depends on the actualwere tested for formetanate. Approximately 5 percent of levels of the residues detected. PDP’s 1995 datathe samples were found to contain residues of this indicate that the total pesticide level in a sample iscompound, all at levels below the established tolerance. independent of the number of residues detected.
�� Non-Detected Residues number of residues and presumptive tolerance
Approximately 35 percent of the samples analyzed hadno detectable levels of pesticide residues. If post-harvest �� Presumptive Tolerance Violations applications of pesticides are excluded, the percentagebecomes approximately 51. Non-detected residues couldhappen because a pesticide was not applied, because itdissipates rapidly, or for various other reasons.
residues which were not included in Appendix E because
established tolerances or EPA requested) or because theywere analyzed by fewer than five of PDP laboratories.
Three pesticides, abamectin, fenamiphos, and terbufos,in the PDP fruit and vegetable testing system, Table 1-Part IA, were not detected in any of the samples tested.Abamectin undergoes rapid photolysis and degradationby soil microorganisms. Fenamiphos dissipates fairlyquickly and likely was not present at detectable levels atthe time samples were collected. Terbufos is not widelyused in either of the two commodities for which it isregistered. In Appendix G-Part II , 13 of the 23pesticides referenced in Table 1-Part II for the wheattesting profile were not detected.
during a growing season, possible spray drift, or
information is particularly useful in responding to the
is included as Appendix F. Any exposure assessment of
Furthermore, there is no relationship between the
violations.
Tolerances are defined under Section 408 of the FederalFood, Drug, and Cosmetic Act as the maximum quantityof a pesticide residue allowable on a raw agricultural

Pesticide Data Program - Annual Summary Calendar Year 199516
commodity. Tolerances are established by EPA for �� Synopsispesticides used on food crops. A violation occurs whena residue is found which exceeds the tolerance level orwhen a residue is found for which there is no tolerancefor that particular crop. With the exception of meat,poultry, and egg products, for which USDA isresponsible, tolerances for all other foods are enforcedby FDA. When agencies with regulatory enforcementauthority collect samples for tolerance enforcementpurposes, they must adhere to a quick turnaround timeand chain of custody protocols which allow them todetain the sampled lot until results are available.
PDP is not an enforcement program. Consequently,sample analysis does not have to be completed quickly(emphasis is placed on searching for residues at thelowest detectable levels--not on quick turnaround time)and sample collection does not interfere with commoditydistribution. Therefore, when samples are reported tohave residues, for which there is no tolerance establishedor which exceed the tolerance, they are designated as“presumptive tolerance violations” and reported as suchto FDA regional and headquarters offices. This is donein accordance with a Memorandum of Understandingbetween USDA and FDA for the purpose of pinpointingareas where closer surveillance may be needed. FDAenforcement action on PDP samples generally is not aviable option due to the time lag from sample collectionto data reporting. Presumptive tolerance violations for1995 data are indicated in Appendix C and are discussedon the cover page.
In 1995, a total of 6,873 fruit and vegetable (plus 51samples for SRM analysis) and 600 wheat samples wereanalyzed using MRMs. Analysis using SRMs wasperformed in certain commodities only. Accordingly,688 samples were tested for abamectin; 722 were testedfor 2,4-D; 3,575 were tested for benomyl; 1,187 forfenbutatin oxide; and 1,019 for formetanate. Pesticidesdetected included insecticides, herbicides, fungicides,and growth regulators. Also detected were DDT and itsmetabolites, although their presence is almost certainlydue to environmental contamination, not the result ofprohibited crop application.
Approximately 83 percent of samples tested weredomestic, and 16.5 percent were imported (0.5 percentwere of unknown origin). Of all fruit and vegetablesamples tested, 263 (3.8 percent) were reported aspresumptive tolerance violations, although most of thesewere for residues where no tolerance was established.There were no reported wheat sample violations. Forfruit and vegetables, 65 percent of the samples containedat least one residue, whereas 79 percent of the 600 wheatsamples contained at least one residue. It was alsoobserved that, for certain commodities, post-harvestapplications contribute significantly to the number ofresidues detected. Overall, levels of residues detectedwere below tolerances.
For more information on the Pesticide Data Program,contact William J. Franks, Jr., Director, AMS Scienceand Technology Division, at (202) 720-5231; or RobertL. Epstein, Deputy Director, at (202) 720-2158. Youmay also reach them by facsimile at (202) 720-6496.
ggggggMay 1997
The United States Department of Agriculture (USDA) prohibits discrimination in its programs on the basis of race, color, nationalorigin, sex, religion, age, disability, political beliefs, and marital or familial status. (Not all prohibited bases apply to all programs.) Persons with disabilities who require alternative means for communication of program information (Braille, large print, audiotape,etc.) should contact the USDA Office of Communications at (202) 720-2791.
To file a complaint, write the Secretary of Agriculture, U.S. Department of Agriculture, Washington, DC 20250, or call 800-245-6340 (voice) or (202) 720-1127 (TDD). USDA is an equal employment opportunity employer.

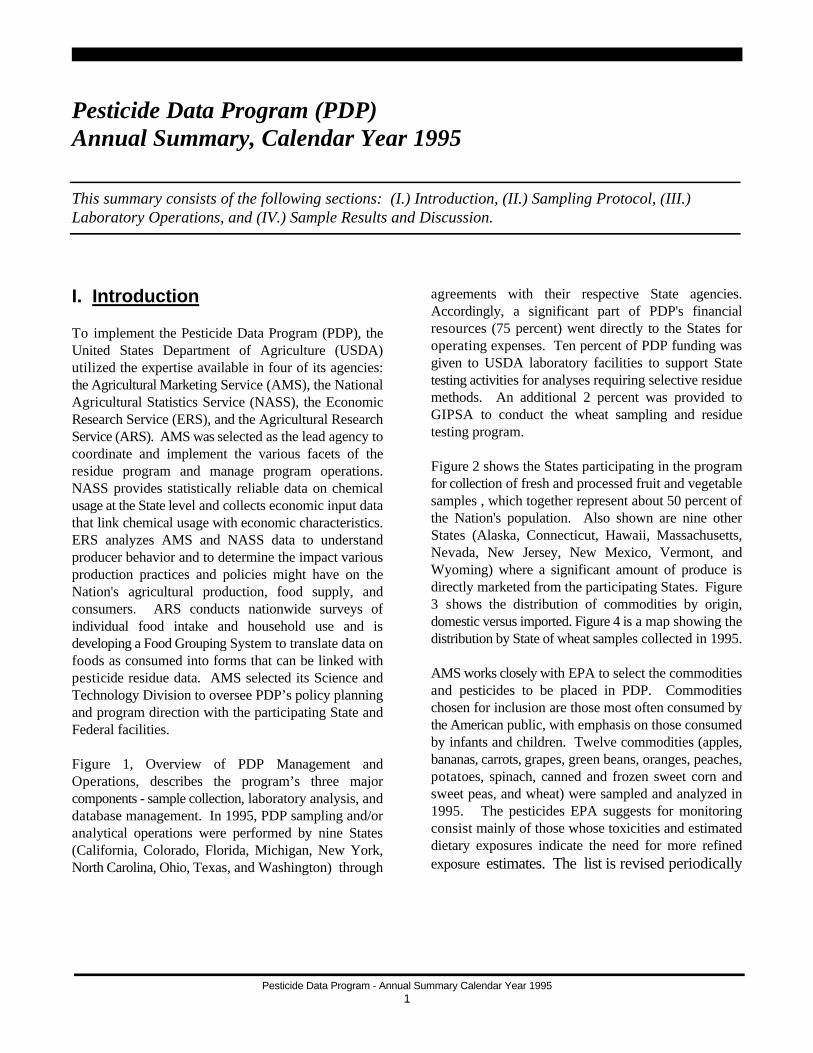
Appendix A
Sample Origin by Grower, Packer, or Distributor
Appendix A gives the number of samples per State or country of origin and thenumber of samples of unknown origin. Where available, origin of fresh commodities isdetermined by grower or packer information. For processed commodities, origin isdetermined primarily by packer or distributor.
As shown in Appendix A, samples collected and analyzed during 1995 originatedfrom 39 States and 17 foreign countries.
APPENDIX A. SAMPLE ORIGIN BY GROWER, PACKER, OR DISTRIBUTOR(Number of Samples per State/Country)
No. of % of
Part1. AP BN CR CS GB GR OG PC PO PS SP Domestic TotalStates = 39 Domestic Samples
Alabama 1 1 <0.1Arizona 18 2 5 3 4 3 5 40 0.7California 63 445 176 137 369 563 165 124 196 402 2640 45.9Colorado 4 28 2 4 1 1 2 36 3 22 103 1.2Delaware 10 10 0.2Florida 21 25 159 101 1 33 23 16 379 6.6Georgia 1 10 38 1 11 7 1 69 1.2Idaho 13 1 26 1 148 30 219 3.8Illinois 49 2 3 45 1 100 1.7
Indiana 2 1 3 0.1Kentucky 1 1 <0.1Louisiana 1 2 3 0.1Maine 2 3 8 2 1 16 0.3Maryland 2 1 1 3 7 0.1Massachusetts 2 3 2 4 11 0.2Michigan 52 80 23 11 4 1 3 36 23 38 271 4.7Minnesota 77 17 65 159 2.8Missouri 1 1 <0.1Montana 6 6 0.1
Nebraska 3 3 0.1Nevada 1 5 6 0.1New Hampshire 2 2 <0.1New Jersey 1 1 2 8 14 2 4 13 45 0.8New York 61 5 40 12 2 2 55 33 15 225 3.9North Carolina 7 1 9 37 1 1 3 11 5 75 1.3North Dakota 6 6 0.1Ohio 11 7 22 15 9 13 77 1.3Oklahoma 22 24 46 0.8Oregon 11 4 31 2 41 32 3 124 2.2
Pennsylvania 8 16 1 5 1 12 10 53 0.9South Carolina 3 7 29 7 2 48 0.8Tennessee 19 25 18 1 63 1.1Texas 4 13 42 12 15 3 31 50 43 213 3.7Utah 1 3 4 8 0.1Vermont 2 1 1 4 0.1Virginia 4 6 3 7 10 30 0.5Washington 407 23 11 6 1 13 90 12 8 571 9.9West Virginia 1 2 1 4 0.1Wisconsin 45 18 44 107 1.9
No. of Domestics 661 0 648 651 483 382 689 256 702 660 617 5749 --
% of Total (nearest %) 95 0 92 97 82 55 98 68 99 99 97 83.0
Page 1 of 2

No. of % of Part 2. AP BN CR CS GB GR OG PC PO PS SP Import TotalCountries = 17 Imported Samples
Argentina 3 3 0.3Australia 2 7 9 0.8Brazil 2 2 0.2Canada 8 35 16 4 5 7 75 6.6Chile 4 257 118 379 33.2Colombia 54 54 4.7Costa Rica 125 125 10.9Equador 153 153 13.4Guatemala 46 46 4.0Honduras 47 47 4.1Israel 1 1 <0.1Mexico 16 19 80 46 2 14 177 15.5New Zealand 13 1 14 1.2Nicaragua 6 6 0.5Panama 21 21 1.8Peru 1 1 <0.1South Africa 5 5 10 0.9Unknown Country 1 18 1 20 1.7
No. of Import 34 486 54 18 84 312 10 119 5 7 14 1143
% of Total (nearest %) 5 100 8 3 14 45 1 32 1 1 2 16.5
No. of % of Part 3. AP BN CR CS GB GR OG PC PO PS SP Unknown Total
No. of Unknown Origin 1 2 20 1 2 3 3 32 --
% of Total (nearest %) 0 0 <1 <1 3 0 <1 <1 0 <1 <1 0.5
GRAND TOTALS = 695 486 703 671 587 694 700 377 707 670 634 6924
CommoditiesAP = ApplesBN = BananasCR = CarrotsCS = Sweet CornGB = Green BeansGR = GrapesOG = OrangesPC = PeachesPO = PotatoesPS = Sweet PeasSP = Spinach
Page 2 of 2

Appendix B
Quality Assurance Program Elements
PDP’s Quality Assurance (QA) program covers all aspects of data gathering, fromsample collection to data reporting. QA protocols for sampling are designed to protectsample integrity from the time of collection to the time of delivery to the testing facilities. QA protocols for testing comprise all laboratory operations from the time of samplereceipt to the time data are reported to PDP’s central database. As described in thisappendix, the QA program has five elements: 1) Standard Operating Procedures; 2)On-site reviews; 3) Proficiency Check Samples; 4) Quality Control Procedures; and5) Method Performance and Confirmation Procedures.

APPENDIX B. QUALITY ASSURANCE PROGRAM ELEMENTS
1. Standard Operating Procedures - Written SOPs are in place to provide uniform administrative, sampling, andlaboratory procedures. SOPs are revised annually to accommodate changes in the program. Beforesubmission, data are reviewed by each Quality Assurance Unit for completeness and adherence to PDPrequirements.
2. On-site Reviews - On-site reviews are performed to determine compliance with SOPs. Improvements insampling, chain of custody, recordkeeping, and laboratory procedures are made as a result of on-site reviews.
3. Proficiency Check Samples - All facilities are required to participate in PDP's Check Sample Program. Check samples are issued to laboratories performing analysis with multiresidue methods and/or single/selectiveresidue methods. Periodically, one to four prepared commodities, containing pesticide(s) of known quantities, aresent to the participating laboratories and tested under the same conditions as routine samples. The resultingdata are used to determine performance equivalency among the testing laboratories, and to evaluate individuallaboratory performance. During 1995, PDP laboratories received 2 proficiency sample sets consisting of 6samples for multiresidue screening, 6 sets for single/selective residue screening, and a wheat multiresidue set.
4. Quality Control Procedures - PDP operating procedures for quality control (QC) are intended to assessmethod and analyst performance during sample preparation, clean-up, extraction, and, where applicable,derivatization. To maximize sample output and decrease the QC/sample ratio, samples are analyzed in analyticalsets, which include the sample set and the following components.
a. Reagent Blank: An amount of distilled water, equivalent to the natural moisture content of thecommodity, is run through the entire analytical process to determine glassware cleanliness and systemintegrity.
b. Matrix Blank: A previously analyzed sample of the same commodity, which contains either very lowconcentrations of known residues or no detectable residues, is divided into two portions. The first portionis used to give background information on naturally occurring chemicals, and the second one is used toprepare a matrix spike.
c. Matrix Spike(s): Prior to extraction, a portion(s) of matrix blank is spiked with marker pesticides todetermine the accuracy of the analyst and instrument performance. Marker pesticides are compoundsselected from different pesticide classes (organochlorines, organophosphates, carbamates), which havephysical and chemical characteristics similar to those in the class they represent. The use of markerpesticides to monitor recoveries is a modification of PDP’s previous requirements that called for spikingwith all pesticides. Because of the large number of pesticides in the program, spiking with all compoundsrequired several spike mixtures (to avert coelution problems), which, in turn, resulted in lengthy run times.
d. Process Control Spike: A compound of physical and chemical characteristics, similar to those ofthe pesticides being tested, is used to evaluate the analytical process on a sample-by-sample basis. Each of the analytical set components, except the reagent and matrix blanks, is spiked with processcontrols.
e. Storage Spikes: If a sample set is going to be frozen as a homogenate for more than 72 hours priorto analysis, analysts are required to prepare storage spikes. Storage spikes provide information onwhether degradation has occurred while the sample was frozen, and are prepared in the same manneras matrix spikes. However, they do not replace the requirement to run a fresh matrix spike at the time ofanalysis.
5. Method Performance and Confirmation Procedures - Laboratories are required to determine the limits ofdetection (LOD) and limits of quantitation (LOQ) for each commodity/pesticide pair. LODs depend on matrix,analyte, and detector used, and range from 0.001 to 0.150 ppm. (Information on specific LODs and LOQs isavailable upon request.) Confirmation by mass spectrometry, or a suitable alternate detection system, is requiredfor all initial determinations. If a detected residue does not have a tolerance, or it exceeds the establishedtolerance, the sample is reanalyzed in duplicate from the frozen homogenate, along with the appropriate blanksand a spike of the residue at the suspected level.
Page 1 of 1

Appendix C
Distribution of Residues Detected by Pesticide
Appendix C shows residue detections for all pesticide/commodity pairs tested,including minimum and maximum concentrations reported and whether a tolerance isestablished for each pair.
In 1995, 6,924 samples were analyzed. A total of 263 samples (3.8 percent)were reported as presumptive violations. Nine samples (0.13 percent) exceeded theestablished EPA tolerance for the pesticide/commodity pair and 254 samples (3.7percent) were reported for which no EPA tolerance was established. Domesticcommodities accounted for 231 samples (87.8 percent). Imported commoditiesaccounted for 26 samples (9.9 percent). Unknown origin commodities accounted for 6samples (2.3 percent) of the presumptive violation samples.
Presumptive violations were reported for 316 residues, 9 residues (2.8 percent)exceeded an established EPA tolerance and 307 residues (97.2 percent) were reportedfor which there is no EPA tolerance. Approximately half of the reported presumptiveviolations (163) were in spinach.
Pesticide residue established tolerances for pesticide/commodity pairs in PDPspan several orders of magnitude--from 0.05 ppm for chlorpyrifos/peaches, to 60.0 ppmfor iprodione/grapes. Of the 263 reported samples containing violations (316 individualviolations), 186 samples contained a single residue, 26 samples contained tworesidues, 7 samples contained three residues, and 1 sample contained 4 residueviolations.
In some cases, a tolerance may or may not apply, depending on whether certainconditions are met. For example, residues of methamidophos in green beans arecovered by a tolerance only if residues of acephate are also present. Of the 112 greenbean samples found to contain residues of methamidophos, 108 were found incombination with acephate. Only four samples had methamidophos residues whereacephate was not present and were reported as presumptive violations.

APPENDIX C. DISTRIBUTION OF RESIDUES DETECTEDBY PESTICIDE
Number No. of % of Minimum Maximumof Samples Samples with Samples with Value Value Tolerance
Pesticide Screened Detections Detections Detected, ppm Detected, ppm Level, ppm
1. AcephateCarrots (V-3) 701 3 0.4 0.006 0.021 NTGrapes (V-1) 690 1 0.1 0.006 0.006 NTGreen Beans 587 120 20.4 0.005 2.2 3Spinach (V-29) 609 29 4.8 0.005 0.19 NT
Total 153
2. Aldicarb sulfoxide (metabolite)Oranges 691 1 0.1 0.015 0.015 0.3
Total 1
3. AtrazineSpinach (V-2) 610 2 0.3 0.030 0.030 NT
Total 2
4. Azinphos methylApples 691 320 46.3 0.010 0.46 2.0Grapes 690 3 0.4 0.010 0.17 5.0Green Beans 587 4 0.7 0.010 0.051 2.0Oranges 691 1 0.1 0.073 0.073 2.0Peaches 367 102 27.8 0.010 0.24 2.0
Total 430
5. Benomyl (analyzed as carbendazim)Carrots 700 3 0.4 0.084 0.084 0.2Grapes 688 9 1.3 0.084 0.48 10.0Peaches 371 6 1.6 0.084 1.1 15.0
Total 18
6. CaptanApples 691 98 14.2 0.010 2.0 25Carrots 555 3 0.5 0.010 0.020 2Grapes 689 255 37.0 0.010 2.8 50Green Beans 438 13 3.0 0.013 0.20 25Peaches 367 60 16.3 0.010 1.5 50
Total 429
Page 1 of 10

Number No. of % of Minimum Maximumof Samples Samples with Samples with Value Value Tolerance
Pesticide Screened Detections Detections Detected, ppm Detected, ppm Level, ppm
7. CarbarylApples 693 76 11.0 0.010 0.74 10Grapes 690 19 2.8 0.011 0.38 10Green Beans 586 18 3.1 0.011 1.6 10Oranges 691 71 10.3 0.010 0.19 10Peaches 367 54 14.7 0.10 4.8 10Spinach 610 8 1.3 0.010 0.11 12Sweet Peas 670 8 1.2 0.010 0.37 10
Total 254
8. Carbofuran (parent only)Grapes 690 3 0.4 0.015 0.052 0.4
Total 3
Carbofuran (parent and metabolite)Spinach (V-1) 610 1 0.2 0.17 0.17 NT
Total 1
3-Hydroxycarbofuran (without parent)Grapes (X-3) 690 5 0.7 0.021 0.42 0.2
Total 5
9. ChlorothalonilGreen Beans 587 84 14.3 0.010 1.1 5Peaches 353 1 0.3 0.065 0.065 0.5Spinach (V-7) 597 7 1.2 0.009 0.052 NT
Total 92
10. ChlorprophamGrapes (V-1) 689 1 0.1 0.027 0.027 NTGreen Beans 587 19 3.2 0.029 0.21 5Peaches (V-1) 367 1 0.3 0.013 0.013 NTPotatoes 707 482 68.2 0.013 11 50
Total 503
11. ChlorpyrifosApples 692 153 22.1 0.005 0.42 1.5Carrots (V-6) 701 6 0.9 0.005 0.019 NTGrapes (V-9) 690 56 8.1 0.005 0.16 0.5 ROranges 691 50 7.2 0.005 0.019 1.0Peaches 367 60 16.3 0.005 0.034 0.05Spinach (V-46) 610 46 7.5 0.005 0.11 NT
Total 371
12. CypermethrinSpinach (V-2) 288 2 0.7 0.11 0.49 NT Total 2
Page 2 of 10

Number No. of % of Minimum Maximumof Samples Samples with Samples with Value Value Tolerance
Pesticide Screened Detections Detections Detected, ppm Detected, ppm Level, ppm
13. Dacthal (DCPA)Green Beans 584 29 5.0 0.003 0.12 2Spinach (V-30) 610 30 4.9 0.003 0.10 NT
Total 59
14. DDT (parent)Carrots 265 21 7.9 0.010 0.026 3 #Grapes 348 1 0.3 0.010 0.010 0.5 #Green Beans 228 1 0.4 0.010 0.010 0.2 #Potatoes 393 41 10.4 0.010 0.013 1 #Spinach 517 86 16.6 0.005 0.11 0.5 #
Total 150
DDD (metabolite)Carrots 266 3 1.1 0.002 0.006 3 #Spinach 516 8 1.6 0.002 0.020 0.5 #
Total 11
DDE (metabolite)Carrots 701 263 37.6 0.004 0.21 3 #Grapes 690 11 1.6 0.004 0.012 0.5 #Green Beans 587 8 1.4 0.004 0.023 0.2 #Peaches 367 1 0.3 0.005 0.005 0.2 #Potatoes 707 106 15.0 0.004 0.037 1 #Spinach 610 300 49.2 0.004 0.54 0.5 #
Total 689
15. Demeton S SulfoneGreen Beans (V-4) 77 4 5.2 0.010 0.038 NTPotatoes (V-3) 148 3 2.0 0.010 0.030 NTSpinach (V-1) 70 1 1.4 0.010 0.010 NT
Total 8
16. DiazinonApples 693 7 1.0 0.005 0.020 0.5Carrots 700 26 3.7 0.005 0.086 0.75Grapes 690 7 1.0 0.005 0.037 0.75Green Beans (X-1) 587 3 0.5 0.011 1.1 0.5Peaches 367 23 6.3 0.005 0.16 0.7Spinach 609 18 3.0 0.005 0.39 0.7Sweet Peas 670 7 1.0 0.005 0.049 0.5
Total 91
Page 3 of 10

Number No. of % of Minimum Maximumof Samples Samples with Samples with Value Value Tolerance
Pesticide Screened Detections Detections Detected, ppm Detected, ppm Level, ppm
17. DicloranApples (V-2) 693 2 0.3 0.005 0.005 NTCarrots 701 3 0.4 0.010 0.45 10Grapes 690 18 2.6 0.010 1.2 10Green Beans 587 3 0.5 0.13 0.71 20Peaches 367 156 42.5 0.005 12 20Spinach (V-13) 610 13 2.1 0.005 0.02 NT
Total 195
18. DicofolApples 692 7 1.0 0.008 0.48 5Grapes 688 43 6.3 0.008 1.9 5Green Beans 587 1 0.2 0.008 0.008 5Oranges 691 1 0.1 0.008 0.008 10Peaches 367 4 1.1 0.25 0.40 10
Total 56
19. DieldrinSpinach 133 2 1.5 0.005 0.020 0.05 # Total 2
20. Dimethoate (see omethoate)Apples 693 26 3.8 0.004 0.43 2Grapes 689 93 13.5 0.004 1.1 1Green Beans 587 24 4.1 0.004 0.78 2Oranges 691 3 0.4 0.004 0.005 2Peaches (V-4) 367 4 1.1 0.004 0.35 NTSpinach (X-1) 609 31 5.1 0.004 11 2Sweet Peas 670 77 11.5 0.004 0.074 2
Total 258
21. DiphenylamineApples 691 489 70.8 0.013 5.1 10Bananas (V-1) 479 1 0.2 0.15 0.15 NTGrapes (V-1) 677 1 0.1 0.014 0.014 NTPeaches (V-1) 285 1 0.4 0.017 0.017 NTPotatoes (V-1) 692 1 0.1 0.057 0.057 NT
Total 493
4-Hydroxydiphenylamine (metabolite)Apples 5 5 100.0 0.28 0.52 10
Total 5
22. Disulfoton (parent)Apples (V-1) 693 1 0.1 0.11 0.11 NTPotatoes 707 1 0.1 0.005 0.005 0.75
Total 2
Page 4 of 10

Number No. of % of Minimum Maximumof Samples Samples with Samples with Value Value Tolerance
Pesticide Screened Detections Detections Detected, ppm Detected, ppm Level, ppm
23. EndosulfansApples 693 46 6.6 0.005 0.15 2.0Carrots 701 25 3.6 0.005 0.024 0.2Grapes 690 28 4.1 0.003 0.22 2.0Green Beans 587 139 23.7 0.003 0.77 2.0Oranges (V-14) 691 14 2.0 0.003 0.005 NTPeaches 367 29 7.9 0.003 0.18 2.0Potatoes 707 137 19.4 0.003 0.096 0.2Spinach 610 87 14.3 0.003 1.8 2.0Sweet Corn 671 1 0.1 0.003 0.003 0.2Sweet Peas 670 2 0.3 0.008 0.009 2.0
Total 508
24. EsfenvalerateApples 551 2 0.4 0.036 0.036 2.0Carrots 561 2 0.4 0.020 0.020 0.5Green Beans 474 23 4.9 0.020 0.16 2.0Peaches 202 4 2.0 0.020 0.090 10 Total 31
FenvalerateApples 693 1 0.1 0.17 0.17 2.0Carrots 701 1 0.1 0.020 0.020 0.5Grapes (V-1) 690 1 0.1 0.070 0.070 NTGreen Beans 587 1 0.2 0.020 0.020 2.0Peaches 362 2 0.6 0.020 0.038 10.0Spinach (V-1) 570 1 0.2 0.038 0.038 NT Total 7
25. EthionOranges 691 5 0.7 0.002 0.002 2.0
Total 5
26. Fenbutatin OxideApples 351 13 3.7 0.005 0.51 15.0Grapes 324 42 13.0 0.005 1.5 5Oranges 345 3 0.9 0.005 0.005 20.0Peaches 167 20 12.0 0.005 0.41 10.0
Total 78
27. Formetanate HydrochlorideApples 330 5 1.5 0.085 0.085 3Oranges 522 18 3.4 0.083 0.19 4Peaches 167 26 15.6 0.085 0.43 5
Total 49
Page 5 of 10

Number No. of % of Minimum Maximumof Samples Samples with Samples with Value Value Tolerance
Pesticide Screened Detections Detections Detected, ppm Detected, ppm Level, ppm
28. ImazalilBananas (X-1) 486 73 15.0 0.015 0.25 0.20Oranges 691 395 57.2 0.011 0.61 10
Total 468
29. IprodioneApples (V-6) 693 6 0.9 0.014 0.025 NTCarrots 701 173 24.7 0.014 0.13 5.0Grapes 689 267 38.8 0.014 1.8 60.0Green Beans 587 9 1.5 0.025 1.4 2.0Peaches 367 256 69.8 0.025 13 20.0
Total 711
30. Lambda Cyhalothrin and IsomerSpinach (V-1) 1 1 100.0 0.17 0.17 NT
Total 1
31. LindaneCarrots 701 1 0.1 0.005 0.005 0.5Green Beans 587 1 0.2 0.005 0.005 0.5Spinach 610 2 0.3 0.006 0.023 1
Total 4
32. LinuronCarrots 257 159 61.9 0.005 0.36 1Spinach (V-1) 79 1 1.3 0.051 0.051 NT
Total 160
33. MalathionCarrots 678 1 0.1 0.017 0.017 8Oranges 691 2 0.3 0.005 0.013 8Peaches 367 2 0.5 0.005 0.005 8Spinach 610 4 0.7 0.005 0.028 8
Total 9
34. MetalaxylCarrots 18 7 38.9 0.005 0.024 0.5Green Beans 19 6 31.6 0.005 0.005 0.2Potatoes 44 6 13.6 0.005 0.020 0.5Spinach 22 4 18.2 0.005 0.016 10.0
Total 23
Page 6 of 10

Number No. of % of Minimum Maximumof Samples Samples with Samples with Value Value Tolerance
Pesticide Screened Detections Detections Detected, ppm Detected, ppm Level, ppm
35. MethamidophosCarrots (V-1) 701 1 0.1 0.004 0.004 NTGrapes (V-1) 690 1 0.1 0.004 0.004 NTGreen Beans @ (V-4) 587 112 19.1 0.004 0.40 NTPotatoes 707 14 2.0 0.004 0.038 0.1Spinach (V-14) 609 14 2.3 0.004 0.034 NT
Total 142
36. MethidathionGreen Beans (V-1) 587 1 0.2 0.04 0.04 NTOranges 691 21 3.0 0.004 0.031 2.0
Total 22
37. MethomylApples 693 24 3.5 0.012 0.13 1Grapes 689 48 7.0 0.012 1.3 5Green Beans 587 23 3.9 0.012 0.30 2Peaches 367 3 0.8 0.026 0.10 5Spinach 610 65 10.7 0.012 1.3 6
Total 163
38. MethoxychlorApples 693 110 15.9 0.010 0.70 14Peaches 367 2 0.5 0.29 0.55 14Sweet Peas 670 2 0.3 0.032 0.13 14
Total 114
39. MevinphosGrapes 690 5 0.7 0.003 0.044 0.5Spinach 609 16 2.6 0.003 0.14 1.0
Total 21
40. MyclobutanilApples 678 8 1.2 0.014 0.033 0.5Carrots (V-1) 701 1 0.1 0.014 0.014 NTGrapes 689 172 25.0 0.014 0.44 1.0Peaches 367 3 0.8 0.025 0.10 2.0
Total 184
41. Omethoate (see Dimethoate)Apples 461 19 4.1 0.005 0.050 2Grapes 530 92 17.4 0.005 0.37 1Green Beans 379 13 3.4 0.005 0.077 2Oranges 625 5 0.8 0.005 0.025 2Peaches (V-2) 321 2 0.6 0.025 0.032 NTSpinach 515 89 17.3 0.005 0.28 2Sweet Peas 584 41 7.0 0.005 0.019 2
Total 261
Page 7 of 10

Number No. of % of Minimum Maximumof Samples Samples with Samples with Value Value Tolerance
Pesticide Screened Detections Detections Detected, ppm Detected, ppm Level, ppm
42. OxamylApples 693 29 4.2 0.015 0.088 2Green Beans (V-1) 587 1 0.2 0.025 0.025 NT
Total 30
43. ParathionCarrots 582 11 1.9 0.003 0.019 1Grapes 662 5 0.8 0.003 0.010 1Sweet Peas 670 1 0.1 0.003 0.003 1
Total 17
44. Parathion methylApples 693 33 4.8 0.004 0.22 1Carrots 701 2 0.3 0.005 0.010 1Grapes 690 2 0.3 0.052 0.091 1Peaches 367 104 28.3 0.004 0.45 1Sweet Peas 670 9 1.3 0.004 0.005 1
Total 150
45. PermethrinsApples (X-2) 693 3 0.4 0.016 0.14 0.05Green Beans (V-5) 587 5 0.9 0.016 0.23 NTPeaches 367 9 2.5 0.016 0.28 5.0Spinach 610 372 61.0 0.016 18 20.0
Total 389
46. o-PhenylphenolApples 507 44 8.7 0.013 0.84 25Carrots 563 4 0.7 0.017 0.017 20Oranges 520 81 15.6 0.016 0.45 10Peaches 245 3 1.2 0.015 0.062 20Potatoes (V-31) 661 31 4.7 0.025 0.57 NT **Spinach (V-1) 385 1 0.3 0.052 0.052 NTSweet Corn (V-2) 612 2 0.3 0.015 0.025 NTSweet Peas (V-8) 601 8 1.3 0.017 0.025 NT
Total 174
47. Phorate (parent)
Phorate Oxygen Analog sulfone (metabolite)Potatoes 63 4 6.3 0.005 0.005 0.5
Total 4
Phorate sulfone (metabolite)Potatoes 315 14 4.4 0.004 0.055 0.5
Total 14
Page 8 of 10

Number No. of % of Minimum Maximumof Samples Samples with Samples with Value Value Tolerance
Pesticide Screened Detections Detections Detected, ppm Detected, ppm Level, ppm
Phorate sulfoxide (metabolite)Potatoes 315 5 1.6 0.006 0.19 0.5
Total 5
48. PhosaloneApples 421 3 0.7 0.10 0.22 10.0
Total 3
49. PhosmetApples 591 24 4.1 0.017 0.20 10Carrots (V-3) 582 3 0.5 0.010 0.029 NTGrapes 662 5 0.8 0.010 0.026 10Peaches 321 59 18.4 0.010 1.1 10
Total 91
50. PhosphamidonApples 693 15 2.2 0.003 0.13 1Potatoes 707 1 0.1 0.003 0.003 0.1
Total 16
51. Piperonyl ButoxideSpinach (V-1) 1 1 100 3.6 3.6 NT
Total 1
52. PropargiteApples 660 179 27.1 0.013 2.2 3Grapes 689 33 4.8 0.014 1.5 10Oranges 666 2 0.3 0.22 0.94 5Peaches 367 73 19.9 0.033 1.2 7
Total 287
53. Quintozene (PCNB parent, or parent and metabolites)Carrots (V-5) 701 5 0.7 0.005 0.022 NTGreen Beans 587 16 2.7 0.005 0.012 0.1Potatoes 707 4 0.6 0.005 0.037 0.1 Total 25
Hexachlorobenzene (HCB, impurity without parent)Carrots (V-1) 701 1 0.14 0.011 0.015 NT
Total 1
Pentachloroaniline (PCA, metabolite without parent)Spinach (V-10) 133 10 7.5 0.005 0.013 NT
Total 10
Page 9 of 10

Number No. of % of Minimum Maximumof Samples Samples with Samples with Value Value Tolerance
Pesticide Screened Detections Detections Detected, ppm Detected, ppm Level, ppm
Pentachlorobenzene (PCB, metabolite without parent)Carrots (V-1) 701 1 0.14 0.003 0.003 NTPotatoes (V-1) 707 5 0.7 0.003 0.015 NT
Total 6
54. TecnazinePotatoes 105 2 1.9 0.015 0.045 * 25
Total 2
55. Terbufos SulfoneCarrots (V-1) 327 1 0.3 0.004 0.004 NT
Total 1
56. ThiabendazoleApples 664 349 52.6 0.013 5.7 10Bananas (X-1) 486 251 51.6 0.013 0.46 0.4 *** Carrots 693 1 0.1 0.050 0.050 10Grapes 690 1 0.1 0.050 0.050 10.0Oranges 683 413 60.5 0.010 1.4 10Peaches (V-1) 367 1 0.3 0.050 0.050 NTPotatoes 707 130 18.4 0.019 2.0 10.0
Total 1146
57. TrifluralinCarrots 701 274 39.1 0.013 0.79 1.0
Total 274
58. VinclozolinGrapes 690 103 14.9 0.010 1.1 6.0Green Beans (V-15) 472 15 3.2 0.036 0.26 NTPeaches 367 5 1.4 0.007 0.062 25.0Spinach (V-2) 610 2 0.3 0.039 0.044 NT
Total 125
Total No. of Different Residues Detected: 69 Total No. of Samples Analyzed: 6924 Total No. of Residues Detected: 10015
KEY(V) Residue was found where no tolerance was established by EPA. Following V are the number of occurrences.
(X) Residue was found which exceeds EPA tolerance. Following X are the number of occurrences.
NT No tolerance level was set for that pesticide / commodity pair.
@ All other residues were detected in combination with acephate, for which a tolerance exists.
R Regional tolerance.
# Number shown are Action Levels established by FDA.
* Tolerance changed 09/27/95 to NT.
** May be subject to Food Additive Tolerance due to packaging materials.
*** Tolerance applies to banana pulp only.
Page 10 of 10

Appendix D
National Estimates for Concentration Percentiles vs. Tolerance
Appendix D shows 52 pesticide/commodity pairs with detections in at least 10percent of the samples tested. Concentrations detected are arranged in percentiles. The 90th percentile is compared to the tolerance established for eachpesticide/commodity pair.
The meaning of a percentile can be most easily explained through an example. For the bananas-thiabendazole pair, the 50th percentile is estimated to be 0.014 ppm. This means that PDP estimates that at least 50 percent of bananas available to U.S.consumers had thiabendazole residues of 0.014 ppm or less, while at least 50 percenthad residues of 0.014 ppm or more. Similarly, the 75th percentile (or the upperquartile) for this pair is estimated to be 0.088 ppm, which means that at least 75percent of bananas had residues of 0.088 ppm or less, while at least 25 percent hadresidues of 0.088 ppm or more. Finally, the 90th percentile (or the last decile) isestimated to be 0.124 ppm, meaning that at least 90 percent of all bananas hadthiabendazole residues of 0.124 ppm or less, while at least 10 percent had residues of0.124 ppm or more.
When calculating the national estimates, PDP sampling data were weighted tomore accurately reflect U.S. wholesale arrivals. This weighting had a surprising effecton the pair carbaryl / oranges (see page 1 of this appendix), for which detectableresidues were found in 10.3 percent of the samples. When the sampling data wereweighted to reflect U.S. arrivals (oranges are slightly more plentiful in winter monthsthen at other times of the year), less than 9 percent of the total product available forconsumption in 1995 was estimated to have detectable residues. Thus, the 90thpercentile of carbaryl in oranges resulted in no value, even though more than 10percent of the orange samples had detectable levels of carbaryl.

APPENDIX D. NATIONAL ESTIMATES FORCONCENTRATION PERCENTILES vs. TOLERANCE
(Pairs with Residue Detections in at Least 10 Percent of Samples)
% of Ratio ofSamples with Mean** Percentiles 90th Percentile
Commodity / Pesticide Detections Lower Upper 50th 75th 90th to Tolerance
1. ApplesAzinphos-Methyl 46.3 0.035 0.058 * 0.058 0.11 0.055Captan 14.2 0.016 0.027 * * 0.022 0.001Carbaryl 11.0 0.018 0.048 * * 0.015 0.002Chlorpyrifos 22.1 0.006 0.011 * * 0.017 0.011Diphenylamine 70.8 0.554 0.562 0.20 0.94 1.5 0.150Methoxychlor 15.9 0.022 0.036 * * 0.064 0.005Propargite 27.1 0.124 0.161 * 0.12 0.45 0.150Thiabendazole 52.6 0.464 0.503 0.075 0.61 1.5 0.150
2. BananasImazalil 15.0 0.011 0.039 * * 0.035 0.175Thiabendazole 51.6 0.049 0.063 0.014 0.088 0.124 0.309
3. CarrotsDDE 37.6 0.012 0.016 * 0.017 0.038 0.013Iprodione 24.7 0.012 0.037 * * 0.050 0.010Linuron (a) 61.9 0.032 0.035 0.012 0.042 0.080 0.080Trifluralin 39.1 0.024 0.042 * 0.042 0.075 0.075
4. GrapesCaptan 37.0 0.039 0.047 * 0.015 0.094 0.002Dimethoate 13.5 0.008 0.012 * * 0.006 0.006Fenbutatin Oxide (b) 13.0 0.022 0.025 * * 0.010 0.002Iprodione 38.8 0.077 0.094 * 0.050 0.25 0.004Myclobutanil 25.0 0.020 0.037 * 0.021 0.063 0.063Omethoate 17.4 0.007 0.013 * * 0.015 0.015Vinclozolin 14.9 0.017 0.026 * * 0.015 0.003
5. Green BeansAcephate 20.4 0.052 0.056 * * 0.18 0.060Chlorothalonil 14.3 0.014 0.026 * * 0.023 0.005Endosulfans 23.7 0.026 0.031 * * 0.064 0.032Methamidophos 19.1 0.020 0.025 * * 0.083 0.083
6. OrangesCarbaryl 10.3 0.004 0.020 * * *** ***Imazalil 57.2 0.068 0.093 0.034 0.099 0.18 0.018o-Phenylphenol 15.6 0.008 0.026 * * 0.026 0.003Thiabendazole 60.5 0.124 0.146 0.060 0.18 0.36 0.036
Page 1 of 2

% of Ratio ofSamples with Mean** Percentiles 90th Percentile
Commodity / Pesticide Detections Lower Upper 50th 75th 90th to Tolerance
7. PeachesAzinphos-methyl 27.8 0.011 0.030 * * 0.045 0.023Captan 16.3 0.042 0.050 * * 0.061 0.001Carbaryl 14.7 0.089 0.105 * * 0.25 0.025Chlorpyrifos 16.3 0.001 0.007 * * 0.004 0.070Dicloran 42.5 0.517 0.520 0.01 0.34 1.3 0.065Fenbutatin Oxide (b) 12.0 0.006 0.009 * * 0.006 0.001Formetanate HCI (b) 15.6 0.028 0.072 * * 0.13 0.026Iprodione 69.8 0.816 0.824 0.21 0.65 1.7 0.085Parathion-methyl 28.3 0.025 0.030 * 0.033 0.069 0.069Phosmet 18.4 0.037 0.051 * * 0.075 0.008Propargite 19.9 0.104 0.159 * * 0.41 0.059
8. PotatoesChlorpropham 68.2 1.129 1.133 0.12 1.7 3.5 0.070DDE 15.0 0.001 0.007 * * 0.006 0.006DDT (c) 10.4 0.001 0.008 * * 0.007 0.007Endosulfans 19.4 0.003 0.008 * * 0.010 0.048Thiabendazole 18.4 0.078 0.123 * * 0.25 0.025
9. SpinachDDE 49.2 0.011 0.014 * 0.014 0.030 0.060DDT (c) 16.6 0.003 0.008 * * 0.015 0.030Endosulfans 14.3 0.015 0.019 * * 0.010 0.005Methomyl 10.7 0.019 0.040 * * 0.014 0.002Omethoate 17.3 0.010 0.029 * * 0.027 0.014Permethrins 61.0 1.501 1.506 0.23 1.84 5.2 0.260
10. Sweet PeasDimethoate 11.5 0.003 0.008 * * 0.010 0.005
(a) Tested in only three States.(b) In PDP for 6 months.(c) Not reported in Ohio and inconsistent reporting in some other States.* The percentile value is estimated to be below the Limit of Detection (LOD).** The mean is estimated with a range of values. The lower bound is calculated with non-detections valued
at zero. The upper bound is calculated using the LOD.*** No estimated value.
Page 2 of 2

Appendix E
Number of Non-Detected Residues by Pesticide/Commodity Pairs(Pairs with established tolerances and pairs requested by EPA)
Appendix E gives the number of samples per commodity for which no pesticideresidues were detected (non-detected) by the participating laboratories. Onlypesticides with registered uses (i.e., established tolerances) and pesticides specificallyrequested by EPA are included. The appendix also shows the range of limits ofdetection for each pesticide.
The laboratories reported other non-detected residues which are not shown inthis appendix but are available upon request. These include pesticides not expected tobe present (i.e., not registered for use in PDP commodities). These data resulted fromthe laboratories’ need to simplify spiking requirements for pesticides analyzed bymultiresidue screens. For example, chlorpropham was tested in all samples although itis registered for use in only four PDP commodities--carrots, green beans, potatoes, andsweet peas. The number of non-detected residues for carrots and sweet peas is givenin this appendix. Residues of chlorpropham were detected in green beans andpotatoes; therefore, this information is shown in Appendix C.

APPENDIX E. NUMBER OF NON-DETECTED RESIDUESBY PESTICIDE/COMMODITY PAIRS
(Pairs with established tolerances and pairs requested by EPA)
No. of Samples Range of LODs for TolerancePesticide Analyzed Non-Detects, ppm Level, ppm
1. 1-NaphtholBananas 98 0.055 - 0.055 10Carrots 140 0.055 - 0.055 10Grapes 143 0.055 - 0.055 10Green Beans 113 0.055 - 0.055 10Potatoes 138 0.055 - 0.055 0.2Sweet Corn 140 0.055 - 0.055 5Sweet Peas 69 0.055 - 0.055 10
2. 2,4-D (5)Peaches 133 0.006 - 0.010 0.2Sweet Corn 304 0.006 - 0.016 0.5Sweet Peas 285 0.006 - 0.010 1.0 (1)
3. AbamectinOranges 688 0.002 NT
4. Acephate (5)Apples 693 0.003 - 0.030 NTBananas 486 0.003 - 0.010 NTOranges 691 0.003 - 0.030 NTPeaches 367 0.003 - 0.025 NTPotatoes 707 0.003 - 0.005 NTSweet Corn 671 0.003 - 0.005 NTSweet Peas 670 0.003 - 0.025 NT
5. Aldicarb & MetabolitesApples 499 0.007 - 0.040 NTBananas 486 0.007 - 0.040 NTCarrots 509 0.007 - 0.040 NTGrapes 519 0.007 - 0.040 NTGreen Beans 420 0.007 - 0.040 NTOranges 675 0.007 - 0.036 0.3Peaches 367 0.007 - 0.040 NTPotatoes 531 0.007 - 0.015 1Spinach 599 0.007 - 0.040 NTSweet Corn 629 0.007 - 0.020 NTSweet Peas 540 0.007 - 0.036 NT
Page 1 of 15

No. of Samples Range of LODs for TolerancePesticide Analyzed Non-Detects, ppm Level, ppm
6. AnilazineApples 142 0.035 - 0.037 NTOranges 142 0.035 - 0.037 NTPeaches 76 0.035 - 0.037 NTSpinach 133 0.035 - 0.037 NTSweet Peas 69 0.035 - 0.037 NT
7. AtrazineApples 693 0.018 - 0.030 NTBananas 486 0.003 - 0.028 NTCarrots 701 0.018 - 0.030 NTGrapes 690 0.018 - 0.028 NTGreen Beans 587 0.018 - 0.030 NTOranges 691 0.003 - 0.030 NTPeaches 367 0.003 - 0.020 NTPotatoes 707 0.018 - 0.028 NTSweet Corn 671 0.003 - 0.028 0.25Sweet Peas 670 0.003 - 0.028 NT
8. Azinphos EthylApples 188 0.020 - 0.025 2Bananas 121 0.020 - 0.020 NTCarrots 194 0.020 - 0.025 NTGrapes 195 0.020 - 0.020 5Green Beans 172 0.020 - 0.025 2Oranges 199 0.020 - 0.025 2Peaches 99 0.020 - 0.020 2Potatoes 216 0.020 - 0.020 0.3Spinach 176 0.020 - 0.025 2Sweet Corn 186 0.020 - 0.020 NTSweet Peas 186 0.020 - 0.020 NT
9. Azinphos MethylBananas 486 0.006 - 0.030 NTCarrots 701 0.006 - 0.130 NTPotatoes 707 0.006 - 0.029 0.3Spinach 610 0.006 - 0.130 2Sweet Corn 671 0.006 - 0.030 NTSweet Peas 670 0.006 - 0.033 NT
10. BenfluralinCarrots 161 0.010 - 0.010 NT
Page 2 of 15

No. of Samples Range of LODs for TolerancePesticide Analyzed Non-Detects, ppm Level, ppm
11. BenomylOranges 525 0.050 10Spinach 623 0.050 0.2Sweet Corn 668 0.050 0.2
12. CaptanBananas 377 0.006 - 0.017 NTOranges 691 0.006 - 0.040 NTPotatoes 569 0.006 - 0.012 25 (2)Spinach 596 0.006 - 0.029 100Sweet Corn 531 0.006 - 0.012 2Sweet Peas 601 0.006 - 0.060 2
13. CarbarylBananas 486 0.006 - 0.036 10Carrots 701 0.006 - 0.076 10Potatoes 707 0.006 - 0.076 0.2Sweet Corn 671 0.006 - 0.076 5
14. Carbofuran & Carbofuran-3 OHApples 693 0.009 - 0.076 NTBananas 486 0.009 - 0.031 0.1Carrots 701 0.009 - 0.076 NTGreen Beans 587 0.009 - 0.076 NTOranges 691 0.009 - 0.049 2.5Peaches 367 0.009 - 0.049 NTPotatoes 707 0.009 - 0.076 1Sweet Corn 671 0.009 - 0.076 0.2Sweet Peas 670 0.009 - 0.076 NT
15. ChlorothalonilApples 679 0.005 - 0.045 NTBananas 374 0.003 - 0.008 0.05Carrots 548 0.006 - 0.045 1Grapes 530 0.006 - 0.008 NTOranges 691 0.003 - 0.045 NTPotatoes 551 0.006 - 0.008 0.1Sweet Corn 516 0.006 - 0.008 1Sweet Peas 586 0.006 - 0.008 NT
Page 3 of 15

No. of Samples Range of LODs for TolerancePesticide Analyzed Non-Detects, ppm Level, ppm
16. ChlorprophamApples 693 0.008 - 0.047 NTBananas 486 0.008 - 0.020 NTCarrots 701 0.008 - 0.036 0.1Oranges 691 0.008 - 0.047 NTSpinach 610 0.008 - 0.300 0.3 (2)Sweet Corn 671 0.008 - 0.020 NTSweet Peas 670 0.008 - 0.047 0.3 (2)
17. Chlorpyrifos (5)Bananas 486 0.003 - 0.020 0.01Green Beans 587 0.003 - 0.020 0.1Potatoes 707 0.003 - 0.011 NTSweet Corn 671 0.003 - 0.011 0.1Sweet Peas 670 0.003 - 0.011 0.1
18. CypermethrinApples 265 0.045 - 0.060 NTBananas 153 0.003 - 0.060 NTCarrots 104 0.060 - 0.060 NTGrapes 153 0.060 - 0.060 NTGreen Beans 82 0.060 - 0.060 NTOranges 390 0.020 - 0.060 NTPeaches 191 0.020 - 0.060 NTPotatoes 177 0.060 - 0.060 NTSweet Corn 288 0.020 - 0.060 NTSweet Peas 243 0.045 - 0.060 NT
19. DCPA (Dacthal)Apples 693 0.002 - 0.068 NTBananas 486 0.002 - 0.010 NTCarrots 701 0.002 - 0.068 NTGrapes 690 0.002 - 0.008 NTOranges 691 0.002 - 0.068 NTPeaches 367 0.002 - 0.010 NTPotatoes 707 0.002 - 0.008 2Sweet Corn 671 0.002 - 0.008 0.05Sweet Peas 670 0.002 - 0.008 NT
20. DDE (DDT metabolite)Apples 693 0.002 - 0.012 0.1 (3)Bananas 486 0.002 - 0.008 NTOranges 691 0.002 - 0.012 0.1 (3)Sweet Corn 671 0.002 - 0.008 0.1 (3)Sweet Peas 670 0.002 - 0.008 0.2 (3)
Page 4 of 15

No. of Samples Range of LODs for TolerancePesticide Analyzed Non-Detects, ppm Level, ppm
21. DDVP (Dichlorvos) (4)Apples 693 0.002 - 0.017 0.5Bananas 486 0.002 - 0.013 0.5Carrots 701 0.002 - 0.017 0.5Grapes 690 0.002 - 0.004 0.5Green Beans 587 0.002 - 0.017 0.5Oranges 691 0.002 - 0.020 3Peaches 367 0.002 - 0.014 0.5Potatoes 707 0.002 - 0.004 0.5Spinach 609 0.002 - 0.017 3Sweet Corn 671 0.002 - 0.013 0.5Sweet Peas 670 0.002 - 0.014 0.5
22. DemetonApples 142 0.028 - 0.029 NTOranges 142 0.028 - 0.029 NTPeaches 76 0.028 - 0.029 NTSpinach 133 0.028 - 0.029 NTSweet Peas 69 0.028 - 0.029 NT
23. Demeton S & MetabolitesApples 93 0.006 - 0.060 NTBananas 58 0.006 - 0.060 NTCarrots 87 0.006 - 0.060 NTGrapes 125 0.006 - 0.060 NTOranges 129 0.006 - 0.060 NTPeaches 51 0.006 - 0.060 NTSweet Corn 145 0.006 - 0.060 NTSweet Peas 144 0.006 - 0.060 NT
24. Diazinon (5)Bananas 486 0.003 - 0.022 0.1Oranges 691 0.003 - 0.023 0.7Potatoes 707 0.003 - 0.007 0.1Sweet Corn 671 0.003 - 0.007 0.7
25. Dichlorobenzophenone, p pApples 123 0.002 - 0.002 5Bananas 74 0.002 - 0.002 NTCarrots 104 0.002 - 0.002 NTGrapes 153 0.002 - 0.002 5Green Beans 82 0.002 - 0.002 5Oranges 159 0.002 - 0.002 10Peaches 57 0.002 - 0.002 10Potatoes 177 0.002 - 0.002 NTSpinach 78 0.002 - 0.002 NTSweet Corn 175 0.002 - 0.002 NTSweet Peas 174 0.002 - 0.002 NT
Page 5 of 15

No. of Samples Range of LODs for TolerancePesticide Analyzed Non-Detects, ppm Level, ppm
26. DicloranBananas 486 0.006 - 0.019 NTOranges 691 0.003 - 0.060 NTPotatoes 707 0.006 - 0.010 0.25Sweet Corn 671 0.006 - 0.010 NTSweet Peas 670 0.003 - 0.010 NT
27. DicofolsBananas 486 0.005 - 0.020 NTCarrots 701 0.005 - 0.050 NTPotatoes 707 0.005 - 0.020 NTSpinach 610 0.005 - 0.050 NTSweet Corn 671 0.005 - 0.020 NTSweet Peas 670 0.005 - 0.025 NT
28. DieldrinApples 142 0.003 - 0.003 NTOranges 142 0.003 - 0.003 0.02 (3)Peaches 76 0.003 - 0.003 0.02 (3)Sweet Peas 69 0.003 - 0.003 0.02 (3)
29. Dimethoate (6)Bananas 486 0.002 - 0.012 NTCarrots 701 0.002 - 0.032 NTPotatoes 707 0.002 - 0.007 0.2Sweet Corn 671 0.002 - 0.011 NT
30. Diphenylamine (DPA)Carrots 701 0.008 - 0.110 NTGreen Beans 587 0.008 - 0.110 NTOranges 549 0.010 - 0.110 NTSpinach 477 0.010 - 0.300 NTSweet Corn 671 0.008 - 0.015 NTSweet Peas 601 0.008 - 0.015 NT
31. DisulfotonBananas 486 0.003 - 0.016 NTCarrots 701 0.003 - 0.065 0.3Grapes 690 0.003 - 0.016 NTGreen Beans 587 0.003 - 0.065 0.75Oranges 691 0.002 - 0.065 NTPeaches 367 0.003 - 0.036 NTSpinach 609 0.003 - 0.065 0.75Sweet Corn 671 0.003 - 0.013 0.3Sweet Peas 670 0.003 - 0.036 0.75
Page 6 of 15

No. of Samples Range of LODs for TolerancePesticide Analyzed Non-Detects, ppm Level, ppm
32. DiuronApples 123 0.010 - 0.030 1Bananas 74 0.010 - 0.030 0.1Carrots 104 0.010 - 0.030 NTGrapes 153 0.010 - 0.030 1Green Beans 82 0.010 - 0.030 NTOranges 159 0.010 - 0.030 1Peaches 57 0.010 - 0.030 0.1Potatoes 177 0.010 - 0.030 1Spinach 78 0.010 - 0.030 NTSweet Corn 175 0.010 - 0.030 1Sweet Peas 174 0.010 - 0.030 1
33. EndosulfansBananas 486 0.002 - 0.006 NT
34. Esfenvalerate & Fenvalerate (5)Bananas 241 0.012 - 0.140 NTGrapes 547 0.012 - 0.085 NTOranges 388 0.012 - 0.310 NTPotatoes 569 0.012 - 0.050 0.02Spinach 289 0.012 - 0.310 NTSweet Corn 403 0.012 - 0.050 0.1Sweet Peas 490 0.012 - 0.050 1
35. EthionApples 693 0.001 - 0.032 2Bananas 486 0.001 - 0.006 NTCarrots 701 0.001 - 0.032 NTGrapes 690 0.001 - 0.006 2Green Beans 587 0.001 - 0.032 2Peaches 367 0.001 - 0.008 1Potatoes 707 0.001 - 0.004 NTSpinach 610 0.001 - 0.032 NTSweet Corn 671 0.001 - 0.006 NTSweet Peas 670 0.001 - 0.008 NT
36. EthopropApples 142 0.029 - 0.030 NTOranges 142 0.029 - 0.030 NTPeaches 76 0.029 - 0.030 NTSpinach 133 0.029 - 0.030 NTSweet Peas 69 0.029 - 0.030 NT
Page 7 of 15

No. of Samples Range of LODs for TolerancePesticide Analyzed Non-Detects, ppm Level, ppm
37. Fenamiphos & MetabolitesApples 693 0.002 - 0.049 0.25Bananas 483 0.002 - 0.013 0.1Carrots 701 0.002 - 0.049 NTGrapes 690 0.002 - 0.009 0.1Green Beans 587 0.002 - 0.049 NTOranges 691 0.002 - 0.049 0.6Peaches 367 0.002 - 0.013 0.25Potatoes 707 0.002 - 0.008 NTSpinach 610 0.002 - 0.049 NTSweet Corn 671 0.002 - 0.013 NTSweet Peas 670 0.002 - 0.013 NT
38. HCB (Hexachlorobenzene) (7)Apples 693 0.002 - 0.006 NTBananas 486 0.002 - 0.006 0.1Grapes 690 0.002 - 0.004 NTGreen Beans 587 0.002 - 0.006 0.1Oranges 691 0.002 - 0.006 NTPeaches 367 0.002 - 0.006 NTPotatoes 707 0.002 - 0.004 0.1Spinach 610 0.002 - 0.006 NTSweet Corn 671 0.002 - 0.004 NTSweet Peas 670 0.002 - 0.004 NT
39. ImazalilApples 678 0.009 - 0.150 NTCarrots 620 0.009 - 0.150 NTGrapes 690 0.009 - 0.044 NTGreen Beans 587 0.009 - 0.150 NTPeaches 367 0.009 - 0.055 NTPotatoes 707 0.009 - 0.044 NTSpinach 610 0.009 - 0.150 NTSweet Corn 671 0.009 - 0.044 NT (8)Sweet Peas 670 0.009 - 0.055 NT
40. IprodioneBananas 486 0.015 - 0.060 NTOranges 691 0.015 - 0.100 NTPotatoes 707 0.008 - 0.060 0.5Spinach 610 0.015 - 0.100 NTSweet Corn 671 0.008 - 0.060 NTSweet Peas 653 0.008 - 0.060 NT
Page 8 of 15

No. of Samples Range of LODs for TolerancePesticide Analyzed Non-Detects, ppm Level, ppm
41. LindaneApples 693 0.003 - 0.006 1Bananas 486 0.003 - 0.005 NTGrapes 690 0.003 - 0.006 1Oranges 691 0.003 - 0.006 0.5 (3)Peaches 367 0.003 - 0.005 1Potatoes 707 0.003 - 0.006 0.5 (3)Sweet Corn 671 0.003 - 0.006 0.5 (3)Sweet Peas 670 0.003 - 0.006 0.5 (3)
42. LinuronApples 123 0.003 - 0.003 NTBananas 74 0.003 - 0.003 NTGrapes 153 0.003 - 0.003 NTGreen Beans 82 0.003 - 0.003 NTOranges 159 0.003 - 0.003 NTPeaches 57 0.003 - 0.003 NTPotatoes 177 0.003 - 0.003 1Sweet Corn 175 0.003 - 0.003 0.25Sweet Peas 174 0.003 - 0.003 NT
43. MalathionApples 693 0.002 - 0.049 8Bananas 477 0.002 - 0.038 NTGrapes 690 0.002 - 0.038 8Green Beans 587 0.002 - 0.049 8Potatoes 707 0.002 - 0.010 8Sweet Corn 671 0.002 - 0.013 2Sweet Peas 670 0.002 - 0.045 8
44. MetalaxylApples 18 0.003 - 0.003 0.2Grapes 16 0.003 - 0.003 2Oranges 18 0.003 - 0.003 1Peaches 1 0.003 - 0.003 1Sweet Corn 15 0.003 - 0.003 NTSweet Peas 15 0.003 - 0.003 NT
45. Methamidophos (5)Apples 693 0.002 - 0.030 NTBananas 486 0.002 - 0.012 NTOranges 691 0.002 - 0.030 NTPeaches 367 0.002 - 0.019 NTSweet Corn 671 0.002 - 0.005 NTSweet Peas 670 0.002 - 0.019 NT
Page 9 of 15

No. of Samples Range of LODs for TolerancePesticide Analyzed Non-Detects, ppm Level, ppm
46. MethidathionApples 693 0.002 - 0.050 0.05Bananas 486 0.002 - 0.013 NTCarrots 701 0.002 - 0.050 NTGrapes 690 0.002 - 0.010 NTPeaches 367 0.002 - 0.016 0.05Potatoes 707 0.002 - 0.010 0.2Spinach 610 0.002 - 0.050 NTSweet Corn 671 0.002 - 0.013 NTSweet Peas 670 0.002 - 0.016 NT
47. MethiocarbApples 298 0.015 - 0.064 NTBananas 268 0.013 - 0.020 NTCarrots 162 0.015 - 0.016 NTGrapes 195 0.015 - 0.016 NTGreen Beans 146 0.015 - 0.016 NTOranges 466 0.015 - 0.064 0.02Peaches 264 0.013 - 0.064 15Potatoes 216 0.015 - 0.016 NTSpinach 438 0.013 - 0.064 NTSweet Corn 314 0.013 - 0.020 0.03Sweet Peas 297 0.015 - 0.064 NT
48. MethomylBananas 486 0.007 - 0.060 NTCarrots 701 0.007 - 0.076 0.2Oranges 691 0.007 - 0.056 2Potatoes 707 0.007 - 0.076 0.2Sweet Corn 671 0.007 - 0.076 0.1Sweet Peas 670 0.007 - 0.076 5
49. Methoxychlor & MetabolitesBananas 486 0.006 - 0.028 NTCarrots 701 0.006 - 0.031 14Grapes 690 0.006 - 0.026 14Green Beans 587 0.006 - 0.031 14Oranges 691 0.006 - 0.031 NTPotatoes 707 0.006 - 0.026 1Spinach 610 0.006 - 0.031 14Sweet Corn 671 0.006 - 0.026 14
Page 10 of 15

No. of Samples Range of LODs for TolerancePesticide Analyzed Non-Detects, ppm Level, ppm
50. MevinphosApples 693 0.002 - 0.096 0.5Bananas 486 0.002 - 0.019 NTCarrots 701 0.002 - 0.021 0.25Green Beans 587 0.002 - 0.021 0.25Oranges 691 0.002 - 0.096 0.2Peaches 367 0.002 - 0.096 1Potatoes 707 0.002 - 0.019 0.25Sweet Corn 671 0.002 - 0.019 0.25Sweet Peas 670 0.002 - 0.096 0.25
51. MyclobutanilBananas 486 0.010 - 0.059 NTGreen Beans 587 0.008 - 0.120 NTOranges 691 0.010 - 0.120 NTPotatoes 707 0.008 - 0.059 NTSpinach 610 0.010 - 0.300 NTSweet Corn 671 0.008 - 0.046 NTSweet Peas 670 0.008 - 0.059 NT
52. o-Phenylphenol (5)Bananas 396 0.010 - 0.065 NTGrapes 614 0.008 - 0.065 NTGreen Beans 474 0.008 - 0.066 NT
53. OxamylBananas 486 0.009 - 0.043 0.3Carrots 701 0.009 - 0.076 0.1Grapes 690 0.009 - 0.076 NTOranges 691 0.009 - 0.048 3Peaches 367 0.009 - 0.048 NTPotatoes 707 0.009 - 0.076 0.1Spinach 610 0.009 - 0.048 NTSweet Corn 671 0.009 - 0.076 NTSweet Peas 670 0.009 - 0.076 NT
54. PCB (Pentachlorobenzene) (7)Apples 693 0.002 - 0.006 NTBananas 486 0.002 - 0.004 NTGrapes 690 0.002 - 0.004 NTGreen Beans 587 0.002 - 0.006 0.1Oranges 691 0.002 - 0.006 NTPeaches 367 0.002 - 0.004 NTSpinach 610 0.002 - 0.006 NTSweet Corn 671 0.002 - 0.004 NTSweet Peas 670 0.002 - 0.004 NT
Page 11 of 15

No. of Samples Range of LODs for TolerancePesticide Analyzed Non-Detects, ppm Level, ppm
55. PCNB (Quintozene) (9)Apples 693 0.003 - 0.006 NTBananas 486 0.003 - 0.007 NTGrapes 690 0.003 - 0.006 NTOranges 691 0.003 - 0.006 NTPeaches 367 0.003 - 0.007 NTSpinach 610 0.003 - 0.007 NTSweet Corn 671 0.003 - 0.006 NTSweet Peas 670 0.003 - 0.006 NT
56. Parathion EthylApples 591 0.002 - 0.013 1Bananas 440 0.002 - 0.005 NTGreen Beans 485 0.002 - 0.006 1Oranges 625 0.002 - 0.015 1Peaches 321 0.002 - 0.013 1Potatoes 707 0.002 - 0.006 0.1Spinach 516 0.002 - 0.013 1Sweet Corn 671 0.002 - 0.006 1
57. Parathion MethylBananas 486 0.002 - 0.013 NTGreen Beans 587 0.002 - 0.034 1Oranges 691 0.002 - 0.034 1Potatoes 707 0.002 - 0.006 0.1Spinach 609 0.002 - 0.034 1Sweet Corn 671 0.002 - 0.013 1
58. PentachloroanilineApples 142 0.003 - 0.003 NTOranges 142 0.003 - 0.003 NTPeaches 76 0.003 - 0.003 NTSweet Peas 69 0.003 - 0.003 NT
59. PermethrinsBananas 486 0.005 - 0.040 NTCarrots 701 0.005 - 0.100 NTGrapes 690 0.005 - 0.040 NTOranges 691 0.005 - 0.120 NTPotatoes 707 0.005 - 0.040 0.05Sweet Corn 671 0.005 - 0.040 0.1Sweet Peas 670 0.005 - 0.040 NT
Page 12 of 15

No. of Samples Range of LODs for TolerancePesticide Analyzed Non-Detects, ppm Level, ppm
60. Phorate & MetabolitesApples 693 0.002 - 0.130 NTBananas 486 0.002 - 0.110 NTCarrots 701 0.002 - 0.110 NTGrapes 690 0.002 - 0.110 NTGreen Beans 587 0.002 - 0.110 0.1Oranges 619 0.002 - 0.130 NTPeaches 362 0.002 - 0.130 NTSpinach 610 0.002 - 0.130 NTSweet Corn 671 0.002 - 0.110 0.1Sweet Peas 670 0.002 - 0.130 NT
61. PhosaloneBananas 241 0.006 - 0.020 NTCarrots 266 0.006 - 0.020 NTGrapes 348 0.006 - 0.020 10Green Beans 228 0.006 - 0.020 NTOranges 553 0.006 - 0.064 3Peaches 290 0.006 - 0.064 15Potatoes 393 0.006 - 0.020 0.1Spinach 432 0.006 - 0.064 NTSweet Corn 461 0.006 - 0.020 NTSweet Peas 429 0.006 - 0.064 NT
62. PhosmetBananas 440 0.006 - 0.030 NTGreen Beans 485 0.006 - 0.024 NTOranges 625 0.006 - 0.030 5Potatoes 707 0.006 - 0.024 0.1Spinach 516 0.006 - 0.030 NTSweet Corn 671 0.006 - 0.030 0.5Sweet Peas 670 0.006 - 0.030 0.5
63. PhosphamidonBananas 486 0.002 - 0.093 NTCarrots 701 0.002 - 0.093 NTGrapes 690 0.002 - 0.093 NTGreen Beans 587 0.002 - 0.093 NTOranges 619 0.002 - 0.080 0.75Peaches 362 0.002 - 0.080 NTSpinach 610 0.002 - 0.080 NTSweet Corn 671 0.002 - 0.093 NTSweet Peas 670 0.002 - 0.093 NT
Page 13 of 15

No. of Samples Range of LODs for TolerancePesticide Analyzed Non-Detects, ppm Level, ppm
64. PropargiteBananas 486 0.020 - 0.180 NTCarrots 688 0.008 - 0.200 NTGreen Beans 572 0.008 - 0.200 20Potatoes 707 0.008 - 0.087 0.1Spinach 599 0.020 - 0.310 NTSweet Corn 671 0.020 - 0.150 0.1 (10)Sweet Peas 670 0.008 - 0.150 NT
65. TecnazineApples 62 0.010 - 0.010 NTBananas 33 0.010 - 0.010 NTCarrots 69 0.010 - 0.010 10Grapes 84 0.010 - 0.010 10Green Beans 54 0.010 - 0.010 20Oranges 86 0.010 - 0.010 NTPeaches 34 0.010 - 0.010 20Spinach 49 0.010 - 0.010 NTSweet Corn 112 0.010 - 0.010 NTSweet Peas 111 0.010 - 0.010 NT
66. Terbufos & MetabolitesApples 693 0.002 - 0.071 NTBananas 486 0.002 - 0.025 0.025Carrots 701 0.002 - 0.071 NTGrapes 690 0.002 - 0.029 NTGreen Beans 587 0.002 - 0.035 NTOranges 633 0.002 - 0.071 NTPeaches 367 0.002 - 0.030 NTPotatoes 707 0.002 - 0.029 NTSpinach 610 0.002 - 0.035 NTSweet Corn 671 0.002 - 0.029 0.05Sweet Peas 670 0.002 - 0.030 NT
67. ThiabendazoleGreen Beans 572 0.011 - 0.180 NTSpinach 607 0.030 - 0.300 NTSweet Corn 671 0.011 - 0.180 NTSweet Peas 670 0.011 - 0.180 NT
Page 14 of 15

No. of Samples Range of LODs for TolerancePesticide Analyzed Non-Detects, ppm Level, ppm
68. TrifluralinApples 693 0.003 - 0.090 NTBananas 388 0.003 - 0.030 NTGrapes 547 0.008 - 0.030 0.05Green Beans 474 0.008 - 0.090 0.05Oranges 691 0.003 - 0.090 0.05Peaches 367 0.003 - 0.030 0.05Potatoes 569 0.008 - 0.025 0.05Spinach 610 0.003 - 0.090 0.05Sweet Corn 531 0.003 - 0.020 NTSweet Peas 601 0.003 - 0.020 0.05
69. VinclozolinApples 693 0.005 - 0.023 NTBananas 388 0.004 - 0.012 NTCarrots 561 0.006 - 0.023 NTOranges 691 0.004 - 0.023 NTPotatoes 566 0.006 - 0.014 NTSweet Corn 531 0.006 - 0.014 NTSweet Peas 601 0.006 - 0.014 NT
(1) These are special tolerance applications of 2,4-D for western ditches and water hycinth control.
(2) This is an interim tolerance.
(3) Action Level's (AL) are established by FDA and are not considered to be the same as Tolerances. AL's are
established based on the unavoidability of the pesticide and its persistence in the environment. PDP will treat
AL's as tolerances for FDA reporting purposes.
(4) Diclorvos is the breakdown product of Naled and is included in the Naled tolerance expression in 40CFR180.215.
Therefore, it is appropriate to use the Naled tolerances.
(5) The Food Additive (FA) tolerance has been recently interpreted by EPA (04/10/95) to be in effect if there is a
clear evidence of pesticide use in a warehouse. If such evidence is absent, then one must assume a violation
if there is no established 408 tolerance or the established tolerance is exceeded. Therefore, if the Sample
Information Form indicates that any of the pesticides listed below were applied at the Warehouse/Terminal
Market/Packing establishment, then see the corresponding CFR reference for applicable FA tolerances.
- 2,4-D (40 CFR 185.1450)
- Acephate / Methamidophos (40 CFR 185.100)
- Chlorpyrifos (40 CFR 185.1000)
- Diazinon (40 CFR 185.175)
- Esfenvalerate (40 CFR 185.1310)
- Fenvalerate (40 CFR 185.1300)
- o-Phenylphenol (40 CFR 176.210)
(6) Combined tolerance for dimethoate and/or omethoate, as per FDA revised policy.
(7) The tolerance for PCNB is used, but as a combined tolerance for PCNB. When PCB and or HCB are
detected, they are considered as part of the combined tolerance for PCNB.
(8) May have an active Section 18 Crisis exemption.
(9) This is a combined tolerance for PCNB and its metabolites PCA (pentachloroaniline) and MPCPS
(methyl pentachlorophenyl sulfide).
(10) Regional Tolerance -- California.
Page 15 of 15

Appendix F
Percentage of Samples vs. Number of Residues Detected per Sample
(Fresh and Processed Commodities)
Appendix F shows the percentage of samples per commodity containing 0 to 11residues per sample. Shown at the bottom of the graph are the overall number ofsamples and percentages (of the total number of samples analyzed) for each detectiongroup. For example, of the 6,924 samples tested, 35.0 had no detectable residues and40.3 percent had more than one residue.

APPENDIX F. PERCENTAGE vs. MULTIPLE RESIDUES DETECTEDFOR FRUIT/VEGETABLE SAMPLES
3535
30
2525
2020
15
10
55
0 1 2 3 4 5 6 7 8 9 10 11
Per
cent
of S
ampl
es
35.0
24.6
18.2
11.9
5.6
3.0
1.20.2 0.2 .0004 .0001 .0001
Number of Residues Detected per Sample

Number of Residues Detected per Samples
0 1 2 3 4 5 6 7 8 9 10 11
Number ofSamples 2426 1706 1260 826 387 206 82 15 11 3 1 1
Percent ofTotal Samples 35.0 24.6 18.2 11.9 5.6 3.0 1.2 0.2 0.2 .0004 .0001 .0001
TOTAL NUMBER OF SAMPLES = 6,924

Appendix G
Distribution of Pesticide Residues in Wheat
Appendix G Part I shows residue detections for pesticides tested in wheat,including minimum and maximum concentrations reported and whether a tolerance isestablished by EPA for each pesticide/commodity pair. Part II references analyses forwhich no pesticide residues were detected by GIPSA. Of the 600 samples run 13pesticides were routinely analyzed but not detected in any of the tested samples. PartII also shows the limit of detection for each pesticide.

APPENDIX G. DISTRIBUTION OF PESTICIDE RESIDUES IN WHEAT (600 Samples)
Part I. Detected Residues
Pesticide with Detections with Detections in ppm in ppm Tolerance# of Samples % of Samples Value Detected Value Detected
Minimum Maximum
Atrazine 4 0.7 0.004 0.004 0.25
Carbaryl 3 0.5 0.004 0.011 3.0
Chlorpyrifos 117 19.5 0.005 0.021 0.5
Chlorpyrifos methyl 325 54.2 0.002 3.3 6.0
Diazinon 18 3.0 0.007 0.028 0.05
Diclofop methyl 1 0.2 0.009 0.009 0.1
Imazalil 3 0.5 0.010 0.010 0.05
Malathion 426 71.0 0.002 2.9 8.0
Methoxychlor 6 1.0 0.013 0.13 2.0
Trifluralin 1 0.2 0.011 0.011 0.05 (N)
Part II. Non-Detected Residues
Pesticide Non-Detections in ppm in ppmLODs for Tolerance Level
Azinphos Methyl 0.008 0.2
Carbofuran & 3-OH Carbofuran 0.005 0.1*
Demeton S 0.006 NT
Dichlorvos (DDVP)** 0.003 NT
Dimethoate 0.009 0.04
Disulfoton and sulfone 0.003 0.3
Endosulfans 0.010 0.1
Linuron 0.010 0.25
Methomyl 0.005 1
Parathion Ethyl 0.013 1
Parathion Methyl 0.006 1
Phorate & sulfone 0.003 0.05
Triallate 0.010 0.05
(*) Carbamate only(**) Dichlorvos - 331 samplesNT No Tolerance establishedN Neglible Tolerance

Appendix H
Commodity History(A Chronological Listing)
Appendix H shows a chronological listing of all commodities sampled since theinception of the program to the date of publication for the 1995 Summary.
Page 1 of 1
APPENDIX H. Commodity History (A Chronological Listing)
Start Date End Date Commodity Type
May 91 Dec 96 Grapes Fresh
May 91 Dec 94 Lettuce Fresh
May 91 Dec 95 Potatoes Fresh
Aug 91 Dec 93 Grapefruit Fresh
Aug 91 Dec 96 Oranges Fresh
Sep 91 Dec 96 Apples Fresh
Sep 91 Sep 95 Bananas Fresh
Feb 92 Mar 94 Celery Fresh
Feb 92 Dec 95 Green Beans Fresh
Feb 92 Sep 96 Peaches Fresh
Oct 92 Dec 94 Broccoli Fresh
Oct 92 Sep 96 Carrots Fresh
Apr 94 Mar 96 Sweet Corn Canned/Frozen
Apr 94 Jun 96 Peas Canned/Frozen
Jan 95 Spinach Fresh
Feb 95 Wheat Grain
Jan 96 Milk Dairy
Jan 96 Green Beans Canned/Frozen
Jan 96 Sweet Potatoes Fresh
Jul 96 Tomatoes Fresh
Jul 96 Apple Juice Processed
Sep 96 Soy Beans Grain
Dec 96 Peaches Canned
Jan 97 Orange Juice Processed
Jan 97 Pears Fresh
Jan 97 Winter Squash Fresh

PESTICIDE DATA PROGRAM
Annual Summary - Calendar Year 1995
Your satisfaction is very important to us and we welcome your comments andsuggestions. Thank you for taking a moment to fill out and return this card. How would you rate this document on: Good Fair PoorVisual Presentation? 9 9 9Ease of Readability? 9 9 9Information Provided? 9 9 9
Comments/ Suggestions: (Attach additional pages if needed)
How did you obtain this copy?_____________________________________
Would you like additional copies? (limit 10 per person, 25 per organization)
# Requested _______ Mailing Address ________________________________
________________________________________________________________
________________________________________________________________
Would you like to have your name/organization added to our mailing list?
________________________________________________________________
Mail to:
Dr. Robert L. Epstein, Deputy DirectorScience and Technology Division
Agricultural Marketing Service, USDAPO Box 96456, Stop Code 0222Washington, DC 20090