Pervasive Area Poverty modelled household income in a · PDF filemodelled household income in...
32
Pervasive Area Poverty: a pilot study applying modelled household income in a NILS context April 2009 R S Alan McClelland OFMdFM Equality Directorate Research Branch and David Donnelly Northern Ireland Longitudinal Study Research Support Unit
-
Upload
truongdiep -
Category
Documents
-
view
225 -
download
2
Transcript of Pervasive Area Poverty modelled household income in a · PDF filemodelled household income in...

Pervasive Area Poverty: a pilot study applying
modelled household income in a NILS context
April 2009
R S
Alan McClelland OFMdFM Equality Directorate Research Branch and David Donnelly Northern Ireland Longitudinal Study Research Support Unit
1
Summary Analysis of the application of the recently developed low household income modelled data for Northern Ireland (Anderson, 2008) to the Northern Ireland Longitudinal Study (NILS)
1 has indicated
that it is a robust and appropriate spatial measure of income disadvantage to be used in that context. In addition, the modelled low household income data could provide a more coherent spatial measure of income for NILS analyses compared to the social security benefit-based income domain within the Northern Ireland Multiple Deprivation Measure. Application of the modelled low household income data to the NILS also provides a solution to potential problems of colinearity in applying the existing Multiple Deprivation Measure to the NILS for morbidity and mortality analyses. Analyses completed would also indicate that the modelled low household income data appears a potential alternative to the social security benefit data underpinning the current income domain within the overall Multiple Deprivation Measure for Northern Ireland. Finally, the development by the low household income modelled data of Gini coefficient scores at Census-based Super Output Area level provides a unique perspective in identifying the extent of homogeneity of income disadvantage within an area, that is, in the identification of pervasively poor areas.
1. Introduction 1.1 Low income, social disadvantage and health outcomes The relationship between measures of social disadvantage and differentials in health outcomes are well documented (for example: World Health Organisation, 2008; DHSSPS, 2007; OFMdFM, 2008).
1 See: www.nisra.gov.uk/nils/default.asp.htm
Similarly, the strength of the relationship between the health, social and economic outcomes of people, families, communities and the characteristics of their geographic area of residence has long been established. In response, Government has had a long history of implementing policies and strategic interventions based on geographic areas objectively, through a variety of different methodologies, identified as areas of relative need and warranting specific intervention. Underpinning these initiatives has been the establishment of spatial geographic measures reflecting social disadvantage including, for example, the Robson indices, the Townsend indices and most recently, the Northern Ireland Multiple Deprivation Measure (MDM) (NISRA, 2005). In general terms, area measures of relative deprivation combine a range of disparate, although inter-related, statistical measures into a single ranked index. Comprised of seven separate statistical domains (income, employment, health, education, proximity to services, environment, and crime), the income domain within the current Northern Ireland Multiple Deprivation Measure incorporates social security benefit receipt data and is therefore an indirect spatial measure of household income. Whilst the Family Resources Survey and its sister publication, Households Below Average Income NI (HBAI) produced by the Department for Social Development, provide NI-wide estimates of household income and low income, these are not replicable at small geographic areas due to the limitations of survey sample size. Given the strength of the relationship between household income and health outcomes, and the desirability and potential utility of a robust small area spatial income measure within the MDM context, a research project was commissioned by the Northern Ireland Statistics and Research Agency (NISRA) to investigate the potential for developing a method of modelling household low income data for each of the 890 Census-based Super Output Areas (SOA) for Northern Ireland.

2
Published in 2008 the project, conducted by researchers based at the University of Essex, produced modelled household low income estimates for SOAs together with Gini coefficients which measure household income equality/inequality within each SOA. The modelled household low income data was recognized as having further potential as a spatial and individual marker which could be used within the Northern Ireland Longitudinal Study (NILS) and its sister dataset the Northern Ireland Mortality Study (NIMS). The application of the modelled low household income data to the NILS/NIMS could resolve a potential problem in applying the Northern Ireland Multiple Deprivation Measure to the NILS/NIMS and in any subsequent analyses of mortality and morbidity. The inclusion of a health domain within the MDM introduces an inherent risk of colinearity in analyses. That is, that differences observed in using the MDM could be the result of the inclusion of the health statistical domain and not reflecting ‘pure’ differences in mortality or morbidity. These colinearity issues hold for other socio-economic analyses utilising MDM and the coverage of underpinning domains, for example, unemployment (covered by the employment domain), and crime perspectives (covered by the crime and disorder domain). Application of the household low income data in the NILS and NIMS context could potentially aid analyses of the drivers of differences in morbidity and mortality outcomes. 1.2 The Northern Ireland Longitudinal Study (NILS) The Northern Ireland Longitudinal Study (NILS) is a large-scale data linkage study which has been created by linking administrative and statistical data. The study is designed for statistical and research purposes only and is managed under Census legislation. Information from health registrations, birth and death registrations and the 1991 and 2001 Censuses are linked together to provide a detailed longitudinal record of a sample of Northern Ireland’s population. NILS members are selected on 104
annual birth dates with approximately 500,000 people (28% of the population) included in the linked dataset. A secondary dataset that links 2001 Census data to all deaths registered with the General Register Office (GRO) since July 2001 is also available to researchers. Known as the NI Mortality Study (NIMS) this dataset contains 100% of all death records, including those where a match to the 2001 Census was not possible.
Data Included in NILS
A variety of administrative and statistical data are linked in the NILS. Most of the data come from the 2001 Census, GRO vital events and demographic data derived from health registrations. The datasets include:
• 2001 Census data for NILS members including: - Age, sex, marital status, ethnicity,
community background (religion); - Household composition, family
types, relationships; - Housing details, including tenure,
accommodation type, rooms and amenities;
- Country of birth, knowledge of Irish;
- Educational qualifications, students;
- Economic activity, occupation, industry and social class;
- Migration, travel to work, number of cars in household;
- Long-standing illness, self-rated health, care giving.
- 2001 Census data for those living in the same household as a NILS member.
- Vital Events (GRO Data): - New births into the sample, births
to sample mothers and fathers, stillbirths to sample mothers and fathers;
- Infant mortality of children of sample mothers and fathers;
- Deaths of sample members; - Marriages of sample members.
• Migration Events (Health Card Data): - Immigrants into the sample; - Emigration out of Northern Ireland
of sample members;
3
- Re-entries into Northern Ireland after previous emigrations of sample members;
- Migration within Northern Ireland of sample members.
• Valuations and Lands Agency (VLA) Data: - Household characteristics such as
number of rooms, property type, floor space, central heating;
- Capital values of each property.
As such, it has not been possible to date, to analyses NILS data from an income perspective. Social disadvantage analysis has necessarily been reliant on variables that are demonstrated to correlate well with income measures (such as social class) and other outcome measures of disadvantage (OFMdFM, 2008). 1.3 Modelled household low income In the context of developing a potential spatial income variable for use within geographic measures of multiple deprivation, NISRA commissioned researchers from the Institute for Social and Technical Research within the University of Essex, to develop a preliminary spatial microsimulation model which estimates the spatial distributions of income and income deprivation for each Northern Ireland Super Output Area (SOA) in 2005 (Anderson, 2008). The method employed was to combine small area level data from the 2001 Census with the 2003-4 and 2004-5 Family Resources Survey (FRS). The initial income deprivation indicator selected for modelling was the proportion of households in each SOA whose gross household income was below 60% of the national (UK) median gross household income (%HHBMI) based on the FRS 2004-5. The methodology essentially involved identifying a set of household level constraint variables common to both the FRS and Census and known to be reasonable predictors of income at the small area and household levels. Following discussion of the initial results, the model was extended to the development of an indicator of households
whose equivalised2 net income before
housing costs (BHC) was less than 60% of the UK median equivalised net income BHC using the pooled 2003-4 and 2004-5 FRS surveys. This indicator is commonly referred to as relative income poverty or households with low income. An important distinction is worth emphasising at this point. The model does not produce a ‘real’ estimate of the proportion of households with low incomes for each SOA. Rather, the model produces a ‘synthetic’ probability estimate of the proportion of households within each SOA who have low incomes based on the application of the FRS-identified constraint variables to Census-based information for those households in each SOA. Of specific interest to the current paper are two outputs from this research:
• geographically referenced probability estimates for household low income for each Super Output Area level
• Gini coefficient measures of income equality/inequality for each SOA
2. Aims, objectives and methods 2.1 Aims and objectives The broad aim of the current paper is to consider the potential utility and application of the modelled household low income data at spatial and individual, levels within the NILS. After update of the NILS data with the appropriate variable, the specific objectives of the current paper include:
• Assessing the relationship between the household low income model and
2 Equivalisation is the process of adjustment of
household incomes to take account of household size and composition. Equivalisation reflects the reality that larger households exert a greater strain on household incomes compared to smaller households. Essentially equivalisation can be viewed as a proxy adjustment for expenditure pressure on household income. Equivalisation adjusts household income to compensate for different expenditure pressure but it does not make the household income of different types equivalent in comparison.

4
both the Multiple Deprivation Measure (MDM) and the income domain within the overall MDM, at Super Output Area level
• Comparing deciles of low household income with deciles of MDM and the income domain within the MDM for a range of individual and household characteristics at SOA level
• Applying the low household income model directly to the NILS and comparing the outcome in terms of low income individual and household characteristics with figures sourced from the HBAI NI reports
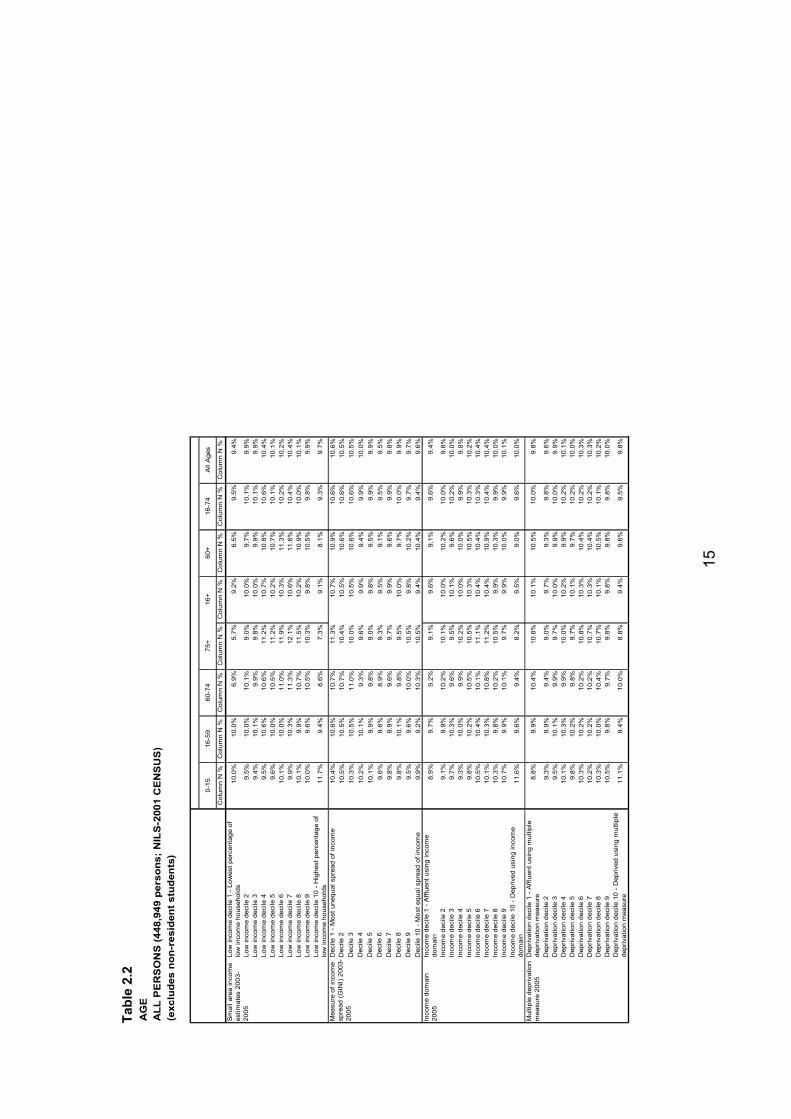
2.2 Methodology All 2001 Census records available from the NILS sample were selected for analysis (448,949 persons, 165,125 households). A Super Output Area is assigned to each record on NILS using the postcode information contained in the 2001 Census and a postcode to SOA lookup file known as the Central Postcode Directory (NISRA, 2008). The postcode/SOA data on the 2001 Census is 100% complete. Using the SOA data, deprivation deciles (i.e. 89 SOAs each) were assigned to NI individuals and households using five separate measures: 1. The percentage of households in each
SOA in relative poverty 2. Gini-coefficients which describe the
equality of income distribution within each SOA
3. Noble (2005) multiple deprivation measure (MDM)
4. Noble (2005) income domain used in the MDM
5. Noble (2005) health domain used in the MDM
For each deprivation measure the 10% most affluent SOAs were assigned to decile 1, while the 10% most deprived SOAs were assigned to decile 10. For the Gini-coefficient the 10% of the SOAs with the least income dispersal were assigned to decile 1, while the 10% of the SOAs with the most income dispersal were assigned to decile10.
The first two measures are the primary outcomes from the low income household model which was developed for NISRA by the University of Essex. The first of these measures involved the development of logistic regression models for income (unequivalised and equivalised) using data available from the 2004-05 FRS. These models were then applied to the small area (SOA) data from the Census, which along with sophisticated spatial microsimulation techniques to adjust for different household characteristics within each SOA, resulted in the derivation of the required area based measure. Using similar logic the income models developed in this project could be applied to the original household and individual records to produce estimates for income without the need for spatial microsimulation. The regression model applied to individual and household records on NILS is only moderately successful as a predictor of income with an R
2 value of 0.472 for
unequvalised income and 0.188 for equvalised income. On that basis, it was decided to utilise a low income binary measure for each NILS household distinguishing those households with a 50% or more probability of having a household income that is 60% or more below the UK median (low income households), from those with a less than 50% probability. Some question as to the applicability and accuracy at a household level of this process exists. Comparisons of the results of this model with the HBAI are made in this paper and an assessment of its utility is made.
3. Results 3.1 Household low income model, the Multiple Deprivation Measure, and income and health domains within the MDM Within the NILS dataset each SOA was assigned a modelled household low income estimate, that is, the proportion of households within each SOA estimated to have a household equivalised income below 60% of the UK median equivalised household income.

5
Scatterplots and correlations were run for all comparative combinations of: the low household income model, MDM, and income and health domains within the MDM. Figure 1: Relationship between modelled household low income estimates and respective Multiple Deprivation Measure score for each SOA
Unsurprisingly given the extent of the linear nature of the scatterplot (Figure 1), the Pearson correlation is positive and significant (0.873; P<0.01). That is, as the percentage of households with low incomes within SOAs increase, so does their respective multiple deprivation score. Figure 2: Relationship between modelled low household income estimates and Income domain score within the Multiple Deprivation Measure for each SOA
The correlation of the modelled household low income measure to the Income domain score within the overall MDM at SOA level (Figure 2) is positive and significant (0.906; P<0.01).
Figure 3: Relationship between modelled low household income estimates and health domain score within the Multiple Deprivation Measure for each SOA
Correlating the modelled household low income measure with the health domain score within the overall MDM at SOA level yielded a positive and significant result (0.676; P<0.01) (Figure 3). As interesting comparisons, and as useful benchmarks for the above correlations, the Pearson correlation between the Multiple Deprivation Measure score and the Income domain score within the MDM for SOAs within the NILS was also, as expected, positive and significant (0.966; P<0.01). The correlation between the overall MDM score and the health domain score was positive and significant (0.818; P<0.01), as was the correlation between the income domain and the health domain within the overall MDM (0.743; P<0.01). Gini coefficient analysis The modelled low household income research project (Anderson, 2008) also developed Gini coefficient scores for each SOA. The Gini coefficient is a statistical measure reflecting the degree of equality or inequality in the distribution of a measure. The statistic yields a single score which ranges from 0.0 (theoretical total equality) to 1.0 (theoretical total inequality). So, for example, if in looking at household incomes within an SOA we found a Gini coefficient score of 0.0, then all households in that SOA would have exactly the same amount of income. If, in this example, the Gini coefficient score

6
was 1.0 then one household within the SOA would have all the income. Another perspective on the Gini coefficient in the context of household incomes within a small geographic area is to consider it as a measure of household income diversity. That is, a low Gini coefficient score for a small area indicates an area with a low degree of difference, with households in that area more similar in terms of household income. A higher Gini coefficient score for a small area indicates a greater degree of difference or diversity in the incomes of those households in that area. Figure 4: Relationship between modelled Gini coefficient score and modelled household low income estimates for each SOA
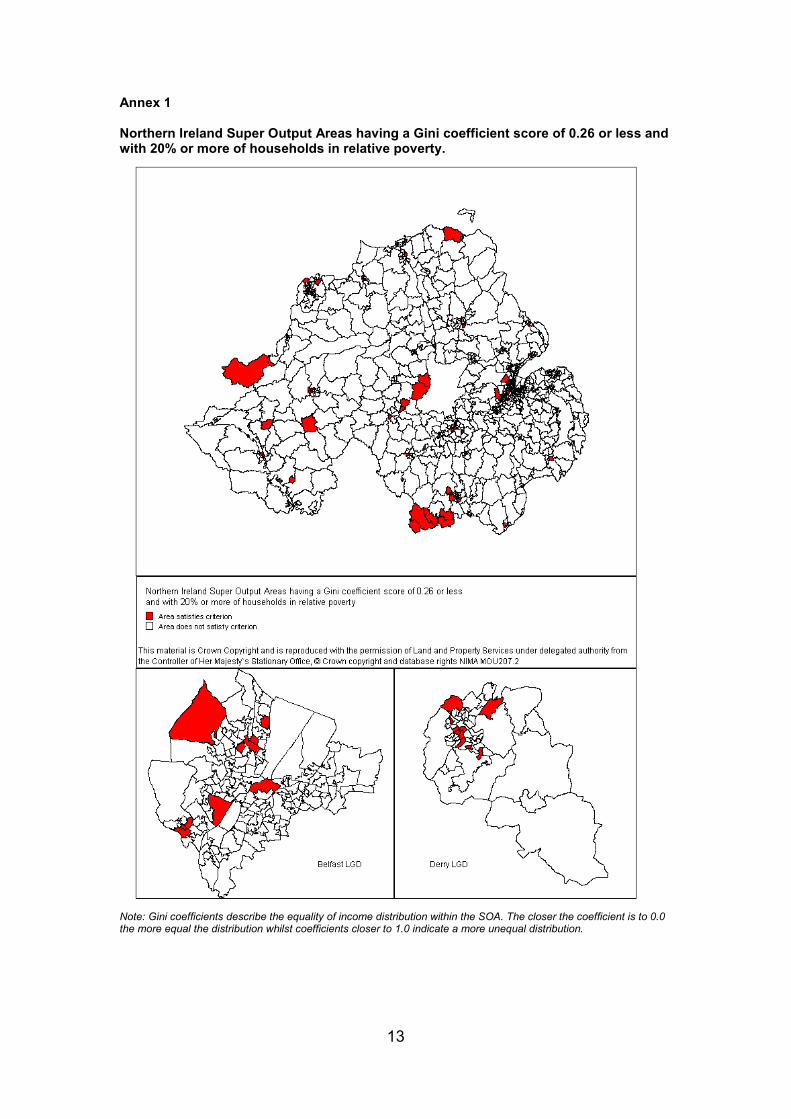
In comparing Gini scores and modelled household low income estimates, the scatterplot in Figure 4 demonstrates a high degree of clustering of SOAs with Gini coefficient scores ranging from 0.35 to 0.26 and with relative household low income rates ranging from around 10% to 20%. Unsurprisingly give the extent of clustering the Spearman correlation was relatively weak and negative (-0.323, P<0.01). The one notable SOA outlier, with a low household income rate of around 15% and with a Gini coefficient score of 0.35, is Botanic_1 SOA reflecting an area which has a high density of rented accommodation and resulting transient population adjacent to the Queen’s University of Belfast. Of note from the scatterplot, is a tail of SOAs with a low Gini coefficient of 0.26 or less but with a relatively higher rate of
household low income of 20% or more. These 80 SOAs (around 9% of all SOAs) could be described as being ‘pervasively’ poor (see Annex 1 for map) compared to the vast majority of SOAs which are clustered within a relatively tight range of Gini and low household income levels. Figure 5: Relationship between Gini coefficient score and Multiple Deprivation Measure score for each SOA
Figure 5 demonstrates that whilst the modelled Gini coefficient data exhibits a degree of clustering with the Multiple Deprivation Measure scores for each SOA, a weak negative correlation was also found (-0.381; P<0.01). A similar ‘tail’ to the cluster of SOAs to that found in Figure 4 was also apparent. That is, a group of SOAs which could be described as ‘pervasively’ poor in having relatively lower levels of inequality or difference but which exhibit relatively higher levels of household low income. A similar result was obtained in correlating the modelled Gini coefficient scores with the Income domain score within the overall MDM (-0.366, P<0.01) (Figure 6). Figure 6: Relationship between modelled Gini coefficient score and the Income domain score within the MDM for each SOA
7
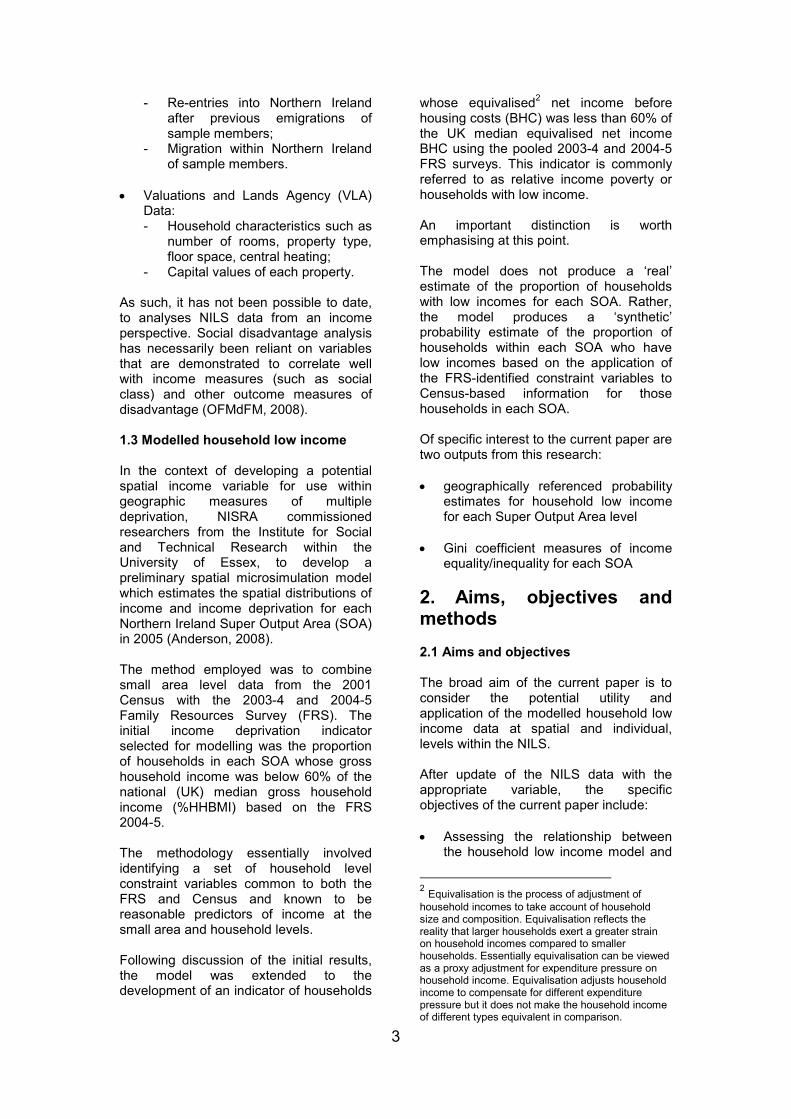
Figure 7: Relationship between modelled Gini coefficient score and the health domain score within the MDM for each SOA
The correlation between modelled Gini coefficient score and health domain score within the overall MDM (Figure 7) was negative (-0.546; P<0.01) and proved the strongest of the three correlations with the Gini coefficient scores. The relationship between small area poverty and within small area income distribution utilising the modelled low household income data, will be further explored in an article within the forthcoming Labour Market Bulletin (DEL). Discussion The degree of correlation between the modelled household low income data with the Multiple Deprivation Measures for NI were detailed as an integral part of the validation process for the household low income modelling project (Anderson, 2008). Similarly strong correlations have been achieved here in the application of the respective measures to the NILS data. Correlating modelled Gini scores for SOAs with: the modelled household low income data; the overall MDM score; and with the income domain score within the overall MDM yielded similar results. The strongest correlation to the Gini scores was found with the health domain score. Applying a Gini perspective to area disadvantage measures represents a potentially useful and novel perspective on area disadvantage. This approach enables SOAs to be identified which could be termed ‘pervasively’ poor. That is, they
exhibit relatively high rates of modelled low household income and are areas in which low household income is more, rather than less, concentrated. Such an approach could potentially inform more nuanced public policy responses. For example, a policy response to areas with high levels of pervasive low household income could be substantially different than that to areas with high levels of low household income and a high degree of difference in the range of household incomes within that area. At heart this approach could enable the identification of more homogenous low household income areas compared to more heterogenous low household income areas. A Gini coefficient approach could also be applied to morbidity and mortality analyses with both the NILS and Mortality Study data to discern areas with relatively high and pervasive rates from areas of high but less pervasive rates of morbidity and mortality. 3.2 Modelled household low income estimates, Multiple Deprivation Measure scores and the income domain scores within the MDM The previous section indicated that the outcome of applying the low household income model to the NILS data at a spatial level compared very favourably to both the overall MDM scores and the income domain scores within the overall MDM. That is, all three spatial markers of disadvantage exhibited a strong degree of covariance. However, as with any correlation between two (or more) measures, the correlation is not perfect. To examine the extent to which both individual and household characteristics may vary between the three measures, each measure was split into equi-sized deciles. Each of the three spatial measures of disadvantage was analysed on a range of individual and household characteristics to assess both the extent of difference between them, and the extent to which they differed to the population distribution.
8
Differences referred to below relate to instances were the variation between the observed characteristics and the population distributions in the most advantaged or disadvantaged two deciles equals or exceeds 2 percentage points. Differences between the three spatial measures of disadvantage on the variables examined are highlighted on each occurrence. Individual variables There were no observable differences on any of the three measures of disadvantage between respective deciles in terms of the distribution of sex (Annex 2 Table 2.1). In relation to broad age groupings, the distribution of age groups between deciles and for each measure reflects the distribution of all people over these SOA deciles. The one exception to this general finding is that the three disadvantage measures exhibit a slight over-representation of children aged under 16 in the most disadvantaged two deciles compared to the distribution of all people between these deciles (Annex 2 Table 2.2). Similar results were found for analyses by individual marital status. Broadly, the distribution of marital status groups between deciles reflected the population distribution. For all three disadvantage measures single people, widowers and divorcees are slightly under-represented in the least disadvantaged deciles and slightly over-represented in the most disadvantaged deciles (Annex 2 Table 2.3). In terms of community background, and over the three measures of disadvantage, those with a Catholic community background are over-represented in the most disadvantaged deciles and under-represented in the least disadvantaged deciles. Protestants are over-represented in the least disadvantaged deciles and underrepresented in the most disadvantaged deciles. Those with an ‘other’ or no religious community background are over-represented in the least disadvantaged deciles, and under-represented in the most disadvantaged deciles. These effects appeared slightly stronger with both the MDM and income domain scores (Annex 2 Table 2.4).
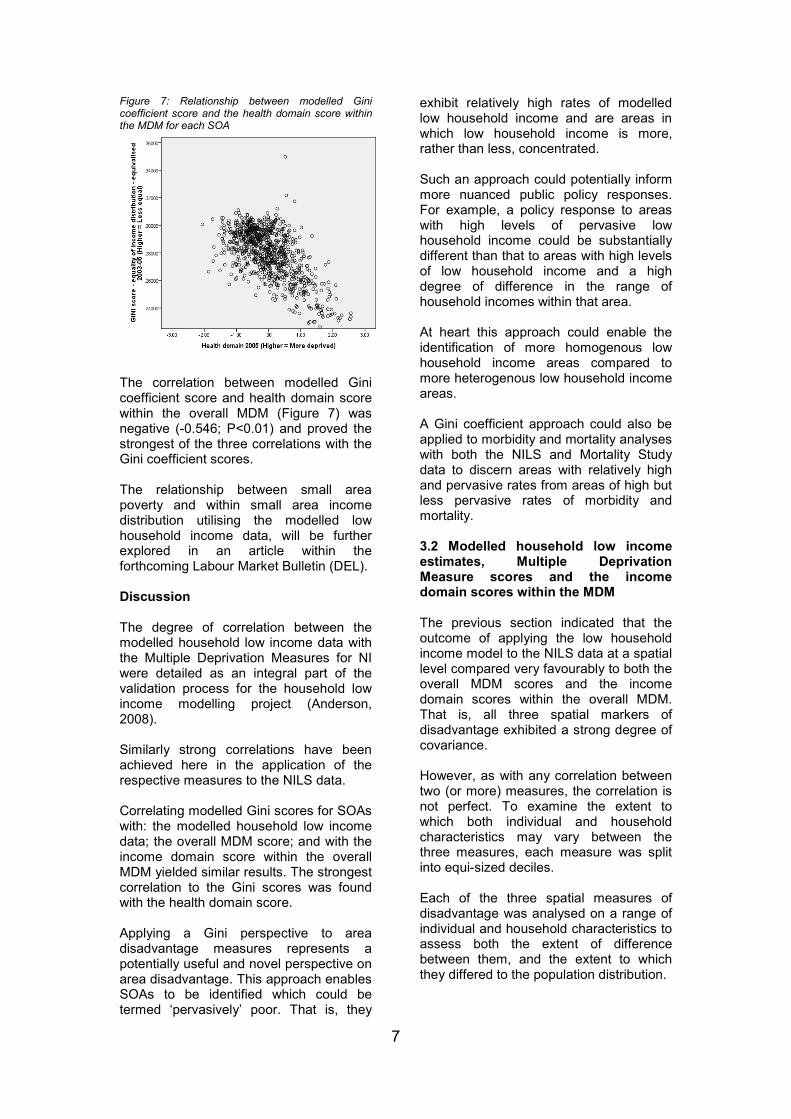
Those with a limiting long-term illness were found to be under-represented in the least disadvantaged deciles and over-represented in the most disadvantaged deciles (Annex 2 Table 2.5). In relation to categories of economic activity (Figure 8), employees are over-represented in the least disadvantaged deciles, the self-employed are strongly under-represented in the most disadvantaged deciles whilst the unemployed are strongly over-represented in the most disadvantaged deciles (Annex 2 Table 2.6). Figure 8: Distribution of economic activity type across decile of SOA household low income
.0%
2.0%
4.0%
6.0%
8.0%
10.0%
12.0%
14.0%
16.0%
18.0%
20.0%
Lowest
% of low
income
hhlds
Decile 2 Decile 3 Decile 4 Decile 5 Decile 6 Decile 7 Decile 8 Decile 9 Highest
% of low
income
hhlds
Household low income deciles
Employee Self-employed Unemployed
Those with no qualifications are over-represented in the most disadvantaged deciles and under-represented in the least disadvantaged deciles. Those with the highest level of qualifications are strongly under-represented in the most disadvantaged deciles and over-represented in the least disadvantaged deciles (Annex 2 Table 2.7). The general picture of advantage and disadvantage and under and over-representation amongst deciles detailed above also followed for social class as reflected by the National Statistics Socio-Economic Classification (NS-SeC) (Annex 2 Table 2.8). In broad terms, the picture emerging from the above individual analyses between the three spatial measures of disadvantage is one of extreme similarity.

9
Household variables Analyses were conducted as above with the NILS data, but with household level variables. In relation to housing tenure (Figure 9), households whose homes were owned outright or who were buying with a mortgage were under-represented in the most disadvantaged deciles and over-represented in the least disadvantaged deciles. Social rented households were strongly under-represented in the least disadvantaged deciles and strongly over-represented in the most disadvantaged deciles. Those households in private rented accommodation were under-represented in the least disadvantaged deciles (Annex 2 Table 2.9). Figure 9: Distribution of housing tenure across decile of SOA household low income
.0%
5.0%
10.0%
15.0%
20.0%
25.0%
Lowest
% of low
income
hhlds
Decile 2 Decile 3 Decile 4 Decile 5 Decile 6 Decile 7 Decile 8 Decile 9 Highest
% of low
income
hhlds
Household low income decile
Owned - outright Owned - mortgage or shared Social rented
Unsurprisingly, accommodation type followed the similar patterns seen with other measures of social disadvantage. Detached and semi-detached houses were under-represented in the most disadvantaged deciles and over-represented in the least disadvantaged deciles. Terraced housing and flats were strongly over-represented in the most disadvantaged deciles and under-represented in the least disadvantaged deciles (Annex 2 Table 2.10). There appeared to be little variation on any of the three spatial measures of disadvantage in relation to the distribution of households with dependent children (Annex 2 Table 2.11). Analyses by household size indicated that single person households were over-represented in the most disadvantaged deciles and under-represented in the least disadvantaged deciles. Larger sized
households tended to be over-represented amongst the most disadvantaged deciles and under-represented in the least disadvantaged deciles (Annex 2 Table 2.12). Family type analyses (Figure 10) indicated that households comprised of a married couple with no children were over-represented amongst the least disadvantaged deciles and under-represented in the most disadvantaged deciles. Similar (although weaker) results were found with cohabiting couples without dependent children. Lone parent households were strongly over-represented amongst the most disadvantaged deciles and strongly under-represented amongst the least disadvantaged deciles. A similar, although weaker, picture was found in relation to households comprised of a cohabiting couple with children (Annex 2 Table 2.13). Figure 10: Distribution of families with children across decile of SOA household low income
.0%
2.0%
4.0%
6.0%
8.0%
10.0%
12.0%
14.0%
16.0%
18.0%
20.0%
Lowest
% of low
income
hhlds
Decile 2 Decile 3 Decile 4 Decile 5 Decile 6 Decile 7 Decile 8 Decile 9 Highest
% of low
income
hhlds
Household low income decile
Married couple - With children Lone parent Cohabiting couple - With children
For pensioner households, one person pensioner households (both single male and single female) were under-represented in the least disadvantaged deciles and over-represented in the most disadvantaged deciles (Annex 2 Table 2.14). The work status of the household is unevenly distributed across deciles. Workrich households where all of working age are in employment, are under-represented in the most disadvantaged deciles and over-represented in the least disadvantaged deciles. Workless households, where no-one of working age is in employment are over-represented in the most disadvantaged deciles and under-represented in the least
10
disadvantaged deciles (Annex 2 Table 2.15). Other analysis Analyses as above were conducted on an urban/rural basis. Households in urban areas were found to be over-represented in the most disadvantaged deciles (Annex 2 Table 2.16). As with the individual level analyses, the striking finding with the household level analyses has been the degree of agreement between the three spatial measures of disadvantage across the range of household variables examined. Gini Coefficient Inequality Analysis The above analyses were also completed for the modelled household low income Gini coefficient scores for each SOA after separating into equi-sized deciles. On the basis that lower Gini scores reflect greater similarity in household incomes within a SOA and larger Gini scores reflect greater diversity or difference, key findings included (see tables in Annex 2):
• Those aged 75 and over were slightly over-represented in the most similar income deciles
• Married individuals were slightly under-represented in the most similar deciles and widowers and divorcees were over-represented in the most equal deciles
• Those with a Catholic community background are slightly over-represented in both the most diverse deciles and the two most similar deciles
• Those with a limiting long term illness are slightly under-represented in the most diverse deciles and over-represented in the most similar deciles
• The self-employed are strongly over-represented in the most diverse deciles and strongly under-represented in the most similar deciles
• The unemployed are strongly over-represented in the most similar deciles
• People with no qualifications are over-represented in the most similar deciles
• People with higher levels of qualifications are under-represented in the most similar deciles
• Households whose homes are owned outright are over-represented in the most diverse deciles and under-represented in the most similar deciles
• Social renting households are strongly over-represented in the most similar deciles and strongly under-represented in the most diverse deciles
• Households in detached homes are strongly over-represented in the most diverse deciles and strongly under-represented in the most similar deciles
• Households in terraced housing are strongly over-represented in the most similar deciles and strongly under-represented in the most diverse deciles
• Single person households are over-represented in the most similar deciles and under-represented in the most diverse deciles
• Married households with children are under-represented in the most similar deciles and over-represented in the most diverse deciles.
• Cohabiting households with children are under-represented in the most diverse deciles and over-represented in the most similar deciles
• Lone parent households are over-represented in the most similar deciles and under-represented in the most diverse deciles
• Households with at least one person in employment are under-represented in the most similar deciles and over-represented in the most diverse deciles
• Workless households with no-one of working age in employment are under-represented in the most diverse deciles and strongly over-represented in the most similar deciles
• Households in urban areas are strongly under-represented in the most diverse deciles and strongly over-represented in the most similar deciles
• Household in rural areas are very strongly over-represented in the most diverse deciles and very strongly under-represented in the most similar deciles
Discussion In comparing the selected individual and household characteristics and their distribution over deciles of the three spatial
11
disadvantage measures, the remarkable outcome is the extent of similarity between them. That is, not only do the three spatial measures of disadvantage exhibit strong spatial correlations with each other, but analysis of characteristics within these measures indicates a strong degree of similarity, certainly at the decile level. On that basis, we can conclude that there appears to be limited inherent bias in selecting one of these spatial measures of disadvantage for application to the NILS data and in subsequent analyses. A broad summary of the Gini coefficient analyses would be that characteristics associated with greater social and economic disadvantage tend to be over-represented in deciles which are more similar or homogenous. That is, households and individuals with characteristics associated with greater disadvantage exhibit a tendency to concentrate in areas with other people and households with similar such characteristics. Inevitably however, the picture is much more nuanced for each specific individual and household characteristic. 3.3 Applying the low household income model directly to NILS individual characteristics Theoretically, it was possible to apply the statistical model to the NILS dataset and to compare the characteristics of those individuals as identified as living in low income households to those characteristics published within the Households Below Average Income NI reports. This comparison would enable a direct assessment of the utility of applying the statistical model to the NILS data. The results reported in Annex 3 reflect the outcome of comparative analyses between results from the Households Below Average Income NI 2004/05 report and to both the outcomes of the equivalised and unequivalised low household income model. The results indicate considerable divergence from the estimates reported in the Households Below Average Income report for 2004/05.
In comparison the modelled household low income data analysed at the individual level appears to:
• Underestimate the overall proportion of people in low income households
• Greatly underestimate the proportion of children in low income households
• Underestimate the impact of increasing numbers of children in the household
• Underestimate the level of low income households amongst those in houses owned outright or being bought with a mortgage
• Either grossly overestimate the level of pensioner poverty (unequivalised model) or grossly underestimate the level of pensioner poverty (equivalised model).
Discussion On the basis of the analyses above, it does not appear appropriate to apply the low household income model directly to the NILS data and to analyse on an individual basis given the considerable degree of variation in NILS-based individual characteristics compared to the base data (HBAI NI).
12
4. Conclusions The low household income estimates developed by the Institute for Social and Technical Research at the University of Essex (Anderson, 2008) has proven to correlate well with the existing spatial Multiple Deprivation Measure when applied to NILS data. Further analyses indicated that there appears to be little inherent bias, either at individual and household level, between the low household income model, the overall MDM, and the income domain within the overall MDM after application to the NILS. On that basis, the low household income model data appears fit for purpose for application to the NILS/NIMS data at a spatial level. An additional benefit with this data is that the underlying statistical model can be periodically rechecked, recalibrated and recalculated as the source data (the Family Resources Survey) is collected on a continuous annual basis. The developed model for low household income has not, however, proven to be refined enough for application at individual household level within the NILS. The model was developed through applying household survey-based constraint variables to census data and these constraint variables are necessarily subject to the impacts of sampling variability and bias. In other words, it is unlikely that the low household income model, as it stands, is fine-grained enough for robust application and analysis at the individual household level within the NILS. The application and utility of the Gini coefficient scores in the NILS/NIMS context warrants further consideration in terms of both the modelled low household income data and in any spatial analyses of mortality and morbidity data as attached to both the NILS and NIMLS. Based on the analyses above, the modelled low household income data would also appear to provide an appropriate alternative to the current use of social security benefit data within the income domain of the Multiple Measure of Deprivation for Northern Ireland.
Finally, the production of Gini coefficient SOA estimates provides the ability to identify areas which are relatively disadvantaged (on a range of spatial measures) yet are areas of high household income similarity, enabling the identification of areas which could be described as ‘pervasively’ poor.
5. References Anderson, B Creating small area income deprivation estimates for Northern Ireland: spatial microsimulation modelling. NISRA Occasional Paper No. 27 (2008) www.nisra.gov.uk/archive/demography/publications/IncEst_Model.pdf DHSSPS, Health and Social Care Inequalities Monitoring System: Second Update Bulletin, (2007) www.dhsspsni.gov.uk/inequalities_monitoring_update2.pdf DEL, The relationship between small area poverty and within small area income distribution in The Labour Market Bulletin No.22 (forthcoming) www.delni.gov.uk/index/statistics-and-research/labour-market.htm DSD, Households Below Average Income, Northern Ireland Report 2005 – 2006 (2007) www.dsdni.gov.uk/index/stats_and_research/stats-publications/stats-family-resource/households/publications-hbai_publication_2005_06.ht McClelland, Alan (2008) Differences in Mortality Rates in NI 2002 – 2005 – A Section 75 and Social Disadvantage Perspective. OFMdFM www.ofmdfmni.gov.uk/differences-in-mortality-rates-in-ni-2002-2005 NISRA, Northern Ireland Multiple Deprivation Measure, (2005) www.nisra.gov.uk/archive/deprivation/NIMDM2005FullReport.pdf
World Health Organisation, (2008) Closing the Gap in a Generation: Health Equity through Action on the Social Determinants of Health. Final Report of the Commission on Social Determinants of Health www.who.int/social_determinants/final_report/en/
13
Annex 1 Northern Ireland Super Output Areas having a Gini coefficient score of 0.26 or less and with 20% or more of households in relative poverty.
Note: Gini coefficients describe the equality of income distribution within the SOA. The closer the coefficient is to 0.0 the more equal the distribution whilst coefficients closer to 1.0 indicate a more unequal distribution.

14
Annex 2 Supplementary tables
Table 2.1
SEX
ALL PERSONS (448,949 persons; NILS-2001 CENSUS)
(excludes non-resident students)
Male
Female
Total
Column N %
Column N %
Column N %
Low income decile 1 - Lowest percentage of
low income households
9.5%
9.3%
9.4%
Low income decile 2
10.1%
9.7%
9.9%
Low income decile 3
10.0%
9.8%
9.9%
Low income decile 4
10.5%
10.4%
10.4%
Low income decile 5
10.1%
10.0%
10.1%
Low income decile 6
10.3%
10.2%
10.2%
Low income decile 7
10.4%
10.5%
10.4%
Low income decile 8
10.0%
10.3%
10.1%
Low income decile 9
9.7%
10.1%
9.9%
Low income decile 10 - Highest percentage of
low income households
9.5%
9.9%
9.7%
Decile 1 - Most unequal spread of income
11.1%
10.2%
10.6%
Decile 2
10.9%
10.2%
10.5%
Decile 3
10.7%
10.3%
10.5%
Decile 4
10.1%
9.8%
10.0%
Decile 5
9.8%
9.9%
9.9%
Decile 6
9.3%
9.7%
9.5%
Decile 7
9.7%
10.0%
9.8%
Decile 8
9.8%
10.0%
9.9%
Decile 9
9.5%
9.9%
9.7%
Decile 10 - Most equal spread of income
9.1%
10.0%
9.6%
Income decile 1 - Affluent using income
domain
9.3%
9.4%
9.4%
Income decile 2
9.8%
9.7%
9.8%
Income decile 3
10.2%
9.9%
10.0%
Income decile 4
9.9%
9.7%
9.8%
Income decile 5
10.3%
10.1%
10.2%
Income decile 6
10.5%
10.3%
10.4%
Income decile 7
10.3%
10.4%
10.4%
Income decile 8
10.0%
10.1%
10.0%
Income decile 9
9.9%
10.2%
10.1%
Income decile 10 - Deprived using income
domain
9.8%
10.2%
10.0%
Deprivation decile 1 - Affluent using m
ultiple
deprivation m
easure
9.7%
9.9%
9.8%
Deprivation decile 2
9.6%
9.6%
9.6%
Deprivation decile 3
10.1%
9.8%
9.9%
Deprivation decile 4
10.2%
10.1%
10.1%
Deprivation decile 5
10.2%
9.9%
10.0%
Deprivation decile 6
10.4%
10.2%
10.3%
Deprivation decile 7
10.3%
10.2%
10.3%
Deprivation decile 8
10.1%
10.2%
10.2%
Deprivation decile 9
9.8%
10.1%
10.0%
Deprivation decile 10 - Deprived using m
ultiple
deprivation m
easure
9.6%
10.1%
9.8%
Small area income
estimates 2003-
2005
Income domain
2005
Multiple deprivation
measure 2005
Measure of income
spread (GINI) 2003-
2005
15
Table 2.2
AGE
ALL PERSONS (448,949 persons; NILS-2001 CENSUS)
(excludes non-resident students)
0-15
16-59
60-74
75+
16+
60+
16-74
All Ages
Column N %
Column N %
Column N %
Column N %
Column N %
Column N %
Column N %
Column N %
Low income decile 1 - Lowest percentage of
low income households
10.0%
10.0%
6.9%
5.7%
9.2%
6.5%
9.5%
9.4%
Low income decile 2
9.5%
10.0%
10.1%
9.0%
10.0%
9.7%
10.1%
9.9%
Low income decile 3
9.4%
10.1%
9.9%
9.8%
10.0%
9.9%
10.1%
9.9%
Low income decile 4
9.5%
10.6%
10.6%
11.2%
10.7%
10.8%
10.6%
10.4%
Low income decile 5
9.6%
10.0%
10.5%
11.2%
10.2%
10.7%
10.1%
10.1%
Low income decile 6
10.1%
10.0%
11.0%
11.9%
10.3%
11.3%
10.2%
10.2%
Low income decile 7
9.9%
10.3%
11.3%
12.1%
10.6%
11.6%
10.4%
10.4%
Low income decile 8
10.1%
9.9%
10.7%
11.5%
10.2%
10.9%
10.0%
10.1%
Low income decile 9
10.0%
9.6%
10.5%
10.3%
9.8%
10.5%
9.8%
9.9%
Low income decile 10 - Highest percentage of
low income households
11.7%
9.4%
8.6%
7.3%
9.1%
8.1%
9.3%
9.7%
Decile 1 - Most unequal spread of income
10.4%
10.6%
10.7%
11.3%
10.7%
10.9%
10.6%
10.6%
Decile 2
10.5%
10.5%
10.7%
10.4%
10.5%
10.6%
10.6%
10.5%
Decile 3
10.3%
10.5%
11.0%
10.0%
10.5%
10.6%
10.6%
10.5%
Decile 4
10.2%
10.1%
9.3%
9.6%
9.9%
9.4%
9.9%
10.0%
Decile 5
10.1%
9.9%
9.8%
9.0%
9.8%
9.5%
9.9%
9.9%
Decile 6
9.6%
9.6%
8.9%
9.3%
9.5%
9.1%
9.5%
9.5%
Decile 7
9.8%
9.9%
9.6%
9.7%
9.9%
9.6%
9.9%
9.8%
Decile 8
9.8%
10.1%
9.8%
9.5%
10.0%
9.7%
10.0%
9.9%
Decile 9
9.5%
9.6%
10.0%
10.5%
9.8%
10.2%
9.7%
9.7%
Decile 10 - Most equal spread of income
9.9%
9.2%
10.3%
10.5%
9.4%
10.4%
9.4%
9.6%
Income decile 1 - Affluent using income
domain
8.9%
9.7%
9.2%
9.1%
9.6%
9.1%
9.6%
9.4%
Income decile 2
9.1%
9.9%
10.2%
10.1%
10.0%
10.2%
10.0%
9.8%
Income decile 3
9.7%
10.3%
9.6%
9.5%
10.1%
9.6%
10.2%
10.0%
Income decile 4
9.3%
10.0%
9.9%
10.2%
10.0%
10.0%
9.9%
9.8%
Income decile 5
9.8%
10.2%
10.5%
10.5%
10.3%
10.5%
10.3%
10.2%
Income decile 6
10.5%
10.4%
10.1%
11.1%
10.4%
10.4%
10.3%
10.4%
Income decile 7
10.1%
10.3%
10.8%
11.2%
10.4%
10.9%
10.4%
10.4%
Income decile 8
10.3%
9.8%
10.2%
10.5%
9.9%
10.3%
9.9%
10.0%
Income decile 9
10.7%
9.9%
10.1%
9.7%
9.9%
10.0%
9.9%
10.1%
Income decile 10 - Deprived using income
domain
11.6%
9.6%
9.4%
8.2%
9.5%
9.0%
9.6%
10.0%
Deprivation decile 1 - Affluent using m
ultiple
deprivation m
easure
8.8%
9.9%
10.4%
10.8%
10.1%
10.5%
10.0%
9.8%
Deprivation decile 2
9.3%
9.9%
9.4%
9.0%
9.7%
9.3%
9.8%
9.6%
Deprivation decile 3
9.5%
10.1%
9.9%
9.7%
10.0%
9.9%
10.0%
9.9%
Deprivation decile 4
10.1%
10.3%
9.9%
10.0%
10.2%
9.9%
10.2%
10.1%
Deprivation decile 5
9.8%
10.2%
9.8%
9.7%
10.1%
9.7%
10.2%
10.0%
Deprivation decile 6
10.3%
10.2%
10.2%
10.8%
10.3%
10.4%
10.2%
10.3%
Deprivation decile 7
10.2%
10.2%
10.2%
10.7%
10.3%
10.4%
10.2%
10.3%
Deprivation decile 8
10.3%
10.0%
10.4%
10.7%
10.1%
10.5%
10.1%
10.2%
Deprivation decile 9
10.5%
9.8%
9.7%
9.8%
9.8%
9.8%
9.8%
10.0%
Deprivation decile 10 - Deprived using m
ultiple
deprivation m
easure
11.1%
9.4%
10.0%
8.8%
9.4%
9.6%
9.5%
9.8%
Measure of income
spread (GINI) 2003-
2005
Small area income
estimates 2003-
2005
Income domain
2005
Multiple deprivation
measure 2005

16
Table 2.3
MARITAL STATUS
ALL PERSONS (448,949 persons; NILS-2001 CENSUS)
(excludes non-resident students)
Single
Married
Widowed
Divorced
Total
Column N %
Column N %
Column N %
Column N %
Column N %
Low income decile 1 - Lowest percentage of
low income households
8.6%
10.9%
5.6%
6.8%
9.4%
Low income decile 2
8.9%
11.4%
8.4%
6.5%
9.9%
Low income decile 3
9.3%
10.7%
9.2%
8.0%
9.9%
Low income decile 4
10.0%
11.0%
10.1%
8.7%
10.4%
Low income decile 5
9.7%
10.4%
10.4%
8.7%
10.1%
Low income decile 6
10.1%
10.4%
11.1%
9.6%
10.2%
Low income decile 7
10.3%
10.2%
12.2%
11.8%
10.4%
Low income decile 8
10.5%
9.4%
11.7%
12.7%
10.1%
Low income decile 9
10.7%
8.4%
11.8%
14.1%
9.9%
Low income decile 10 - Highest percentage of
low income households
11.8%
7.2%
9.5%
13.1%
9.7%
Decile 1 - Most unequal spread of income
10.5%
11.2%
9.7%
5.7%
10.6%
Decile 2
10.4%
11.1%
9.8%
6.2%
10.5%
Decile 3
10.0%
11.3%
9.6%
7.4%
10.5%
Decile 4
9.6%
10.6%
8.9%
8.6%
10.0%
Decile 5
9.5%
10.4%
9.3%
9.6%
9.9%
Decile 6
9.5%
9.6%
9.3%
9.8%
9.5%
Decile 7
9.7%
9.8%
9.9%
12.1%
9.8%
Decile 8
9.9%
9.7%
10.4%
12.8%
9.9%
Decile 9
10.0%
9.0%
10.7%
13.4%
9.7%
Decile 10 - Most equal spread of income
10.8%
7.4%
12.4%
14.4%
9.6%
Income decile 1 - Affluent using income
domain
8.2%
11.1%
7.7%
6.2%
9.4%
Income decile 2
8.5%
11.4%
8.8%
7.6%
9.8%
Income decile 3
9.4%
10.9%
9.2%
8.2%
10.0%
Income decile 4
9.3%
10.4%
9.7%
9.0%
9.8%
Income decile 5
9.9%
10.4%
10.5%
9.1%
10.2%
Income decile 6
10.6%
10.3%
10.2%
9.3%
10.4%
Income decile 7
10.4%
10.1%
11.3%
12.3%
10.4%
Income decile 8
10.5%
9.3%
11.0%
12.0%
10.0%
Income decile 9
11.1%
8.7%
10.8%
13.1%
10.1%
Income decile 10 - Deprived using income
domain
12.1%
7.4%
10.7%
13.1%
10.0%
Deprivation decile 1 - Affluent using m
ultiple
deprivation m
easure
8.3%
11.7%
9.0%
6.9%
9.8%
Deprivation decile 2
8.6%
11.0%
8.4%
7.9%
9.6%
Deprivation decile 3
9.1%
11.0%
9.1%
8.5%
9.9%
Deprivation decile 4
9.8%
10.7%
9.8%
9.1%
10.1%
Deprivation decile 5
10.1%
10.2%
9.6%
8.8%
10.0%
Deprivation decile 6
10.5%
10.1%
10.1%
9.1%
10.3%
Deprivation decile 7
10.4%
10.0%
10.6%
10.3%
10.3%
Deprivation decile 8
10.6%
9.4%
11.2%
11.6%
10.2%
Deprivation decile 9
10.9%
8.6%
10.9%
13.7%
10.0%
Deprivation decile 10 - Deprived using m
ultiple
deprivation m
easure
11.7%
7.2%
11.3%
14.1%
9.8%
Small area income
estimates 2003-
2005
Income domain
2005
Multiple deprivation
measure 2005
Measure of income
spread (GINI) 2003-
2005
17
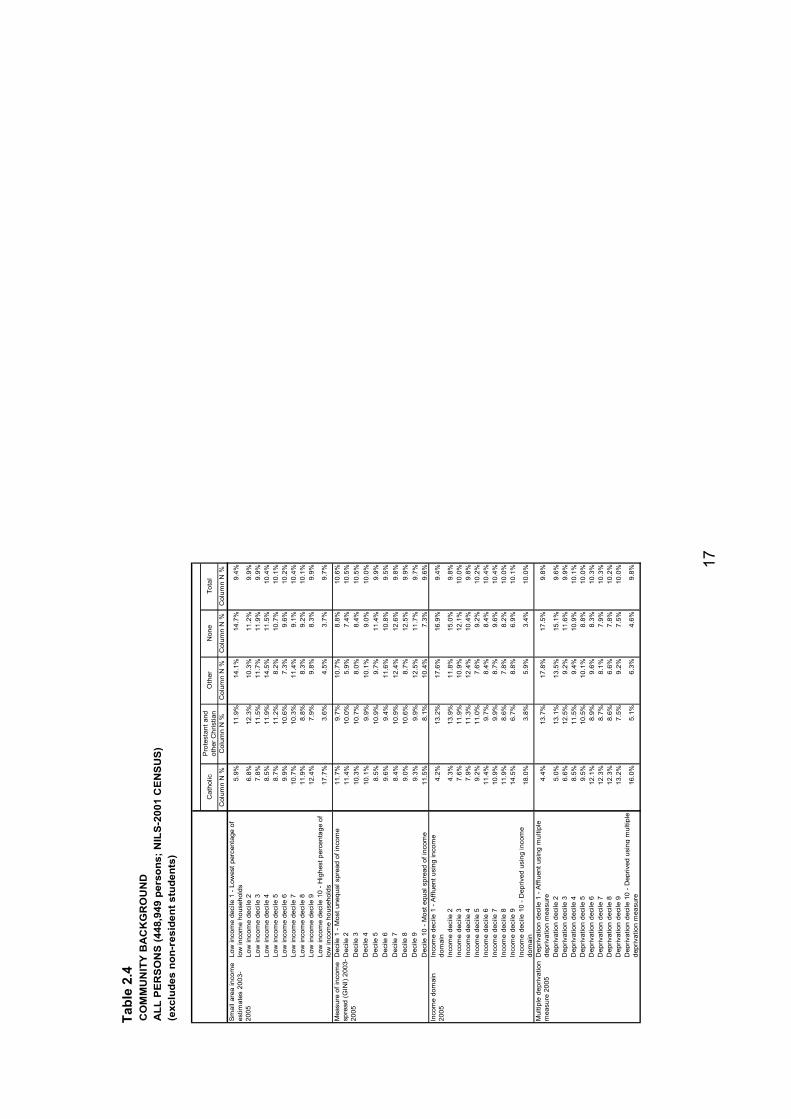
Table 2.4
COMMUNITY BACKGROUND
ALL PERSONS (448,949 persons; NILS-2001 CENSUS)
(excludes non-resident students)
Catholic
Protestant and
other Christian
Other
None
Total
Column N %
Column N %
Column N %
Column N %
Column N %
Low income decile 1 - Lowest percentage of
low income households
5.9%
11.9%
14.1%
14.7%
9.4%
Low income decile 2
6.8%
12.3%
10.3%
11.2%
9.9%
Low income decile 3
7.8%
11.5%
11.7%
11.9%
9.9%
Low income decile 4
8.5%
11.9%
14.5%
11.5%
10.4%
Low income decile 5
8.7%
11.2%
8.2%
10.7%
10.1%
Low income decile 6
9.9%
10.6%
7.3%
9.6%
10.2%
Low income decile 7
10.7%
10.3%
11.4%
9.1%
10.4%
Low income decile 8
11.9%
8.8%
8.3%
9.2%
10.1%
Low income decile 9
12.4%
7.9%
9.8%
8.3%
9.9%
Low income decile 10 - Highest percentage of
low income households
17.7%
3.6%
4.5%
3.7%
9.7%
Decile 1 - Most unequal spread of income
11.7%
9.7%
10.7%
8.8%
10.6%
Decile 2
11.4%
10.0%
5.9%
7.4%
10.5%
Decile 3
10.3%
10.7%
8.0%
8.4%
10.5%
Decile 4
10.1%
9.9%
10.1%
9.0%
10.0%
Decile 5
8.5%
10.9%
9.7%
11.4%
9.9%
Decile 6
9.6%
9.4%
11.6%
10.8%
9.5%
Decile 7
8.4%
10.9%
12.4%
12.6%
9.8%
Decile 8
9.0%
10.6%
8.7%
12.5%
9.9%
Decile 9
9.3%
9.9%
12.5%
11.7%
9.7%
Decile 10 - Most equal spread of income
11.5%
8.1%
10.4%
7.3%
9.6%
Income decile 1 - Affluent using income
domain
4.2%
13.2%
17.6%
16.9%
9.4%
Income decile 2
4.3%
13.9%
11.8%
15.0%
9.8%
Income decile 3
7.6%
11.9%
10.9%
12.1%
10.0%
Income decile 4
7.9%
11.3%
12.4%
10.4%
9.8%
Income decile 5
9.2%
11.0%
7.6%
9.2%
10.2%
Income decile 6
11.4%
9.7%
8.4%
8.4%
10.4%
Income decile 7
10.9%
9.9%
8.7%
9.6%
10.4%
Income decile 8
11.9%
8.6%
7.8%
8.2%
10.0%
Income decile 9
14.5%
6.7%
8.8%
6.9%
10.1%
Income decile 10 - Deprived using income
domain
18.0%
3.8%
5.9%
3.4%
10.0%
Deprivation decile 1 - Affluent using m
ultiple
deprivation m
easure
4.4%
13.7%
17.8%
17.5%
9.8%
Deprivation decile 2
5.0%
13.1%
13.5%
15.1%
9.6%
Deprivation decile 3
6.6%
12.5%
9.2%
11.6%
9.9%
Deprivation decile 4
8.5%
11.5%
9.4%
10.9%
10.1%
Deprivation decile 5
9.5%
10.5%
10.1%
8.8%
10.0%
Deprivation decile 6
12.1%
8.9%
9.6%
8.3%
10.3%
Deprivation decile 7
12.3%
8.7%
8.1%
7.9%
10.3%
Deprivation decile 8
12.3%
8.6%
6.6%
7.8%
10.2%
Deprivation decile 9
13.2%
7.5%
9.2%
7.5%
10.0%
Deprivation decile 10 - Deprived using m
ultiple
deprivation m
easure
16.0%
5.1%
6.3%
4.6%
9.8%
Small area income
estimates 2003-
2005
Income domain
2005
Multiple deprivation
measure 2005
Measure of income
spread (GINI) 2003-
2005

18
Table 2.5
LIM
ITING LONG-TERM ILLNESS
ALL PERSONS (448,949 persons; NILS-2001 CENSUS)
(excludes non-resident students)
Limiting long-term
illness
No limiting long-term
illness
Total
Column N %
Column N %
Column N %
Low income decile 1 - Lowest percentage of
low income households
5.9%
10.3%
9.4%
Low income decile 2
7.5%
10.5%
9.9%
Low income decile 3
8.2%
10.3%
9.9%
Low income decile 4
9.4%
10.7%
10.4%
Low income decile 5
9.8%
10.1%
10.1%
Low income decile 6
10.5%
10.2%
10.2%
Low income decile 7
11.3%
10.2%
10.4%
Low income decile 8
11.8%
9.7%
10.1%
Low income decile 9
12.5%
9.2%
9.9%
Low income decile 10 - Highest percentage of
low income households
13.1%
8.8%
9.7%
Decile 1 - Most unequal spread of income
9.6%
10.9%
10.6%
Decile 2
9.5%
10.8%
10.5%
Decile 3
9.4%
10.8%
10.5%
Decile 4
9.1%
10.2%
10.0%
Decile 5
8.8%
10.1%
9.9%
Decile 6
9.0%
9.7%
9.5%
Decile 7
9.8%
9.8%
9.8%
Decile 8
10.0%
9.9%
9.9%
Decile 9
11.3%
9.3%
9.7%
Decile 10 - Most equal spread of income
13.5%
8.5%
9.6%
Income decile 1 - Affluent using income
domain
6.4%
10.2%
9.4%
Income decile 2
7.6%
10.3%
9.8%
Income decile 3
8.1%
10.5%
10.0%
Income decile 4
8.8%
10.1%
9.8%
Income decile 5
9.9%
10.2%
10.2%
Income decile 6
10.5%
10.4%
10.4%
Income decile 7
11.0%
10.2%
10.4%
Income decile 8
11.4%
9.7%
10.0%
Income decile 9
12.4%
9.5%
10.1%
Income decile 10 - Deprived using income
domain
13.9%
9.0%
10.0%
Deprivation decile 1 - Affluent using m
ultiple
deprivation m
easure
7.0%
10.5%
9.8%
Deprivation decile 2
7.3%
10.2%
9.6%
Deprivation decile 3
8.3%
10.3%
9.9%
Deprivation decile 4
9.1%
10.4%
10.1%
Deprivation decile 5
9.4%
10.2%
10.0%
Deprivation decile 6
10.2%
10.3%
10.3%
Deprivation decile 7
10.8%
10.1%
10.3%
Deprivation decile 8
11.4%
9.9%
10.2%
Deprivation decile 9
12.4%
9.4%
10.0%
Deprivation decile 10 - Deprived using m
ultiple
deprivation m
easure
14.2%
8.7%
9.8%
Small area income
estimates 2003-
2005
Income domain
2005
Multiple deprivation
measure 2005
Measure of income
spread (GINI) 2003-
2005

19
Table 2.6
ECONOMIC ACTIVITY
ALL PERSONS (448,949 persons; NILS-2001 CENSUS)
(excludes non-resident students)
Employee
Self-employed
Unemployed
Economically
inactive
Not aged 16-74
Total
Column N %
Column N %
Column N %
Column N %
Column N %
Column N %
Low income decile 1 - Lowest percentage of
low income households
12.0%
10.2%
5.2%
6.6%
9.1%
9.4%
Low income decile 2
11.3%
13.9%
5.1%
8.2%
9.4%
9.9%
Low income decile 3
11.0%
12.5%
6.3%
8.7%
9.5%
9.9%
Low income decile 4
11.3%
12.4%
7.8%
9.7%
9.9%
10.4%
Low income decile 5
10.1%
12.6%
8.4%
9.7%
9.9%
10.1%
Low income decile 6
9.9%
12.0%
9.4%
10.2%
10.4%
10.2%
Low income decile 7
10.2%
9.6%
10.5%
11.0%
10.4%
10.4%
Low income decile 8
9.3%
7.9%
12.6%
11.2%
10.4%
10.1%
Low income decile 9
8.4%
5.6%
15.2%
11.8%
10.1%
9.9%
Low income decile 10 - Highest percentage of
low income households
6.5%
3.4%
19.7%
12.9%
10.9%
9.7%
Decile 1 - Most unequal spread of income
9.7%
17.5%
9.1%
10.4%
10.5%
10.6%
Decile 2
9.9%
17.0%
8.9%
10.2%
10.5%
10.5%
Decile 3
10.4%
14.4%
8.4%
10.2%
10.2%
10.5%
Decile 4
10.3%
11.9%
8.3%
9.3%
10.0%
10.0%
Decile 5
10.6%
10.2%
8.2%
9.1%
9.9%
9.9%
Decile 6
10.2%
8.0%
9.4%
9.0%
9.5%
9.5%
Decile 7
10.6%
7.1%
9.4%
9.5%
9.8%
9.8%
Decile 8
11.0%
6.0%
10.3%
9.6%
9.7%
9.9%
Decile 9
9.8%
4.9%
12.1%
10.4%
9.7%
9.7%
Decile 10 - M
ost equal spread of income
7.6%
2.9%
16.1%
12.3%
10.0%
9.6%
Income decile 1 - Affluent using income domain
11.3%
10.8%
4.2%
7.7%
8.9%
9.4%
Income decile 2
11.3%
12.6%
5.4%
8.1%
9.3%
9.8%
Income decile 3
11.6%
12.0%
6.3%
8.4%
9.6%
10.0%
Income decile 4
10.7%
11.9%
7.1%
8.9%
9.5%
9.8%
Income decile 5
10.4%
12.3%
8.3%
9.8%
10.0%
10.2%
Income decile 6
10.1%
12.6%
9.8%
10.1%
10.6%
10.4%
Income decile 7
10.1%
9.9%
11.1%
10.7%
10.3%
10.4%
Income decile 8
9.1%
8.5%
12.3%
11.0%
10.4%
10.0%
Income decile 9
8.6%
6.0%
15.0%
11.8%
10.5%
10.1%
Income decile 10 - Deprived using income
domain
6.6%
3.5%
20.5%
13.4%
11.0%
10.0%
Deprivation decile 1 - Affluent using m
ultiple
deprivation m
easure
11.7%
10.9%
4.8%
8.2%
9.2%
9.8%
Deprivation decile 2
11.5%
10.8%
5.4%
7.8%
9.2%
9.6%
Deprivation decile 3
11.3%
12.2%
6.2%
8.4%
9.6%
9.9%
Deprivation decile 4
10.8%
12.3%
7.4%
9.2%
10.0%
10.1%
Deprivation decile 5
10.4%
12.6%
8.1%
9.5%
9.7%
10.0%
Deprivation decile 6
9.9%
12.7%
9.8%
10.2%
10.4%
10.3%
Deprivation decile 7
9.8%
11.0%
10.5%
10.6%
10.3%
10.3%
Deprivation decile 8
9.3%
8.9%
13.0%
11.0%
10.4%
10.2%
Deprivation decile 9
8.6%
5.5%
15.2%
11.7%
10.4%
10.0%
Deprivation decile 10 - Deprived using m
ultiple
deprivation m
easure
6.7%
3.1%
19.6%
13.4%
10.6%
9.8%
Multiple deprivation
measure 2005
Measure of income
spread (GINI) 2003-
2005
Small area income
estimates 2003-
2005
Income domain
2005

20
Table 2.7
QUALIFICATIONS
ALL PERSONS (448,949 persons; NILS-2001 CENSUS)
(excludes non-resident students)
None
Level 1
Level 2
Level 3
Level 4
Level 5
Not aged 16-74
Total
Column N %
Column N %
Column N %
Column N %
Column N %
Column N %
Column N %
Column N %
Low income decile 1 - Lowest percentage of
low income households
6.3%
10.1%
11.3%
11.8%
14.3%
15.1%
9.1%
9.4%
Low income decile 2
7.8%
9.2%
11.6%
11.7%
14.6%
15.4%
9.4%
9.9%
Low income decile 3
8.5%
9.6%
10.7%
11.5%
13.2%
13.7%
9.5%
9.9%
Low income decile 4
9.3%
10.0%
11.2%
12.1%
13.3%
14.0%
9.9%
10.4%
Low income decile 5
10.2%
10.2%
10.4%
10.0%
9.8%
8.8%
9.9%
10.1%
Low income decile 6
10.6%
10.7%
10.1%
9.5%
9.1%
8.8%
10.4%
10.2%
Low income decile 7
11.4%
10.6%
10.2%
9.7%
8.5%
7.8%
10.4%
10.4%
Low income decile 8
11.4%
10.3%
9.4%
8.8%
7.6%
7.1%
10.4%
10.1%
Low income decile 9
12.2%
10.1%
8.0%
8.0%
5.7%
5.7%
10.1%
9.9%
Low income decile 10 - Highest percentage of
low income households
12.5%
9.3%
7.2%
6.8%
3.9%
3.8%
10.9%
9.7%
Decile 1 - Most unequal spread of income
9.8%
9.5%
11.4%
11.6%
12.5%
13.1%
10.5%
10.6%
Decile 2
10.6%
9.9%
11.1%
10.6%
10.9%
10.0%
10.5%
10.5%
Decile 3
9.9%
10.1%
11.3%
10.8%
12.0%
12.1%
10.2%
10.5%
Decile 4
9.0%
9.9%
10.8%
10.3%
11.5%
11.3%
10.0%
10.0%
Decile 5
9.0%
10.0%
10.4%
10.3%
11.2%
10.9%
9.9%
9.9%
Decile 6
8.6%
9.6%
9.9%
10.1%
11.0%
12.1%
9.5%
9.5%
Decile 7
9.5%
10.4%
9.9%
10.0%
9.9%
10.3%
9.8%
9.8%
Decile 8
10.1%
10.9%
9.9%
10.3%
9.1%
8.4%
9.7%
9.9%
Decile 9
10.9%
10.6%
8.6%
8.9%
7.2%
7.1%
9.7%
9.7%
Decile 10 - Most equal spread of income
12.5%
9.3%
6.7%
7.2%
4.7%
4.7%
10.0%
9.6%
Income decile 1 - Affluent using income
domain
5.8%
8.9%
11.2%
12.7%
16.7%
19.2%
8.9%
9.4%
Income decile 2
7.7%
9.4%
11.4%
11.5%
14.2%
14.4%
9.3%
9.8%
Income decile 3
8.4%
9.8%
11.3%
11.9%
13.5%
13.0%
9.6%
10.0%
Income decile 4
9.1%
10.2%
10.4%
10.6%
11.1%
11.4%
9.5%
9.8%
Income decile 5
10.2%
10.3%
10.5%
10.3%
10.2%
9.4%
10.0%
10.2%
Income decile 6
10.7%
10.8%
10.3%
9.9%
9.3%
8.1%
10.6%
10.4%
Income decile 7
11.4%
11.1%
10.0%
9.4%
7.9%
7.8%
10.3%
10.4%
Income decile 8
11.5%
10.0%
9.1%
8.5%
7.4%
6.7%
10.4%
10.0%
Income decile 9
12.2%
10.4%
8.5%
8.2%
5.7%
5.8%
10.5%
10.1%
Income decile 10 - Deprived using income
domain
13.0%
9.3%
7.2%
7.1%
4.2%
4.2%
11.0%
10.0%
Deprivation decile 1 - Affluent using m
ultiple
deprivation m
easure
6.1%
8.8%
11.8%
12.8%
18.0%
20.0%
9.2%
9.8%
Deprivation decile 2
7.4%
9.8%
11.3%
11.6%
13.7%
14.0%
9.2%
9.6%
Deprivation decile 3
8.5%
10.0%
11.2%
10.8%
12.8%
12.9%
9.6%
9.9%
Deprivation decile 4
9.3%
10.6%
10.9%
11.1%
11.2%
10.6%
10.0%
10.1%
Deprivation decile 5
10.0%
10.0%
10.1%
10.9%
10.5%
10.6%
9.7%
10.0%
Deprivation decile 6
10.6%
10.3%
10.1%
10.0%
9.6%
9.0%
10.4%
10.3%
Deprivation decile 7
11.2%
10.8%
10.2%
9.5%
7.8%
7.0%
10.3%
10.3%
Deprivation decile 8
11.8%
10.3%
9.2%
8.6%
7.1%
6.5%
10.4%
10.2%
Deprivation decile 9
12.0%
10.3%
8.4%
8.0%
5.6%
5.5%
10.4%
10.0%
Deprivation decile 10 - Deprived using m
ultiple
deprivation m
easure
13.2%
9.2%
6.8%
6.8%
3.9%
3.9%
10.6%
9.8%
Small area income
estimates 2003-
2005
Income domain
2005
Measure of income
spread (GINI) 2003-
2005
Multiple deprivation
measure 2005
21
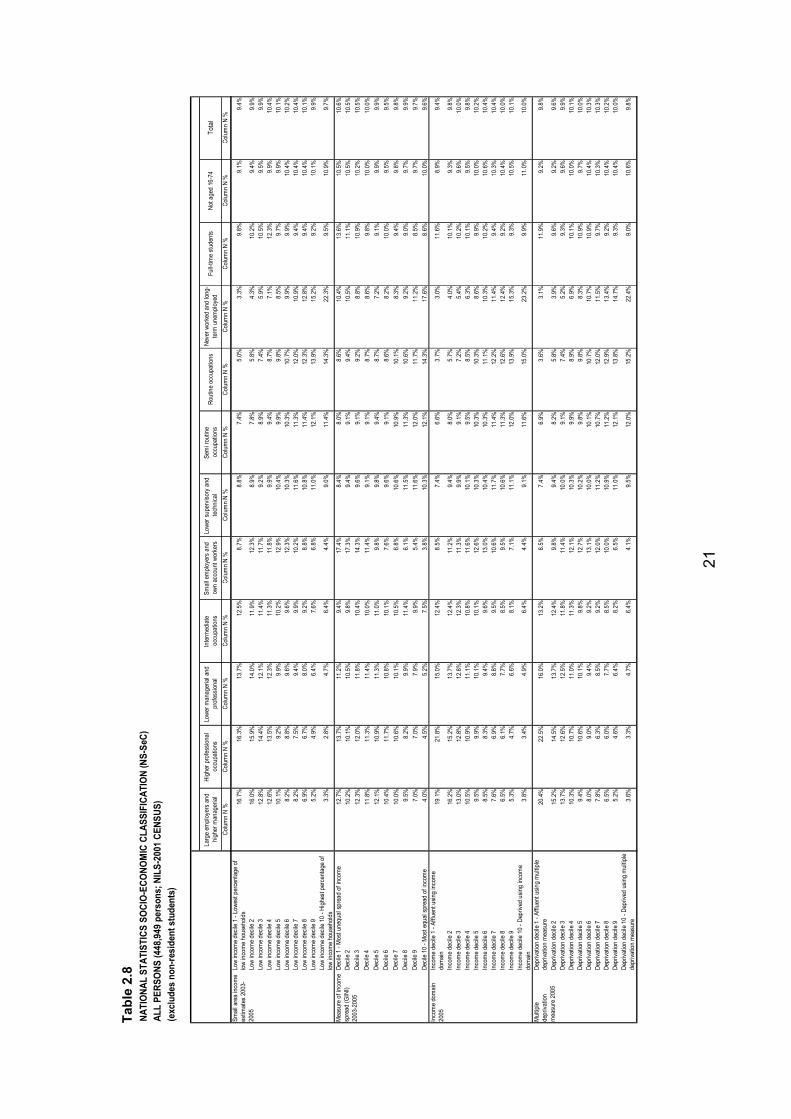
Table 2.8
NATIONAL STATISTICS SOCIO-ECONOMIC CLASSIFICATION (NS-SeC)
ALL PERSONS (448,949 persons; NILS-2001 CENSUS)
(excludes non-resident students)
Large employers and
higher managerial
Higher professional
occupations
Lower managerial and
professional
Interm
ediate
occupations
Small employers and
own account workers
Lower supervisory and
technical
Sem
i routine
occupations
Routine occupations
Never worked and long-
term
unem
ployed
Full-tim
e students
Not aged 16-74
Total
Column N %
Column N %
Column N %
Column N %
Column N %
Column N %
Column N %
Column N %
Column N %
Column N %
Column N %
Column N %
Low income decile 1 - Lowest percentage of
low income households
16.7%
16.3%
13.7%
12.5%
8.7%
8.8%
7.4%
5.0%
3.3%
9.8%
9.1%
9.4%
Low income decile 2
16.0%
15.9%
14.0%
11.9%
12.3%
8.9%
7.8%
5.8%
4.3%
10.2%
9.4%
9.9%
Low income decile 3
12.8%
14.4%
12.1%
11.4%
11.7%
9.2%
8.9%
7.4%
5.9%
10.5%
9.5%
9.9%
Low income decile 4
12.6%
13.5%
12.3%
11.3%
11.8%
9.9%
9.4%
8.7%
7.1%
12.3%
9.9%
10.4%
Low income decile 5
10.1%
9.2%
9.9%
10.2%
12.9%
10.4%
9.9%
9.8%
8.5%
9.7%
9.9%
10.1%
Low income decile 6
8.2%
8.8%
9.6%
9.6%
12.3%
10.3%
10.3%
10.7%
9.9%
9.9%
10.4%
10.2%
Low income decile 7
8.2%
7.5%
9.4%
9.9%
10.2%
11.6%
11.3%
12.0%
10.9%
9.4%
10.4%
10.4%
Low income decile 8
6.9%
6.7%
8.0%
9.2%
8.8%
10.8%
11.4%
12.3%
12.8%
9.4%
10.4%
10.1%
Low income decile 9
5.2%
4.9%
6.4%
7.6%
6.8%
11.0%
12.1%
13.9%
15.2%
9.2%
10.1%
9.9%
Low income decile 10 - Highest percentage of
low income households
3.3%
2.8%
4.7%
6.4%
4.4%
9.0%
11.4%
14.3%
22.3%
9.5%
10.9%
9.7%
Decile 1 - Most unequal spread of income
12.7%
13.7%
11.2%
9.4%
17.4%
8.4%
8.0%
8.6%
10.4%
13.6%
10.5%
10.6%
Decile 2
10.2%
10.1%
10.5%
9.8%
17.3%
9.4%
9.1%
9.4%
10.5%
11.1%
10.5%
10.5%
Decile 3
12.3%
12.0%
11.8%
10.4%
14.3%
9.6%
9.1%
9.2%
8.8%
10.9%
10.2%
10.5%
Decile 4
11.8%
11.3%
11.4%
10.0%
11.4%
9.1%
9.1%
8.7%
8.6%
9.8%
10.0%
10.0%
Decile 5
12.1%
10.9%
11.3%
11.0%
9.8%
9.8%
9.4%
8.7%
7.2%
9.1%
9.9%
9.9%
Decile 6
10.4%
11.7%
10.8%
10.1%
7.6%
9.6%
9.1%
8.6%
8.2%
10.0%
9.5%
9.5%
Decile 7
10.0%
10.6%
10.1%
10.5%
6.8%
10.6%
10.9%
10.1%
8.3%
9.4%
9.8%
9.8%
Decile 8
9.5%
8.2%
9.9%
11.4%
6.1%
11.5%
11.3%
10.6%
9.2%
9.0%
9.7%
9.9%
Decile 9
7.0%
7.0%
7.9%
9.9%
5.4%
11.6%
12.0%
11.7%
11.2%
8.5%
9.7%
9.7%
Decile 10 - Most equal spread of income
4.0%
4.5%
5.2%
7.5%
3.8%
10.3%
12.1%
14.3%
17.6%
8.6%
10.0%
9.6%
Income decile 1 - Affluent using income
domain
19.1%
21.8%
15.0%
12.4%
8.5%
7.4%
6.6%
3.7%
3.0%
11.6%
8.9%
9.4%
Income decile 2
16.2%
15.2%
13.7%
12.4%
11.2%
9.4%
8.0%
5.7%
4.0%
10.1%
9.3%
9.8%
Income decile 3
13.0%
12.8%
12.8%
12.3%
11.3%
9.9%
9.1%
7.2%
5.4%
10.2%
9.6%
10.0%
Income decile 4
10.5%
10.9%
11.1%
10.8%
11.6%
10.1%
9.5%
8.5%
6.3%
10.1%
9.5%
9.8%
Income decile 5
9.5%
9.9%
10.1%
10.1%
12.6%
10.3%
10.3%
10.3%
8.6%
9.9%
10.0%
10.2%
Income decile 6
8.5%
8.3%
9.4%
9.6%
13.0%
10.4%
10.3%
11.1%
10.3%
10.2%
10.6%
10.4%
Income decile 7
7.6%
6.9%
8.8%
9.5%
10.6%
11.7%
11.4%
12.2%
11.4%
9.4%
10.3%
10.4%
Income decile 8
6.5%
6.1%
7.7%
8.5%
9.5%
10.6%
11.3%
12.6%
12.4%
9.2%
10.4%
10.0%
Income decile 9
5.3%
4.7%
6.6%
8.1%
7.1%
11.1%
12.0%
13.9%
15.3%
9.3%
10.5%
10.1%
Income decile 10 - Deprived using income
domain
3.8%
3.4%
4.9%
6.4%
4.4%
9.1%
11.6%
15.0%
23.2%
9.9%
11.0%
10.0%
Deprivation decile 1 - Affluent using m
ultiple
deprivation m
easure
20.4%
22.5%
16.0%
13.2%
8.5%
7.4%
6.9%
3.6%
3.1%
11.9%
9.2%
9.8%
Deprivation decile 2
15.2%
14.5%
13.7%
12.4%
9.8%
9.4%
8.2%
5.8%
3.9%
9.6%
9.2%
9.6%
Deprivation decile 3
13.7%
12.6%
12.5%
11.8%
11.4%
10.0%
9.1%
7.4%
5.2%
9.3%
9.6%
9.9%
Deprivation decile 4
10.3%
10.7%
11.0%
11.3%
12.1%
10.3%
9.9%
8.9%
6.9%
10.1%
10.0%
10.1%
Deprivation decile 5
9.4%
10.6%
10.1%
9.8%
12.7%
10.2%
9.8%
9.8%
8.3%
10.9%
9.7%
10.0%
Deprivation decile 6
8.0%
9.0%
9.4%
9.2%
13.1%
10.0%
10.1%
10.7%
10.7%
10.9%
10.4%
10.3%
Deprivation decile 7
7.8%
6.3%
8.5%
9.2%
12.0%
11.2%
10.7%
12.0%
11.5%
9.7%
10.3%
10.3%
Deprivation decile 8
6.5%
6.0%
7.7%
8.5%
10.0%
10.9%
11.2%
12.9%
13.4%
9.2%
10.4%
10.2%
Deprivation decile 9
5.2%
4.6%
6.4%
8.2%
6.5%
11.0%
12.1%
13.8%
14.7%
9.3%
10.4%
10.0%
Deprivation decile 10 - Deprived using m
ultiple
deprivation m
easure
3.6%
3.3%
4.7%
6.4%
4.1%
9.5%
12.0%
15.2%
22.4%
9.0%
10.6%
9.8%
Small area income
estimates 2003-
2005
Income domain
2005
Multiple
deprivation
measure 2005
Measure of income
spread (GINI)
2003-2005

22
Table 2.9
TENURE
ALL HOUSEHOLDS (165,125 households; NILS-2001 CENSUS)
Owned outright
Owned m
ortgage or shared
Social rented
Private rented
Total
Column N %
Column N %
Column N %
Column N %
Column N %
Low income decile 1 - Lowest percentage of
low income households
8.1%
13.6%
1.1%
4.5%
8.6%
Low income decile 2
11.9%
11.7%
2.3%
7.3%
9.5%
Low income decile 3
11.6%
11.3%
3.7%
9.1%
9.7%
Low income decile 4
12.3%
11.1%
5.5%
11.9%
10.4%
Low income decile 5
11.6%
9.9%
7.3%
9.5%
9.8%
Low income decile 6
11.8%
9.5%
8.8%
10.5%
10.1%
Low income decile 7
10.8%
10.1%
11.9%
12.2%
10.9%
Low income decile 8
9.2%
9.1%
14.3%
12.6%
10.5%
Low income decile 9
7.9%
7.9%
19.2%
13.9%
10.7%
Low income decile 10 - Highest percentage of
low income households
4.7%
5.8%
25.8%
8.5%
9.8%
Decile 1 - Most unequal spread of income
14.5%
8.9%
3.8%
11.8%
9.8%
Decile 2
13.7%
9.0%
4.8%
11.2%
9.7%
Decile 3
12.7%
10.2%
5.6%
9.8%
10.0%
Decile 4
10.4%
10.7%
6.6%
8.7%
9.6%
Decile 5
9.8%
10.9%
7.7%
7.9%
9.7%
Decile 6
8.6%
10.7%
8.4%
9.5%
9.5%
Decile 7
8.1%
11.0%
11.8%
9.7%
10.2%
Decile 8
8.1%
11.8%
11.4%
9.1%
10.4%
Decile 9
7.5%
10.0%
16.2%
8.6%
10.4%
Decile 10 - Most equal spread of income
6.5%
6.7%
23.8%
13.7%
10.7%
Income decile 1 - Affluent using income domain
11.0%
12.2%
.9%
6.4%
9.1%
Income decile 2
11.9%
12.0%
2.1%
7.5%
9.6%
Income decile 3
11.4%
12.2%
3.6%
8.9%
9.9%
Income decile 4
10.8%
10.9%
5.9%
11.7%
9.9%
Income decile 5
11.7%
10.2%
7.3%
10.1%
10.0%
Income decile 6
11.2%
9.7%
8.8%
10.9%
10.1%
Income decile 7
10.3%
9.9%
12.3%
11.1%
10.6%
Income decile 8
9.0%
8.9%
14.0%
12.6%
10.2%
Income decile 9
7.7%
8.4%
18.1%
12.3%
10.5%
Income decile 10 - Deprived using income
domain
5.1%
5.8%
26.9%
8.5%
10.2%
Deprivation decile 1 - Affluent using m
ultiple
deprivation m
easure
12.1%
12.7%
1.3%
6.7%
9.7%
Deprivation decile 2
10.7%
12.5%
2.5%
7.1%
9.5%
Deprivation decile 3
11.3%
11.9%
4.2%
8.0%
9.8%
Deprivation decile 4
10.6%
11.2%
6.4%
10.5%
10.0%
Deprivation decile 5
11.3%
9.8%
6.6%
11.9%
9.7%
Deprivation decile 6
11.3%
9.3%
8.5%
12.0%
9.9%
Deprivation decile 7
10.5%
9.7%
10.1%
10.8%
10.1%
Deprivation decile 8
9.4%
9.0%
14.4%
12.2%
10.5%
Deprivation decile 9
7.4%
8.2%
18.8%
10.8%
10.4%
Deprivation decile 10 - Deprived using m
ultiple
deprivation m
easure
5.4%
5.7%
27.3%
10.0%
10.4%
Small area income
estimates 2003-
2005
Income domain
2005
Multiple
deprivation
measure 2005
Measure of income
spread (GINI)
2003-2005

23
Table 2.10
ACCOMMODATION TYPE
ALL HOUSEHOLDS (165,125 households; NILS-2001 CENSUS)
Detached
Semi-detached
Terraced
Flats
Other
Total
Column N %
Column N %
Column N %
Column N %
Column N %
Column N %
Low income decile 1 - Lowest percentage of
low income households
13.4%
10.5%
1.8%
1.7%
2.5%
8.6%
Low income decile 2
15.0%
9.3%
3.3%
3.8%
6.7%
9.5%
Low income decile 3
12.4%
11.3%
5.2%
5.5%
9.8%
9.7%
Low income decile 4
12.5%
11.7%
6.8%
6.2%
13.8%
10.4%
Low income decile 5
11.9%
9.5%
7.4%
9.1%
9.4%
9.8%
Low income decile 6
11.4%
10.0%
8.6%
10.0%
9.6%
10.1%
Low income decile 7
9.3%
11.1%
12.4%
13.3%
9.2%
10.9%
Low income decile 8
7.1%
10.1%
14.2%
16.2%
13.5%
10.5%
Low income decile 9
4.6%
9.4%
19.2%
17.1%
14.4%
10.7%
Low income decile 10 - Highest percentage of
low income households
2.6%
7.2%
21.2%
17.0%
11.3%
9.8%
Decile 1 - Most unequal spread of income
18.9%
4.9%
3.0%
3.9%
16.3%
9.8%
Decile 2
16.8%
6.3%
4.3%
5.5%
11.0%
9.7%
Decile 3
15.6%
8.5%
4.8%
4.8%
9.5%
10.0%
Decile 4
13.0%
9.6%
5.4%
6.9%
7.2%
9.6%
Decile 5
11.3%
10.0%
7.4%
8.7%
8.1%
9.7%
Decile 6
8.4%
11.8%
8.1%
11.4%
10.2%
9.5%
Decile 7
6.5%
13.7%
10.9%
13.5%
11.5%
10.2%
Decile 8
5.1%
15.0%
12.6%
13.1%
7.1%
10.4%
Decile 9
2.9%
12.5%
17.4%
17.5%
8.8%
10.4%
Decile 10 - M
ost equal spread of income
1.5%
7.7%
26.1%
14.7%
10.2%
10.7%
Income decile 1 - Affluent using income domain
14.1%
10.3%
1.7%
4.7%
5.2%
9.1%
Income decile 2
14.0%
10.7%
3.3%
4.4%
9.3%
9.6%
Income decile 3
13.0%
11.7%
4.9%
5.0%
8.5%
9.9%
Income decile 4
11.4%
10.6%
7.0%
8.7%
13.7%
9.9%
Income decile 5
11.6%
9.6%
8.6%
8.7%
9.4%
10.0%
Income decile 6
11.7%
9.8%
8.4%
8.5%
8.6%
10.1%
Income decile 7
9.2%
10.2%
12.5%
12.6%
10.9%
10.6%
Income decile 8
7.7%
9.9%
13.3%
14.4%
11.6%
10.2%
Income decile 9
5.0%
9.9%
17.8%
15.2%
10.4%
10.5%
Income decile 10 - Deprived using income
domain
2.4%
7.1%
22.5%
17.9%
12.4%
10.2%
Deprivation decile 1 - Affluent using m
ultiple
deprivation m
easure
14.4%
11.5%
2.1%
6.1%
5.8%
9.7%
Deprivation decile 2
13.5%
10.7%
3.9%
4.4%
4.5%
9.5%
Deprivation decile 3
12.3%
11.8%
5.2%
6.1%
8.4%
9.8%
Deprivation decile 4
12.0%
11.0%
6.6%
7.8%
9.8%
10.0%
Deprivation decile 5
12.0%
9.3%
7.5%
7.0%
11.9%
9.7%
Deprivation decile 6
11.7%
9.1%
8.4%
8.6%
14.9%
9.9%
Deprivation decile 7
9.9%
9.7%
10.8%
9.9%
10.6%
10.1%
Deprivation decile 8
7.8%
10.2%
13.5%
14.6%
11.1%
10.5%
Deprivation decile 9
4.3%
10.0%
17.9%
16.6%
10.4%
10.4%
Deprivation decile 10 - Deprived using m
ultiple
deprivation m
easure
2.0%
6.8%
24.1%
18.8%
12.6%
10.4%
Measure of income
spread (GINI)
2003-2005
Small area income
estimates 2003-
2005
Income domain
2005
Multiple
deprivation
measure 2005

24
Table 2.11
DEPENDENT CHILDREN IN HOUSEHOLD
ALL HOUSEHOLDS (165,125 households; NILS-2001 CENSUS)
No dependent children
One dependent child
Two ror more dependent children
Total
Column N %
Column N %
Column N %
Column N %
Low income decile 1 - Lowest percentage of
low income households
7.6%
9.9%
10.6%
8.6%
Low income decile 2
9.4%
9.0%
10.0%
9.5%
Low income decile 3
9.7%
9.6%
9.6%
9.7%
Low income decile 4
10.6%
9.8%
10.2%
10.4%
Low income decile 5
10.0%
9.1%
9.7%
9.8%
Low income decile 6
10.3%
9.4%
10.0%
10.1%
Low income decile 7
11.3%
10.5%
9.9%
10.9%
Low income decile 8
10.8%
10.3%
9.8%
10.5%
Low income decile 9
11.1%
11.0%
9.3%
10.7%
Low income decile 10 - Highest percentage of
low income households
9.1%
11.5%
10.8%
9.8%
Decile 1 - Most unequal spread of income
9.7%
8.9%
10.6%
9.8%
Decile 2
9.4%
9.4%
10.8%
9.7%
Decile 3
9.8%
9.7%
10.7%
10.0%
Decile 4
9.1%
9.7%
10.8%
9.6%
Decile 5
9.5%
10.0%
9.9%
9.7%
Decile 6
9.6%
9.4%
9.3%
9.5%
Decile 7
10.3%
10.4%
9.7%
10.2%
Decile 8
10.6%
10.8%
9.7%
10.4%
Decile 9
10.9%
10.7%
9.1%
10.4%
Decile 10 - Most equal spread of income
11.2%
11.0%
9.4%
10.7%
Income decile 1 - Affluent using income
domain
9.1%
8.7%
9.3%
9.1%
Income decile 2
9.8%
9.1%
9.4%
9.6%
Income decile 3
9.9%
9.6%
10.1%
9.9%
Income decile 4
10.0%
9.5%
9.7%
9.9%
Income decile 5
10.2%
9.6%
9.9%
10.0%
Income decile 6
9.8%
9.9%
10.7%
10.1%
Income decile 7
10.9%
10.5%
9.9%
10.6%
Income decile 8
10.4%
10.3%
9.9%
10.2%
Income decile 9
10.4%
11.2%
10.3%
10.5%
Income decile 10 - Deprived using income
domain
9.6%
11.6%
10.9%
10.2%
Deprivation decile 1 - Affluent using m
ultiple
deprivation m
easure
9.9%
9.0%
9.6%
9.7%
Deprivation decile 2
9.5%
9.6%
9.5%
9.5%
Deprivation decile 3
9.9%
9.8%
9.8%
9.8%
Deprivation decile 4
9.9%
9.7%
10.5%
10.0%
Deprivation decile 5
9.8%
9.3%
9.8%
9.7%
Deprivation decile 6
9.9%
9.7%
10.1%
9.9%
Deprivation decile 7
10.0%
10.0%
10.2%
10.1%
Deprivation decile 8
10.6%
10.4%
10.1%
10.5%
Deprivation decile 9
10.3%
11.1%
10.1%
10.4%
Deprivation decile 10 - Deprived using m
ultiple
deprivation m
easure
10.2%
11.5%
10.3%
10.4%
Small area income
estimates 2003-
2005
Income domain
2005
Multiple
deprivation
measure 2005
Measure of income
spread (GINI)
2003-2005

25
Table 2.12
HOUSEHOLD SIZE
ALL HOUSEHOLDS (165,125 households; NILS-2001 CENSUS)
One person
Two people
Three people
Four people
Five people
Six or more people
Total
Column N %
Column N %
Column N %
Column N %
Column N %
Column N %
Column N %
Low income decile 1 - Lowest percentage of
low income households
5.3%
9.0%
9.9%
12.0%
9.9%
6.5%
8.6%
Low income decile 2
7.2%
10.3%
9.9%
11.2%
10.7%
8.0%
9.5%
Low income decile 3
8.3%
10.2%
10.3%
10.5%
10.0%
8.6%
9.7%
Low income decile 4
9.8%
10.8%
10.0%
11.0%
10.5%
9.8%
10.4%
Low income decile 5
9.6%
9.9%
9.7%
9.7%
9.5%
12.1%
9.8%
Low income decile 6
10.4%
10.0%
9.6%
10.0%
10.6%
10.8%
10.1%
Low income decile 7
12.0%
11.1%
10.3%
9.6%
10.3%
10.4%
10.9%
Low income decile 8
12.2%
10.2%
10.1%
9.2%
9.3%
10.6%
10.5%
Low income decile 9
13.8%
10.1%
10.3%
8.5%
8.8%
10.1%
10.7%
Low income decile 10 - Highest percentage of
low income households
11.3%
8.5%
10.0%
8.3%
10.2%
13.2%
9.8%
Decile 1 - M
ost unequal spread of income
8.1%
9.6%
9.4%
10.5%
12.2%
14.3%
9.8%
Decile 2
8.1%
9.4%
9.6%
10.6%
11.8%
14.3%
9.7%
Decile 3
8.4%
10.2%
10.1%
10.8%
11.0%
12.2%
10.0%
Decile 4
8.1%
9.6%
9.8%
10.7%
11.1%
10.1%
9.6%
Decile 5
9.0%
9.9%
9.8%
10.6%
9.3%
8.8%
9.7%
Decile 6
9.8%
9.5%
9.4%
9.7%
9.2%
8.2%
9.5%
Decile 7
11.0%
10.2%
10.5%
9.9%
9.3%
7.3%
10.2%
Decile 8
11.1%
10.6%
10.7%
10.0%
9.1%
7.9%
10.4%
Decile 9
12.3%
10.7%
10.2%
9.1%
8.5%
7.6%
10.4%
Decile 10 - M
ost equal spread of income
14.1%
10.3%
10.3%
8.0%
8.4%
9.3%
10.7%
Income decile 1 - Affluent using income
domain
7.0%
10.4%
9.4%
11.1%
8.8%
4.9%
9.1%
Income decile 2
7.8%
10.6%
10.2%
11.1%
9.3%
6.2%
9.6%
Income decile 3
8.3%
10.4%
10.4%
11.2%
10.6%
8.4%
9.9%
Income decile 4
9.6%
10.0%
10.0%
10.3%
9.7%
9.0%
9.9%
Income decile 5
9.9%
10.0%
9.8%
10.1%
10.1%
11.2%
10.0%
Income decile 6
9.8%
9.6%
9.3%
10.2%
11.5%
13.2%
10.1%
Income decile 7
11.5%
10.7%
10.3%
9.5%
9.9%
10.6%
10.6%
Income decile 8
11.5%
9.7%
10.3%
9.2%
9.6%
11.2%
10.2%
Income decile 9
12.5%
9.8%
10.0%
8.9%
9.9%
11.8%
10.5%
Income decile 10 - Deprived using income
domain
12.0%
8.8%
10.3%
8.4%
10.5%
13.4%
10.2%
Deprivation decile 1 - Affluent using m
ultiple
deprivation m
easure
8.0%
11.2%
9.9%
11.4%
9.0%
5.2%
9.7%
Deprivation decile 2
7.7%
10.5%
10.2%
11.2%
8.9%
5.9%
9.5%
Deprivation decile 3
8.5%
10.3%
10.6%
10.9%
10.0%
7.7%
9.8%
Deprivation decile 4
9.3%
10.1%
9.8%
10.7%
10.9%
9.5%
10.0%
Deprivation decile 5
9.3%
9.6%
9.5%
10.0%
10.5%
11.5%
9.7%
Deprivation decile 6
9.8%
9.4%
9.6%
9.9%
10.9%
12.4%
9.9%
Deprivation decile 7
10.1%
9.9%
9.8%
9.7%
10.4%
12.5%
10.1%
Deprivation decile 8
11.9%
10.0%
10.1%
9.2%
10.0%
11.6%
10.5%
Deprivation decile 9
12.1%
9.7%
10.2%
8.9%
9.6%
11.6%
10.4%
Deprivation decile 10 - Deprived using m
ultiple
deprivation m
easure
13.1%
9.3%
10.2%
8.1%
9.7%
12.0%
10.4%
Small area income
estimates 2003-
2005
Income domain
2005
Multiple
deprivation
measure 2005
Measure of income
spread (GINI)
2003-2005
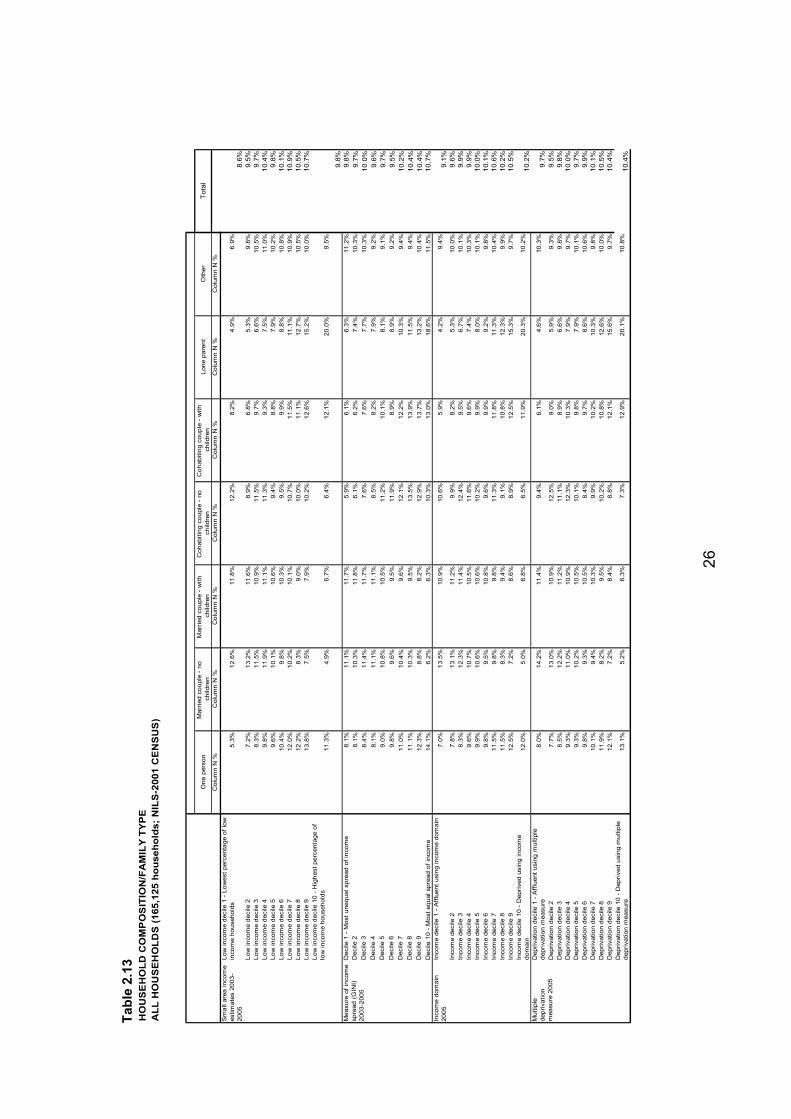
26
Table 2.13
HOUSEHOLD COMPOSITION/FAMILY TYPE
ALL HOUSEHOLDS (165,125 households; NILS-2001 CENSUS)
One person
Married couple - no
children
Married couple - with
children
Cohabiting couple - no
children
Cohabiting couple - with
children
Lone parent
Other
Total
Column N %
Column N %
Column N %
Column N %
Column N %
Column N %
Column N %
Low income decile 1 - Lowest percentage of low
income households
5.3%
12.6%
11.8%
12.2%
8.2%
4.9%
6.9%
8.6%
Low income decile 2
7.2%
13.2%
11.6%
8.9%
6.8%
5.3%
9.8%
9.5%
Low income decile 3
8.3%
11.5%
10.9%
11.5%
9.7%
6.6%
10.5%
9.7%
Low income decile 4
9.8%
11.9%
11.1%
11.3%
9.3%
7.5%
11.0%
10.4%
Low income decile 5
9.6%
10.1%
10.6%
9.4%
8.8%
7.9%
10.2%
9.8%
Low income decile 6
10.4%
9.8%
10.3%
9.5%
9.9%
8.8%
10.8%
10.1%
Low income decile 7
12.0%
10.2%
10.1%
10.7%
11.5%
11.1%
10.9%
10.9%
Low income decile 8
12.2%
8.3%
9.0%
10.0%
11.1%
12.7%
10.5%
10.5%
Low income decile 9
13.8%
7.5%
7.9%
10.2%
12.6%
15.2%
10.0%
10.7%
Low income decile 10 - Highest percentage of
low income households
11.3%
4.9%
6.7%
6.4%
12.1%
20.0%
9.5%
9.8%
Decile 1 - Most unequal spread of income
8.1%
11.1%
11.7%
5.9%
6.1%
6.3%
11.2%
9.8%
Decile 2
8.1%
10.3%
11.8%
6.1%
6.2%
7.4%
10.3%
9.7%
Decile 3
8.4%
11.4%
11.7%
7.6%
7.6%
7.7%
10.3%
10.0%
Decile 4
8.1%
11.1%
11.1%
8.5%
8.2%
7.9%
9.2%
9.6%
Decile 5
9.0%
10.8%
10.5%
11.2%
10.1%
8.1%
9.1%
9.7%
Decile 6
9.8%
9.6%
9.5%
11.9%
8.9%
8.9%
9.2%
9.5%
Decile 7
11.0%
10.4%
9.6%
12.1%
12.2%
10.3%
9.4%
10.2%
Decile 8
11.1%
10.3%
9.5%
13.5%
13.9%
11.5%
9.4%
10.4%
Decile 9
12.3%
8.8%
8.2%
12.9%
13.7%
13.2%
10.4%
10.4%
Decile 10 - Most equal spread of income
14.1%
6.2%
6.3%
10.3%
13.0%
18.6%
11.5%
10.7%
Income decile 1 - Affluent using income domain
7.0%
13.5%
10.9%
10.6%
5.9%
4.2%
9.4%
9.1%
Income decile 2
7.8%
13.1%
11.2%
9.9%
8.2%
5.3%
10.0%
9.6%
Income decile 3
8.3%
12.3%
11.4%
12.4%
9.5%
6.7%
10.1%
9.9%
Income decile 4
9.6%
10.7%
10.5%
11.6%
9.6%
7.4%
10.3%
9.9%
Income decile 5
9.9%
10.6%
10.6%
10.2%
9.9%
8.0%
10.1%
10.0%
Income decile 6
9.8%
9.5%
10.8%
9.6%
9.9%
9.2%
9.8%
10.1%
Income decile 7
11.5%
9.8%
9.8%
11.3%
11.8%
11.3%
10.4%
10.6%
Income decile 8
11.5%
8.3%
9.4%
9.1%
10.8%
12.3%
9.9%
10.2%
Income decile 9
12.5%
7.2%
8.6%
8.9%
12.5%
15.3%
9.7%
10.5%
Income decile 10 - Deprived using income
domain
12.0%
5.0%
6.8%
6.5%
11.9%
20.3%
10.2%
10.2%
Deprivation decile 1 - Affluent using m
ultiple
deprivation m
easure
8.0%
14.2%
11.4%
9.4%
6.1%
4.6%
10.3%
9.7%
Deprivation decile 2
7.7%
13.0%
10.9%
12.5%
9.0%
5.9%
9.3%
9.5%
Deprivation decile 3
8.5%
12.2%
11.2%
11.1%
8.9%
6.6%
9.8%
9.8%
Deprivation decile 4
9.3%
11.0%
10.9%
12.3%
10.3%
7.9%
9.7%
10.0%
Deprivation decile 5
9.3%
10.2%
10.5%
10.1%
9.8%
7.9%
10.1%
9.7%
Deprivation decile 6
9.8%
9.3%
10.5%
8.4%
9.7%
8.6%
10.6%
9.9%
Deprivation decile 7
10.1%
9.4%
10.3%
9.9%
10.2%
10.3%
9.8%
10.1%
Deprivation decile 8
11.9%
8.2%
9.5%
10.2%
10.8%
12.6%
10.0%
10.5%
Deprivation decile 9
12.1%
7.2%
8.4%
8.8%
12.1%
15.6%
9.7%
10.4%
Deprivation decile 10 - Deprived using m
ultiple
deprivation m
easure
13.1%
5.2%
6.3%
7.3%
12.9%
20.1%
10.8%
10.4%
Income domain
2005
Measure of income
spread (GINI)
2003-2005
Multiple
deprivation
measure 2005
Small area income
estimates 2003-
2005

27
Table 2.14
PENSIONER HOUSEHOLDS
ALL HOUSEHOLDS (165,125 households; NILS-2001 CENSUS)
One person household:
Male 65-74
One person household:
Male aged 75+
One person household:
Female aged 16-74
One person household:
Female aged 75+
Two or more person
household: All
pensionable age
Two or more person
household: Some of
pensionable age
Other household: No
pensioners
Total
Column N %
Column N %
Column N %
Column N %
Column N %
Column N %
Column N %
Column N %
Low income decile 1 - Lowest percentage of
low income households
4.1%
3.9%
5.1%
3.8%
7.5%
6.6%
9.9%
8.6%
Low income decile 2
6.4%
7.4%
7.8%
7.1%
11.3%
9.7%
9.7%
9.5%
Low income decile 3
8.4%
8.1%
8.6%
9.1%
10.8%
10.1%
9.7%
9.7%
Low income decile 4
8.9%
10.5%
9.6%
10.9%
11.1%
10.1%
10.4%
10.4%
Low income decile 5
9.7%
9.6%
9.7%
11.6%
11.0%
10.8%
9.4%
9.8%
Low income decile 6
11.9%
12.4%
11.3%
11.8%
11.4%
11.2%
9.5%
10.1%
Low income decile 7
11.5%
12.3%
12.5%
12.8%
11.5%
11.3%
10.4%
10.9%
Low income decile 8
11.7%
12.9%
12.2%
12.0%
10.4%
10.6%
10.2%
10.5%
Low income decile 9
15.1%
12.7%
13.2%
12.5%
9.0%
10.0%
10.6%
10.7%
Low income decile 10 - Highest percentage of
low income households
12.4%
10.2%
10.1%
8.4%
6.1%
9.7%
10.3%
9.8%
Decile 1 - Most unequal spread of income
10.0%
11.7%
8.0%
8.7%
11.2%
12.0%
9.4%
9.8%
Decile 2
10.4%
9.7%
8.4%
9.1%
10.2%
12.1%
9.4%
9.7%
Decile 3
9.0%
8.9%
9.3%
9.2%
11.2%
11.2%
9.8%
10.0%
Decile 4
7.4%
7.8%
8.4%
8.5%
9.5%
9.4%
9.9%
9.6%
Decile 5
8.9%
7.5%
9.8%
9.4%
9.8%
9.0%
9.8%
9.7%
Decile 6
8.0%
8.1%
9.8%
10.0%
9.4%
8.2%
9.7%
9.5%
Decile 7
10.2%
9.8%
10.8%
10.6%
9.6%
8.8%
10.4%
10.2%
Decile 8
9.3%
9.6%
10.8%
10.0%
9.7%
9.5%
10.7%
10.4%
Decile 9
10.9%
12.0%
11.0%
11.7%
10.1%
9.5%
10.4%
10.4%
Decile 10 - M
ost equal spread of income
15.9%
15.0%
13.8%
12.9%
9.2%
10.3%
10.4%
10.7%
Income decile 1 - Affluent using income
domain
4.7%
7.5%
7.5%
7.9%
11.8%
7.5%
9.3%
9.1%
Income decile 2
7.5%
9.0%
8.4%
8.9%
11.9%
9.2%
9.6%
9.6%
Income decile 3
7.5%
7.3%
8.5%
8.7%
10.1%
10.1%
10.1%
9.9%
Income decile 4
9.4%
9.0%
9.3%
10.4%
10.5%
9.4%
9.9%
9.9%
Income decile 5
10.0%
11.1%
10.5%
10.2%
10.3%
10.8%
9.8%
10.0%
Income decile 6
10.5%
10.8%
9.8%
10.6%
9.8%
10.9%
9.9%
10.1%
Income decile 7
12.0%
11.2%
11.4%
11.6%
10.6%
11.1%
10.3%
10.6%
Income decile 8
11.6%
10.8%
11.3%
11.2%
9.5%
10.3%
10.1%
10.2%
Income decile 9
13.0%
12.3%
12.4%
10.7%
8.7%
10.2%
10.5%
10.5%
Income decile 10 - Deprived using income
domain
13.8%
11.1%
11.0%
9.8%
6.8%
10.4%
10.4%
10.2%
Deprivation decile 1 - Affluent using m
ultiple
deprivation m
easure
5.3%
9.5%
9.0%
9.9%
13.5%
8.1%
9.7%
9.7%
Deprivation decile 2
6.5%
6.7%
8.4%
7.7%
10.9%
8.7%
9.8%
9.5%
Deprivation decile 3
7.6%
7.8%
8.6%
9.3%
10.6%
9.8%
10.0%
9.8%
Deprivation decile 4
9.7%
10.8%
9.1%
9.4%
10.2%
9.6%
10.1%
10.0%
Deprivation decile 5
9.6%
7.7%
9.4%
9.7%
9.3%
10.3%
9.8%
9.7%
Deprivation decile 6
10.9%
10.7%
9.8%
10.4%
9.8%
11.1%
9.7%
9.9%
Deprivation decile 7
9.8%
10.5%
10.3%
10.7%
9.9%
11.3%
9.9%
10.1%
Deprivation decile 8
13.0%
11.0%
11.9%
11.5%
9.7%
10.6%
10.3%
10.5%
Deprivation decile 9
12.1%
12.8%
11.2%
10.8%
8.5%
10.0%
10.4%
10.4%
Deprivation decile 10 - Deprived using
multiple deprivation m
easure
15.5%
12.4%
12.4%
10.5%
7.6%
10.6%
10.4%
10.4%
Measure of income
spread (GINI)
2003-2005
Small area income
estimates 2003-
2005
Income domain
2005
Multiple
deprivation
measure 2005

28
Table 2.15
WORK STATUS IN HOUSEHOLDS
ALL HOUSEHOLDS (165,125 households; NILS-2001 CENSUS)
All working age adults in
employment
Some working age adults in
employment
No working age adults in
employment
No people of working age in
household
Total
Column N %
Column N %
Column N %
Column N %
Column N %
Low income decile 1 - Lowest percentage of low
income households
12.3%
9.5%
3.4%
5.5%
8.6%
Low income decile 2
11.8%
10.2%
4.5%
8.8%
9.5%
Low income decile 3
11.5%
10.1%
5.4%
9.5%
9.7%
Low income decile 4
11.4%
10.9%
7.2%
10.5%
10.4%
Low income decile 5
10.1%
10.3%
7.7%
10.6%
9.8%
Low income decile 6
9.8%
10.5%
8.7%
11.6%
10.1%
Low income decile 7
10.3%
10.5%
11.2%
12.1%
10.9%
Low income decile 8
9.1%
10.0%
12.9%
11.5%
10.5%
Low income decile 9
8.2%
9.4%
16.7%
11.6%
10.7%
Low income decile 10 - Highest percentage of
low income households
5.5%
8.6%
22.2%
8.4%
9.8%
Decile 1 - Most unequal spread of income
9.6%
11.6%
7.7%
9.8%
9.8%
Decile 2
9.6%
11.6%
7.9%
9.5%
9.7%
Decile 3
10.2%
11.3%
7.9%
9.9%
10.0%
Decile 4
10.4%
10.5%
7.7%
8.7%
9.6%
Decile 5
10.6%
9.9%
7.7%
9.5%
9.7%
Decile 6
10.3%
9.0%
8.5%
9.4%
9.5%
Decile 7
10.9%
9.4%
9.9%
10.2%
10.2%
Decile 8
11.3%
9.4%
10.4%
10.0%
10.4%
Decile 9
9.8%
9.0%
13.1%
10.9%
10.4%
Decile 10 - Most equal spread of income
7.5%
8.3%
19.2%
12.1%
10.7%
Income decile 1 - Affluent using income domain
11.7%
9.3%
3.4%
9.0%
9.1%
Income decile 2
11.8%
9.7%
4.4%
9.8%
9.6%
Income decile 3
12.2%
10.4%
5.5%
9.0%
9.9%
Income decile 4
11.3%
9.9%
6.8%
10.0%
9.9%
Income decile 5
10.5%
10.6%
7.8%
10.4%
10.0%
Income decile 6
9.9%
10.8%
9.3%
10.1%
10.1%
Income decile 7
10.1%
10.5%
10.9%
11.2%
10.6%
Income decile 8
8.8%
10.1%
13.0%
10.6%
10.2%
Income decile 9
8.2%
9.7%
16.3%
10.7%
10.5%
Income decile 10 - Deprived using income
domain
5.6%
8.9%
22.5%
9.4%
10.2%
Deprivation decile 1 - Affluent using m
ultiple
deprivation m
easure
11.9%
9.7%
3.8%
10.6%
9.7%
Deprivation decile 2
12.2%
9.4%
4.6%
8.8%
9.5%
Deprivation decile 3
11.9%
10.2%
5.5%
9.4%
9.8%
Deprivation decile 4
11.3%
10.2%
7.3%
9.8%
10.0%
Deprivation decile 5
10.4%
10.4%
7.8%
9.4%
9.7%
Deprivation decile 6
9.6%
10.9%
9.1%
10.1%
9.9%
Deprivation decile 7
9.5%
10.8%
10.3%
10.2%
10.1%
Deprivation decile 8
9.3%
10.2%
12.7%
11.0%
10.5%
Deprivation decile 9
7.9%
9.6%
16.6%
10.3%
10.4%
Deprivation decile 10 - Deprived using m
ultiple
deprivation m
easure
5.9%
8.6%
22.3%
10.4%
10.4%
Small area income
estimates 2003-
2005
Income domain
2005
Multiple
deprivation
measure 2005
Measure of income
spread (GINI)
2003-2005
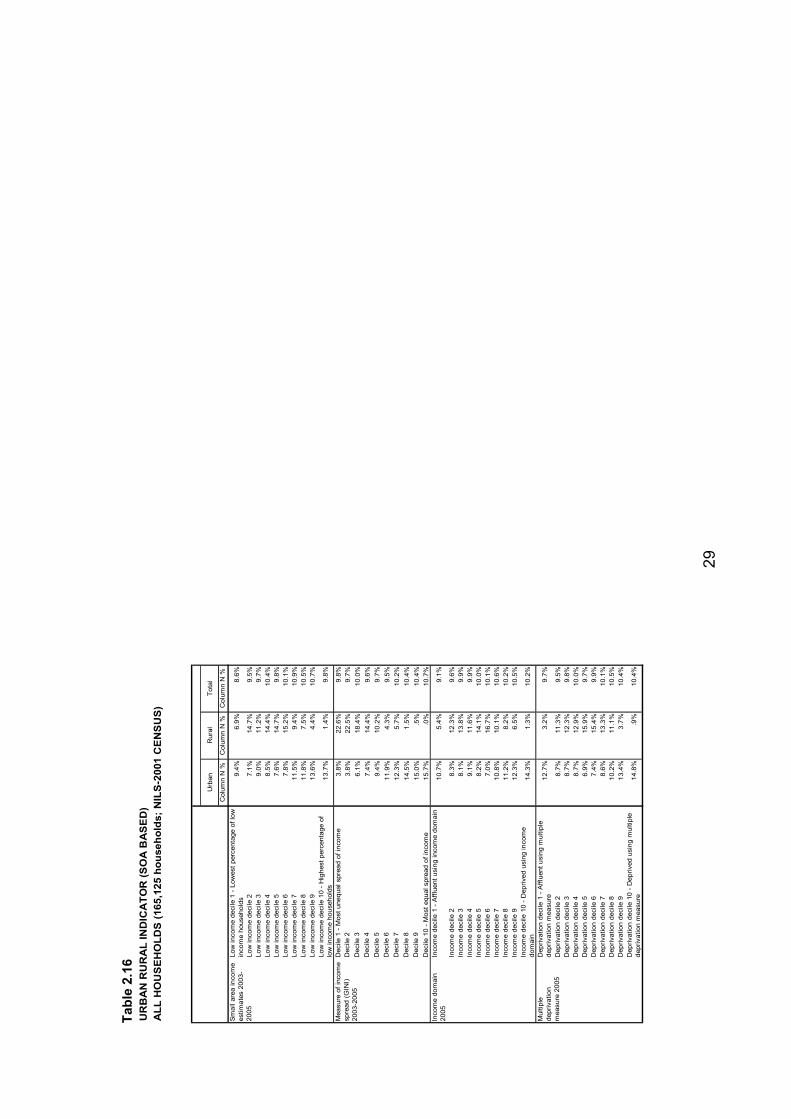
29
Table 2.16
URBAN RURAL INDICATOR (SOA BASED)
ALL HOUSEHOLDS (165,125 households; NILS-2001 CENSUS)
Urban
Rural
Total
Column N %
Column N %
Column N %
Low income decile 1 - Lowest percentage of low
income households
9.4%
6.9%
8.6%
Low income decile 2
7.1%
14.7%
9.5%
Low income decile 3
9.0%
11.2%
9.7%
Low income decile 4
8.5%
14.4%
10.4%
Low income decile 5
7.6%
14.7%
9.8%
Low income decile 6
7.8%
15.2%
10.1%
Low income decile 7
11.5%
9.4%
10.9%
Low income decile 8
11.8%
7.5%
10.5%
Low income decile 9
13.6%
4.4%
10.7%
Low income decile 10 - Highest percentage of
low income households
13.7%
1.4%
9.8%
Decile 1 - Most unequal spread of income
3.8%
22.6%
9.8%
Decile 2
3.8%
22.5%
9.7%
Decile 3
6.1%
18.4%
10.0%
Decile 4
7.4%
14.4%
9.6%
Decile 5
9.4%
10.2%
9.7%
Decile 6
11.9%
4.3%
9.5%
Decile 7
12.3%
5.7%
10.2%
Decile 8
14.5%
1.5%
10.4%
Decile 9
15.0%
.5%
10.4%
Decile 10 - Most equal spread of income
15.7%
.0%
10.7%
Income decile 1 - Affluent using income domain
10.7%
5.4%
9.1%
Income decile 2
8.3%
12.3%
9.6%
Income decile 3
8.1%
13.8%
9.9%
Income decile 4
9.1%
11.6%
9.9%
Income decile 5
8.2%
14.1%
10.0%
Income decile 6
7.0%
16.7%
10.1%
Income decile 7
10.8%
10.1%
10.6%
Income decile 8
11.2%
8.2%
10.2%
Income decile 9
12.3%
6.5%
10.5%
Income decile 10 - Deprived using income
domain
14.3%
1.3%
10.2%
Deprivation decile 1 - Affluent using m
ultiple
deprivation m
easure
12.7%
3.2%
9.7%
Deprivation decile 2
8.7%
11.3%
9.5%
Deprivation decile 3
8.7%
12.3%
9.8%
Deprivation decile 4
8.7%
12.9%
10.0%
Deprivation decile 5
6.9%
15.9%
9.7%
Deprivation decile 6
7.4%
15.4%
9.9%
Deprivation decile 7
8.6%
13.3%
10.1%
Deprivation decile 8
10.2%
11.1%
10.5%
Deprivation decile 9
13.4%
3.7%
10.4%
Deprivation decile 10 - Deprived using m
ultiple
deprivation m
easure
14.8%
.9%
10.4%
Small area income
estimates 2003-
2005
Income domain
2005
Multiple
deprivation
measure 2005
Measure of income
spread (GINI)
2003-2005
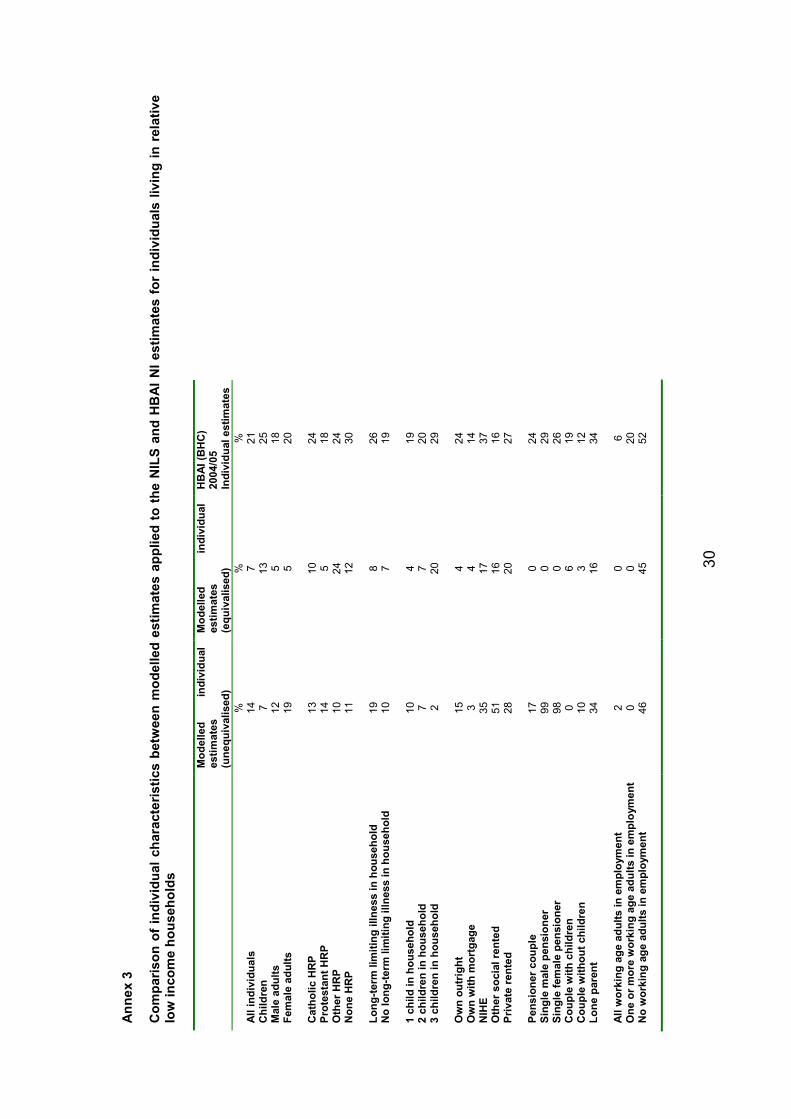
30
Annex 3
Comparison of individual characteristics betw
een m
odelled estimates applied to the NILS and HBAI NI estimates for individuals living in relative
low income households
Modelled
individual
estimates
(unequivalised)
Modelled
individual
estimates
(equivalised)
HBAI (BHC)
2004/05
Individual estimates
%
%
%
All individuals
14
7
21
Children
7
13
25
Male adults
12
5
18
Female adults
19
5
20
Catholic HRP
13
10
24
Protestant HRP
14
5
18
Other HRP
10
24
24
None HRP
11
12
30
Long-term
lim
iting illness in household
19
8
26
No long-term
lim
iting illness in household
10
7
19
1 child in household
10
4
19
2 children in household
7
7
20
3 children in household
2
20
29
Own outright
15
4
24
Own with m
ortgage
3
4
14
NIHE
35
17
37
Other social rented
51
16
16
Private rented
28
20
27
Pensioner couple
17
0
24
Single m
ale pensioner
99
0
29
Single female pensioner
98
0
26
Couple with children
0
6
19
Couple without children
10
3
12
Lone parent
34
16
34
All working age adults in employment
2
0
6
One or more working age adults in employment
0
0
20
No working age adults in employment
46
45
52

31