Peru Food Processing Ingredients 2013 - USDA GAIN Publications/Food Processing... · Alicorp S.A....
16
THIS REPORT CONTAINS ASSESSMENTS OF COMMODITY AND TRADE ISSUES MADE BY USDA STAFF AND NOT NECESSARILY STATEMENTS OF OFFICIAL U.S. GOVERNMENT POLICY Date: GAIN Report Number: Approved By: Prepared By: Report Highlights: Peru’s food processing industry is an increasingly dynamic, strategic sector of the national economy. FAS Lima estimates that of Peru’s 3,000 plus companies engaged in food processing, there are over 50 medium to large size food processors with combined 2012 sales of over $14 billion. These food processors have annual incomes ranging from a low of $12 million to a high of $1.3 billion. Alvaro Loza and Mariano J. Beillard Emiko Purdy 2013 Food Processing Ingredients Peru Required Report - public distribution
Transcript of Peru Food Processing Ingredients 2013 - USDA GAIN Publications/Food Processing... · Alicorp S.A....
THIS REPORT CONTAINS ASSESSMENTS OF COMMODITY AND TRADE ISSUES MADE BY
USDA STAFF AND NOT NECESSARILY STATEMENTS OF OFFICIAL U.S. GOVERNMENT
POLICY
Date:
GAIN Report Number:
Approved By:
Prepared By:
Report Highlights:
Peru’s food processing industry is an increasingly dynamic, strategic sector of the national economy.
FAS Lima estimates that of Peru’s 3,000 plus companies engaged in food processing, there are over 50
medium to large size food processors with combined 2012 sales of over $14 billion. These food
processors have annual incomes ranging from a low of $12 million to a high of $1.3 billion.
Alvaro Loza and Mariano
J. Beillard
Emiko Purdy
2013
Food Processing Ingredients
Peru
Required Report - public distribution
Post:
Executive Summary:
Section I. Market Summary
Peru’s food processing industry is an increasingly dynamic, strategic sector of the national economy. It
is benefitting from Peru’s strong economic growth, which over the past decade has boosted personal
income and halved poverty rates to less than 26 percent in 2012. Peru is an upper middle income
country with a gross domestic product (GDP) per capita of $11,363 ($ at PPP); its 2013 GDP is
estimated at $354 billion ($ at PPP). Sources are forecasting personal disposable income per capita
rising to over $3,000 in 2013. With more money in their pockets, Peru’s 29.8 million (Central
Intelligence Agency - CIA, July 2013 est.) largely urban consumers (77 percent of the population) are
demanding ever greater food variety and quality.
FAS Lima believes that despite somewhat slower nominal GDP growth of around 5.1 percent in 2013,
down by 1.2 percent from 2012’s level, consumer demand will remain good through the near- to
medium-term. Helping drive consumer spending in recent years has been the combination of low
unemployment levels (5.5 percent in 2013) along with the country’s financial sector expanding
consumer credit access. Today roughly 60 percent of total retail sales are food purchases, and are often
made with credit/debit cards. Sources estimate Peru’s retail food market at $43 billion (2012), with
supermarkets and hypermarkets accounting for half of reported sales.
Key players within Peru’s food processing industry include: Grupo Gloria SA (Peru); Alicorp SAA
(Peru); and San Fernando (Peru). These food processing companies dominate the domestic market,
offering products tailored to Peruvian consumers’ needs and preferences. Sadia (Brazil) and Nestle
(Switzerland), along with Don Italo (Peru) dominate the frozen food sector. FAS Lima estimates that of
Peru’s 3,000 plus companies engaged in food processing, there are over 50 medium- to large-size food
processors with combined 2012 sales of over $14 billion. These food processors have annual incomes
ranging from a low of $12 million to a high of $1.3 billion.
Domestic food processing is growing thanks to the expansion of the Peruvian retail food market.
Supermarkets and hypermarkets are in full expansion mode; moving into the country’s previously
ignored interior cities. Today, both supermarkets and hypermarkets are an increasingly common feature
in Peru’s capital (over 75 stores in Lima) and large cities (over 35 stores); eating into independent small
grocers’ (known locally as bodegas) sales. Sources estimate that independent grocers located within a
four-block radius of supermarkets and hypermarkets face sales losses of around 50 percent once
modern, large retailers open shop. Nevertheless the food retail sector in the near- to medium-term will
remain dominated by groceries (70,000 in Lima and 200,000 nationwide) who offer a limited selection
of processed packaged and frozen foods.
The larger, western-style food retailers stock both a wider selection of domestic processed products, as
well as a good number of imported items compared to neighborhood grocers. Large retailers’ expansion
is being facilitated by Peru’s regional and extra-regional trade agreements. The scarcity of affordable
commercial retail space (including space for parking) in built up areas, is however forcing larger
Lima
retailers out into the middle class suburbs. Supermarkets and hypermarkets are also deliberately seeking
new sales opportunities in low-income outlying areas.
Peru’s per capita consumption of food nevertheless still lags in comparison with that of its neighbors.
In Chile, for example food consumption among its 17.2 million (CIA, July 2013 est.) consumers is 2.6
times greater despite a smaller population. FAS Lima attributes the difference largely to yet to be
resolved disparities in Peruvian income levels, as well as to poor logistical infrastructure outside of
metropolitan Lima and the major cities (e.g., Arequipa and Trujillo).
On a positive note, we do however see this urban market (urbanizing at 1.6 percent annually in the
2010-15 period) moving away from unpackaged, bulk food to more consumer-oriented packaged food
options as personal incomes improve.
There is a growing trend among domestic food manufactures, seeking to capitalize on Peru’s
sophisticated food culture, to incorporate local ingredients such as traditional (jungle) fruits, indigenous
peppers, and Andean grain (e.g., Quinoa) varieties among others in their offerings; often packaging
processed food products into smaller, more family friendly sizes. In 2012 (latest available data) we
have seen 6 percent growth in the local processed meat industry; poultry alone grew nearly 8 percent,
while processed beef products have grown almost 3 percent. Large retailers’ contributed to the sausage
industry’s 5 percent growth in 2012.
Peru’s dairy sector saw growth of nearly 4 percent in 2011 (latest available data), driven mainly by
yoghurt and evaporated milk production. Exports climbed to $105 million as a result. Dairy products,
much like other processed, packaged food products are also experiencing growing domestic demand as
a result of supermarket and hypermarket expansion.
The non-alcoholic drinks beverage industry continues to show good growth prospects, building on its
decade’s long upward trend thanks to the takeoff of soft drinks and mineral water products. The sector
saw almost 5 percent growth in 2012 largely in part to improvements in the country’s modern food retail
distribution channels along with increased product variety. Sport drinks are growing in importance in
this increasingly health conscious society.
Distilled alcohol and spirit production saw strong growth of 19 percent in 2012, driven by the increased
domestic production of rectified ethyl alcohol. FAS Lima notices that rum is being produced in greater
quantities, especially for export to European Union (EU) markets (e.g., Italy and the Netherlands), as
well as to Japan and neighboring Chile and Ecuador. Exports of Peruvian rum in 2012 were in excess
of $1.6 million.
Domestic spirit production, and consumption, is largely differentiated by consumers’ income levels.
Low-priced spirits, namely affordably priced rum, vodka, and economy Pisco (Peruvian grape brandy)
remain largely consumed in the interior provinces among low-income groups. High-value Pisco, along
with imported whiskies, tequilas, and rums are normally consumed by middle- to upper-income
consumers in the country’s major urban areas.
Peruvian wine production climbed 6.5 percent in 2012, an improvement from the previous year which
had seen production drop by 1.8 percent. FAS Lima attributes the production increase to improved
grapevine yields. Similarly Pisco production saw very good growth of 44 percent, benefitting not only
from better (grape) crop yields but also its strong links to Peru’s cuisine. Not surprisingly the number of

better-than-average Piscos is on the increase as younger consumers increasingly opt for this local spirit.
The local beer brewing industry showed growth of nearly 6 percent in 2012, reaching almost 1.5 billion
liters. Peru’s three largest brewers both enhanced their distribution channels in 2012, as well as
launched new-to-market products. Backus is now aiming to increase its exports of local Cuzqueña beer,
while AmBev Peru spruced up its flagship Brahma beer with new packaging and alternative product
sizes.
Production levels in Peru’s milling industry grew over 4 percent in 2012 thanks to increased demand
from bakeries. Although bulk dry pasta production experienced a drop of over 5 percent in 2012, the
(pasta) category as a whole was buoyed by packaged pasta production growing nearly 2 percent.
Peruvian pasta exports came in just shy of $40 million in 2012.
Food and Agricultural Products Sales, by Sector, 2012
Sector ($ Million)
Beverages 2,920.0
Foods (Top 30) 6,402.0
Agribusiness (Top 50) 6,596.0
Total 13,918.0
Source: Estimated values based on The Top 10,000 Companies 2012 version, Peru Top Publications.
Advantages and Challenges Facing U.S. Products in Peru
Advantages Challenges
The U.S.-Peru Trade Promotion Agreement
(PTPA) grants duty-free access to most U.S.-
origin high-value food and agricultural
products.
Appreciation for U.S. food and agricultural
products’ quality.
Food ingredients enter duty-free upon the
PTPA’s entry into force.
Imported food ingredients are in demand for
food manufacturing for local consumption
and export.
Growing demand for lower calorie ready-to-
eat meals, frozen food products, snacks, and
beers.
Growing income rates, employment
opportunities and credit access especially for
middle-income consumers.
Demand for diet, light and healthy food
products is growing.
1. Processed food consumption,
especially of frozen foods, is still
small.
2. Lack of brand awareness
among consumers.
3. New local food brands are
launched at very low prices.
4. Local food manufacturers
face lower production costs and
benefit from proximity to market.
5. Local companies are adept at
accurately tapping into consumer
preferences.
Stiff competition from
countries within the region.
Smuggling remains a
concern.

Section II. Road Map for Market Entry
Entry Strategy
U.S. exporters should directly contact the local food processing company or indirectly
establish connections through brokers, agents, or representatives.
Personal visits are highly recommended; the local partner should be known by the exporter
before signing contractual agreements. Maintaining close contact is recommendable.
Exporters should provide support to food service customers by participating in technical
seminars, product demonstrations, and local trade shows whenever possible.
The import partner should be able to provide updated information on consumer trends, current
market developments, trade, and business practices.
It is recommended that U.S. exporters work with chefs and local importers to conduct innovative
marketing activities in the high-end food service sector.
Processed products must be approved by health authorities and receive a registration number
before being put on the market.
Market Structure
Local processed food products cover around 85 percent of the market demand.
Small processors outsource the import of ingredients to local distributors/representatives or to
their subsidiaries. Large processors import directly, handling logistics in house.
Specialized importers usually provide food ingredients to the Peruvian market. Some of these
are also producers or wholesalers/distributors.
International franchises (KFC, Pizza Hut, Burger King, McDonalds) and the local Bimbos are
able to import some of their food ingredients directly because of high volumes.
C. Company Profiles
Profiles of Major Food Processing Companies
Company Name, Products
2012
Est.
Sales
($
Million)
End-Use
Channels Production
Location Procurement
Channels

Alicorp S.A. Cooking ingredients, sauces, dried goods, canned fruit,
prepared meals, ice cream 1,406
Retail HRI Traditional
market
Lima Trujillo
Direct Importers
Gloria S.A. Dairy products, canned fish, pork products, fruit juices
978
Retail HRI Traditional
Market
Lima Arequipa Cajamarca
Direct Importers
Nestle Peru S.A. Breakfast cereals, confectionary, dairy products, smashed
potatoes, instant beverages, bakery goods (pannettonne) 476
Retail HRI Traditional
Market
Lima Direct Importers
San Fernando S.A. Poultry, pork and their by- products.
628
Retail HRI Traditional
Market
Lima Direct Traders
Molitalia S.A. Flour, pasta, ketchup, semolina
261
Retail HRI Traditional
Market
Lima Direct Importers
Perales Huancaruna S.A. Coffee Processor
416
Retail HRI Traditional
Market
Amazonas Direct
Redondos S.A. Poultry and by-products
218
Retail HRI Traditional
Market
Lima Direct Importers
Laive S.A. Dairy products, pork products, fruit juices
132
Retail HRI Traditional
Market
Lima Direct Importers
Molinera Inca S. A. Flour and other grain mill products
91
Retail HRI Traditional
Market
Trujillo Direct Importers
Kraft Foods Peru S.A Cookies, instant desserts and beverages, mayonnaise and
ketchup, coffee 116
Retail HRI Traditional
Market
Lima Direct Importers
Industrias del Espino S.A. Oils, fats
132 Retail Wholesaler
San Martin Direct
Panaderia San Jorge S.A.. Bakery goods (cookies and pannettonne) Flour and other grain mill products
62
Retail HRI Traditional
Market
Lima Trujillo
Direct Importers
Industrias Teal S.A. Cookies, candies, pasta, flour, pannettone, chocolate
66
Retail Traditional
Market Lima
Direct Importers
Cogorno S. A. Flour, pasta and other grain mill products
69
Retail HRI Traditional
Market
Lima Direct Importers
Ajinomoto del Peru S.A. Condiments, seasonings
77
Retail HRI Traditional
Market
Lima Direct
Compañía Nacional de Chocolates de Peru S.A. Confectionary chocolate
68 Retail Traditional
Market Lima
Direct Importers

Anita Food S.A. Noodles, pasta
75 Retail Traditional
Market Lima Direct
Machu Picchu Foods S.A.C. Coffee, cocoa, chocolate
96 Wholesaler Lima Ica
Direct
Sociedad Suizo Peruana de Embutidos S.A. Pork and beef products
53
Retail HRI Traditional
Market
Lima Direct
Panificadora Bimbo del Peru S.A. Bakery godos
50
Retail HRI Traditional
Market
Lima Direct Importers
Corporacion ADC S.A.C. Flour, noodles, bakery godos, animal feed, pulses,
semolina 50
Retail Traditional
Market Tacna Direct
Central de Cooperativas Agrarias Cafetaleras Coffee, Cacao, Honey Bee, Tea, anise, chamomile, animal
feed 69
Retail HRI Traditional
Markets
Cuzco Importers
Molino El Triunfo S.A. Flour, semolina, noodles
45 Retail Traditional
Market Lima
Direct Importers
Braedt S. A. Cheese and pork products
43 Retail HRI
Lima Direct Importers
Derivados del Maiz S. A. Corn, potato and sweet potato products as ingredients
38 Retail Traditional
Market Lima
Direct Importers
Confiperu S. A. Confectionary
37 Retail Traditional
Market Lima
Direct Importers
Industrial Alpamayo S.A. Oils, fats
43
Retail HRI Traditional
Market
Lima Direct
Ameral S.A.A. Oils, chocolate, confectionery, condiments, seasonings
23
Retail HRI Traditional
Market
Lima Direct Importers
Mead Johnson Nutrition Peru SRL
58
Retail HRI Traditional
Market
Lima Direct
Sources: Estimated sales for 2012, based on Peru: The Top 10,000 Companies 2013, Peru Top Publications.
Profiles of Major Beverage Companies
Company Name, Products
2012
Est. Sales
($
Millions)
End-Use
Channels Production
Location Procurement
Channels
Union de Cervecerias Peruanas Backus & Johnston S.A.A. (Corporacion
Backus) Beer and soft drinks
1,170
Retail HRI Traditional
market
Lima La Libertad Lambayeque
Direct Importers
Corporacion Jose R. Lindley S.A. Beer
653
Retail HRI Traditional
market
Arequipa Direct Importers
Ajeper S.A. Soft drinks, bottled water
229 Retail HRI Traditional
Lima Direct Importers

market
Compañia Cervecera Ambev Peru S.A.C Beer and soft drinks
214
Retail HRI Traditional
Market
Lima Direct
Cerveceria San Juan S.A.A. (Corporacion Backus) Beer
149
Retail HRI Traditional
Market
Lima Direct
Embotelladora San Miguel del Sur S.A.C. Soft Drinks
58
Retail HRI Traditional
Market
Arequipa Direct
Ajeper del Oriente S.A. Soft Drinks
39
Retail HRI Traditional
Market
Ucayali Direct
Embotelladora Don Jorge S.A.C. Soft Drinks
28
Retail HRI Traditional
Market
Lima Direct
Santiago Queirolo S.A.C. Alocoholic Beverages
27
Retail HRI Traditional
Market
Lima, Ica Direct
Destilerias Unidas S.A. Alcoholic
beverages 24
Retail HRI Traditional
Market
Lima Direct
Sources: Estimated sales for 2012, based on Peru: The Top 10,000 Companies 2013, Peru Top Publications.
D. Sector Trends
Dairy Products
Evaporated milk is the most commonly consumed type of milk. FAS Lima finds that transportation
costs are lower proportionally than that for liquid milk. Additionally this product does not require
refrigeration; a critical factor in a country with low household refrigerator penetration. Another
significant factor is that with evaporated milk the consumer can determine the dilution ratio of the
product, helping stretch the household food budget.
Grupo Gloria SA is the undisputed dairy product category leader with 14 percent of retail value market
share for packaged food and 67 percent for dairy products. The company is constantly launching new
products and improving upon existing ones. Condensed/evaporated milk, the dairy category’s the most
product still shows potential growth opportunities with producers marketing health and wellness
products.
Beer
Beer consumption, despite slowing slightly in 2012, still grew 6 percent; reaching almost 1.5 billion
liters. Preference for premium and better-quality local beers is influence by the country’s overall
economic growth. FAS Lima has seen low-income consumers switch up to better-quality beers as their
incomes have improved in recent years. Similarly, middle- to high-income consumers are shifting
increasingly to premium-priced beers.
Domestic lager beer production is concentrated in three breweries: Unión de Cervecerías Peruanas
Backus & Johnston (91.3 percent); Compania Cervecera AmBev Peru SAC (6.5 percent); and AJEPER
SA (1.2 percent). All of these brewers produce a wide range of beers.
Imported premium lager showed the fastest growth in 2012 (up 32 percent in volume terms).
Consumers remain most loyal to this beer style, despite inroads being made by dark beer. Premium-
priced imported lagers (e.g., Miller Genuine Draft) continue to experience rapid growth. Bottled beer is
preferred over can beer; with the 625 milliliter (ml) bottle size accounting for 95 percent of all sales.
Nonetheless supermarkets are receptive to all packaging formats and sizes, including the more
affordable and easier to transport/handle can beer.
Wine
In 2012, wine volume sales reached 37 million liters. The highest growth category remains sparkling
wine, with a 9 percent increase in total volume sales. In this category, champagne alone grew by 32
percent and other sparkling wines registered 9 percent growth. This category is growing rapidly as
consumers experiment with new opportunities to serve the product.
Consumers are becoming more knowledgeable and are trading up to quality wines. The average price
point of imported bottled wine is increasing as consumers experiment with premium wines.
Consumption of low-priced imported wine is decreasing.
In 2012, domestic wine accounted for 75 percent of total sales. Domestic burgundy accounts for 61
percent of total volume share. Imported wines represented 25 percent of total sales. The most popular
packaging is 700-750 ml glass bottles. More affordably priced brands tended to be packaged in box
containers and less frequently in 5 liter glass jugs. The off-trade was the largest channel for wine in
2012, representing 80 percent of total volume sales. Wines are largely consumed at home with family
and friends.
Baked Goods
In 2012, Peru’s baked goods sector grew 4 percent in value terms reaching roughly $6 billion. Driving
the sector was the packaged bread category, which grew 8 percent. Bread is a staple of the Peruvian
diet. Consumers prefer artisanal bread which is often purchased at grocers, bakeries and some
supermarkets. Since 2010, however packaged/industrial bread is gaining market share thanks to its
longer shelf life that meshes with Peruvians increasingly more hectic life style.
Biscuits
The biscuits sector grew 7 percent in value terms, just shy of $600 million in 2012. Chocolate coated
biscuits experienced the fastest growth thanks to new product launches and stepped up marketing
activities. Alicorp SAA and Kraft Foods Perú SA led sales with a combined value market share of 63
percent. Supermarkets and hypermarkets (e.g., Wong, Metro and Plaza Vea) private labels specialize in
affordable savory and sandwich biscuits.
Frozen Processed Food
Peru’s frozen food market in 2012 grew 8 percent, reaching $25 million in sales. Frozen processed red
meat and processed poultry account for 95 percent of total frozen retail sales. Supermarkets and
hypermarkets, equipped with modern refrigeration systems, are the main distribution channel for frozen
processed food. These account for 85 percent of total retail sales.
Breakfast cereals
Breakfast cereals saw 7 percent growth in 2012 as more middle-income consumers adopt cereals as their
breakfast choice. Hot cereals remain a popular breakfast cereal among both low- and middle-income
consumers. However, breakfast cereals are getting an added boost from health-conscious consumers
seeking out products with fortified ingredients. Especially popular are cereals that boost energy and
contain high protein and vitamins.
Canned Preserved Food
Canned food (especially fish products) sales grew 11 percent in 2012 largely due to convenience they
afford consumers. Easy to store and quick to prepare, canned food offer time stressed consumers a
quick meal solution. Domestically processed canned/preserved fish/seafood is subject to intense local
competition, forcing unit prices to remain low. The most common types of canned fish in Peru include
tuna, mackerel, sardines and anchovies. With a combined market share of over 51 percent, GW
Yichang & Cia SA and Molitalia SA dominate the market. U.S.-origin brands as Hunt’s and Del Monte
compete on quality and brand recognition, attracting middle- and upper-income consumers. Wong and
Metro supermarket private label brands offer lines of affordable canned/preserved beans and
canned/preserved fish.
Dried Processed Food
Dried processed food sales grew 6 percent in 2012. Rice is the leading product in this category, as well
as a key staple in the Peruvian diet. Low- and middle-income consumers prefer unpackaged rice’s
lower unit price compared to packaged options. Local rice companies offer different package sizes and
levels of quality (i.e., economy, standard, and premium). Alicorp SAA and Corporación
Transcontinental del Perú SAC have a market share of 56 percent in 2012.
Oils and Fats
Oils and fats as a category grew 3 and 4 percent respectively in terms of volume and value sales in
2012. The vegetable oil blend of soybean with palm and/ or cottonseed oils remained the most popular
edible oil product in 2012; accounting for 96 percent of total retail sales. Sunflower oil with 2 percent
of retail sales came in second followed by canola oil with 1 percent. Alicorp dominates the sector with
a 56 percent market share in value terms.
Ready-to-Eat Meals
Peru is the country with the lowest per capita consumption of ready-to-eat meals in Latin America.
Peruvians continue to prefer consuming fresh food, perceived as being more nutritious than frozen
products or ready-to-eat meals. High price also limits the acceptance of these products. Despite these
limitations, ready-to-eat meals posted a 4 percent growth in 2012. Offerings are most attractive to
consumers already familiar with canned/preserved products.
Sauces, dressings and condiments
In 2011 (latest available data), the category grew 9 percent. Consumers are increasingly relying on
commercially manufactured sauces, dressings and condiments due to sanitary concerns arising from
small-scale artisanal production. Greater variety, affordability, and different package sizes have been
key factors influencing growth for this category.
Spreads
Within the spreads category, jams and preserves account for 87 percent of retail sales in 2012. Rising
health awareness and growing consumer concerns with diet-related illnesses (e.g., obesity and diabetes)
is leading to increased availability of product with reduced sugar content. Molitalia SA leads the
spreads category with a 30 percent market share.
Sweet and Savory Snacks
Sweet and savory consumption remains low in Peru compared to that in neighboring countries. The
sweet and savory category registered nonetheless 7 percent growth in 2012. Extruded and fruit snacks
both saw growth in excess of 9 percent in 2012. With a market share of 75 percent in 2012, Snacks
America Latina SRL dominates the local market.
Section III. Competition
Competitive Situation facing U.S. Suppliers in the
Food Processing Market in 2012

Product
Category/ Net Imports
Major Supply
Sources Strengths of Key Supply Countries
Advantages and Disadvantages of
Local Suppliers
Dairy Products
(excl. Cheese) ($144.3
million)
New Zealand:
35 percent U.S.: 19 percent Argentina: 12
percent Chile: 9 percent Ireland: 5
percent Bolivia: 12
percent
- New Zealand is a major supplier of dairy
ingredients, especially HS 040210 milk accounting
for 35 percent of total imports.
- Only two companies are major
producers of evaporated milk and
yogurt.
Cheese 3,335 tons ($16.3 million)
U.S: 44 percent Argentina: 18
percent Netherlands: 9
percent Uruguay: 8
percent New Zealand: 5
percent
Argentina and Uruguay are part of MERCOSUR and
have tariff preferences.
Local homemade cheeses are
commonly sold. Gourmet cheeses are not made
locally.
Snack Foods 20,606 tons ($66.70
million)
Colombia: 53
percent U.S.: 7 percent Chile: 7 percent Ecuador: 6
percent Brazil: 5 percent
- Tariff preferences are applied to neighboring
countries.
- Local producers are major food
processors. They import food
ingredients for snacks and snacks in
bulk.
Processed
Fruits and
Vegetables 52,747 tons ($80.2 million)
Chile: 61
percent U.S.: 10
percent Netherlands: 7 Argentina: 5
percent China: 4 percent
Chile sells at cheaper prices due
to proximity and tariff
preferences. - EU products are viewed as good quality.
- Netherlands has increased its potato exports.
- Local processors are major
exporters, but their local supply is
limited.
Fresh Fruits 66,083 tons ($47.6 million)
Chile: 86
percent U.S.: 7 percent Argentina: 5
percent
- Chile is the main supplier because of proximity,
price and duty free entrance. - Argentina has a window for pears and apples.
- There is an open window from
November to February for that will
benefit the United Stated - Local fruit sold in retail markets is
of lower quality.
Fruit and
vegetable
juices 1,429,940 L ($ 3.7 million)
Brazil: 38
percent U.S.: 20 percent Chile: 17
percent Argentina: 12
percent Mexico: 7
percent
- Chile has tariff and proximity advantages. - Brazil has increased its exports of orange and
pineapple juice
- Local brands are well positioned
in the market at competitive prices.
Wine and Beer 26.59 Million
liters ($36.9 million)
Argentina: 39
percent Chile: 24
percent Spain: 10
percent Italy: 9 percent Brazil: 7 percent France: 4
percent
- Proximity and recognized quality of Chilean and
Argentinean wines. - Brazil is the major supplier of imported beer.
- Major local breweries are well
positioned, price competitive, and
belong to international companies,
representing 95 percent of the
market.
- Local wine is well positioned and
price competitive, but does not
satisfy demand.
Netherlands: 2
percent Mexico: 2
percent U.S.: 1 percent
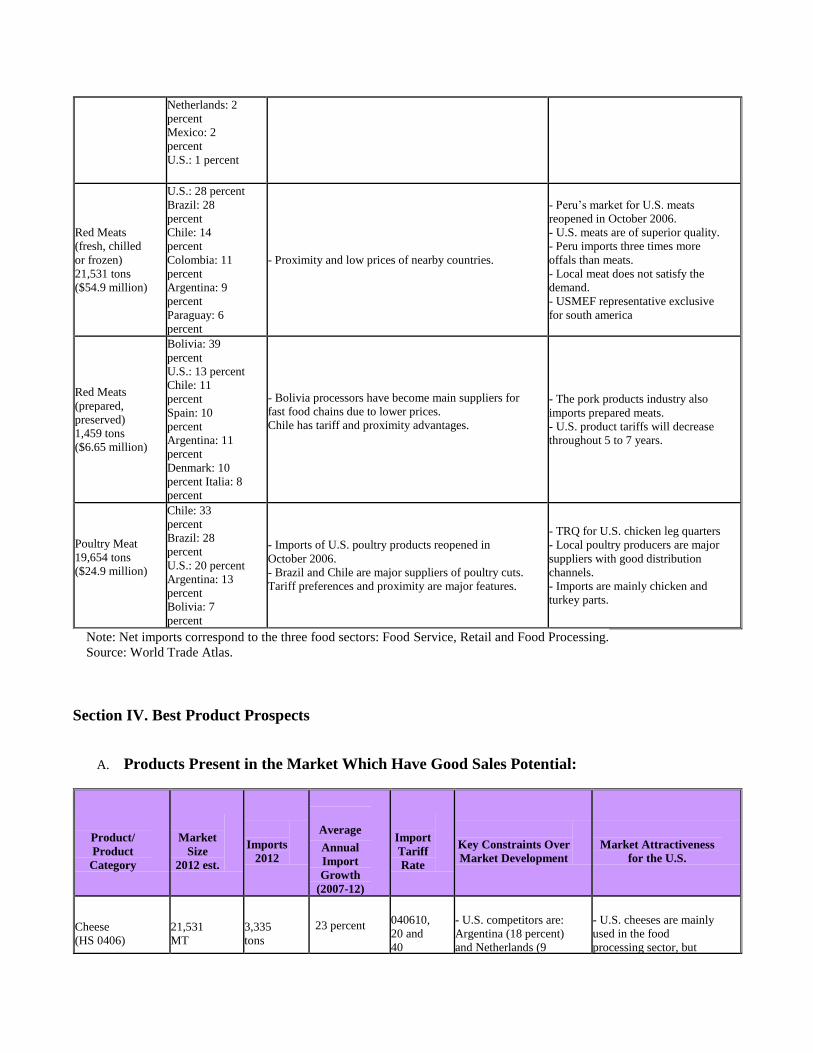
Red Meats
(fresh, chilled
or frozen) 21,531 tons ($54.9 million)
U.S.: 28 percent Brazil: 28
percent Chile: 14
percent Colombia: 11
percent Argentina: 9
percent Paraguay: 6
percent
- Proximity and low prices of nearby countries.
- Peru’s market for U.S. meats
reopened in October 2006. - U.S. meats are of superior quality. - Peru imports three times more
offals than meats.
- Local meat does not satisfy the
demand.
- USMEF representative exclusive
for south america
Red Meats
(prepared,
preserved) 1,459 tons ($6.65 million)
Bolivia: 39
percent U.S.: 13 percent Chile: 11
percent Spain: 10
percent Argentina: 11
percent Denmark: 10
percent Italia: 8
percent
- Bolivia processors have become main suppliers for
fast food chains due to lower prices.
Chile has tariff and proximity advantages.
- The pork products industry also
imports prepared meats. - U.S. product tariffs will decrease
throughout 5 to 7 years.
Poultry Meat 19,654 tons ($24.9 million)
Chile: 33
percent Brazil: 28
percent U.S.: 20 percent Argentina: 13
percent Bolivia: 7
percent
- Imports of U.S. poultry products reopened in
October 2006. - Brazil and Chile are major suppliers of poultry cuts.
Tariff preferences and proximity are major features.
- TRQ for U.S. chicken leg quarters - Local poultry producers are major
suppliers with good distribution
channels. - Imports are mainly chicken and
turkey parts.
Note: Net imports correspond to the three food sectors: Food Service, Retail and Food Processing.
Source: World Trade Atlas.
Section IV. Best Product Prospects
A. Products Present in the Market Which Have Good Sales Potential:
Product/ Product
Category
Market
Size 2012 est.
Imports
2012
Average Annual
Import
Growth
(2007-12)
Import
Tariff
Rate
Key Constraints Over
Market Development
Market Attractiveness
for the U.S.
Cheese (HS 0406)
21,531 MT
3,335
tons 23 percent
040610,
20 and
40
- U.S. competitors are:
Argentina (18 percent)
and Netherlands (9
- U.S. cheeses are mainly
used in the food
processing sector, but

($16.3
million)
0 percent 040630
040690 0 percent
percent). - Strong preference for
EU cheese at high-end
HRI and Retail Sectors.
have potential in the HRI
and Retail Food Sectors.
- In 2012, the United
States was the first
supplier with a market
share of 44 percent (62
percent growth). - TPA*: 17 years linear,
2,500 MT quota with 12
percent increase per year.
Confectionary
– non chocolate (HS 1704)
N/A
15,647
tons
($46.2
million)
16.6 percent
0 percent
- Major suppliers are
Colombia ($31 million)
and Ecuador ($3
million). - Local industry is
strong. Major owners
are foreign companies.
- United States represents
2.5 percent of total
imports, however U.S.
imports grew 57 percent in
2012. .
Confectionary
– chocolate (HS 1806)
N/A
4,073
tons
($18.1
million)
22.2 percent
0 percent
- Chile is the major
supplier (23 percent of
MS). - Local industry is
competitive.
- The U.S. is the second
major supplier with 19
percent. The U.S. strength
is in chocolate for the
retail sector. Imports grew
46 percent in 2012.
Food
Preparations
(HS 210690) N/A
14,339
tons
($131
million)
16 percent
0 percent
- Local Production is
strong. Alicorp is the
major competitor. Also
foreign companies are
established in the
country. - Chile is the major
importer (33 percent).
- United States is the
second largest supplier
and holds 18 percent of
market share. - In 2012 imports grew 18
percent.
Prime and
choice beef (HS 020230)
Total beef
and offals
market:
283,596
MT
1,283
tons ($7.3
million)
16 percent
0 percent
- Competes with quality
meats from Colombia,
Argentina, Uruguay,
Brazil and Bolivia.
- Due to an increment of
income levels, local
consumers are demanding
high quality products,
such as beef. - U.S. imports have grown
155 percent respect 2012
in this category United States became the
first largest beef supplier
in 2012 and holds 50
percent of import market
share Edible Beef
Offals (liver) (HS, 020622)
10,000
MT
3,924
tons ($6.9
million)
26.3 percent 0 percent Local production covers
most of the market size.
- The United States holds
97 percent of import
market. Imports have
grown 30 percent in 2012. Fruit and
Vegetable
juices (HS 2009)
N/A
14,299 hl
($3.7
million)
30 percent
0 percent
- Brazil is the major
supplier and holds 38
percent of market share
in 2011. It is strong in
orange juices
Imports have grown 46
percent in respect to
2012.
Pet foods (HS 230910)
45,000
MT
12,125
tons
($14.9
million)
18 percent 0 percent
- Growing local pet
industry. - There is an informal
industry arising. - Colombia 37 percent),
and Argentina (36
- The United States holds
20 percent of the import
market.
percent) are major
competitors.
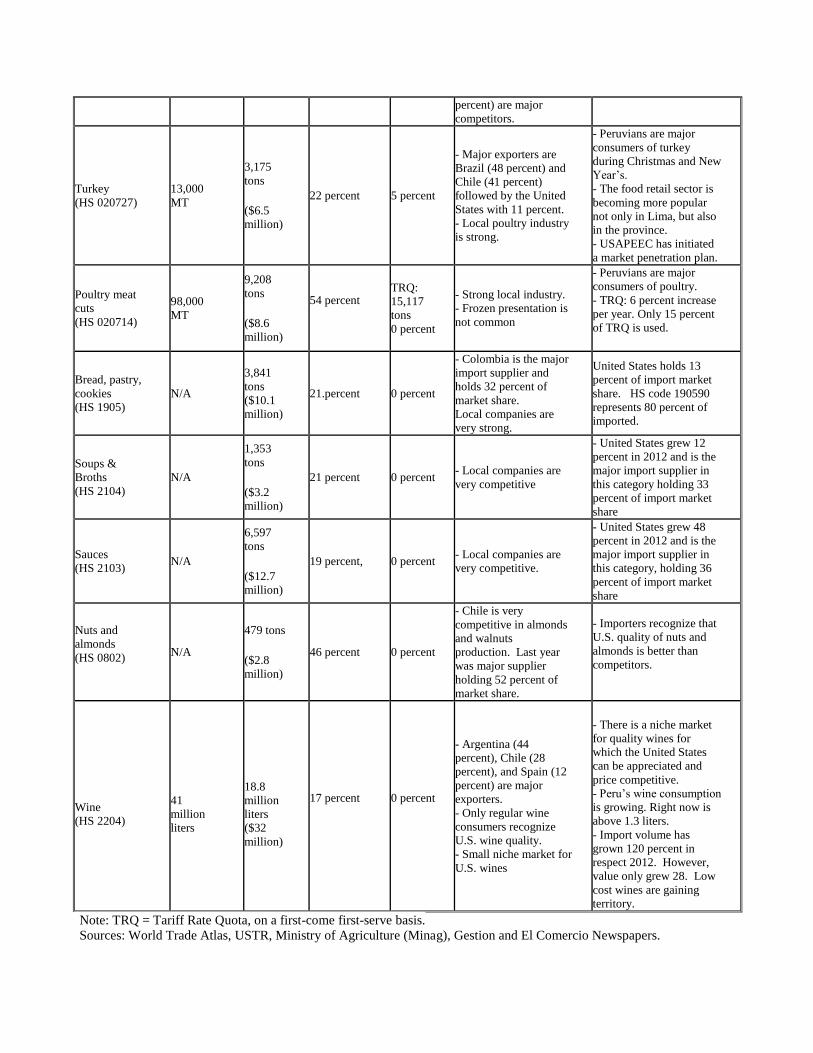
Turkey (HS 020727)
13,000
MT
3,175
tons
($6.5
million)
22 percent 5 percent
- Major exporters are
Brazil (48 percent) and
Chile (41 percent)
followed by the United
States with 11 percent. - Local poultry industry
is strong.
- Peruvians are major
consumers of turkey
during Christmas and New
Year’s. - The food retail sector is
becoming more popular
not only in Lima, but also
in the province. - USAPEEC has initiated
a market penetration plan.
Poultry meat
cuts (HS 020714)
98,000
MT
9,208
tons
($8.6
million)
54 percent
TRQ:
15,117
tons 0 percent
- Strong local industry. - Frozen presentation is
not common
- Peruvians are major
consumers of poultry. - TRQ: 6 percent increase
per year. Only 15 percent
of TRQ is used.
Bread, pastry,
cookies (HS 1905)
N/A
3,841
tons ($10.1 million)
21.percent 0 percent
- Colombia is the major
import supplier and
holds 32 percent of
market share. Local companies are
very strong.
United States holds 13
percent of import market
share. HS code 190590
represents 80 percent of
imported.
Soups &
Broths (HS 2104)
N/A
1,353
tons
($3.2
million)
21 percent 0 percent - Local companies are
very competitive
- United States grew 12
percent in 2012 and is the
major import supplier in
this category holding 33
percent of import market
share
Sauces (HS 2103)
N/A
6,597
tons
($12.7
million)
19 percent, 0 percent - Local companies are
very competitive.
- United States grew 48
percent in 2012 and is the
major import supplier in
this category, holding 36
percent of import market
share
Nuts and
almonds (HS 0802)
N/A
479 tons
($2.8
million)
46 percent 0 percent
- Chile is very
competitive in almonds
and walnuts
production. Last year
was major supplier
holding 52 percent of
market share.
- Importers recognize that
U.S. quality of nuts and
almonds is better than
competitors.
Wine (HS 2204)
41 million
liters
18.8
million
liters ($32
million)
17 percent
0 percent
- Argentina (44
percent), Chile (28
percent), and Spain (12
percent) are major
exporters. - Only regular wine
consumers recognize
U.S. wine quality. - Small niche market for
U.S. wines
- There is a niche market
for quality wines for
which the United States
can be appreciated and
price competitive. - Peru’s wine consumption
is growing. Right now is
above 1.3 liters. - Import volume has
grown 120 percent in
respect 2012. However,
value only grew 28. Low
cost wines are gaining
territory.
Note: TRQ = Tariff Rate Quota, on a first-come first-serve basis.
Sources: World Trade Atlas, USTR, Ministry of Agriculture (Minag), Gestion and El Comercio Newspapers.

B. Products not present in Significant Quantities, but which have good sales Potential:
Product/ Product
Category
Imports
2012
Average Annual
Import
Growth
(2007-12)
Import
Tariff
Rate
Key Constraints Over
Market Development
Market Attractiveness for the
U.S.
Peaches,
cherries and
Nectarines (HS 0809)
3,739 tons ($3.1
million) 27 percent 0 percent
- Chile is major supplier with
99 percent of the market.
- Importers are interested in
U.S. peaches and nectarines. - Duty free access for this
category.
Apples and
Pears (HS 0808)
52,534
Tons
$41
million
17 percent
0 percent
- Chile is the major supplier
with 87 percent of the market. - Chile proximity benefits
from other suppliers.
- There is a window of
opportunity for the United
States between November and
February. Local consumers recognize
U.S. apples and pears quality.
Grapes, raisins (HS 080620)
6,616 tons
($15.5
million)
29 percent
0 percent
- Chile holds almost 95
percent of the market.
- U.S. window: September to
December.
Citrus (HS 0805)
123 tons
$141,612
56 percent
5 percent
- Chile is the second major
supplier with 21 percent of the
market. - Strong Local production
- United States holds 79 percent
of import market - Recognized quality of U.S.
oranges and tangerines. - Export window for the United
States is from January to
March.
Pork Meat (HS 0203)
2,648 tons
($7.2
million)
66 percent 5 percent
- Peruvians are not used to
eating pork. - Local industry produces
more than 100,000 MT - The industry is the same as
the poultry industry. - Chile is the major supplier
with 88 percent of the market
and second is Canada with
15 percent
- Pork imports are growing. - U.S. pork benefit from TPA
implementation. - Beef importers can also
import pork. Best quality and
competitive prices. - USMEF representative for the
region.
Sausages (HS 1601)
620 tons
($2.0
million)
26 percent 5 percent - Major exporter is Chile with
37 percent of the market - Local industry is strong
- There is a high-end segment
for gourmet sausages, in which
the United States can compete. United States holds 34 percent
of import market. Imports
grew 119 percent in 2012. Fast food restaurants are main
channel for this category.
Ham,
processed HS 160241
77 tons
($0.92
million)
31 percent 10.71
percent
- Major suppliers are Italy (46
percent of the market) and
Spain (40 percent).
- The United States has quality
products to introduce to the
gourmet market - TPA: 7 years U.S. imports holds 5 percent of
import market share.
Beer (HS 2203)
7.8
million
liters
($4.9
million)
16 percent 0 percent
- Local breweries are very
strong and owned by
international companies. - Local breweries produce and
import new brands for
introduction in the market.
- Niche market for premium
beers. - Growing consumption of beer
(over 40 lts per capita) - Duty free entrance. Lack of U.S. brands within the

Brazil is the major supplier (50
percent of the market). market.
Note: TRQ = Tariff Rate Quota, on a first-come first-serve basis.
Sources: World Trade Atlas, USTR, Ministry of Agriculture (Minag), Gestion and El Comercio Newspapers.
C. Products Not Present Because They Face Significant Barriers
None.
Section V. Post Contact and Further Information
U.S. Embassy Lima, Foreign Agricultural Service (FAS)/ Office of Agricultural Affairs
Mailing Address: Unit 3785, APO AA 34031
Address: Av. La Encalada cdra. 17, Monterrico, Lima 33
Phone: (511) 434-3042 ● Fax: (511) 434-3043 ● E-mail: [email protected]