Pertemuan - 1 - Mari Belajar Kualitas · Tugas → Tingkat partisipasi lebih dari 75% ... Engineer....
40
Transcript of Pertemuan - 1 - Mari Belajar Kualitas · Tugas → Tingkat partisipasi lebih dari 75% ... Engineer....

Today’s OutlineToday’s Outline� About this class
� About Me
Introduction � Introduction

Class OverviewClass Overview
� Meeting Times :
Wednesday, 12.15 – 13.55
� Office Hours :
Wednesday, 11.00 – 11.30Wednesday, 11.00 – 11.30
� Course Homepage : kualitas.wordpress.com
� Syllabus, Grading and Reference
� Schedule
Syllabus, Grading and ReferenceSyllabus, Grading and Reference
� Prasyarat :
Probabilitas dan Statistik Industri, Pengendalian Kualitas , Desain Eksperimen
� Tujuan :
Membantu mahasiswa untuk memahami dan mengaplikasi metoda Taguchi. Beberapa studi kasus masalah industri diberikan untuk memahami aplikasi metoda Taguchi secara sistematik.
Syllabus, Grading and ReferenceSyllabus, Grading and Reference
Isi Mata kuliah :
Pendahuluan: dasar-dasar rekayasa kualitas , kualitas dan kemampuan process
Proses Perancangan: proses perancangan , prinsip Proses Perancangan: proses perancangan , prinsip kekokohan
Orthogonal Array dan Mariks Eksperimen : matriks eksperimen , interaksi , seleksi karakteristik kualitas
Fungsi Tujuan Dalam Perancangan Kokoh: SN ratio untuk masalah statis , analisis kecacatan fraksi , aplikasi SN ratio

Syllabus, Grading and ReferenceSyllabus, Grading and Reference
Isi Mata kuliah :Mengelola Eksperimen: proses menyelesaikan
masalah, eksperimen perancangan kokoh , eksperimen industri
Modifikasi Orthogonal Array : perancangan multi Modifikasi Orthogonal Array : perancangan multi level, perancangan dummy level , perancangan combination factor , perancangan nested-factor , perancangan idle-column , interaksi distribusi
Perancangan Parameter Berbantuan Komputer Perancangan Toleransi Berbantuan Komputer State of the art quality engineering

Syllabus, Grading and ReferenceSyllabus, Grading and Reference
Syarat Penilaian
� Kuis→ Tingkat partisipasi lebih dari 75% dan tingkat kebenaran lebih dari 40 %
� Tugas → Tingkat partisipasi lebih dari 75% dan tingkat kebenaran lebih dari 40 %
� Kehadiran di kelas → Tingkat kehadiran lebih dari 75%
Syllabus, Grading and ReferenceSyllabus, Grading and Reference
� Unsur Penilaian� KD1 = Nilai 100 � ( Terjemah dan rensensi )
� KD2 = Nilai 100 � ( Ujian Tengah Semester )
� KD3 = Nilai 100 � ( Tugas Kelompok dan Presentasi )
� KD4 = Nilai 100 � ( Ujian Akhir Semester )
� Nilai Akhir ( NA ) = 0.25 KD1 + 0.25 KD2 + 0.25 KD3 + 0.25 KD4

Syllabus, Grading and ReferenceSyllabus, Grading and Reference
Aturan Tambahan� Mahasiswa yang tidak mengikuti salah satuKD1, KD2, KD3
dan KD4 yang diadakan dengan ijin yang sah masih mungkin lulus dengan penilaian sebagai berikut :lulus dengan penilaian sebagai berikut :
� Nilai Akhir ( NA ) = 1.2 x ( jumlah nilai KD yang ikuti )� Mahasiswa yang yang tidak ikut 2 KD dengan ijin yang sah
atau/dan nilai-nya E atau/dan D , WAJIB mengikuti ujian perbaikan dengan nilai maksimum C .
Syllabus, Grading and ReferenceSyllabus, Grading and Reference
Unsur Penilaian KelompokPeer evaluation forms will be filled up by each student toevaluate each team member in the following categories:1. Participation1. Participation2. Team player, peace maker, consensus builder3. Efforts in his/her assignment4. Perceived expertise5. Willingness to help others on the team with their needs6. Amount of work accomplished7. Overall evaluation team members performance for project

Syllabus, Grading and ReferenceSyllabus, Grading and Reference
Angka dan Huruf
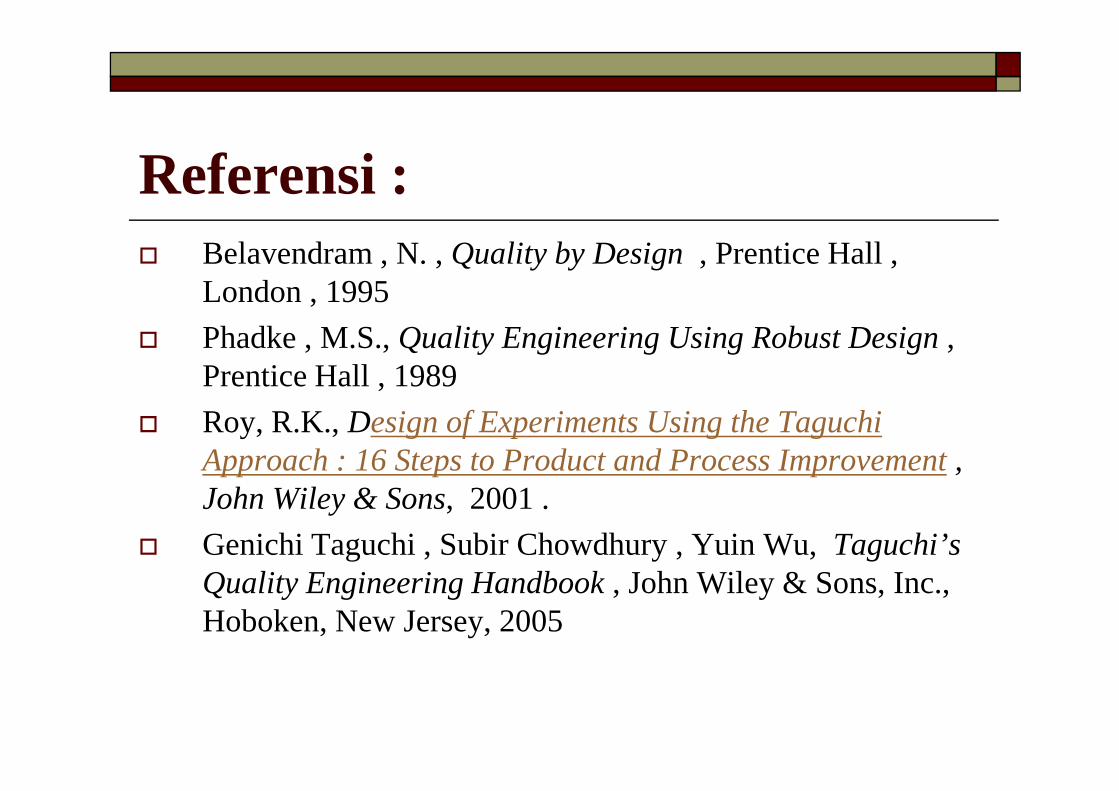
Referensi :� Belavendram, N. , Quality by Design, Prentice Hall ,
London , 1995
� Phadke , M.S., Quality Engineering Using Robust Design, Prentice Hall , 1989
� Roy, R.K., Design of Experiments Using the Taguchi Approach : 16 Steps to Product and Process Improvement, John Wiley & Sons, 2001 .
� Genichi Taguchi , Subir Chowdhury , Yuin Wu, Taguchi’s Quality Engineering Handbook, John Wiley & Sons, Inc., Hoboken, New Jersey, 2005

Rencana Kuliah
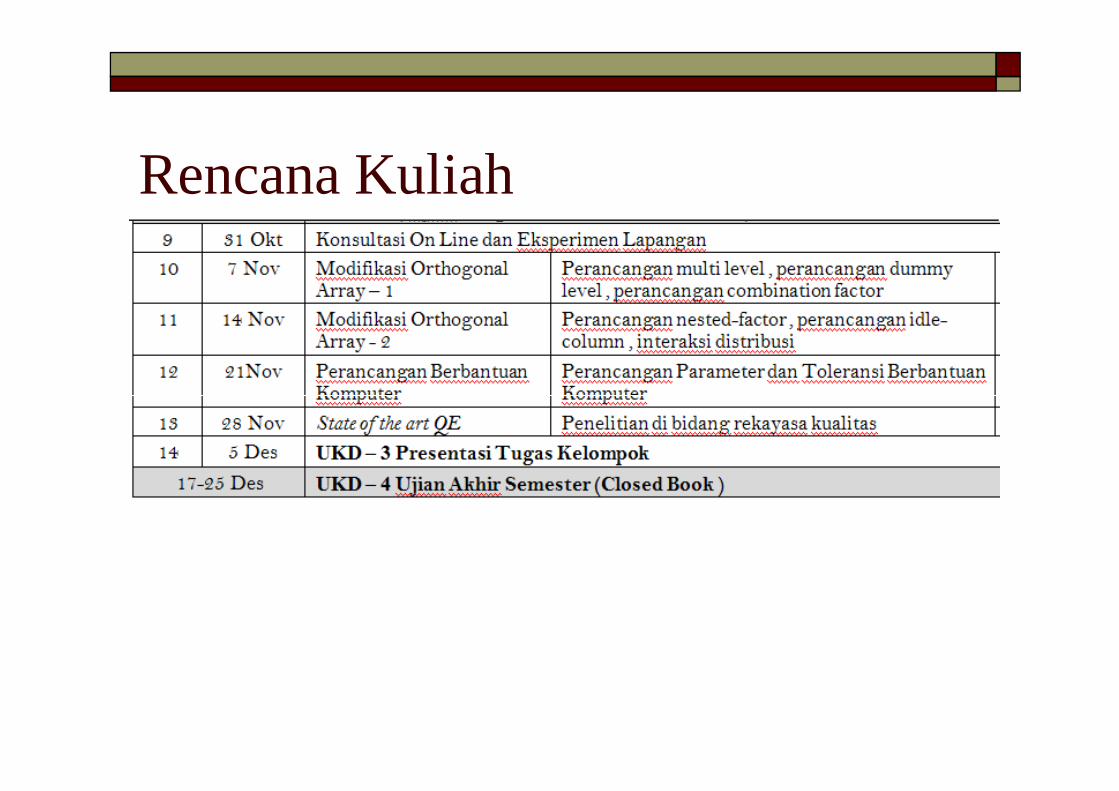
Rencana Kuliah
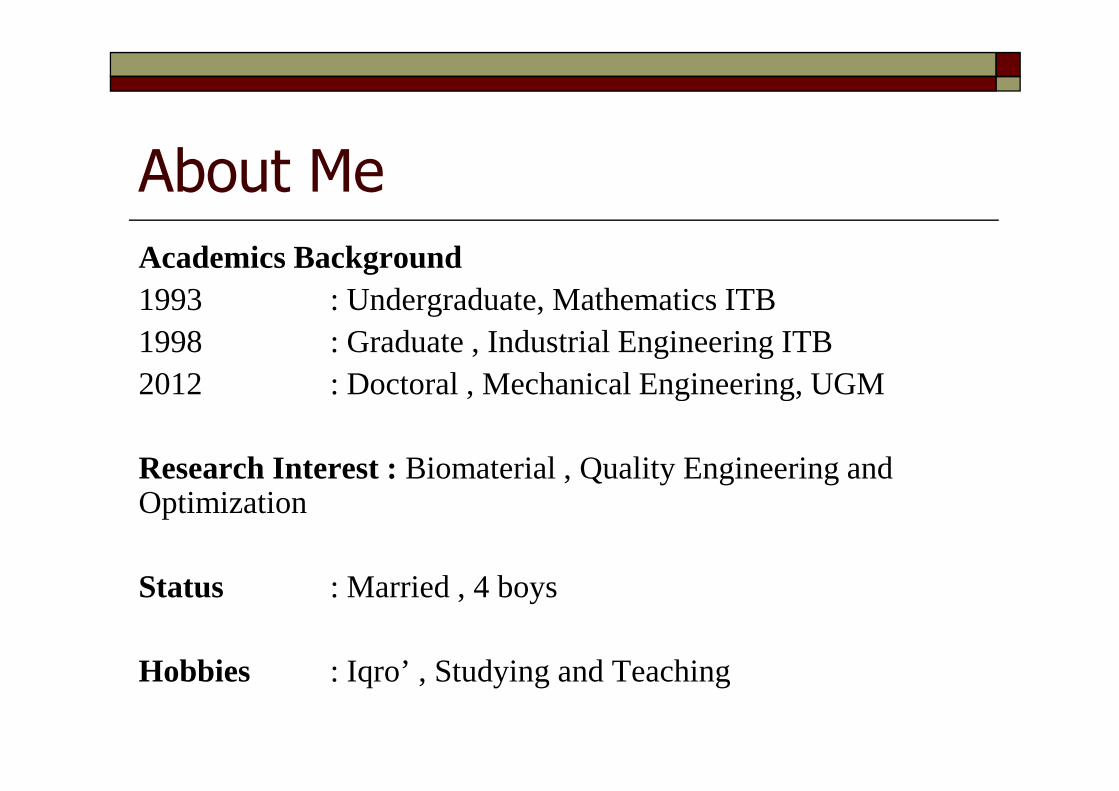
About Me
Academics Background1993 : Undergraduate, Mathematics ITB1998 : Graduate , Industrial Engineering ITB2012 : Doctoral , Mechanical Engineering, UGM 2012 : Doctoral , Mechanical Engineering, UGM
Research Interest :Biomaterial , Quality Engineering and Optimization
Status : Married , 4 boys
Hobbies : Iqro’ , Studying and Teaching
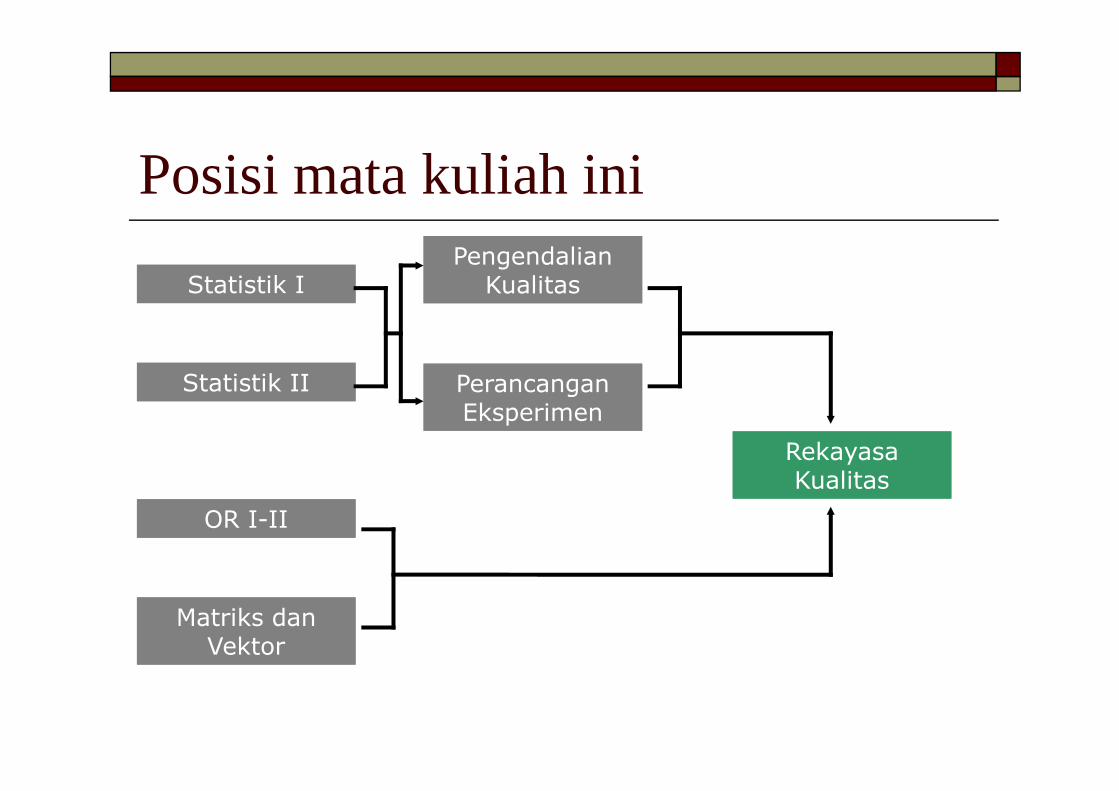
Posisi mata kuliah ini
Statistik IStatistik I
Statistik IIStatistik II
Pengendalian Kualitas
Pengendalian Kualitas
Perancangan Perancangan Statistik IIStatistik II Perancangan EksperimenPerancangan Eksperimen
Rekayasa Kualitas
Rekayasa Kualitas
OR I-IIOR I-II
Matriks dan Vektor
Matriks dan Vektor

Definition Quality EngineeringDefinition Quality Engineering� Quality Engineering is defined as "the branch of
engineering which deals with the principles and practice of product and service quality assurance and quality control ".
� A Quality Engineer would therefore responsible for the implementation of a Quality Management System in the company as well as for the maintenance of the QMS. Changes in Processes and Products should be consulted by the Quality Engineer.

What is the Design of Experiment technique?
� It all began with R. A. Fisher in England back in 1920’s.
� Fisher wanted to find out how much rain, sunshine, fertilizer, and water produce the best crop.
� Design Of Experiments(DOE):� statistical technique
� study the effect of multiple variables simultaneously
Who is Taguchi?
� Born in Japan, 1924� Electrical Engineer� Worked during 1950’s to improve Japan’s
post-WWII telephone communication systempost-WWII telephone communication system� Father of the “Taguchi Method” and “Robust
Engineering”� He devoted much of his quality improvement
effort on simplifying and standardizing the application of the DOE technique.

Who is Taguchi?
Source : www.qualitydigest.com

What is The Taguchi Approach ?
� Design of Experiments (DOE) using Taguchi Approach is a standardized form of experimental design technique (referred as classical DOE) introduced (referred as classical DOE) introduced by R. A. Fisher in England in the early 1920’s.
What is The Taguchi Approach ?
� Although Dr. Taguchi successfully applied the technique in many companies throughout the world, it was introduced to USA and other western introduced to USA and other western countries only in the early 1980’s.
� Design of Experiment using the Taguchi Approach is just one of the many tools.
WHAT’S NEW? Philosophy ! ����
� Traditionally, quality activities took place only at the production end.
� Dr. Genichi Taguchi proposed that a � Dr. Genichi Taguchi proposed that a better way to assure quality is to build it in the product by designing quality into the product

WHAT’S NEW? Philosophy !� DO IT UP-FRONT:
� He emphasized that the return on investment is much more when quality was addressed in engineering stages before production engineering stages before production
� The best way is to build quality into the design
� DO IT IN DESIGN. DESIGN QUALITY IN:� Does not replace quality activities in production
� Must not forget to do quality in design
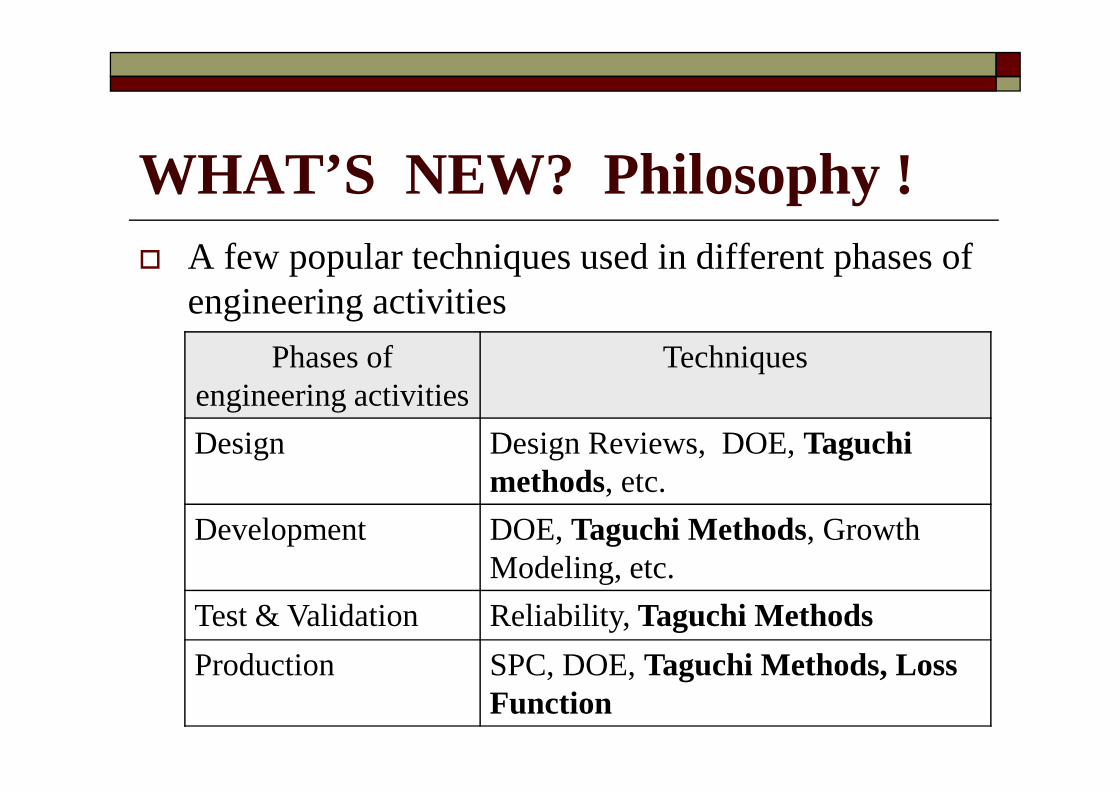
WHAT’S NEW? Philosophy !� A few popular techniques used in different phases of
engineering activities
Phases of engineering activities
Techniquesengineering activities
Design Design Reviews, DOE, Taguchi methods, etc.
Development DOE, Taguchi Methods, Growth Modeling, etc.
Test & Validation Reliability, Taguchi Methods
Production SPC, DOE, Taguchi Methods, Loss Function
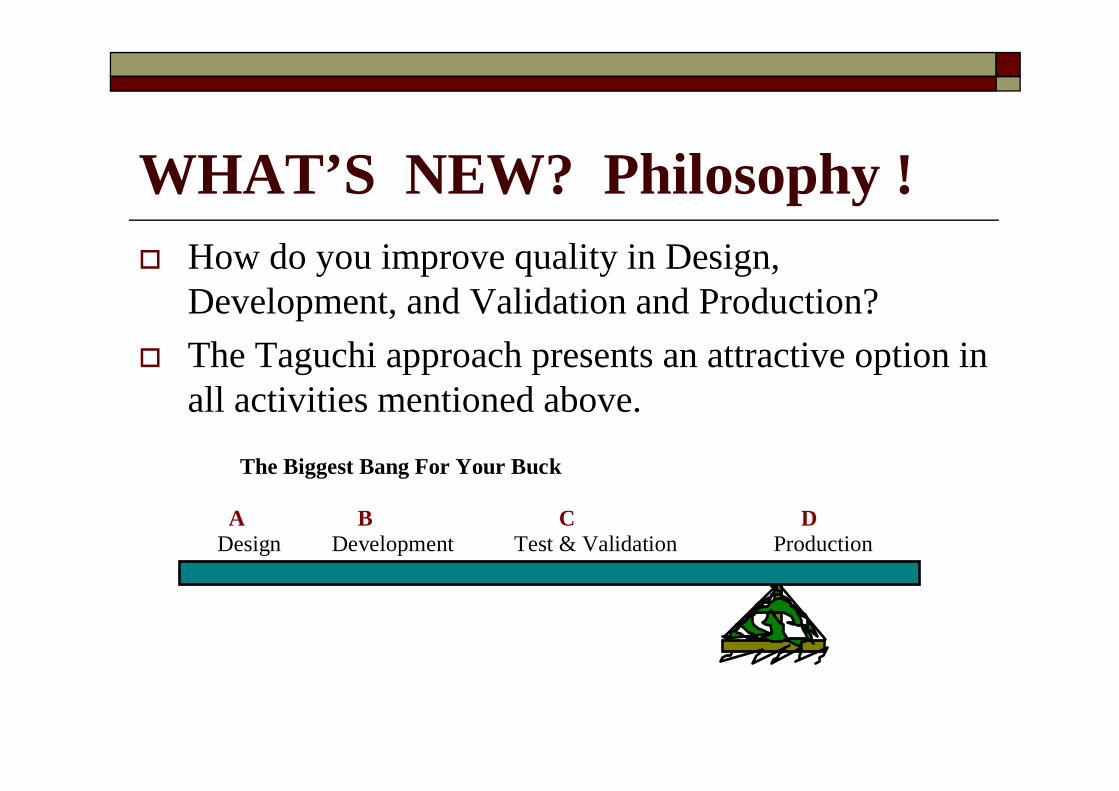
WHAT’S NEW? Philosophy !� How do you improve quality in Design,
Development, and Validation and Production?
� The Taguchi approach presents an attractive option in all activities mentioned above.all activities mentioned above.
The Biggest Bang For Your Buck A B C D Design Development Test & Validation Production
WHAT’S NEW? Loss Function! ����
� By measuring quality not by Rejection at production, but in terms of deviation from the target.
� By using the Loss function formulation to quantify the cost of quality
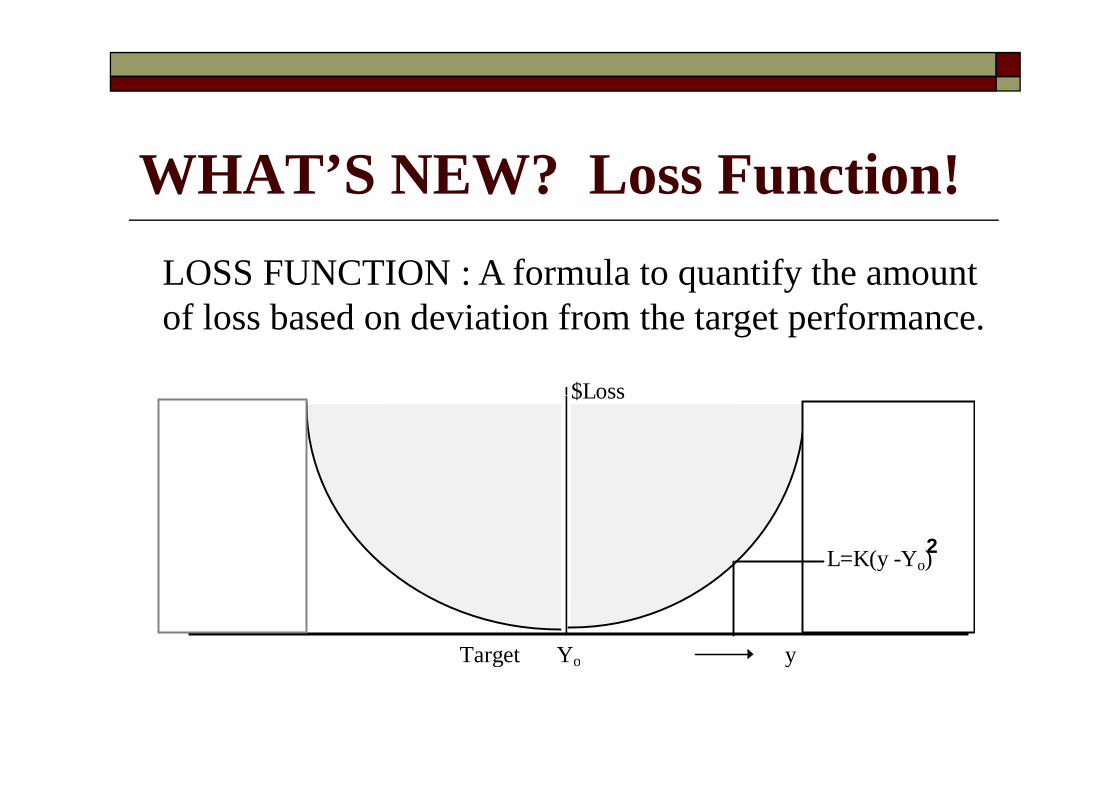
WHAT’S NEW? Loss Function!
$Loss
LOSS FUNCTION : A formula to quantify the amount of loss based on deviation from the target performance.
$Loss
Target y
L=K(y -Y o)
Yo
2
WHAT’S NEW? Definition of Quality! ����
� CONSISTENCY OF PERFORMANCE : Quality may be viewed in terms of consistency of performance. To be consistent is to BE LIKE THE GOOD ONE’S ALL is to BE LIKE THE GOOD ONE’S ALL THE TIME.

WHAT’S NEW? Definition of Quality!
� CONSISTENCY OF PERFORMANCE
Target TargetTarget

WHAT’S NEW? Definition of Quality!
� REDUCED VARIATION AROUND THE TARGET: Quality of performance can be measured in terms of variations around the target. target.
� Minimize variation around the target by reducing the distance of the mean to the target(m) and by reducing the standard deviation (σσσσ).
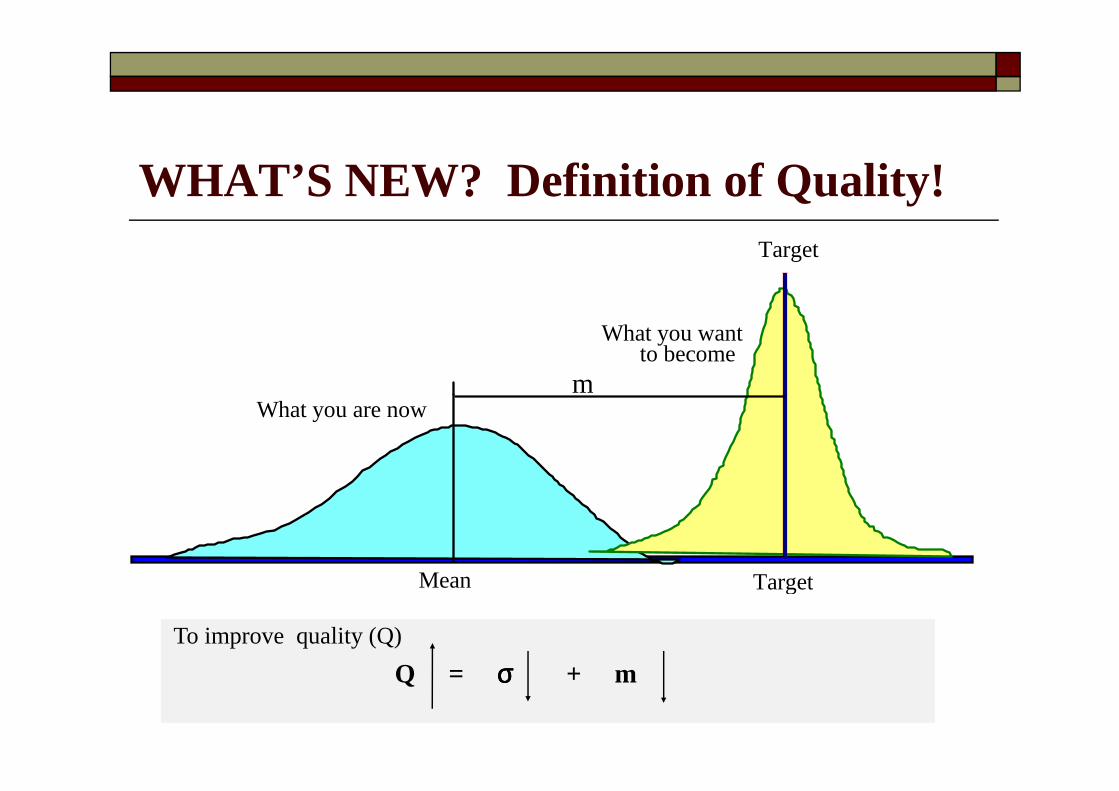
WHAT’S NEW? Definition of Quality!Target
What you wantto become
m
Mean
What you are now
Target
m
To improve quality (Q)
Q = σσσσ + m
WHAT’S NEW? Discipline! ����� BRAINSTORMING: Plan experiments and follow
through.
� TEAM WORK: Work as a team and not alone.
CONSENSUS DECISIONS: Make decisions � CONSENSUS DECISIONS: Make decisions democratically as a team. Avoid expert based decisions.
� COMPLETE ALL EXPERIMENTS planned before making any conclusions.
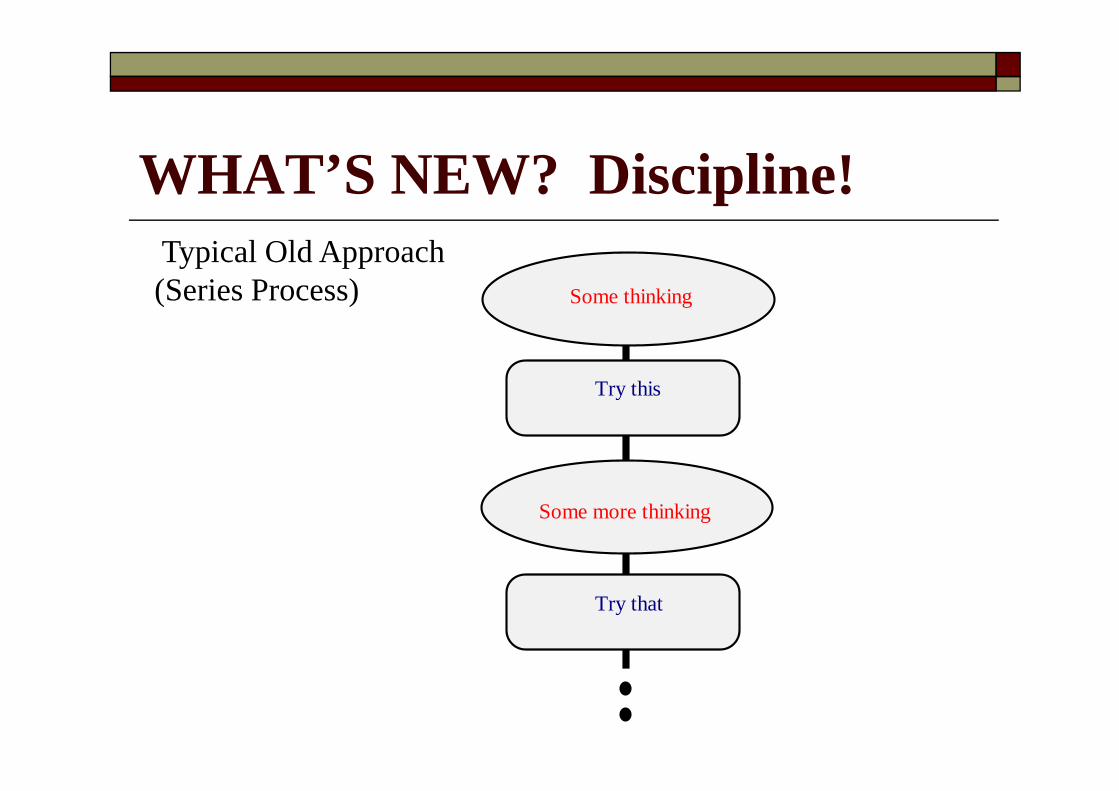
WHAT’S NEW? Discipline!Typical Old Approach (Series Process) Some thinking
Try this
Some more thinking
Try this
Try that

New Approach (A Parallel Process)
Do Lots Of Thinking (Brainstorming)
Trial#1 Trial#2
I. Planning
II. Designing
Application Steps
- What are we after?
- How do we measure results?
- etc.
Analyze Results
III. Doing
IV. Analyzing
V. Confirming Run confirmation Experiments
Conduct Experiments
WHAT’S NEW? Simpler and Standardized DOE!����
�� APPLICATION STEPS: Steps for APPLICATION STEPS: Steps for applications are clearly defined.applications are clearly defined.
�� EXPERIMENT DESIGNS: Experiments are EXPERIMENT DESIGNS: Experiments are designed using special orthogonal arrays.designed using special orthogonal arrays.
�� ANALYSIS OF RESULTS: Analysis and ANALYSIS OF RESULTS: Analysis and conclusions follow standard guidelines.conclusions follow standard guidelines.
WHY TAGUCHI APPROACH?� Experimental Efficiency� Easy Application And Data Analysis� Higher Probability Of Success� Higher Probability Of Success� Option To Confirm Predicted
Improvement� Quantified Improvement� Improve Quality And Profitability

WHEN and WHERE to apply
� Solve manufacturing and production problems
� Optimize process designs� Optimize process designs
� Optimize product designs
� Apply when more than one factor influences the outcome
Use of Statistical Technique - Old way Vs. New way� OLD WAY
� Quality belongs to a few� Statistical tools used only when needed� Applied with the help of resident experts� Work alone or with smaller groups� Work alone or with smaller groups
� NEW WAY � Quality is everyone’s business� Statistical techniques applied more often� Everyone learns to apply it on their own� Techniques used are easy to learn and apply� Often work as a team
Next Weeks
� The Design Process
� Principle of robust design in the production processproduction process
� Robust design process
� Parameter design