board design template 2010 - Cavewire · 400 800 R 1200 1600 NIPPER BOARD R 2000

www.woodmac.com
Delivering commercial insight
Perspectives on US Energy Outlook,
Cocktail Party Issues and Impacts on
E&C Players
October 4, 2011

Delivering commercial insight
www.woodmac.com
© Wood Mackenzie 2
2 US Refining and Gasoline Outlook
1 World Oil Outlook
3 US Natural Gas Outlook
4 US NGL Outlook

Delivering commercial insight
www.woodmac.com
© Wood Mackenzie 3
Source: Wood Mackenzie
Canada
US
Mexico
North Sea
Brazil
Russia
Thailand
Argentina
Indonesia
Australia
Ghana
Kazakhstan
Egypt
Yemen
Total Non-OPEC
Supply *
2010: 50.48 m b/d
2020: 56.06 m b/d
+5.58 m b/d
*including unconventionals
and Indonesia
Note: Countries included where change is greater than 100,000 b/d
0.10<0.25
m b/d
0.25<0.50
m b/d
0.50< m
b/d
Unconventionals
Oil supply, outside OPEC increases markedly
China
Oman
Delivering commercial insight
www.woodmac.com
© Wood Mackenzie 4
3.6%3.5%
3.9%4.2%
4.7%
7.0%7.5%
3.4%
2.5%
3.3%3.6% 2.9%
3.2% 3.2% 3.2% 3.0%
0
1
2
3
4
5
6
7
2005 2006 2007 2008 2009 2010 2011 2012 2013 2014 2015 2016 2017 2018 2019 2020
Mil
lio
n b
/d
Source: Wood Mackenzie
% of global oil demand
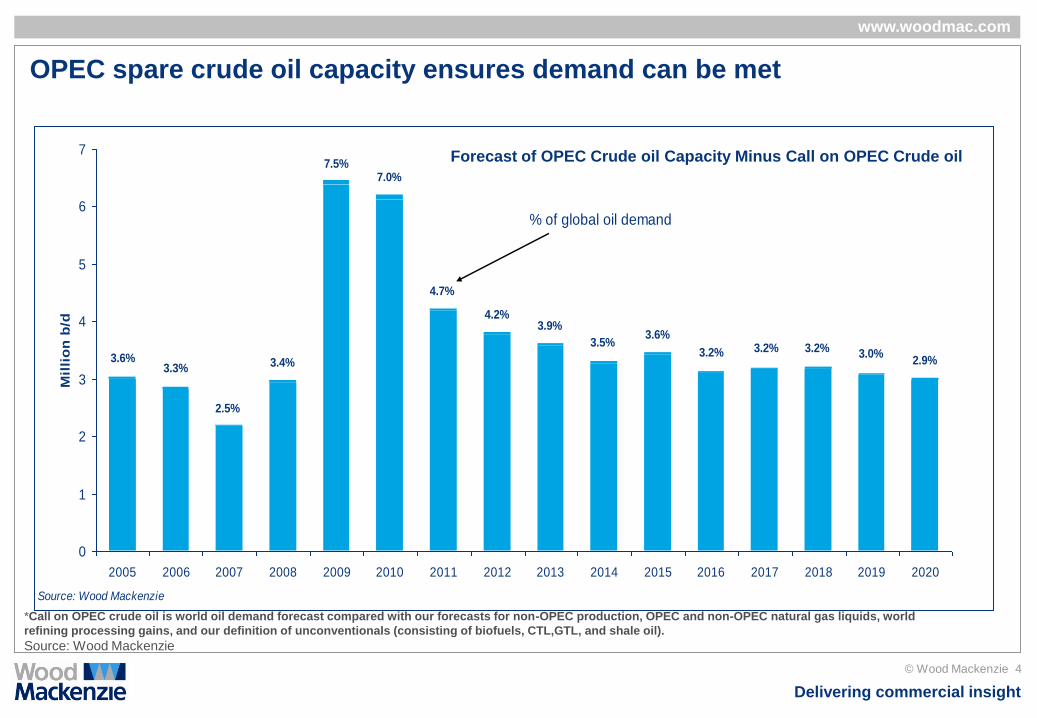
OPEC spare crude oil capacity ensures demand can be met
*Call on OPEC crude oil is world oil demand forecast compared with our forecasts for non-OPEC production, OPEC and non-OPEC natural gas liquids, world
refining processing gains, and our definition of unconventionals (consisting of biofuels, CTL,GTL, and shale oil).
Source: Wood Mackenzie
Forecast of OPEC Crude oil Capacity Minus Call on OPEC Crude oil

Delivering commercial insight
www.woodmac.com
© Wood Mackenzie 5
World oil demand forecast shows strong growth
Source: History-IEA, EIA; Forecast-Wood Mackenzie
Demand by Region Demand by Major Sectors
North America
Europe
Advanced Asia
China
India
Other Asia
Middle East
Latin America
Africa
FSU
0
5
10
15
20
25
30
35
40
45
50
55
60
65
70
75
80
85
90
95
100
105
1980 1990 2000 2010 2020
Millio
n b
/d
-
10
20
30
40
50
60
1980 1985 1990 1995 2000 2005 2010 2015 2020
millio
n b
/d
Transport Petrochemical Feedstock
Industry & Pow er Generation Residential/Commercial
Delivering commercial insight
www.woodmac.com
© Wood Mackenzie 6
0
20
40
60
80
100
120
140
2000 2001 2002 2003 2004 2005 2006 2007 2008 2009 2010 2011 2012 2013 2014 2015 2016 2017 2018 2019 2020
US
$/b
bl
Brent Real Brent NominalSource: History - Thomson Datastream, Forecast - Wood Mackenzie
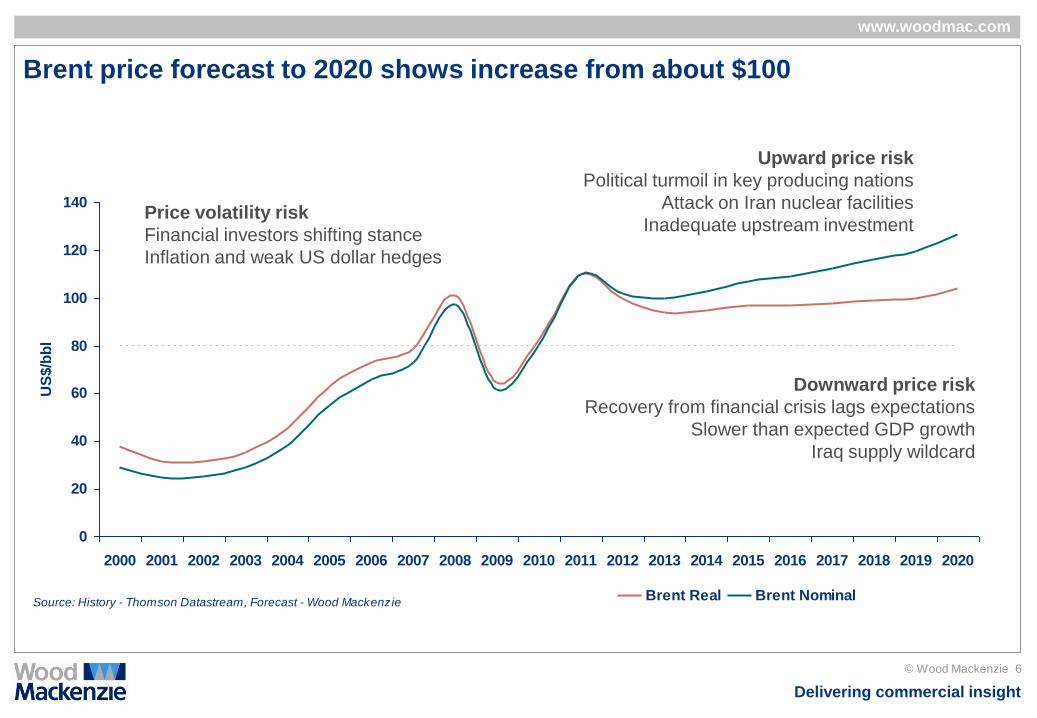
Brent price forecast to 2020 shows increase from about $100
Price volatility risk
Financial investors shifting stance
Inflation and weak US dollar hedges
Upward price risk
Political turmoil in key producing nations
Attack on Iran nuclear facilities
Inadequate upstream investment
Downward price risk
Recovery from financial crisis lags expectations
Slower than expected GDP growth
Iraq supply wildcard

Delivering commercial insight
www.woodmac.com
© Wood Mackenzie 7
COCKTAIL PARTY ISSUE #1: What’s up with WTI?
Cushing constraints dislocate WTI from global oil markets
Brent – WTI spread has multiple drivers
• Rising North America light crude production (WTI ↓)
• US refineries re-positioning (WTI ↓)
• Strong Asian oil demand growth (Brent ↑)
• Libya production off-line (Brent ↑)
Widening spread helps inland refiners
• Buy crude on a WTI basis
• Product import competition (from USGC) indexed off Brent
Brent – WTI Price Spread
-5
0
5
10
15
20
25
Ja
n-0
8
Ap
r-0
8
Ju
l-0
8
Oct-
08
Ja
n-0
9
Ap
r-0
9
Ju
l-0
9
Oct-
09
Ja
n-1
0
Ap
r-1
0
Ju
l-1
0
Oct-
10
Ja
n-1
1
Ap
r-1
1
Ju
l-1
1
$/bbl
Source: Platts, Wood Mackenzie
Delivering commercial insight
www.woodmac.com
© Wood Mackenzie 8
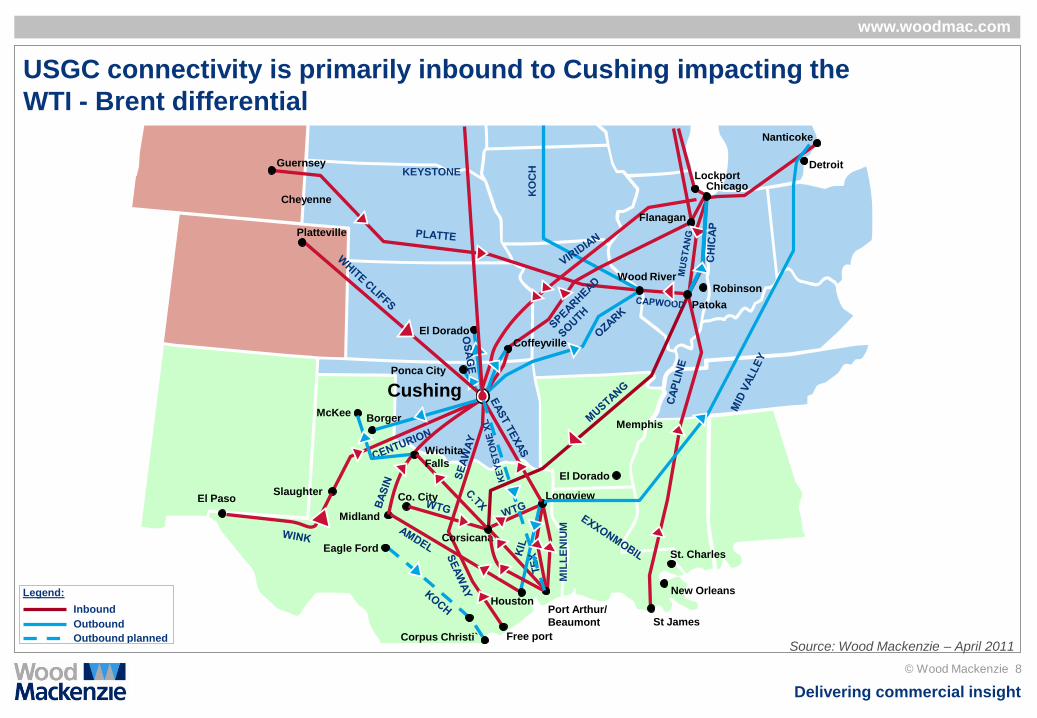
USGC connectivity is primarily inbound to Cushing impacting the
WTI - Brent differential
Cheyenne
El Dorado
Lockport
Guernsey Detroit
Nanticoke
Houston Port Arthur/
Beaumont
Free port
El Paso Slaughter
Midland
McKee
Ponca City
Chicago
Memphis
Wood River
KO
CH
MIL
LE
NIU
M
Coffeyville
Longview
Robinson
Cushing
Corpus Christi`
Co. City
Platteville
Borger
Wichita
Falls
Corsicana
New Orleans
St James
Patoka
St. Charles Eagle Ford
Flanagan
El Dorado
KEYSTONE
Legend:
Inbound
Outbound
Outbound planned Source: Wood Mackenzie – April 2011

Delivering commercial insight
www.woodmac.com
© Wood Mackenzie 9
Cushing storage utilizations influence the price dynamics of Brent –
WTI differentials
0
10,000
20,000
30,000
40,000
50,000
60,000
70,000
Jan
-04
Ju
l-04
Jan
-05
Ju
l-05
Jan
-06
Ju
l-06
Jan
-07
Ju
l-07
Jan
-08
Ju
l-08
Jan
-09
Ju
l-09
Jan
-10
Ju
l-10
Jan
-11
1000' bbls
0%
20%
40%
60%
80%
100%
(Utiliz. %)
Capacity Stock Utilization
Cushing – Stock & Shell Capacity (2004-2010)
-5
-4
-3
-2
-1
0
1
2
3
4
5
Jan
-04
Ju
l-04
Jan
-05
Ju
l-05
Jan
-06
Ju
l-06
Jan
-07
Ju
l-07
Jan
-08
Ju
l-08
Jan
-09
Ju
l-09
Jan
-10
Ju
l-10
Jan
-11
WTI $/bbl
0%
20%
40%
60%
80%
100%
(Utiliz. %)
Brent-WTI Utilization
Recent differentials suggest other factors
are governing the dynamics of WTI
Brent – WTI diff vs. Storage utilization (2004-2010)

Delivering commercial insight
www.woodmac.com
© Wood Mackenzie 10
2 US Refining and Gasoline Outlook
1 World Oil Outlook
3 US Natural Gas Outlook
4 US NGL Outlook

Delivering commercial insight
www.woodmac.com
© Wood Mackenzie 11
Global capacity additions are concentrated in emerging Asia and the Middle
East, with closures in the developed world
Source: Wood Mackenzie Product Markets Service
-400
-350
-300
-250
-200
-150
-100
-50
0
2009 2010 2011 2012 2013 2014 2015
Greater Europe N. America Asia Pacific
kb/d
-1,000
0
1,000
2,000
3,000
4,000
5,000
6,000
Asia
Pacif ic
Middle
East
North
America
Latin
America
Greater
Europe
FSU Sub-
Saharan
Africa
Additi
onal C
DU
Capacity
, kbd .
by end 2010 2011-17
Refinery Capacity
Additions Refinery Closures and Capacity
Reductions

Delivering commercial insight
www.woodmac.com
© Wood Mackenzie 12
0
2
4
6
8
10
12
2011 2012 2013 2014 2015 2016 2017
Cu
mu
lati
ve
ch
an
ge
, M
bd
Non-refinery supply
Refinery expansions
New refineries
Demand
On a cumulative basis demand just outpaces capacity growth
Excludes capacity creep and utilisation rate changes
Global Demand and Capacity to Supply
Source: Wood Mackenzie Product Markets Service

Delivering commercial insight
www.woodmac.com
© Wood Mackenzie 13
North American Oil Product Demand shows decreased Gasoline
and Naphtha Demand
Million barrels per day 2005 2010 2011 2015 2020 2025 2030
United States
LPG (excl C2) 1.37 1.26 1.25 1.21 1.16 1.16 1.15
Naphtha 0.40 0.27 0.26 0.22 0.19 0.19 0.18
Gasoline 9.16 9.03 9.03 9.11 8.79 8.27 7.75
Jet/Other Kero 1.75 1.44 1.44 1.50 1.56 1.60 1.63
Gas/Diesel Oil 4.12 3.79 3.90 4.16 4.20 4.23 4.22
Fuel Oil 0.92 0.55 0.53 0.39 0.37 0.35 0.33
Other 3.09 2.80 2.92 3.14 3.23 3.23 3.20
US-50 Total 20.80 19.15 19.32 19.73 19.51 19.03 18.46
Sources: EIA & IEA (history), WM (forecast)
Delivering commercial insight
www.woodmac.com
© Wood Mackenzie 14
0
1
2
3
4
5
6
7
8
9
10
20
00
20
05
20
10
20
15
20
20
20
25
$/bbl
0%
10%
20%
30%
40%
50%
60%
70%
80%
90%
100%
Percent
Northwest Europe ($/bbl) Mediterranean ($/bbl) USGC LLS Cracking, $/bbl
Singapore Dubai ($/bbl) Northwest Europe Mediterranean
USGC Singapore
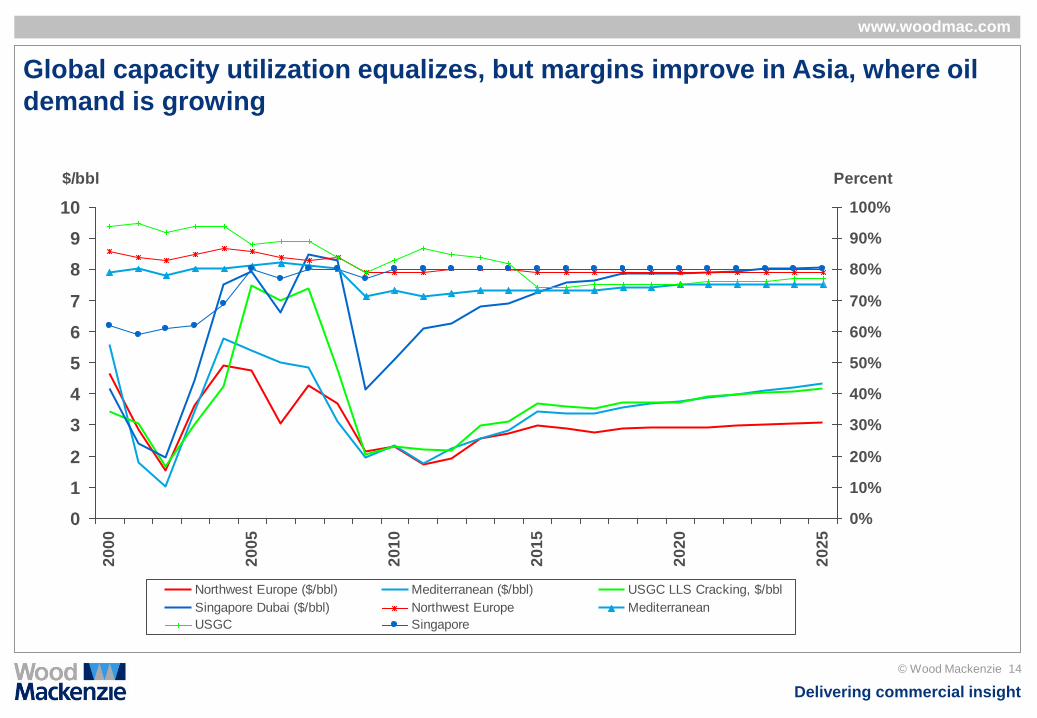
Global capacity utilization equalizes, but margins improve in Asia, where oil
demand is growing

Delivering commercial insight
www.woodmac.com
© Wood Mackenzie 15
CP ISSUE #2: What is happening on USEC refining?
USEC continues to suffer from global competition
Current key trade (kbd)
Gasoline Trade
Source: Wood Mackenzie Analysis
-1500
-1000
-500
0
500
1000
1500
-1500
-1000
-500
0
500
1000
1500
-1500
-1000
-500
0
500
1000
1500
-1500
-1000
-500
0
500
1000
1500
Asia
FSU
2000 2005 2009 2015 2020
New net trade 2015 (kbd)
Europe
North
America
-1500
-1000
-500
0
500
1000
1500
-1500
-1000
-500
0
500
1000
1500
Africa
Gasoline flows from
Europe to North
America are forecast to
continue
Europe continues to
export to Africa and
the Middle East
Growing
surplus of
gasoline in
FSU as
refiners
invest in
improving
octane
levels
-1500
-1000
-500
0
500
1000
1500
Middle
East
Latin America Asian exports to the
Middle East decline

Delivering commercial insight
www.woodmac.com
© Wood Mackenzie 16
Opportunity may be for USEC players to play a larger role in supplying
diesel/gasoil to Europe
Current key trade (kbd)
Diesel/Gasoil Trade
Source: Wood Mackenzie Analysis
-1200
-800
-400
0
400
800
1200
-1200
-800
-400
0
400
800
1200
-1200
-800
-400
0
400
800
1200
-1200
-800
-400
0
400
800
1200
Asia
FSU
2000 2005 2009 2015 2020
New net trade 2015 (kbd)
Europe
-1200
-800
-400
0
400
800
1200
-1200
-800
-400
0
400
800
1200
Middle
East
North
America
US exports of diesel to
Europe should increase
Russia continues
to export
diesel/gasoil to
Europe
Middle East
diesel/gasoil exports to
Asia fall later in the
forecast period
-1200
-800
-400
0
400
800
1200
Africa Latin America
European imports
from Middle East
should increase
US exports of diesel to
Latin America should
decline

Delivering commercial insight
www.woodmac.com
© Wood Mackenzie 17
AsiaAsia
Run cut losers are in the Atlantic Basin
USGC utilisations manage to stay fairly constant
65
70
75
80
85
90%
2006 2007 20082010 2015
USGC Utilisation
65
70
75
80
85
90
%
2006 2007 20082010 2015
65
70
75
80
85
90%
2006 2007 20082010 2015
US East Coast Utilisation
Europe Utilisation
Source: Wood Mackenzie Product Markets Service

Delivering commercial insight
www.woodmac.com
© Wood Mackenzie 18 © Wood Mackenzie 18
CP ISSUE #3: Why are these utilizations so low?
Improved vehicle efficiency is a restraint on gasoline demand
0
10
20
30
40
2000
2005
2010
2015
2020
mile
s p
er
ga
llon
Average Fleet Average Light Vehicles Revised Cafe Standard
Average light vehicle efficiency is below
CAFÉ standards which measure vehicles in optimum
driving conditions not typical driving conditions
Existing vehicle stock means the average fleet
efficiency takes longer to improve
By 2025 CAFÉ standards are
proposed to move towards 54 mpg

Delivering commercial insight
www.woodmac.com
© Wood Mackenzie 19
Compliance with RFS and LCFS regulation substitutes with Ethanol
The Californian LCFS Carbon Intensity Requirements vs
Two Gasoline Ethanol Blends Forecast Compliance With the US RFS
CARBOB + 10%
Brazilian Ethanol CARBOB + 20%
Brazilian Ethanol
CARBOB - California Reformulated Gasoline Blendstock for Oxygenate Blending
80
82
84
86
88
90
92
94
96
98
2011
2012
2013
2014
2015
2016
2017
2018
2019
2020
Carb
on
in
ten
sit
y, g
CO
2e/M
J
0
500
1,000
1,500
2,000
2,500
2006
2007
2008
2009
2010
2011
2012
2013
2014
2015
2016
2017
2018
2019
2020
2021
2022
kb
/d
Ethanol Biodiesel Renewable Fuel Standard
Delivering commercial insight
www.woodmac.com
© Wood Mackenzie 20
2 US Refining and Gasoline Outlook
1 World Oil Outlook
3 US Natural Gas Outlook
4 US NGL Outlook

Delivering commercial insight
www.woodmac.com
© Wood Mackenzie 21
Natural gas supply anticipated to grow (Bcfd, dry)
Supply overall
increases by 27 Bcfd in
the US 2010-2030.
The largest increases
are in the Gulf Coast
and the Northeast.
0
20
40
60
80
100
120
2000 2002 2004 2006 2008 2010 2012 2014 2016 2018 2020 2022 2024 2026 2028 2030
bcfd
Rockies San Juan Gulf Coast Gulf of Mexico MidContinent
Permian Fort Worth Northeast West Coast Alaska
WCSB East Coast Arctic

Delivering commercial insight
www.woodmac.com
© Wood Mackenzie 22
Shale gas reserves are key to growth
Gulf of Mexico
Atl
an
tic O
cean
Pacific
Ocean
Gulf CoastPermian
Rockies
Northeast
UNITED STATES OF AMERICA
CANADA
Almond TGS
Baxter Shale
Mancos TGS
Honaker Trail TGS
Columbia TGS
Wyodak CBM
Big George CBM
Lance Pinedale TGS
Mesaverde CBM
Mesaverde Piceance TGS
Niobrara TGS
Gothic Shale
Fruitland CBM
Vermejo CBM
Pierre Shale
Barnett-Woodford Shale
Mesaverde-San Juan
Granite Wash TGS
AnadarkoWoodfordShale
Cherokee CBM
Arkoma Woodford
Caney Shale
Fayetteville Shale
Barnett Shale
Austin Chalk TGS
Eagle Ford Shale
Wilcox TGS
Lower Vicksburg Shale
LoboWilcoxTGS
New Albany Shale
Marcellus Shale
BereaOriskany
Huron Shale
Chatanooga Shale
Pennsylvanian CBM
Floyd Shale
Selma ChalkCotton ValleyTGS
Haynesville Shale
Deep Bossier Shale
Travis Peak TGS
Horn RiverShale
Montney TGS
Mannville CBM
HorseshoeCanyon CBM
Utica Shale
West Coast
WCSB
Antrim Shale
Hovensweep
Palo Duro Shale
Deep Haley TGS
MEXICO
Mid-ContinentWasatch TGS
0 400 800200
km
Source: Wood Mackenzie
Horn River
Woodford
Fayetteville
Haynesville
Marcellus
Barnett
Monteney
Eagle Ford

Delivering commercial insight
www.woodmac.com
© Wood Mackenzie 23
0
5
10
15
20
25
30
35
40
45
2000 2003 2006 2009 2012 2015 2018 2021 2024 2027 2030
bc
fd
Barnett Fayetteville Woodford
Haynesville Marcellus Eagle Ford
Horn River Montney & Duverney
CP ISSUE #4: Will we be allowed to get to it?
The supply mix depends on shales, and hydraulic fracturing
Close to 50% of supply longer term will be affected by regulations on hydraulic fracturing.
Still, strong growth potential - 28.5 Bcfd in the known shale plays by 2025!

Delivering commercial insight
www.woodmac.com
© Wood Mackenzie 24
Power is still the largest and a growing use of natural gas in the US
Initially, rapid growth, but a longer term slowing
Coal retirements, a
resumption of
economic growth
drive 1.5 Bcfd growth
annually through
2020
Post 2020,
efficiencies and
renewables reduce
growth to < 1 Bcfd
yearly.
US Power Demand for Gas
0
1,000
2,000
3,000
4,000
5,000
6,000
2000 2002 2004 2006 2008 2010 2012 2014 2016 2018 2020 2022 2024 2026 2028 2030
TW
h
0
5
10
15
20
25
30
35
40
bcfd
Nuclear Hydro Coal Gas Renew ables Other Gas demand

Delivering commercial insight
www.woodmac.com
© Wood Mackenzie 25
0
1
2
3
4
5
6
7
8
0 1 2 3 4 5 6 7 8 9 10 11
bcfd
20
10
$/m
mb
tu
2011 2020
Eagle Ford
Marcellus
Fayetteville
BarnettHaynesville
Pinedale
tight gas
Eagle Ford
Marcellus
Barnett
HaynesvillePinedale tight
gas
FayettevilleLower Bossier
tight gasCotton Valley tight
gas
Lower Bossier
tight gas
Cotton Valley
tight gas
New-drill cost curves indicate higher long-term Henry Hub price requirement,
but well below recent years
US new drill gas supply stack*
Source: Wood Mackenzie (North America Gas Service)
*Assumes development breakeven economics (not
including land lease costs) at a 10% real IRR
adjusted to a Henry Hub- equivalent price
Delivering commercial insight
www.woodmac.com
© Wood Mackenzie 26
2 US Refining and Gasoline Outlook
1 World Oil Outlook
3 US Natural Gas Outlook
4 US NGL Outlook

Delivering commercial insight
www.woodmac.com
© Wood Mackenzie 27
Middle East continues to dominate the LPG production – while the US
supply remains steady
0
500
1000
1500
2000
2500
3000
3500
4000
2000 2005 2010 2015 2020
(Th
ou
sa
nd
bb
l/d
)
US FSU Europe Asia Africa Latin America Middle East
Regional NGL Production 2000 -2020

Delivering commercial insight
www.woodmac.com
© Wood Mackenzie 28
Given the infrastructure of regional demand, the USGC is the hub for
Propane and Butane for Chemical use
US North West
Europe Middle East Asia
Ethane Propane Butane Naphtha Gasoil Other

Delivering commercial insight
www.woodmac.com
© Wood Mackenzie 29
LPG petchem demand expected to increase in the Middle East while
other regions’ demand profile remains nearly unchanged
Industry Petchem Feedstock Residential Commercial Agriculture Road Other
0%
10%
20%
30%
40%
50%
60%
70%
80%
90%
100%
2010 2020
US
0%
10%
20%
30%
40%
50%
60%
70%
80%
90%
100%
2010 2020
Europe
0%
10%
20%
30%
40%
50%
60%
70%
80%
90%
100%
2010 2020
Asia
0%
10%
20%
30%
40%
50%
60%
70%
80%
90%
100%
2010 2020
Middle East

Delivering commercial insight
www.woodmac.com
© Wood Mackenzie 30
CP ISSUE #5: Why is everybody’s talking about Ethane?
With all these shales NGL content (“richness”) is a key driver
High oil-gas price differential
has increased the
attractiveness of liquids-rich
shale gas plays…
• Increased focus on “wetter”
shale plays in 2010/11
• Shifting upstream strategies
and capital allocation across
independents
Source: Wood Mackenzie Unconventional Gas Service
0
5
10
15
20
25
30
35
2000 2003 2006 2009 2012 2015 2018 2021 2024 2027 2030
bcfd
Barnett Eagle Ford Montney Marcellus Fayetteville Woodford
Haynesville Horn River
Wet
Lean
US Shale Gas Production by Play

Delivering commercial insight
www.woodmac.com
© Wood Mackenzie 31
North America’s “Liquids Fairway” unveils an “ethane supply” story
Aux
Sable
Liquids
“Fairway
”
Sarnia
Mont
Belvieu
Conway
Source: Wood Mackenzie
0
200
400
600
800
1,000
1,200
1,400
1,600
1,800
2,000
2007
2010
2015
2020
Th
ou
san
d B
bl/
day
Ethane Propane Butane
US NGL Production (2007-2020)
Delivering commercial insight
www.woodmac.com
© Wood Mackenzie 32
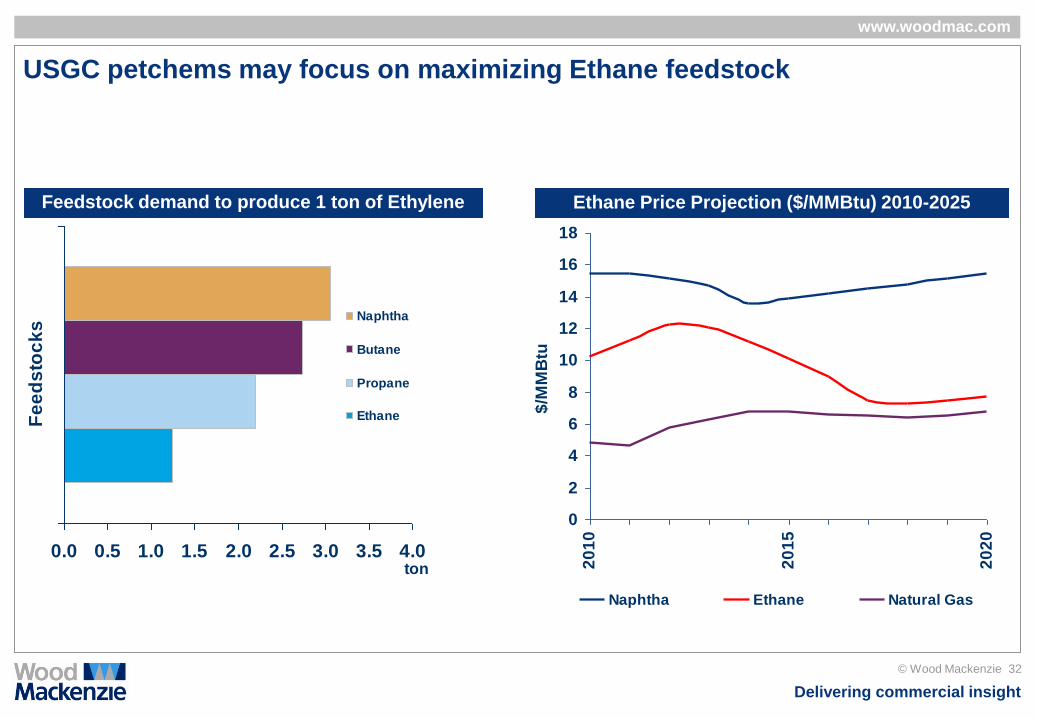
USGC petchems may focus on maximizing Ethane feedstock
0.0 0.5 1.0 1.5 2.0 2.5 3.0 3.5 4.0
Fe
ed
sto
ck
s
ton
Naphtha
Butane
Propane
Ethane
Feedstock demand to produce 1 ton of Ethylene
0
2
4
6
8
10
12
14
16
18
20
10
20
15
20
20
$/M
MB
tu
Naphtha Ethane Natural Gas
Ethane Price Projection ($/MMBtu) 2010-2025

Delivering commercial insight
www.woodmac.com
© Wood Mackenzie 33
In summary, how do the broader trends in the energy industry
impact the E&C business?
Oil supply is stable and more
from non-OPEC sources
Gasoline demand declining
• Overall demand
• CAFÉ
• RFS/LCFS
Natural gas volumes increased
with (wet) shale plays
NGL supply stable, but ethane
will grow significantly
E&C Impact Macro-Fundamentals
Mega projects in the upstream
remain in the mix (Brazil
deepwater and Canada)
Infrastructure plays become the
more important in future
Refining projects to be smaller
more geared to regulatory
compliance vs. profitability
Gas fired power plants win the
day
Ethylene units may already have
too many announced
Delivering commercial insight
www.woodmac.com
© Wood Mackenzie 34
THANKS
Any Questions?

Delivering commercial insight
www.woodmac.com
© Wood Mackenzie 35
Wood Mackenzie
Kintore House
74-77 Queen Street
Edinburgh EH2 4NS
Global Contact Details
Europe +44 (0)131 243 4400
Americas +1 713 470 1600
Asia Pacific +65 6518 0800
Email [email protected]
Global Offices
Australia - Canada - China - Japan - Malaysia - Russia - Singapore - South Africa - United Arab Emirates - United Kingdom - United States
Wood Mackenzie has been providing its unique range of research products and consulting services to the Energy industry
for over 30 years. Wood Mackenzie provides forward-looking commercial insight that enables clients to make better
business decisions. For more information visit: www.woodmac.com