PERSPECTIVES AND COOPERATIVE BANKS
118
FINANCIAL INCLUSION IN SPAIN: A COMPARATIVE STUDY AMONG BANKS, SAVINGS BANKS AND COOPERATIVE BANKS PERSPECTIVES 65 October 2012
Transcript of PERSPECTIVES AND COOPERATIVE BANKS

FINANCIAL INCLUSION IN SPAIN:A COMPARATIVE STUDYAMONG BANKS, SAVINGS BANKSAND COOPERATIVE BANKS
PER
SPEC
TIV
ES65October 2012

FINANCIAL INCLUSION IN SPAIN:A COMPARATIVE STUDYAMONG BANKS, SAVINGS BANKSAND COOPERATIVE BANKS
Beatriz Fernández OlitPhD Student of the Universidad Nacional de Educación a [email protected]

The views expressed in this Perspectives are the responsibility of theauthor and are not to be regarded as representing the views of ESBGMembers. The findings, interpretations and conclusions expressed in thispaper do not necessarily reflect the views of WSBI (World Savings BanksInstitute) or ESBG (European Savings Banks Group). Neither WSBI norESBG guarantee the accuracy of the data included in this work. The materialin this publication is copyrighted.
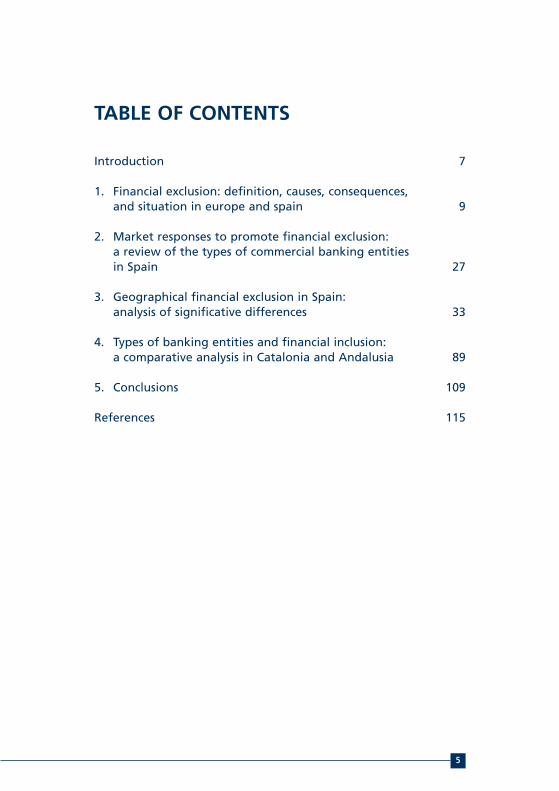
TABLE OF CONTENTS
Introduction 7
1. Financial exclusion: definition, causes, consequences,and situation in europe and spain 9
2. Market responses to promote financial exclusion:a review of the types of commercial banking entitiesin Spain 27
3. Geographical financial exclusion in Spain:analysis of significative differences 33
4. Types of banking entities and financial inclusion:a comparative analysis in Catalonia and Andalusia 89
5. Conclusions 109
References 115
5

6
7
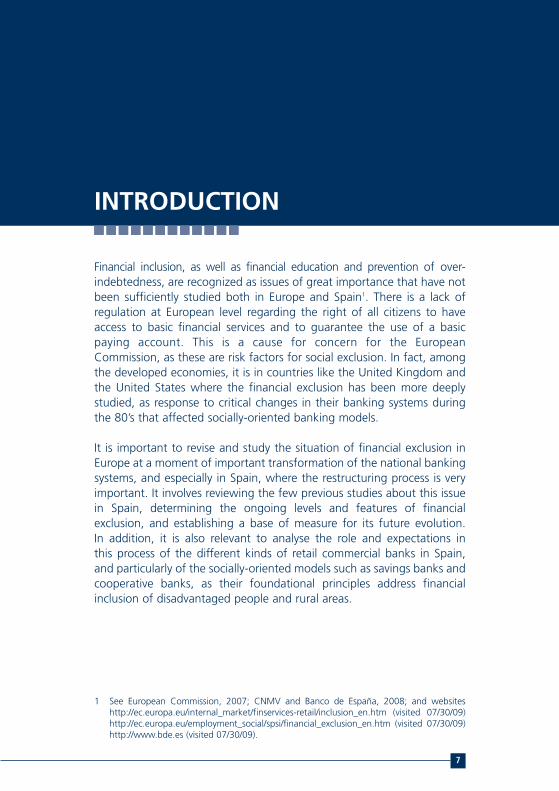
Financial inclusion, as well as financial education and prevention of over-indebtedness, are recognized as issues of great importance that have notbeen sufficiently studied both in Europe and Spain1. There is a lack ofregulation at European level regarding the right of all citizens to haveaccess to basic financial services and to guarantee the use of a basicpaying account. This is a cause for concern for the EuropeanCommission, as these are risk factors for social exclusion. In fact, amongthe developed economies, it is in countries like the United Kingdom andthe United States where the financial exclusion has been more deeplystudied, as response to critical changes in their banking systems duringthe 80’s that affected socially-oriented banking models.
It is important to revise and study the situation of financial exclusion inEurope at a moment of important transformation of the national bankingsystems, and especially in Spain, where the restructuring process is veryimportant. It involves reviewing the few previous studies about this issuein Spain, determining the ongoing levels and features of financialexclusion, and establishing a base of measure for its future evolution.In addition, it is also relevant to analyse the role and expectations inthis process of the different kinds of retail commercial banks in Spain,and particularly of the socially-oriented models such as savings banks andcooperative banks, as their foundational principles address financialinclusion of disadvantaged people and rural areas.
INTRODUCTION
1 See European Commission, 2007; CNMV and Banco de España, 2008; and websiteshttp://ec.europa.eu/internal_market/finservices-retail/inclusion_en.htm (visited 07/30/09)http://ec.europa.eu/employment_social/spsi/financial_exclusion_en.htm (visited 07/30/09)http://www.bde.es (visited 07/30/09).

8
2 Inspired in Sinclair, 2001.
9
1.1. Definition of financial exclusion and related issues
The concept of ‘financial exclusion’ can be understood in different ways,depending on the level of access to financial services being analysed,and the kind of those financial services (transactions, credit, savings, etc.).But financial exclusion is usually related to social exclusion, and thisexplains the focus on basic financial services. To clarify better this concept,several definitions are being revised:
n Gardener et al (2005) propose two different definitions of financialexclusion. A broad definition2, describes it as ‘the inability of access tobasic financial services in an appropriate way. It emerges as a result ofproblems regarding access, conditions, prices, marketing and saleschannels, or by self-exclusion as response to several negative experiencesor feelings’. This first definition gathers supply-side (characteristics offinancial product) and demand-side (needs and previous experience ofuser) grounds for financial exclusion. A more direct definition describesthe financial exclusion as ‘the inability (sometimes induced) that somesocial groups face to access to the financial system’. This seconddefinition makes reference to the most vulnerable groups of society,this means mainly to lowest income groups; and it relates financialexclusion directly, as a booster, to other kinds of social exclusion.
n Carbó and López del Paso (2005) define financial exclusion as ‘thesituation that some disadvantaged individuals or groups face asconsequence of their geographical location, their economic or socialcondition, and their inability or difficulty to acquire or contract financialproducts and services, including difficulties to access to the differentfinancial intermediaries and markets’.
1. FINANCIAL EXCLUSION:DEFINITION, CAUSES,CONSEQUENCES,AND SITUATIONIN EUROPE AND SPAIN

3 Gardener et al, 2005; Carbó and López del Paso, 2005; European Commission, 2008.
10
This definition revises the main determinants of financial excludedpopulation: geographical location makes reference to rural population,sometimes living far from a bank branch, and also to population livingin socially excluded urban neighbourhoods; economic condition refersto families of lower incomes; and social condition refers to ethnicminorities or migrants, for example.
n The European Commission (2008) proposes the following definition:‘Financial exclusion refers to a process whereby people encounterdifficulties accessing and/or using financial services and products in themainstream market that are appropriate to their needs and enablethem to lead a normal social life in the society to which they belong’.This definition includes two additional factors: the reference tomainstream markets, this is, to normalized financial services notincluding specific social products, such as microcredit, or informal lendersas usurers; and the assumption that mainstream financial services arenecessary to be completely integrated in the society, at least in Europe.It refers then, to basic financial services as a bank account to pay watersupply or a flat rent by standing order. The discussion about whatshould be understood as ‘normal’ in a certain society will dependfinally on the country we consider, even inside Europe.
1.1.1. Financial exclusion and social exclusion
Financial exclusion can be basically defined as ‘the difficulty of access tobasic financial services, experimented by certain social groups’. The previousreview of other definitions has shown that it is a concept strongly relatedto social exclusion3. There are bidirectional flows of influence betweenthese two concepts, but clearer effect is made in the sense that financialexclusion may accelerate the social exclusion process: in our currentsocieties, the access to a basic financial service such as a paymentsaccount determines the social normalization of people, as it may beessential, for example, to have access to water or electricity supply. That iswhy, apart from credit or savings exclusion, the lack of access totransaction services is the most important factor to hinder the socialnormalization of a person.

4 Delgado and Rodríguez, 2006.5 EU10: Cyprus, Czech Republic, Estonia, Hungary, Latvia, Lithuania, Malta, Poland, Slovenia
and Slovakia. 6 EU15: Germany, Austria, Belgium, Denmark, Finland, France, Greece, Holland, Ireland,
Italy, Luxembourg, Portugal, Spain, Sweden and the United Kingdom. 7 Gardener et al, 2005.
11
We can identify several groups that face a special risk in terms of financialexclusion, classified by their socioeconomic features4:
n By their working situation: unemployed and households wherenobody has a job;
n By age: elder retired people, and young people under 25 years old; n By physical or psychical condition: people with chronic disease or with
disabilities; n By origin or ethnic group: recent migrants and ethnic minorities; n By personal status: mono-parental families, housewives; n By educational level: people with low educational level; n By economic and financial background: families with low incomes,
families receiving social aid and allowance, over-indebtedness people,families with non-payment records; people ‘used to cash’.
n By geographical area: population of depressed or rural areas.
Nevertheless, risk groups may be different, depending on the nationalcontext: in the EU105 rural population and people over 65 years old sufferhigh rates of financial exclusion. In the EU156 countries, these are not riskfactors, however being under 25 years old is.
1.1.2. Causes of financial exclusion
Most of the authors coincide regarding the origins or causes of financialexclusion, and classify them as coming from the supply side(inappropriate features of services and products), or as coming from thedemand side (depending on the needs or previous experience of users).They comprise the following7:
n Exclusion from the access to financial services of several groups thatdo not fit in a certain profit-risk profile.
n Exclusion via prices, as they are too high for some people or groups. n Commercial exclusion, as strategies and channels of commercialization
of financial services are not adequate for certain people (ex: on-linebanking for elderly people).

12
n Exclusion via conditions, as these are inappropriate or difficult tounderstand by certain people or groups.
n Self-exclusion, when a person refuses to use financial services due tolack of self-confidence to use them, lack of trust on the bankingsystem, or ethic or religious reasons.
Some examples regarding causes of financial exclusion are shown intable 1.1
The mere possibility of access to financial services is not enough tovalue the situation of financial inclusion of a person. The ability of certaingroups and individuals to understand and use financial services shouldalso be considered.
Table 1.1. Causes and examples of financial exclusion
ORIGIN CAUSE EXAMPLE
Supply side - Exclusion from the access Systems of credit risk rating that to financial services penalize automatically the inhabitants
of certain villages or neighbourhoods,using zip codes as a filter.
- Exclusion via prices High commission costs applied to currentor transaction accounts, higher whenaverage balance are lower.
- Commercial exclusion Marketing and sales, including productswith lower costs, via the Internet, notsuitable for people not used to newTechnologies or with not access to them.
Demand side - Exclusion via conditions The language used to define conditionsfor products and services is too technicaland it is not understandable by peoplewith lower educational levels.
- Self-exclusion Muslims that refuse the services ofmainstream Banks due to the use ofinterest rates/Migrants with negativebanking experiences in their originalcountries (very common in Latin-Americanpopulation).
Source: Own elaboration based on Gardener et al (2005).

8 European Commission, 2008.
13
It implies necessarily the assessment of their level of financial culture andtheir effective ability to use fluently the mainstream products andservices. In many cases, this will be linked to social factors: illiteracy, notspeaking or not having a good understanding of the local language,disability, etc.
1.1.3. Typologies and consequences of financial exclusion
There are three main types of financial exclusion:
(i) Exclusion based on transaction services: This is the most common threshold to decide if a person is facingfinancial exclusion or not. It is measured as the possibility of access toa basic bank account with transactions facilities, in order to dopayments or to receive any kind of income or earning. The access tobasic domestic facilities depends on the access to this kind of bankingservices. The use of credit and debit cards can also reduce the levelof vulnerability of a person to losses or thefts: since it reduces thenecessity to use cash.
There are three levels, considering exclusion of transaction services8:‘unbanked’ (people not disposing this kind of services); ‘marginally banked’(people having a bank account with basic transaction facilities, butnot online services or use of cards; and people having access to thiskind of services, but not using them due to lack of self-confidence ortraining); and ‘completely banked’ (people accessing to a wide rangeof transactions and payment services addressing their needs).
(ii) Exclusion based in credit: This is the secondly most analysed typology of financial exclusion, andit is narrowly related to the analysis criteria that banking entities use todecide if a person is able to comply with the refund duties of a credit.This risk rating, that comprises wealth and guarantees evaluation, isnot a factor of exclusion itself. But it is when some subjective orgeneric filters are used regarding certain social groups, obviating theindividual analysis: for example, when the assignment of higher ratesof credit risk to migrant people, ethnic minorities, or people living inspecific neighbourhoods, leads the bank to refuse the individual studyof credit risk profile, or to increase the credit conditions.

9 European Commission, 2008 10 Banco de España (National Bank of Spain) 2009: Annual Report, 2008, pp. 48.11 European Commission, 2008.
14
As not all kinds of credit services are related to basic needs, creditexclusion is defined as9:
• The lack of access to credit that can stigmatize a person, blockingits access to essential goods and services. It reduces the self-confidence and not allows reaching a minimum standard of life,coming close to the social exclusion.
• The lack of access to credit that leads to a higher budgetaryunbalance in the medium or long time, or even to over-indebtnessdue to use of other non formal lending sources.
Credit barriers depend strongly on the economic circumstances of asociety or country at a given time. In fact, this has been a phenomenonbroadly studied in under-developed economies, and microcredit hasemerged as an inclusive tool that has helped to ‘democratize’ thelending in the poorest countries. But it is the moment to reflect onthe role that western banking entities played during the last decade,when families (this is the case of many families in Spain) got over-indebted10 in response to the low interest rates. Did they useappropriate risk analysis standards in 2005? Were they the same as thestandards used in the second half of 2007, when credit markets beganto tighten due to the international liquidity crisis? The subprimemortgages in the United States, were they an example of financialinclusion? Or were they a new way to broaden the operative marginof financial entities lending to new segments of clients with unclearguarantees of repayment credit? All those factors compound acomplex system that requires a deeper analysis going beyond from theaims of this paper. But it must be highlighted that an essentialcondition when talking of financial inclusion is that banking servicesmust meet the needs and characteristics of the user. This should beunderstood as well in an ‘excess’ as in a ‘defect’ way. Over-indebtnessand default in credit repayments can build an undesirable ‘financialbackground’ promoting financial exclusion of certain people in abanking environment with open information flows11.

12 European Commission, 2008; Carbó et al, 2005.13 World Bank, 2005.
15
(iii)Exclusion based in savings:Lack of savings is commonly defined as a consequence of socialproblems, and not so often as a consequence of banking barrier.Causes of lack of savings are12: low or inexistent incomes, having thehabit of managing funds in cash, distrust of banking entities dueto prejudice or previous negative experiences, and high costs ofbanking services.
The relationship between lack of savings and the increase of socialexclusion is not often analysed. But future expectations regardingsocial public welfare in the European countries attracts attention tothe increasing importance of private retirement savings in the future.This means that in the next decades, savings placed in complementarypension funds may suppose the avoiding of situations of poverty andsocial exclusion among elderly population.
Financial exclusion from the mainstream retail banking sector canbring to several situations13: the excluded person turns to socialbanking resources (microcredit, etc.); the excluded person turns toinformal sector, especially when searching for credit (usurers, family);or the excluded person is left to a complete lost of financial support.Usually, in the European case, none of these situations solves theproblem of meeting transaction needs, and this fact increases the riskof social exclusion.
1.2. Financial exclusion in Europe and in Spain
1.2.1. The studies about Europe
Financial exclusion has been studied in Europe by different authors.One of the most important references of financial exclusion, socialexclusion and their relationship is the Rowntree Report (1999), whichanalysed and assessed the situation in the United Kingdom: a 7% ofBritish families were financially excluded at that time, and expectationsfor ten years later supposed an increase of this ratio up to 20%.

16
14 Gardener et al, 2005.15 Cit in Gardener et al, 2005, pp.14. 16 Those incorporated to the European Union until 1995. 17 Delgado y Rodríguez, 2006.
The rise of poverty in the United Kingdom has been highlighted as oneof the boosters of financial exclusion14, linked to an increase of inequityin the incomes redistribution, and to the falling of the real income ofpoorest sectors of British society during the decades of the 80’s and 90’s,while the average income of the country kept growing. In addition,there are other factors involved, as the value maximization, a systemused by financial entities to assess clients in base to their possibility ofgenerating a minimum profit margin in the use of financial services. It isused as a threshold to accept or not a certain group or individual asclients. Following Boyce (2000)15, the profit-risk assessment of clients inthe banking industry has become a system to increase the turnover andwealth of shareholders, at the expenses of poorest and underprivilegedpeople. Regarding excluded population, some groups have beenidentified as those with a higher risk (unemployed people, pensioners,certain ethnic groups – Pakistani and Bengali origin – single-parentfamilies, etc.). And it has been demonstrated that financial inclusiontends to be geographically concentrated: a 50% of financially excludedBritish population live in the 50 less privileged districts.
There are comparative studies regarding the financial exclusion levels ofthe European Union. It is appropriate to analyse separately the countriesbelonging to the EU1516 and the countries associated later (in 2004:EU25; in 2007: EU27). Most of the countries incorporated in 2004 andafter are ex-socialist countries, which have a very different financialtradition and less banking maturity in comparison with ‘western’countries. The recent integration processes in the EU of the easterncountries have involved a pronounced process of financial liberalisation17.Delgado and Rodríguez (2006) have studied, based on data provided bythe World Bank, the levels of credit given to the private sector in relationto the GDP for the countries belonging to the EU15 and EU25. It hasbeen understood as a relative indicator of the level of development of thefinancial system in every country. As conclusion, the countries integratedinto the European Union in 2004 (as Poland, Hungary, Estonia, etc.) showa lower grade of sophistication of their financial systems, but also lessinclination to indebtedness.

18 Delgado and Rodríguez, 2006.19 Delgado and Rodríguez, 2006; Carbó and López del Paso, 2005.20 European Commission, 2008; Carbó and López del Paso, 2005.21 Carbó and López del Paso, 200522 Based in data of Eurobarometer 60.2 (end 2003) and Eurobarometer 2003.5, and revised
with the most recently available information.23 Countries integrated into the EU in 2004.
17
In the field of financial exclusion, those same authors analyse the levelof banking coverage in every country, assuming as a premise that inEurope branches are the main physical channel to supply bankingservices. Spain is the country with the highest coverage of branches per100,000 inhabitants (95.8), followed at a long distance by Austria (53.4).Countries belonging to the EU10 have the lowest rates, such as Slovenia(2.2) or Lithuania (3.4)18. It has been estimated that 10% of the Europeanpopulation does not have even a transactions account, includingthe EU15, and in countries near the Spanish context, such as Italy,Greece, Portugal or Ireland, these rates range between 15% and 20%19.The countries with better rates are Denmark (0.9%), Holland (1.1%) andSweden (2%). The savings banks industry stands out as being the mostimportant agent in the reduction of this rate. The countries wherethis model is strongly established have lower rates of financial exclusion,(e.g. Spain)20.
In Europe, financially excluded population is characterised by some riskfactors as being a woman, being young or old, having a low educationallevel and being long-term unemployed. Regarding the European case, itis again determined that the discrimination that banking entities havemade to give service preferentially to those groups with better profit-riskprofiles, searching for a maximization of benefit, has promoted thefinancial walkout of other groups21. This reinforces the important role ofsocially oriented banking entities stemming the rise of financial exclusion.
Finally, the most recent study developed at the European level has beenpublished by the European Commission (2008)22 and also divides theanalysis into EU15 and EU1023 groups. Spain is considered in the firstgroup, which have more developed banking systems. The average levelsof lack of use of financial products for both groups of countries areshown by the table 1.2 on the next page.

18
Table 1.2. Percentage of European population not using basicfinancial products
Source: Own elaboration based on data from European Commission (2008): Financial Services
Provision and Prevention of Financial Exclusion.
In the case of the EU15 group of countries, the general levels of financialexclusion have been estimated as shown in table 1.3.
Table 1.3. Levels of financial exclusion in the countries belongingto EU15
Source: Own elaboration based on data from European Commission (2008): Financial Services
Provision and Prevention of Financial Exclusion.
Percentage of populationnot using those products
EU15 EU10
Bank account with transaction facilities 18% 53%
Any other kind of bank account 10% 47%
Percentage of population GDP per capita Indexfinancially excluded (%) EU25 average=100
Austria 3 122
Belgium 1 119
Denmark 1 122
Finland 6 115
France 2 111
Germany 3 109
Greece 28 82
Holland 1 120
Ireland 12 139
Italy 16 105
Luxemburg <1 223
Portugal 17 73
Spain 8 98
Sweden 2 116
United Kingdom 6 119

24 Delgado and Rodríguez, 2006. 25 Bernad et al, 2007.
19
The empirical analysis based in the Eurobarometer data confirmed thesocioeconomic characterization defined by the previous studies to pointout the groups with highest risk of financial exclusion in Europe:
n Women, especially housewives or single parents.n Young people (particularly in EU15 countries), and elderly people
(particularly in EU10 countries). n Single parent families and individuals living alone, especially in the
case of young and elderly people. n People with low educational levels, except in the case of young
students, also a risk group. n People living in rural areas (not relevant for EU15 countries) n People with lack of financial culture and perception that ‘banking
products are not made for them’.
It has been proved statistically that unemployment is the mostmeaningful circumstance pushing to be at risk of financial exclusion.Other important factors – but not so consistent regarding statisticalcontrast – are being a migrant or being over-indebted. There are alsoevidences of the geographical concentration of financial exclusion in themost deprived areas.
1.2.2. Public initiatives tackling financial exclusion
It has been highlighted that the processes homogenising pricingconditions and trans-boundary consolidation of financial entities into theEuropean Union, may be boosting difficulties in the access to financialservices in certain countries24. In this sense, keeping the institutional localdiversity regarding banking entities is important in order to promotefinancial inclusion, as it has been demonstrated with the example ofsaving banks and similar entities.
In the Spanish case, it has been also recommended to keep the partly publiccharacter of some financial entities, as the saving banks25. This structureof property has been pointed as one of the reasons to promote financialinclusion by these entities, as it provides them with a social orientation.

26 European Commission, 2008. 27 European Commission, 2008.
20
These socially oriented financial entities have often also supported publicinitiatives regarding the financial inclusion of communities with fewerresources. An example of it would be the agreement of post bankingoffices with the public authorities to provide banking services to the ruralpopulation in the United Kingdom.
There are several recommendations for the public sector to promotefinancial inclusion26:
(i) To promote the public debate, and also the public and privateresearch, homogenising analysis criteria and indicators at theEuropean level.
(ii) To promote from public authorities, the removal of barriers of accessto the financial services: assuring the consumers protection and trustin the banking entities, including in their financial strength;guaranteeing transparency and competitiveness among financialentities; tackling the over-indebtness of families; and promoting thefinancial education. In this sense, the development of regulation toguarantee a minimum of banking services to all citizens can also beconsidered.
(iii) To encourage the policies and practices of corporate socialresponsibility of banking entities, including initiatives of self-regulation into the sector related to financial exclusion. To control andsupervise, as well, the transparency of the information made publicby the banking sector about this matter, establishing objectiveindicators to assess practices in the filed of financial inclusion.
In fact, there already are in Europe some examples of public regulation toguarantee the financial inclusion of citizens, assuring the right to open anaccount available for banking transactions27.
n In Norway this right is enjoyed by every person owning anidentification number issued by the government.
n In France, the banks are required to offer alternative paying means tothose people with a risk profile not adequate to access to debit/creditcards or chequebook. In addition, the postal bank guaranties theopening of a banking account with no costs, to everybody that hadbeen previously refused as client by three other banks.

n In Belgium, every banking entity offering current accounts are requiredto offer access to basic transaction services to any citizen, when theyare not used for professional use.
Regarding self-regulation by the banking sector, the British BankersAssociation requires the disclosure by their associates of informationabout the supply of services to the most vulnerable social groups, andabout the amount of credit given to low income people and other sociallyexcluded groups28.
Additionally, the National Strategy Reports on Social Protection and SocialInclusion of every member state of the EU29, are reviewed biannually anddeal with financial inclusion issues, including prevention and correction ofover-indebtness. These are recognized as matters of concern in terms ofsocial policies. The Spanish report30 does not study in depth the issue offinancial inclusion, apart from the mention to the need of establishingstructures of access to microcredit as tool for self-employment, and somebroad aspects regarding the financial sustainability of pension funds system.
1.2.3. Financial exclusion in Spain
The few studies about the Spanish situation point at a medium-low levelof financial exclusion (8%), despite the wide network of bank branches,and coincide in pointing out that the main risk factors are: age under 25;being unemployed or a housewife; being in the lowest half of thepopulation in terms of incomes; and having scarce knowledge aboutbanking and financial markets31.
The analysis of empirical data about ownership of accounts or depositswith transaction facilities, showed in table 1.4 on the next page, allowdrawing similar conclusions: low levels of incomes and wealth are the keyfactors for not having an account, followed by being unemployed orinactive. Age is a minor risk factor, and only affects in the case of youngpeople, because retired people or people over 65, show higher rates ofuse of transaction accounts than the average households32.
21
28 Gardener et al., 200529 The National Strategy Reports 2008-2010 can be found at http://ec.europa.eu/
employment_social/spsi/financial_exclusion_en.htm. No up-to-date Reports have beenfound on date 12/08/2012.
30 National Strategy Report on Social Protection and Social Inclusion 2008-2010 – Spain. 31 European Commission, 2008; Carbó and López del Paso, 2002, Nieri, 2007. 32 Banco de España: Encuesta Financiera de las Familias 2005 (Survey of Household Finances),
2007.

Other studies suggest that the deregulation process of the Spanishbanking system during the last years, and the elimination of barriers,could affect the bank branches network and eliminate the less profitableones, due to the harder requirements of a more competitive market33.Thus, branches located in areas with low incomes or low population level,mainly rural areas, are the most vulnerable to disappear under marketcriteria. In fact, these studies show less availability of banking services intowns with the lowest incomes, and also point that savings banks are themain entities that contribute to guarantee banking activity in such areas.The maximization of the banking coverage by the savings banks sector,in order to promote financial inclusion, is the reason for the expansionprocess in Spain during the last decade, contrary to the European trendof closing bank branches.
However, the effects of the economic and financial crisis of the recentyears become evident in the slowing down of the annual growth of thenumber of bank branches. Between the years 2008 and 2009, thisgrowth rate was almost three times lower than the average annualgrowth during the five previous years (table 1.5). Regarding autonomousregions, there was an annual increase in the number of branches in allregions during the period 2003 and 2008.
22
33 Bernad et al, 2007; Carbó and López del Paso, 2005.
Rate of use of accounts and depositswith transactions facilities
All families 97,8%
Lowest incomes percentile (<20) 94,6% Highest income percentile (>90) 99,4%
Head of family’s age < 45 years 97,4% Head of family’s age > 65 years 98,3%
Working situation: inactive/ 95,9% Working situation: retired 98,6%unemployed, not retired
Net wealth percentile < 25 95,4% Net wealth percentile > 75 99,1%
Table 1.4. Definition of Spanish families owning accounts and depositswith transaction facilities
Source: Own elaboration based on data from Bank of Spain (2007): Encuesta Financiera de las Familias 2005
(Financial Survey of Households, 2005).

However, between 2008 and 2009, the expansion of branches has beenslower in almost all regions, except in the Basque Country and Navarre,and it has been drastically reduced in some regions such as Galicia andthe Canary Islands. Only Catalonia has shown a decrease in the numberof bank branches, but this trend is supposed to go on in the followingyears and in other regions.
23
Averageannual
No. of Bank No. of Bank No. of Bank No. of Bank growthbranches branches branches branches in period
Total per region 2009 2008 2003 2008-2009 2003-2008
Total Andalusia 7,010 6,911 5,612 1.43% 4.63%
Total Aragon 1,796 1,787 1,636 0.50% 1.85%
Total Asturias 966 956 868 1.05% 2.03%
Total Balearic Islands 1,254 1,241 1,080 1.05% 2.98%
Total Canary Islands 1,463 1,440 1,080 1.60% 6.67%
Total Cantabria 503 495 449 1.62% 2.05%
Total Castile and Leon 3,162 3,143 2,827 0.60% 2.24%
Total Castile-La Mancha 2,020 1,978 1,736 2.12% 2.79%
Total Catalonia 8,098 8,103 7,189 -0.06% 2.54%
Total Valencian Community 5,061 4,963 4,058 1.97% 4.46%
Total Extremadura 1,197 1,193 1,142 0.34% 0.89%
Total Galicia 2,512 2,507 2,337 0.20% 1.45%
Total Madrid 6,024 5,886 4,749 2.34% 4.79%
Total Murcia 1,353 1,326 1,081 2.04% 4.53%
Total Navarre 717 706 672 1.56% 1.01%
Total Basque Country 1,988 1,923 1,700 3.38% 2.62%
Total La Rioja 496 484 423 2.48% 2.88%
Total Ceuta 25 25 20 0.00% 5.00%
Total Melilla 21 21 17 0.00% 4.71%
Total Spain 45,666 45,088 38,676 1.28% 3.32%
Table 1.5. Average annual growth of the number of bank branches,by provinces
Source: Own elaboration based on data from La Caixa (2009): Anuario Económico 2009 (Economic Yearbook 2009)

1.2.4. Financial education to avoid financial exclusion
It is also important to highlight that Spanish banking sector has detecteda serious gap of knowledge of the Spanish society regarding a financialmarket and financial products growing in complexity. It has been seen asone of the main factors contributing to aggravate the consequences ofthe financial crisis for many families. The improvement of financialeducation levels is now a target for the Spanish banking industry, and itis closely linked to avoiding over-indebtness and financial exclusion offamilies and individuals. Some of the most remarkable initiatives are34:
n Bank of Spain (BE) and the National Commission of the Spanish StockMarket (Comisión Nacional del Mercado de Valores - CNMV): FinancialEducation Plan 2008-2012, published in May 200835. That documentis based on the 2002 and 2005 results of the Financial Survey ofHouseholds (Encuesta Financiera de las Familias) developed by the BE.It highlights that families with a lower level of incomes and those withlower educational level, show the worst over-indebtness ratio,measured in terms of disposable income.
n Spanish Network of Financial Education (Red Española de EducaciónFinanciera)36, created in December 2008 by the Spanish Confederationof Saving Banks (Confederación Española de Cajas de Ahorros - CECA).
1.3. The global financial crisis and its effects in termsof financial exclusion
The financial crisis during the second semester of 2007 in the United Statesrapidly transmitted to the European economies. It has strongly affectedto the growth of the GDP during the last five years. The Spanish economyhas specially suffered from the deceleration of GDP growth, from risesof even 4% in the pre-crisis years, to a rate of growth of 0.7% in 2011and even negative growth between the middle of 2008 and the middleof 201037.
24
34 It is also relevant to highlight that other large Spanish banks have developed their ownfinancial education projects as bancaparatodos.com (BBVA) and finanzasparamortales.com(Cantabria University and Santander Group).
35 See www.bde.es36 See www.rededucacionfinanciera.es/home.htm37 Banco de España, 2012.

The main causes for this situation have been found in the imbalancesgenerated in the Spanish economy between 1999 and 2006, due to anintensive allocation of financial and productive resources in the propertyand building sectors, as well as to an excessive over-indebtness of bothfamilies and, specially, industry. Many banking entities had an excessiverisk exposure due to this fact. The crisis has been very severe in theproperty and building sectors, with very high rates of unemployment,bankruptcy of companies and non-repayment of liabilities and credits,and this has sharply affected the Spanish banking sector, meaning theliquidation, breakdown and disappearance of some entities, mainly savingsbanks. Other entities, again mainly savings banks, have merged followingthe directives of the Spanish central bank regarding recapitalizing offinancial entities to strengthen their balances. Some of them have evenbeen intervened by the central bank. As a consequence, the number ofcredit cooperatives has been reduced from 85 to 76 between the years2007 and 2011, and the number of savings banks has been reduced from46 to 35 during the same period, with the additional circumstance, in thiscase, that many saving banks have transferred their banking activity tonew banks38 created under the national central bank recommendations.
From 2008 there has been also a restriction in the credit flows of bankingmarkets. In the case of Spain, it has lead to a very drastic reduction ofthe credit to families, which fell down from growth rates of 20% duringthe pre-crisis years to an average growth rate of 5% in 2008, and toa decreasing rate of near -3% at the end of 201139. This contraction ofthe volume of credit, linked to the low profitability of the financialintermediation due to the low interest rates generally kept during thecrisis period to control the imbalances of local economies, incite the bankingsector to search for the deals with best profit-risk profiles. In fact, during2010 and 2011, conditions of credit granting have hardened becausethe transfer to clients of the growing difficulties of the banking sectorfunding40.
25
38 These banks have a separated legal structure from their related saving banks, but beingthese their main owners. Formally, these banks are S.A. ‘sociedades anónimas’, a legalfigure similar to PLC (in UK) and to Inc. (in the US).
39 Banco de España (2009 and 2012): Annual reports of 2008 and 2011. 40 Banco de España, 2012.
This contraction of credit has helped to avoid a greater over-indebtnessof Spanish families, but it has not mitigated their previous leverage dueto the lack of growth in terms of income41. Additionally, the continuousrising of unemployment rate in Spain and the expected generation oflarger pockets of poverty and exclusion constitute an environmentpropitious to the increase of financial exclusion.
One of the kinds of financial exclusion potentially affected is thegeographical exclusion due to the reduction of the number of bankbranches, especially in those areas where branches are less profitable.This is the case of socioeconomically most deprived neighbourhoods orvillages, and of areas with low density of population. Paradoxically,the dynamism of the building sector has been also highlighted as anindicator to attract the set up of bank branches in a certain territory42.Thus, regions that are suffering also a greater intensity of the crisis effectsdue to an economy based mainly in this activity can be facing also ahigher risk of being financially left.
26
41 Banco de España, 2012. 42 Carbó and López del Paso, 2002.

43 As an adaptation of the classification proposed by the European Commission, 2008, pp 61.
27
The Spanish banking system is composed of three types of entities (banks,savings banks and cooperative banks), each of them with different originand legal form. Savings banks and cooperative banks were both createdwith the aim of promoting financial inclusion. The main objective ofsavings banks was the provision of financial services to all groups ofpopulation, especially to poor and disadvantaged people, unattended bybanks. Cooperative banks were founded to promote the financialinclusion of rural areas. Therefore, the Spanish banking entities can beclassified into profit oriented entities (banks) and socially-orientedentities (savings banks and cooperative banks), as shown in figure 2.143.
Figure 2.1. Financial services providers in Spain
Source: Own elaboration with data from the European Commission (2008): “Financial services
provision and prevention of financial exclusion”.
2. MARKET RESPONSESTO PROMOTE FINANCIALEXCLUSION: A REVIEW OFTHE TYPES OF COMMERCIALBANKING ENTITIES IN SPAIN
Financial servicesproviders
Commercial
Not for profit
Profit oriented: Banks
Socially oriented:Savings Banks andCooperative Banks
ICO, Bank of Spain

44 Palomo Zurdo, 2004.45 Gardener et al, 2005; Aalbers, 2003. 46 De la Cuesta, M.; Muñoz, M.J.; Fernández, M.A., 2006.47 Muñoz et al., 2005.
28
Thus, the different main purposes of the Spanish banking entities can becategorized as follows44:
n Banks: Maximization of value for shareholdersn Savings banks: Maximization of value for society through the action in
the community (obra social) n Cooperative banks: Maximization of services to meet the financial
needs of their members.
There are several kinds of responses to the financial exclusion in Europe,among them, the following45:
n Voluntary roles of banks (Spain, France, Germany and Belgium)n Government acting as mediator between banks and excluded people
(United Kingdom, and tentatively France)n Government acting as regulator (France, Portugal and Sweden)
2.1. Corporate Social Responsibility (CSR) applied tothe financial sector
Applying the concept of CSR to the financial system involves theintroduction of social and environmental issues, besides the financialones, in the policies, processes and products developed by the differentinstitutions that compose it46. Transparency is a key factor, not onlyfrom the point of view of the internal management or the governmentof financial institutions, but also in their relationship with all the otherplayers operating in the financial system, including families and individuals.
Several aspects have been defined as relevant in the management ofsocial risks of a banking entity, implementing criteria of corporate socialresponsibility and integrating sustainability in its operations47:
(i) Integration of ethical criteria in the assessment and granting of credits,in the investment policies and in the raising of savings and assets formanagement: e.g. proceedings to avoid the money laundering.
(ii) Decisions of the entity in order to offer services just to clients takingin account the social and environmental impact of their projects:e.g. giving credit only to sustainable projects when financing buildingactivities.
(iii) Respect of the human rights in those underdeveloped countrieswhere the institution is operating, and not contributing to a majorover-indebtness of these countries.
(iv) Engagement with the community in which it operates. This meansgiving facilities for the access to credit and financial services toregions, sectors or groups of population with risk of social andfinancial exclusion (due to geographical, age or technologicalknowledge, for example), and contributing with donations andpatronage activities into the community (community involvement).
Thus, for retail banking entities, assuring the access to basic financialservices of individuals, families and small companies, independently oftheir level of income, wealth or residence place, means internalising CSRcriteria in the business core.
2.2. Financial inclusion: a differentiating element in thecorporate social responsibility of banking entities
The access to credit through the banking system is the main source offinancial resources for families and SMEs48, which are necessary to face upto their investments and needs of consumption. The access to transactionservices is needed to access to some basic facilities and to social integration.Guaranteeing this access to basic financial services is also defined as asocial responsibility in order to keep the dynamism of a local economy,and talking in terms of banking industry, it means the integration of socialresponsibility into its business model.
The analysis of the integration of financial inclusion into the policies ofthe different kind of banking entities in Spain offers the followingprofiles:
n Banks: They are commercial financial services providers, profit-oriented and whose capital belongs to private shareholders. In Spainthere is no duty or regulations that force banks to supply peoplewithout resources or certain geographical areas.
29
48 Small and medium-sized enterprises.

Their strategies for territorial expansion are decided in base to themarket and to profitability criteria. The empirical research has foundevidences of a very low contribution of banks to the financial inclusionin Spain: they do not operate in almost the 50% of the towns withlower income. And a regional analysis of the region of Aragon,determined that the bank sector reduced its number of branchesbetween 1996 and 2004, meanwhile savings banks and cooperativebanks enlarged theirs49.
Regarding CSR policies of Spanish banks, they did not use to considerfinancial inclusion generally into their main objectives, at least duringthe pre-crisis period. An analysis of main Spanish banks CSR policies in2008 finds very few related strategies referring to financial inclusion,and mainly in developing countries (microcredit)50. But the analysis ofCSR policies in 2011 shows a different panorama: most of the CSRreports make mention to financial inclusion in Spain, to financialeducation and to providing of services adapted to people in risk ofsocial exclusion. All of them make reference to the financing of SMEsin an economic juncture of credit restrictions.
n Savings banks: Their origins go back to the 19th century and areprecisely based in motivations of financial inclusion of the broad socialgroups with fewer resources, with an aim of social progress of Spain51.The model was imported from other European countries, replicatingthe most successful experiences.
As not for profit organizations, they have less competitive pressure togenerate profits and give them out to shareholders. In addition, theirfoundational objectives make them to take in account social criteriafor the establishment of new branches. There are several evidences ofthe contribution of Spanish savings banks to financial inclusion: interms of proximity and suitable conditions and prices of bankingservices52; and in terms of facilitating basic transaction accounts andaccess to mortgages to a great part of the Spanish population,providing suitable remittance services to migrants, and developingmicrocredit in Spain53.
30
49 Bernad et al., 2007.50 Analysis based on the 2008 and 2011 CSR reports of Banco Santander, BBVA, Banco
Popular and Banco Sabadell. 51 Quintás, 2004.52 Carbó et al.,2002; Gardener et al.,2005; Riera, 2005. 53 European Commission, 2002 ; Garderner et al., 2005.

Additionally it has been stated that already in 1998, for 13% ofSpanish towns, standing for a 3.5% of total population, saving bankswere the only kind of entity supplying banking services54. A moredetailed study of same authors55 determined that saving banks havefinancially rescued villages of an average population of two thousandpeople, tending to grow and become urban units, and with higherrates of women unemployment regarding national average.
n Cooperative banks: they keep their traditional link to social economy(their market) and to rural areas. Several authors confirm this issue,highlighting their effect in the financial inclusion of people living inrural areas and with very basic needs56. Also it has been empiricallystated that cooperative banks, jointly with savings banks industry,are the main contributors to financial inclusion in Spain, particularly intowns with low income average levels, attended in a 98% exclusivelyby both kind of entities57.
2.3. Banking models and effects of financial crisis
When analysing the effects of the current financial crisis in terms ofreduction of bank branches in Spain, we can see a different evolution forevery kind of banking entities, as shown in table 2.1.
Table 2.1. Annual growth of bank branches by kind of bankingentity. Comparison between 08-09 and 03-08
Source: Own elaboration based on data from La Caixa (2009): Anuario Económico 2009
(Economic Yearbook 2009).
31
54 Carbó et al., 2002.55 Carbó y López del Paso (2002).56 Bernad et al, 2007; European Commission, 2002.57 Bernad et al, 2007.
Savings Cooperative Banks Banks Banks
Average annual growthof branches 03-08 2.09% 4.20% 3.17%
Annual growth of branches 08-09 0.05% 0.32% 0.58%

It can be considered that the year 2008 was the first whole economicperiod lived in Spain into the crisis scenario. That year there was a sharpcontraction of the growth rhythm of setting up of branches for allthe typologies of banking entities, regarding the average annual growthof the previous years. In fact, during the year 2008 there was a low growthof the number of banking branches. Banks have slowed the most therhythm of branches expansion (that during the previous years was alreadythe slowest one), and cooperative banks have experienced a softerdeceleration. Savings banks, that previously had been leaders in terms ofsetting up of branches in Spain, have showed during 2009 a reduction ofthat tendency, with a rhythm of growth of branches ten times lower thatthe annual average of the five previous years. It must be highlightedthat during the second half of 2008 began the merging processes amongsaving banks.
32

58 See Carbó and López del Paso, 2002, and Carbó et al (2002).59 LA CAIXA (2009). Anuario Económico de España, 2009. 60 The analysis developed by Carbó and López del Paso (2002), just analyses the role of
savings banks, as this is the kind of banking entity with a more important effect in termsof financial inclusion of small villages in Spain. The actual work pretends, as well as toverify that this role remains the same and to define the tendency followed during the yearsbetween both analysis (2002-2008), to determine potential differences among the villagesfinancially rescued by every kind of banking entity.
61 The analysis of socioeconomic characteristics of excluded and rescued villages, follows andreviews the methodology proposed by Carbó and López del Paso (2002). It assumes thehypothesis that savings banks are the kind of entities making a larger effort in the financialinclusion of small villages, but enlarges the analysis also to the performance of banks andcooperative banks, to determine if there are socioeconomic differences among the villagesrescued by every kind of entity.
62 Carbó and López del Paso, 2002, and Carbó et al (2002).
33
This chapter contains an empirical analysis regarding the financialexclusion of Spanish villages and it is based on the previous research outputof the Financial System Department of the Foundation for Economicand Social Research of the Spanish Confederation of Savings Banks58.The analysis takes as time reference the year 2008 and uses the statisticaldata provided by the Economic Yearbook 2009 published by La Caixa59.It determines the number and social features of the Spanish villages withpopulation over 1,000 inhabitants, that are financially excluded, what meansthat they do not have any bank branch. At the same time it analyses the‘financial rescue’ of villages by the different types of banks (savings banks,cooperative banks, or banks)60, determining their relative importanceregarding this issue61.
3.1. Territorial financial exclusion, size of villages andrural areas: relation between concepts
Preceding studies62 conclude that saving banks are the banking entitieswith clearer vocation of service to small villages and those contributing ina major way to their financial inclusion.
3. GEOGRAPHICAL FINANCIALEXCLUSION IN SPAIN:ANALYSIS OF SIGNIFICATIVEDIFFERENCES

64 Carbó and López del Paso, 2002. 65 OCDE (2009): “OECD Regional Typology”. Dirección de Gobierno público y Desarrollo
Territorial, 4 de Marzo de 2009.66 These units are called ‘municipios’ in the Spanish case. 67 Exceptionally, for Japan and Korea this limit is 500 inhabitants per square kilometre,
due to their high national densities of population.
34
Geographic and demographic factors, as the density of population, maydefine the provision – or not- of financial services through bank branchin a region. As it is described in chapters 1 and 2, different authors agreethat commercial banks that use productivity criteria to choose whichpotential market to attend, give priority to the best profit-risk profiles63.In terms of geographical expansion of these entities through branches,it means a tendency to set up branches in higher income areas, with highindustrial and commercial activity, and enough population, that is apotential market that can guarantee their productivity’s objectives64.Then, areas that do not fit in this profile – poor neighbourhoods,small villages, rural areas – may face a serious risk of financial exclusion,as they do not seem interesting enough in terms of profit to be attendedby bank branches.
This study defines the geographical or territorial financial exclusion asthe absence of financial services offered by, at least, one bank branch ina village or territory. Physical presence of bank branches is important tosolve problems of financial exclusion based on supply factors (provision ofservices adapted to local population), and on demand factors (financialself-exclusion, low knowledge about products and services, etc.). Staff ofbranches make easier the understanding of financial terms and languageto the potential users, and also can explain how certain financial productsand services work. Personal relationship with the staff of a branch givessome people the necessary trust to use financial services.
It is important also to state if villages of minor size belong necessaryto rural areas, in order to delimit the concept of territorial financialexclusion. The Organisation for Economic Co-operation and Development(OECD) defines both the concepts of urban and rural areas65.Following these definitions, the main factor to define a local area as ruralor urban is its density of population: local units (regional division atthe lowest geographic level66) are classified as rural if their density ofpopulation is lower than 150 inhabitants per square kilometre67. Thus, itmust be considered both the number of inhabitants and also theextension of the territory.
68 For the Spanish case, this regional level is divided in provinces (provincias), andautonomous regions (comunidades autónomas). Autonomous regions are integrated byone or several provinces.
69 BOE (2007): “LEY 45/2007, de 13 de diciembre, para el desarrollo sostenible del mediorural”. Boletín Oficial del Estado.
35
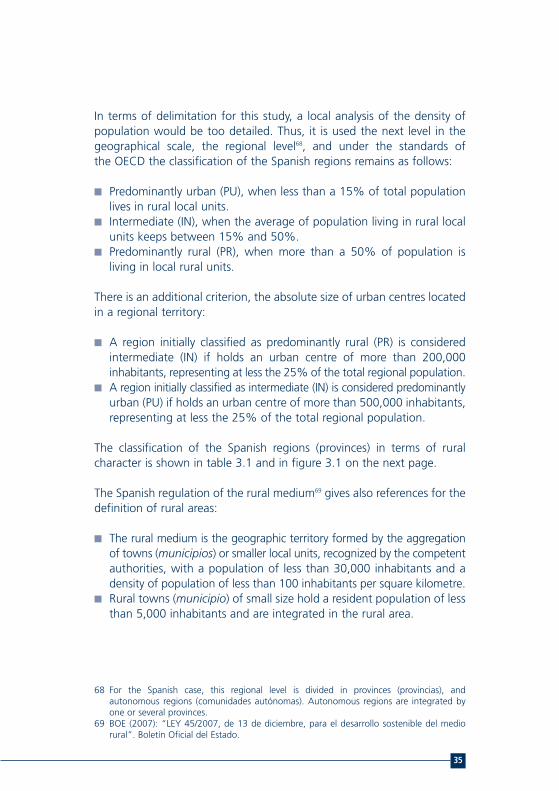
In terms of delimitation for this study, a local analysis of the density ofpopulation would be too detailed. Thus, it is used the next level in thegeographical scale, the regional level68, and under the standards ofthe OECD the classification of the Spanish regions remains as follows:
n Predominantly urban (PU), when less than a 15% of total populationlives in rural local units.
n Intermediate (IN), when the average of population living in rural localunits keeps between 15% and 50%.
n Predominantly rural (PR), when more than a 50% of population isliving in local rural units.
There is an additional criterion, the absolute size of urban centres locatedin a regional territory:
n A region initially classified as predominantly rural (PR) is consideredintermediate (IN) if holds an urban centre of more than 200,000inhabitants, representing at less the 25% of the total regional population.
n A region initially classified as intermediate (IN) is considered predominantlyurban (PU) if holds an urban centre of more than 500,000 inhabitants,representing at less the 25% of the total regional population.
The classification of the Spanish regions (provinces) in terms of ruralcharacter is shown in table 3.1 and in figure 3.1 on the next page.
The Spanish regulation of the rural medium69 gives also references for thedefinition of rural areas:
n The rural medium is the geographic territory formed by the aggregationof towns (municipios) or smaller local units, recognized by the competentauthorities, with a population of less than 30,000 inhabitants and adensity of population of less than 100 inhabitants per square kilometre.
n Rural towns (municipio) of small size hold a resident population of lessthan 5,000 inhabitants and are integrated in the rural area.

Table 3.1. Spanish regions and rural typology
36
Región Rurality Typology
A Coruña 30% IN
Lugo 73% PR
Orense 56% PR
Pontevedra 21% IN
Asturias 26% IN
Cantabria 25% IN
Alava 16% IN
Guipúzcoa 7% PU
Vizcaya 6% PU
Navarra 45% IN
La Rioja 31% IN
Huesca 74% PR
Teruel 100% PR
Zaragoza 26% PU
Madrid 4% PU
Avila 63% PR
Burgos 33% IN
Leon 46% IN
Palencia 51% PR
Salamanca 43% IN
Segovia 61% PR
Soria 100% PR
Valladolid 31% IN
Zamora 59% PR
Albacete 100% PR
Ciudad Real 77% PR
Cuenca 100% PR
Guadalajara 44% IN
Toledo 65% PR
Badajoz 88% PR
Caceres 91% PR
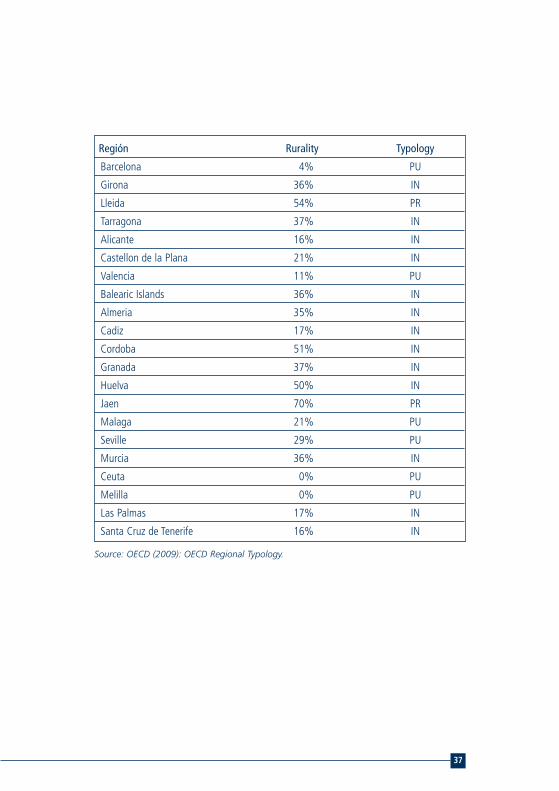
Source: OECD (2009): OECD Regional Typology.
37
Región Rurality Typology
Barcelona 4% PU
Girona 36% IN
Lleida 54% PR
Tarragona 37% IN
Alicante 16% IN
Castellon de la Plana 21% IN
Valencia 11% PU
Balearic Islands 36% IN
Almeria 35% IN
Cadiz 17% IN
Cordoba 51% IN
Granada 37% IN
Huelva 50% IN
Jaen 70% PR
Malaga 21% PU
Seville 29% PU
Murcia 36% IN
Ceuta 0% PU
Melilla 0% PU
Las Palmas 17% IN
Santa Cruz de Tenerife 16% IN

Figure 3.1. Spanish regions and rural typology
Source: OECD (2009): “OECD Regional Typology”.
Thus, the analysis developed in chapters 3 and 4 will be based on thefollowing parameters:
n Towns with less than 1,000 inhabitants are generally considered asrural areas.
n Towns with less than 5,000 inhabitants are considered small villages,but not necessarily rural areas, except those cases which are located inregions classified as PR.
n The chapter 4 focuses on two regions (autonomous communities)with very different socioeconomic features: Andalusia and Catalonia.Both of them have provinces classified as predominantly rural (PR),predominantly urban (PU) and intermediate (IN), this last categorybeing the most common. But following the table 3.2, we find thatthe density of population of Andalusia is quite lower than is the casein Catalonia.
38
n Predominantly ruraln Intermediaten Predominantly urban

Table 3.2. Density of population of Andalusia and Catalonia
Source: Own elaboration based on data from La Caixa (2009): Anuario Económico 2009
(Economic Yearbook 2009).
To assign an average score on the scale of the OECD to everyautonomous community, some estimations have been calculated asshowed in table 3.3 (Estimation of average ‘rurality’ of Andalusia andCatalonia). Their correspondence with the general classification of theOECD is Andalusia being an intermediate region and Catalonia being apredominantly urban region.
Table 3.3. Estimation of average ‘rurality’ of Andalusiaand Catalonia
Source: Own elaboration based on data from La Caixa (2009): Anuario Económico 2009
(Economic Yearbook 2009), and OECD (2009): OECD Regional Typology.
39
Population Extension (km²) Density of population
Andalusia 8,202,220 87,591 93.64
Catalonia 7,364,078 32,091 229.47
Rurality Population Rural population
Almeria 35% 667,635 233,672
Cadiz 17% 1,220,467 207,479
Cordoba 51% 798,822 407,399
Granada 37% 901,220 333,451
Huelva 50% 507,915 253,958
Jaen 70% 667,438 467,207
Malaga 21% 1,563,261 328,285
Seville 29% 1,875,462 543,884
Total 8,202,220 2,775,335
Average rurality Andalusia 33.84%
Barcelona 4% 5,416,447 216,658
Girona 35% 731,864 256,152
Lleida 54% 426,872 230,511
Tarragona 37% 788,895 291,891
Total 7,364,078 995,212
Average rurality Catalonia 13.51%

70 European Commission, 2008.71 European Commission, 2008; Carbó and López del Paso, 2002.
40
3.1.1. Financial exclusion and rural areas
Rural financial exclusion, clearly linked to the concept of territorialfinancial exclusion, is seen as a minor problem for EU-15 countries70.As table 3.4 (Average of European population financially excluded,by geographical areas of residence) shows: In the countries with a lowmedium level of national financial exclusion (between 3% and 8%),the exclusion in rural areas accounts only for 4% on average. This is thegroup to which Spain belongs. However, countries with a high mediumlevel of financial exclusion (between 12% and 28%), such as Ireland,Italy or Greece, rural financial exclusion is estimated to be up to 20%.Looking to the EU-10 countries, financial exclusion rises to 43% in ruralareas – meanwhile in large cities it is 25% – and it constitutes really amatter of concern.
In fact, some authors have highlighted that, in the richer countries,the relationship of financial exclusion with low incomes and deprivedsocial and familiar environments71, raises the discussion about theconcentration of financially excluded population in larger cities, wherewider pounds of poverty are located.
Countries with low-medium level of
EU15 Countries* EU10 Countries** financial exclusion***
Rural area or village 7 43 4
Small or middle sized town 7 30 5
Large town 6 25 5
Table 3.4. Average of European population financially excluded,by geographical areas of residence
* EU15: Germany, Austria, Belgium, Denmark, Finland, France, Greece, the Netherlands, Ireland, Italy, Luxembourg,
Portugal, Spain, Sweden and the United Kingdom.
** EU10: Cyprus, Czech Republic, Estonia, Hungary, Latvia, Lithuania, Malta, Poland, Slovenia and Slovakia.
*** Spain belongs to the group of countries with low-medium level of financial exclusion, as it has been
established by the abovementioned study.
Source: Own elaboration based on data from European Commission (2008): Financial Services Provision and
Prevention of Financial Exclusion.

Nevertheless, there are some important factors related to the financialexclusion that we can easily find as features of Spanish rural areas:
n Low industrial and commercial activity.n Unemployment and low incomes.n High rate of people out of the labour market (housewives, retired
people, etc.).n High rate of elderly population.n Lower level of education, including financial education.n Higher frequency of cash economic transactions. n Increasing immigrant population.
There are also other factors leading to a preferential setting up of bankbranches in urban areas, with detriment to rural ones72:
n Higher financial culture in urban centres, with larger average amounts,diversity and number of transactions per user.
n Lower dispersion levels of resident population in urban centres, whatmeans higher volumes of activity per branch and, subsequently, higherprofit margin.
n Variation of population, increasing in urban centres and descending inmany rural areas.
n Economically deprived regions, with high unemployment levels andlow incomes per capita, profile in which many rural areas in Spain fit.
n Production and commercialization of goods and services, moredynamic in urban than in rural areas.
n Access to the Internet and generally to telecommunications facilities,as mobiles phones, which constitute new channels to provide bankingservices, and whose use is limited among elder population, andsubsequently, among rural population.
Thus, all these factors are analysed in this chapter from a double perspective:the size of population of villages and towns (not determinant, but aninitial indicator of their rural or urban character); and the classification aspredominantly rural (PR), intermediate (IN) or predominantly urban (PU) oftheir region of reference (autonomous community or province). The resultscontained in chapter 4 also gather this double perspective in the rural orurban classification of villages and the consequences in terms of financialservices, for two regions: Andalusia and Catalonia.
41
72 Carbó et al., 2002
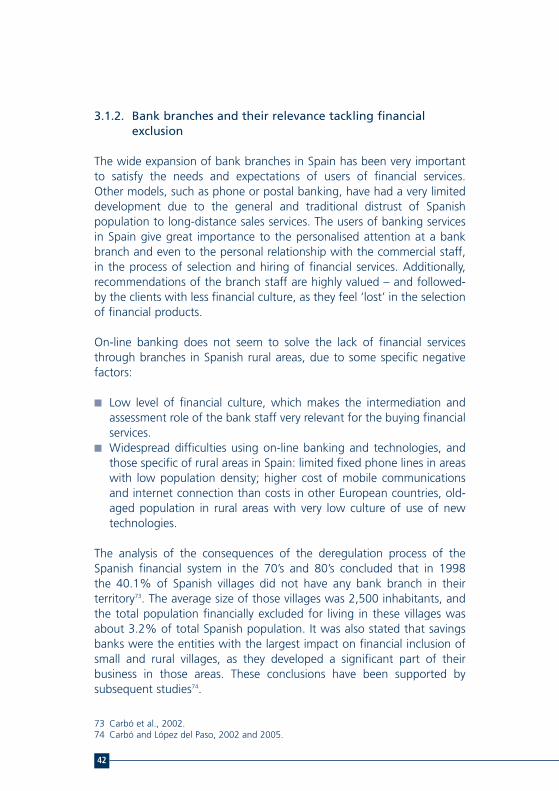
3.1.2. Bank branches and their relevance tackling financialexclusion
The wide expansion of bank branches in Spain has been very importantto satisfy the needs and expectations of users of financial services.Other models, such as phone or postal banking, have had a very limiteddevelopment due to the general and traditional distrust of Spanishpopulation to long-distance sales services. The users of banking servicesin Spain give great importance to the personalised attention at a bankbranch and even to the personal relationship with the commercial staff,in the process of selection and hiring of financial services. Additionally,recommendations of the branch staff are highly valued – and followed-by the clients with less financial culture, as they feel ‘lost’ in the selectionof financial products.
On-line banking does not seem to solve the lack of financial servicesthrough branches in Spanish rural areas, due to some specific negativefactors:
n Low level of financial culture, which makes the intermediation andassessment role of the bank staff very relevant for the buying financialservices.
n Widespread difficulties using on-line banking and technologies, andthose specific of rural areas in Spain: limited fixed phone lines in areaswith low population density; higher cost of mobile communicationsand internet connection than costs in other European countries, old-aged population in rural areas with very low culture of use of newtechnologies.
The analysis of the consequences of the deregulation process of theSpanish financial system in the 70’s and 80’s concluded that in 1998the 40.1% of Spanish villages did not have any bank branch in theirterritory73. The average size of those villages was 2,500 inhabitants, andthe total population financially excluded for living in these villages wasabout 3.2% of total Spanish population. It was also stated that savingsbanks were the entities with the largest impact on financial inclusion ofsmall and rural villages, as they developed a significant part of theirbusiness in those areas. These conclusions have been supported bysubsequent studies74.
42
73 Carbó et al., 2002.74 Carbó and López del Paso, 2002 and 2005.

In the past, the Spanish banking system, and in particular the savingsbanks industry, made great efforts to cover the maximum number ofvillages through bank branches75. Meanwhile, the cooperative bankssector is the one most actively engaged with supplying retail financialservices to rural areas76.
To compensate the lack of bank branches in rural areas, some alternativemeans have been introduced: on-line banking, buses acting as travellingbranches, commercial agents, or periodical visits of staff from the mainbranch to financially unattended villages in the same region. There is notmuch information available about those alternative ways to attend torural population, and for this reason it is difficult to value exactly theirsuccess in terms of geographical financial inclusion. But, consideringthat the Spanish rural population is not given to use distance or on-linebanking and that travelling bank branches offer only a temporary service,it seems important to analyse the magnitude and causes of the lack ofphysical and permanent bank branches in Spanish villages.
The current process of restructuring of the banking sector in Spain,including changes in the savings banks industry, might have seriousconsequences for the financial exclusion level in this country, due toprice-factors and geographical access- factors. The potential rise of therates of exclusion could affect harshly the Spanish rural areas. Therefore,it is important to study the situation of the geographical financialexclusion in the initial phase of this process, and to analyse the role of thedifferent Spanish banking models in approaching exclusion.
3.2. Geographical financial coverage in the differentregions of Spain
The number of bank branches in Spain has risen between 1999 and 2008in a slightly higher rate than the population did, as it is shown in table3.5 on the next page. Therefore, geographical coverage per branch of theSpanish Banking System has not been negatively affected, at least in aquantitative sense, in comparison with previous studies on the rate offinancial exclusion77.
43
75 Delgado and Rodríguez, 2006.76 European Commission, 2008.77 Carbó et al., 2002.

Table 3.5. Increase of bank branches and rise of populationin Spain, 1999-2008
Source: Own elaboration based on data from Banco de España (2009): Boletín Estadístico
2009, and Instituto Nacional de Estadística (National Institute of Statistics).
Bank branches established in small centres of population have to work inless relevant markets in terms of number of potential clients, and thus,they assume a comparative disadvantage of getting the same profitmargin as those branches operating in larger markets. However, thepresence in smaller villages shows that banks make an additional effortto supply their services, taking into account not only the economic profit,but also the social profit stemming from generating financial inclusion.Table 3.6 shows a comparison of the relative effort made by the differentkind of retail banks to include financially small villages in Spain78.
To determine the average number of people attended per bank branch inSpain, the outcomes have also been segmented in two series. The firstone comprises towns with 1,000 inhabitants or more, which represents96.7% of total Spanish population, and the second one, covers townswith less than 1,000 inhabitants, that is 3.3% of total population.
44
78 As it has been stated in Chapter 2, in Spain there are three different models of retailbanking institutions: Banks (whose corporate status is usually a public limited company),savings banks and cooperative banks.
1999 2008 Increase
Bank branches 38,986 45,662 17%
Total population 40,202,160 46,157,822 15%
Banks Savings banks Cooperative banksNo. No. No.
branches % branches % branches %
Towns with 1,000 inhabitants or more 15,457 99.16% 23,729 94.81% 4,485 87.46%
Towns with less than 1,000 inhabitants 131 0.84% 1,298 5.19% 643 12.54%
Table 3.6. Activity rates of the different kind of retail banks in towns aboveand under 1,000 inhabitants
Source: Own elaboration based on data from La Caixa (2009): Anuario Económico 2009 (Economic Yearbook 2009).

These data have also been also disclosed by region, as shown in table 3.779.
45
79 The database used in this analysis, La Caixa: Anuario Económico de España (EconomicYearbook of Spain), 2009, offers only detailed data about the number of banks establishedin every town, when villages have above one thousand inhabitants. The coverage ofsmaller towns by banking services can be analysed using aggregated data by region,provided by the same source.
Towns with 1,000 inhabitants or more
Savings Coop Total No. People/Population Banks Banks Banks branches branch
Total Spain 44,648,478 15,457 23,729 4,485 43,671 1022.38
Andalusía 8,099,599 1,976 3,783 1,108 6,867 1179.50
Aragon 1,169,772 407 716 283 1,406 831.99
Asturias 1,071,046 450 375 127 952 1125.05
Balearic Island 1,069,228 562 655 30 1,247 857.44
Canary Islands 2,075,253 590 725 148 1,463 1418.49
Cantabria 567,259 217 258 19 494 1148.30
Castile-León 2,059,488 914 1,347 331 2,592 794.56
Cast-La Mancha 1,867,646 485 958 328 1,771 1054.57
Catalonia 7,171,750 2,352 5,466 140 7,958 901.20
Valenc. Com, 4,936,275 1,732 2,385 793 4,910 1005.35
Extremadura 1,000,714 396 558 154 1,108 903.17
Galicia 2,771,939 1,237 1,214 46 2,497 1110.11
Madrid 6,251,210 2,625 3,265 119 6,009 1040.31
Murcia 1,424,549 371 711 269 1,351 1054.44
Navarre 564,916 226 258 158 642 879.93
Basque Country 2,111,334 772 817 371 1,960 1077.21
La Rioja 287,663 125 216 57 398 722.77
Ceuta 77,389 9 14 2 25 3095.56
Melilla 71,448 11 8 2 21 3402.29
Table 3.7. Average number of people attended per bank branch,sorted by town’s size and region
Source: Own elaboration based on data from La Caixa (2009): Anuario Económico 2009 (Economic Yearbook 2009).

The average people attended per bank branch in Spain in 2008 was1,010.77. In the case of larger towns (1,000 inhabitants or more)this number rose to 1,022.38, but for smaller villages it decreased to756.56 people per branch. This shows that the average size of thepotential market of a Spanish bank branch is around 1,000 inhabitants.In other words, towns with more than 1,000 people should be interestingenough, in terms of profit, to be established at least one retail bankbranch in them.
46
Towns with less than 1,000 inhabitants
Savings Coop Total No. People/Population Banks Banks Banks branches branch
Total Spain 1,509,344 131 1,298 643 1,995 756.56
Andalusía 102,621 1 102 40 143 717.63
Aragon 157,146 11 203 176 390 402.94
Asturias 9,092 1 5 8 14 649.43
Balearic Island 3,616 2 5 0 7 516.57
Canary Islands 715 0 0 0 0 -
Cantabria 14,879 5 4 0 9 1653.22
Castile-León 497,842 55 375 140 570 873.41
Cast-La Mancha 175,454 6 115 128 249 704.63
Catalonia 192,328 18 122 0 140 1373.77
Valencian Commun. 93,326 2 65 84 151 618.05
Extremadura 97,030 20 66 3 89 1090.22
Galicia 12,230 0 15 0 15 815.33
Madrid 20,428 1 14 0 15 1361.87
Murcia 1,560 0 2 0 2 780.00
Navarre 55,461 4 40 31 75 739.48
Basque Country 45,778 1 27 0 28 1634.93
La Rioja 29,838 0 96 2 98 304.47
Ceuta 0 0 0 0 0 -
Melilla 0 0 0 0 0 -
Table 3.7. Average number of people attended per bank branch,sorted by town’s size and region
Source: Own elaboration based on data from La Caixa (2009): Anuario Económico 2009 (Economic Yearbook 2009).

In absolute terms, the number of savings banks branches doubles thenumber of those belonging to cooperative banks in towns with less than1,000 inhabitants. But cooperative banks make a relatively greater effort,taking into account their total number of branches: The 12.5% of thebranches of cooperative banks are located in the smaller villages, wherethe potential market size per branch is a 25% lower than in larger towns.For savings banks this percentage is 5.2%. Banks prefer targeting thelargest towns, which are believed to have higher profit-margins perbranch, and have just a 0.8% of branches located in the villages under1,000 inhabitants.
With regard to regional results, there is a wide variation in the averagenumber of people attended per branch in towns with at least 1,000inhabitants (1,010.77). Some regions such as the Canary Islands orAndalusia exceed this average, and the North- African cities of Ceutaand Melilla, even triple it. Worst results are found in outlying provinces,which means either that financial entities need there a larger potentialmarket to attend per branch to get the same profit rates as in otherregions, or that banks relegate the setting up of branches in those areasin favour of investing in richer and more developed provinces.
In the case of towns with less than 1,000 people, the worst attendedregions are Cantabria, Extremadura, Catalonia, Madrid and the BasqueCountry, with very saturated branches in their smaller villages. This findingconfirms the paradoxical conclusions of Carbó et al. (2002), which statethat rural areas of provinces in which there are important financialcentres, such as Madrid or Bilbao, are poorly covered by bank branches.This ‘oblivion effect’ of small villages could be explained by thecomparatively enormous attractiveness of nearby urban areas, in terms ofprofit potential.
The regions with better coverage by bank branches in villages over1,000 inhabitants are Aragon, Balearic Islands and Castile-Leon, findingthe best ratios in predominantly rural provinces as Huesca, Soria, Palenciaand Segovia. In the case of villages under 1,000 inhabitants, the bestratios are found also in Aragon and Balearic Islands, but not in Castile-Leon,where the smallest villages are quite worse attended than the nationalaverage. On the opposite side is Asturias, where the smallest villages showbetter coverage ratios than those with more than 1,000 inhabitants.
47

3.2.1. Geographical financial exclusion in the different regionsof Spain.
Considering an average of 1,010.77 inhabitants per bank branch in Spain,this amount could be used as a threshold to analyse how many towns,whose population exceeds it, do not have any branch at their disposal,and what the reasons are. The chosen database, aforementioned, allowshaving the information of towns over 1,000 inhabitants broken down toa municipal, provincial and regional level80. The rates of geographicalfinancial exclusion by region are shown in table 3.8.
Table 3.8. Rates of geographical financial exclusion by regions
Source: Own elaboration based on data from La Caixa (2009): Anuario Económico 2009
(Economic Yearbook 2009).
48
80 The territory of Spain is divided in three levels: local units or towns (municipios), provinces(provincias), and autonomous regions (comunidades autónomas). Autonomous regions areintegrated by one or several provinces.
Absence of bank branchesNo. towns % of total
over 1,000 in. Population population
Andalusia 3 4,997 0.06%
Aragon 0 0 0.00%
Asturias 2 4,477 0.41%
Balearic Islands 0 0 0.00%
Canary Islands 0 0 0.00%
Cantabria 5 6,414 1.10%
Castile-La Mancha 6 12,672 0.62%
Castille-León 18 26,317 1.03%
Catalonia 25 37,720 0.51%
Valencian Commun. 0 0 0.00%
Extremadura 2 2,614 0.24%
Galicia 19 33,873 1.22%
La Rioja 0 0 0.00%
Madrid 4 6,237 0.10%
Murcia 0 0 0.00%
Navarre 4 7,952 1.28%
Basque Country 12 19,567 0.91%
Total Regions 100 162,840 0.35%

3% of towns over one thousand inhabitants (that is 0.35% of the totalpopulation living in these towns) is financially excluded in geographicalterms regarding 2008 data. The highest levels of financial exclusionmeasured both in terms of number of towns and as absolute population,are found in Catalonia, Galicia and Castile-Leon (as seen also in figure 3.2).The last two regions also have the highest percentage of excludedpopulation. At the provincial level, there are several provinces with highrates of excluded population, some of them going beyond the 4% suchas Leon (4.23%) and Guadalajara (4.14%). Taking into account theseresults, the table 3.9 (next page) categorizes the Spanish regions intodifferent levels of financial exclusion.
Figure 3.2. Territorial financial exclusion by population and region
Source: Own elaboration based on data from La Caixa (2009): Anuario Económico 2009
(Economic Yearbook 2009).
Following the hypothesis of searching the maximization of profit marginswhen the setting up of a bank branch is decided, several socioeconomicfactors have been defined as having influence in this process81. The mostrelevant are the rural character of a territory, measured in terms ofpopulation density and presence of great urban centres82, and the wealthof a region, represented by regional incomes or GDP per capita.
49
81 Carbó and López del Paso, 2002.82 See section 3.1 for OECD definitions (OECD, 2009).
n 3%n 3%
n 4%
n 4%
n 16%
n 23%
21% n
2% n
4% n
5% n
12% n
n Andalusia 3%n Asturias 3%n Cantabria 4%n Castile-La Mancha 8%n Castille-León 16%n Catalonia 23%n Extremadura 2%n Galicia 21%n Madrid 4%n Navarre 5%n Pais Vasco 12%
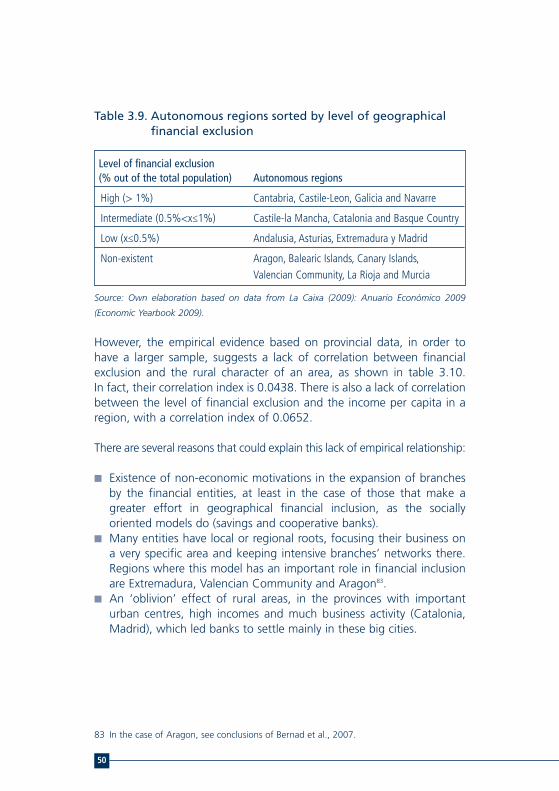
Table 3.9. Autonomous regions sorted by level of geographicalfinancial exclusion
Source: Own elaboration based on data from La Caixa (2009): Anuario Económico 2009
(Economic Yearbook 2009).
However, the empirical evidence based on provincial data, in order tohave a larger sample, suggests a lack of correlation between financialexclusion and the rural character of an area, as shown in table 3.10.In fact, their correlation index is 0.0438. There is also a lack of correlationbetween the level of financial exclusion and the income per capita in aregion, with a correlation index of 0.0652.
There are several reasons that could explain this lack of empirical relationship:
n Existence of non-economic motivations in the expansion of branchesby the financial entities, at least in the case of those that make agreater effort in geographical financial inclusion, as the sociallyoriented models do (savings and cooperative banks).
n Many entities have local or regional roots, focusing their business ona very specific area and keeping intensive branches’ networks there.Regions where this model has an important role in financial inclusionare Extremadura, Valencian Community and Aragon83.
n An ‘oblivion’ effect of rural areas, in the provinces with importanturban centres, high incomes and much business activity (Catalonia,Madrid), which led banks to settle mainly in these big cities.
50
83 In the case of Aragon, see conclusions of Bernad et al., 2007.
Level of financial exclusion(% out of the total population) Autonomous regions
High (> 1%) Cantabria, Castile-Leon, Galicia and Navarre
Intermediate (0.5%<x≤1%) Castile-la Mancha, Catalonia and Basque Country
Low (x≤0.5%) Andalusia, Asturias, Extremadura y Madrid
Non-existent Aragon, Balearic Islands, Canary Islands,Valencian Community, La Rioja and Murcia

Table 3.10. Comparison between share of financial exclusion,rural character and GDP per capita,in Spanish provinces
51
% fin. Rural GDP per exclusion character capita 2006
Province (population) index* Typology Spain = 100
A Coruña 1.74% 30% IN 86.8%
Álava 0.88% 16% IN 141.8%
Albacete 0.00% 100% PR 74.3%
Alicante 0.00% 16% IN 85.7%
Almería 0.00% 35% IN 90.5%
Asturias 0.41% 26% IN 90.5%
Ávila 0.00% 63% PR 80.0%
Badajoz 0.15% 88% PR 66.9%
Baleares 0.00% 36% IN 109.6%
Barcelona 0.22% 4% PU 117.9%
Burgos 0.00% 33% IN 113.2%
Cáceres 0.39% 91% PR 69.5%
Cádiz 0.00% 17% IN 79.5%
Cantabria 1.10% 25% IN 98.9%
Castellón 0.00% 21% IN 107.5%
Ciudad Real 0.00% 77% PR 77.0%
Córdoba 0.00% 51% IN 68.2%
Cuenca 0.54% 100% PR 76.9%
Girona 1.57% 36% IN 121.5%
Granada 0.00% 37% IN 71.9%
Guadalajara 4.14% 44% IN 84.0%
Guipúzcoa 0.60% 7% PU 130.4%
Huelva 0.00% 50% IN 83.1%
Huesca 0.00% 74% PR 98.7%
Jaén 0.00% 70% PR 64.6%
La Rioja 0.00% 31% IN 107.3%
Las Palmas 0.00% 17% IN 93.0%
León 4.23% 46% IN 89.1%
Lleida 0.25% 54% PR 115.9%
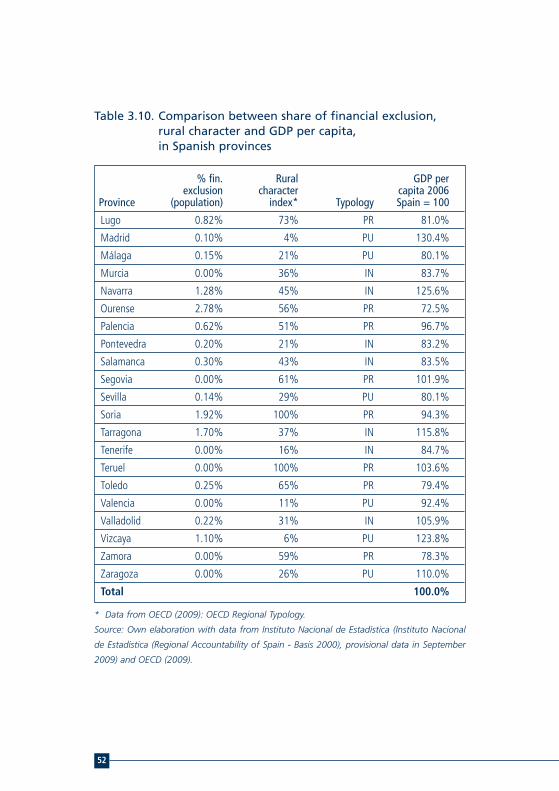
Table 3.10. Comparison between share of financial exclusion,rural character and GDP per capita,in Spanish provinces
* Data from OECD (2009): OECD Regional Typology.
Source: Own elaboration with data from Instituto Nacional de Estadística (Instituto Nacional
de Estadística (Regional Accountability of Spain - Basis 2000), provisional data in September
2009) and OECD (2009).
52
% fin. Rural GDP per exclusion character capita 2006
Province (population) index* Typology Spain = 100
Lugo 0.82% 73% PR 81.0%
Madrid 0.10% 4% PU 130.4%
Málaga 0.15% 21% PU 80.1%
Murcia 0.00% 36% IN 83.7%
Navarra 1.28% 45% IN 125.6%
Ourense 2.78% 56% PR 72.5%
Palencia 0.62% 51% PR 96.7%
Pontevedra 0.20% 21% IN 83.2%
Salamanca 0.30% 43% IN 83.5%
Segovia 0.00% 61% PR 101.9%
Sevilla 0.14% 29% PU 80.1%
Soria 1.92% 100% PR 94.3%
Tarragona 1.70% 37% IN 115.8%
Tenerife 0.00% 16% IN 84.7%
Teruel 0.00% 100% PR 103.6%
Toledo 0.25% 65% PR 79.4%
Valencia 0.00% 11% PU 92.4%
Valladolid 0.22% 31% IN 105.9%
Vizcaya 1.10% 6% PU 123.8%
Zamora 0.00% 59% PR 78.3%
Zaragoza 0.00% 26% PU 110.0%
Total 100.0%
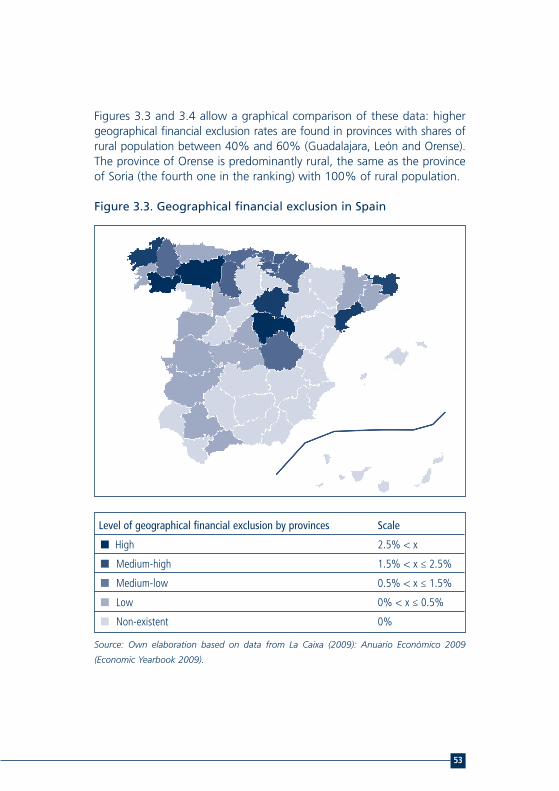
Figures 3.3 and 3.4 allow a graphical comparison of these data: highergeographical financial exclusion rates are found in provinces with shares ofrural population between 40% and 60% (Guadalajara, León and Orense).The province of Orense is predominantly rural, the same as the provinceof Soria (the fourth one in the ranking) with 100% of rural population.
Figure 3.3. Geographical financial exclusion in Spain
Source: Own elaboration based on data from La Caixa (2009): Anuario Económico 2009
(Economic Yearbook 2009).
53
Level of geographical financial exclusion by provinces Scale
n High 2.5% < x
n Medium-high 1.5% < x ≤ 2.5%
n Medium-low 0.5% < x ≤ 1.5%
n Low 0% < x ≤ 0.5%
n Non-existent 0%
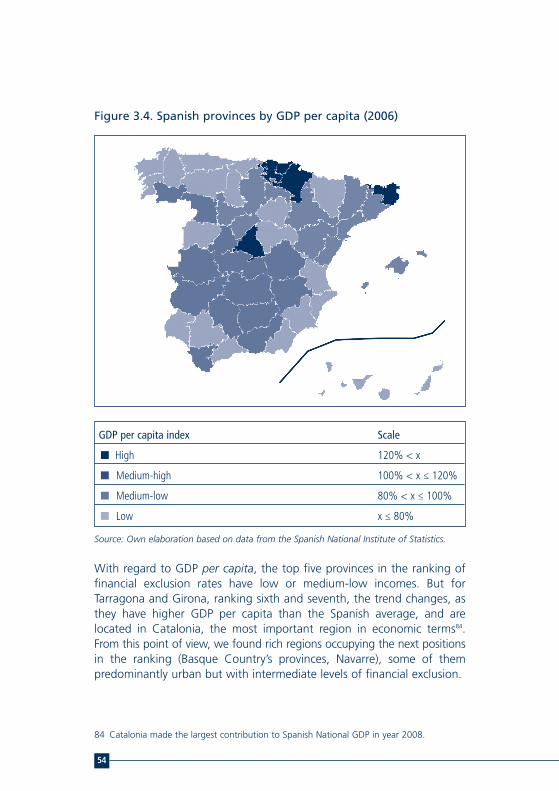
Figure 3.4. Spanish provinces by GDP per capita (2006)
Source: Own elaboration based on data from the Spanish National Institute of Statistics.
With regard to GDP per capita, the top five provinces in the ranking offinancial exclusion rates have low or medium-low incomes. But forTarragona and Girona, ranking sixth and seventh, the trend changes, asthey have higher GDP per capita than the Spanish average, and arelocated in Catalonia, the most important region in economic terms84.From this point of view, we found rich regions occupying the next positionsin the ranking (Basque Country’s provinces, Navarre), some of thempredominantly urban but with intermediate levels of financial exclusion.
54
84 Catalonia made the largest contribution to Spanish National GDP in year 2008.
GDP per capita index Scale
n High 120% < x
n Medium-high 100% < x ≤ 120%
n Medium-low 80% < x ≤ 100%
n Low x ≤ 80%

On the other hand, several low income provinces (Castile-La Mancha,Andalusia, Extremadura, Murcia or Canary Islands), with important ruralareas, show low or non-existent financial exclusion, that could beexplained by the special attention paid by the socially oriented models ofbanking to these poorer regions.
3.3. Presence of different types of banking entitiesin the Spanish regions
When determining the behaviour of the different kinds of retail banksin Spain in terms of geographical financial inclusion or ‘financial rescue’,as it has previously defined85, it is important to know if socially-orientedmodels of banks maintain their initial social policy in their commercialactivity. The ‘potential rescue’ is defined as the presence of only one kindof financial entity (bank, cooperative bank, or savings bank) in a locallevel territory, such as a town86. If this kind of banking entity abandons,based for example on market reasons, it will mean financial exclusion forthat territory.
The hardening of competitiveness among banking entities of same typein Spain, especially among savings banks, has been accompanied of anexpansion process of their activity in geographical terms. During the lastdecade, the usually local or regional extent of service of savings banksand cooperative banks has become national in many cases, particularlyfor the larger entities87. Many other savings banks have entered adjacentmarkets that previously were reserved to local entities. This has severalconsequences regarding the current analysis:
n Lost of relevance of the concept of financial ‘rescue’ by each type ofbanking entities, as there are now strong competition intro-typologies.
55
85 Carbó and López del Paso, 2002.86 Comparing only banking types, and not single entities, is less representative than it was in
2002, when first studies about this issue were developed. The reason is that in the lastyears the competitiveness among entities has risen, independently of their belonging to asame type, due to an expansive process that has relocated the operational area of manyentities from a regional level to a national one. Nevertheless, both the available data andthe comparative approach of the study are enough reasons to keep the same database andmethodology.
87 Font i Vidal, 2010.

n Partial lost of meaning of the consideration of villages where there isonly a type of entity as ‘rescued’ villages: it was plenty of sense whenthere was low or inexistent territorial competition among entities ofsame typology. Then, the presence of just a kind of entity in a villagehad a clear sense of financial inclusion, especially in deprived and ruralareas where no other entities had considered providing services due toa lack of market incentives. The situation in 2008 is different, as thevillages with presence of only one banking entity, independently of thenumber of branches established, could be certainly considered as anexample of territorial financial inclusion. But those where two or moreentities are operating, even when they belong to the same typology,could not be clearly considered as villages without market attraction,in which the leaving or desertion of one of the entities would meanrisk of financial exclusion.
n Higher interest of developing an analysis of financial inclusionsegmented by banking entities, independently of their typology.
Nevertheless, the complexity of such an analysis would require differentsources of information and it would loose homogeneity in relation withthe previous analysis regarding financial exclusion in Spain. Thus, it hasbeen preferred to keep the premise of financial ‘rescue’ as ‘presence ofonly one kind of financial entity (bank, cooperative bank, or savings bank)in a local level territory’, independently of the number of branches andentities. It has been also estimated in table 3.11 the potential deviationin the analysis due to maintaining this premise, as the percentage oftowns classified as ‘financially rescued’ but showing a certain marketattraction (4 branches or more). The percentage of rescued towns withmore than three banking branches is lower than 2%, and all of themconcern the savings banks sector.
This section gives response with data of 2008 to some questions thatwere already discussed regarding the year 200188, and which shouldbe also reviewed in the following years as the deep transformation of theSpanish Banking System is clearly concerning them: How is the territorialfinancial exclusion in Spain in villages over and under 1,000 inhabitantsevolving? Do the saving banks remain key actors in the financial inclusionand ‘rescue’ of these villages? What is the role of the other types of bankingentities in terms of financial inclusion? What are the distinguishingsocioeconomic features of excluded villages, and of those ‘rescued’ byeach kind of entity?
56
88 Carbó and López del Paso, 2002.
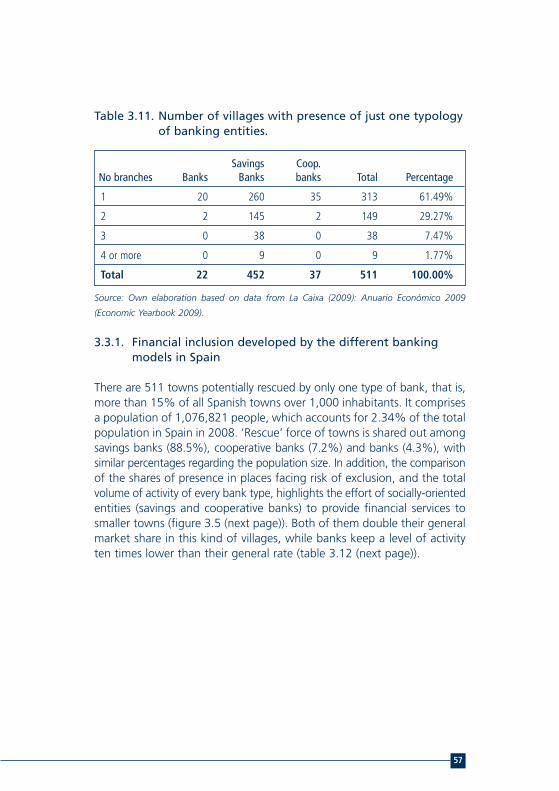
Table 3.11. Number of villages with presence of just one typologyof banking entities.
Source: Own elaboration based on data from La Caixa (2009): Anuario Económico 2009
(Economic Yearbook 2009).
3.3.1. Financial inclusion developed by the different bankingmodels in Spain
There are 511 towns potentially rescued by only one type of bank, that is,more than 15% of all Spanish towns over 1,000 inhabitants. It comprisesa population of 1,076,821 people, which accounts for 2.34% of the totalpopulation in Spain in 2008. ‘Rescue’ force of towns is shared out amongsavings banks (88.5%), cooperative banks (7.2%) and banks (4.3%), withsimilar percentages regarding the population size. In addition, the comparisonof the shares of presence in places facing risk of exclusion, and the totalvolume of activity of every bank type, highlights the effort of socially-orientedentities (savings and cooperative banks) to provide financial services tosmaller towns (figure 3.5 (next page)). Both of them double their generalmarket share in this kind of villages, while banks keep a level of activityten times lower than their general rate (table 3.12 (next page)).
57
Savings Coop. No branches Banks Banks banks Total Percentage
1 20 260 35 313 61.49%
2 2 145 2 149 29.27%
3 0 38 0 38 7.47%
4 or more 0 9 0 9 1.77%
Total 22 452 37 511 100.00%
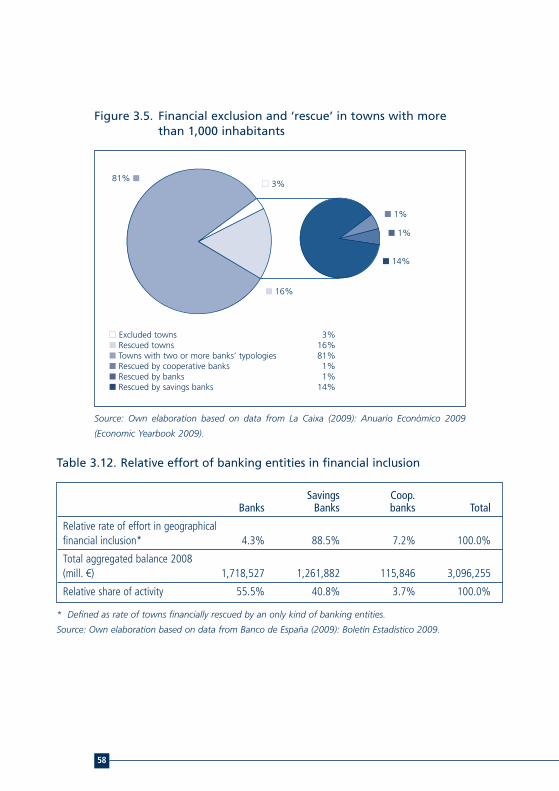
Figure 3.5. Financial exclusion and ‘rescue’ in towns with morethan 1,000 inhabitants
Source: Own elaboration based on data from La Caixa (2009): Anuario Económico 2009
(Economic Yearbook 2009).
58
n 3%
n 16%
n 1%
n 1%
n 14%
81% n
n Excluded towns 3%n Rescued towns 16%n Towns with two or more banks’ typologies 81%n Rescued by cooperative banks 1%n Rescued by banks 1%n Rescued by savings banks 14%
Savings Coop. Banks Banks banks Total
Relative rate of effort in geographicalfinancial inclusion* 4.3% 88.5% 7.2% 100.0%
Total aggregated balance 2008(mill. €) 1,718,527 1,261,882 115,846 3,096,255
Relative share of activity 55.5% 40.8% 3.7% 100.0%
Table 3.12. Relative effort of banking entities in financial inclusion
* Defined as rate of towns financially rescued by an only kind of banking entities.
Source: Own elaboration based on data from Banco de España (2009): Boletín Estadístico 2009.

Regarding the number of people living in towns over 1,000 inhabitants,which are financially excluded and rescued in Spain (tables 3.13, 3.14and 3.15 Financially excluded and rescued percentage of total population,by region), the following issues are worth highlighting:
n The high risk of geographical financial exclusion (defined as the sumof levels of exclusion and rescue) differs notably between regions, andaffects predominantly rural regions (Galicia, 8.17%, and Extremadura,5.77%), intermediate (Cantabria, 4.98%) or predominantly urbanones (Catalonia, 4.95%).
n 2.69% of the Spanish population living in towns over 1,000 inhabitantsfaces risk of financial exclusion.
n The regions with the lowest risk are Aragon (0.17%), Murcia (0.34%)and Madrid (0.85%). They show larger weight of urban areas thanthe regions with high risk of financial exclusion.
n Leaving aside the people living in smaller villages, savings banks rescue2.14% of total population in Spain, very far from the other kind ofentities and especially from banks, which rescue only 0.07% of thepopulation.
n In each region, the structure of the banking sector defines a differentapproach to financial ‘rescue’: banks only play an important role insome regions where certain entities are deeply rooted. This is the caseof the local bank Banca Pueyo in the province of Badajoz, or even thecase of the internationalized Banco Santander, that contributes firmlyto the financial inclusion of villages in Cantabria, its region of origin.Banks do not participate in financial inclusion in ten autonomousregions, despite of being the sector with the largest volume of activityin Spain. Cooperative banks do financial rescue of towns only in sevenregions, but they are strongly linked to these territories and contributeto the financial inclusion at the same level as savings banks do, or evenhigher in the case of the region of Asturias. And finally, savings banksare the entities with the greatest importance in terms of financiallyincluded population, rescuing territories in all Spanish regions, andbeing particularly strong in those at the highest risk of exclusion(Extremadura, Galicia).
59

60
Rescued Rescued Rescued by Savings by Coop.
Province Excluded by Banks Banks Banks Total
A Coruna 9 3 12 0 24
Álava 1 0 9 0 10
Albacete 0 0 6 0 6
Alicante 0 0 10 1 11
Almeria 0 0 0 3 3
Asturias 2 0 2 5 9
Avila 0 0 5 0 5
Badajoz 1 8 12 0 21
Baleares 0 0 6 0 6
Barcelona 7 1 62 0 70
Burgos 0 0 4 0 4
Caceres 1 1 22 0 24
Cadiz 0 0 11 0 11
Cantabria 5 3 8 0 16
Castellon 0 0 0 0 0
Ciudad Real 0 0 0 1 1
Cordoba 0 0 4 0 4
Cuenca 1 0 1 1 3
Girona 9 1 13 0 23
Granada 0 0 22 3 25
Guadalajara 4 0 11 0 15
Guipúzcoa 2 0 11 0 13
Huelva 0 0 3 3 6
Huesca 0 0 0 0 0
Jaen 0 0 2 0 2
La Rioja 0 0 7 0 7
Las Palmas 0 0 5 0 5
Leon 14 0 19 0 33
Lleida 1 0 13 0 14
Lugo 2 1 10 3 16
Madrid 4 1 18 0 23
Table 3.13. Number of towns excluded and potentially rescued, by province

61
Rescued Rescued Rescued by Savings by Coop.
Province Excluded by Banks Banks Banks Total
Malaga 2 0 4 3 9
Murcia 0 0 3 0 3
Navarra 4 0 3 1 8
Ourense 7 1 37 0 45
Palencia 1 0 2 0 3
Pontevedra 1 0 11 0 12
Salamanca 1 0 3 1 5
Segovia 0 0 4 0 4
Sevilla 1 0 1 1 3
Soria 1 0 0 0 1
Tarragona 8 0 37 0 45
Tenerife 0 0 7 0 7
Teruel 0 0 1 0 1
Toledo 1 0 6 1 8
Valencia 0 1 9 9 19
Valladolid 1 1 2 0 4
Vizcaya 9 0 12 0 21
Zamora 0 0 1 1 2
Zaragoza 0 0 1 0 1
Total No. Towns 100 22 452 37 611
Source: Own elaboration based on data from La Caixa (2009): Anuario Económico 2009 (Economic Yearbook 2009).
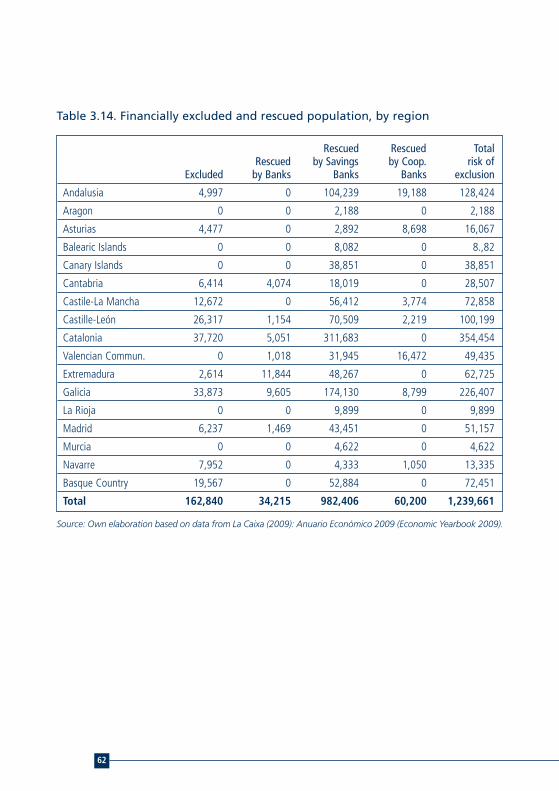
62
Rescued Rescued TotalRescued by Savings by Coop. risk of
Excluded by Banks Banks Banks exclusion
Andalusia 4,997 0 104,239 19,188 128,424
Aragon 0 0 2,188 0 2,188
Asturias 4,477 0 2,892 8,698 16,067
Balearic Islands 0 0 8,082 0 8.,82
Canary Islands 0 0 38,851 0 38,851
Cantabria 6,414 4,074 18,019 0 28,507
Castile-La Mancha 12,672 0 56,412 3,774 72,858
Castille-León 26,317 1,154 70,509 2,219 100,199
Catalonia 37,720 5,051 311,683 0 354,454
Valencian Commun. 0 1,018 31,945 16,472 49,435
Extremadura 2,614 11,844 48,267 0 62,725
Galicia 33,873 9,605 174,130 8,799 226,407
La Rioja 0 0 9,899 0 9,899
Madrid 6,237 1,469 43,451 0 51,157
Murcia 0 0 4,622 0 4,622
Navarre 7,952 0 4,333 1,050 13,335
Basque Country 19,567 0 52,884 0 72,451
Total 162,840 34,215 982,406 60,200 1,239,661
Table 3.14. Financially excluded and rescued population, by region
Source: Own elaboration based on data from La Caixa (2009): Anuario Económico 2009 (Economic Yearbook 2009).

63
Rescued Rescued TotalRescued by Savings by Coop. risk of
Excluded by Banks Banks Banks exclusion
Andalusia 0.06% 0.00% 1.31% 0.24% 1.61%
Aragon 0.00% 0.00% 0.17% 0.00% 0.17%
Asturias 0.41% 0.00% 0.27% 0.81% 1.49%
Balearic Islands 0.00% 0.00% 0.81% 0.00% 0.81%
Canary Islands 0.00% 0.00% 1.95% 0.00% 1.95%
Cantabria 1.10% 0.71% 3.17% 0.00% 4.98%
Castile-La Mancha 0.62% 0.00% 2.92% 0.20% 3.74%
Castille-León 1.03% 0.05% 2.79% 0.09% 3.96%
Catalonia 0.51% 0.07% 4.37% 0.00% 4.95%
Valencian Commun. 0.00% 0.02% 0.66% 0.35% 1.04%
Extremadura 0.24% 1.09% 4.44% 0.00% 5.77%
Galicia 1.22% 0.35% 6.29% 0.32% 8.17%
La Rioja 0.00% 0.00% 3.23% 0.00% 3.23%
Madrid 0.10% 0.02% 0.72% 0.00% 0.85%
Murcia 0.00% 0.00% 0.34% 0.00% 0.34%
Navarre 1.28% 0.00% 0.72% 0.18% 2.18%
Basque Country 0.91% 0.00% 2.48% 0.00% 3.39%
Table 3.15. Financially excluded and rescued percentage of total population,by region
Source: Own elaboration based on data from La Caixa (2009): Anuario Económico 2009 (Economic Yearbook 2009).

3.3.2. Socioeconomic features of the excluded andrescued population
The study of the socioeconomic features of the excluded and rescuedterritories provides important conclusions about the use of profit-basedor socially-based criteria by each sector when deciding the setting up ofbank branches89:
n Excluded towns have an average population of 1,639 inhabitants,very similar to the average of 1,541 calculated in previous studies90,but showing certain deterioration as the average size of unattendedvillages is slightly larger. In terms of ‘financial rescue’, cooperative banksare the entities that promote financial inclusion of smaller towns, withan average population of 1,456 inhabitants. And savings banks are‘rescuing’ the villages with larger average size, 2,014 inhabitants,matching the results of previous findings.
n Regarding population density, as the main factor of the rural characterof a territory, excluded towns have an average of 59.6 inhabitantsper square kilometre (inh./km.²), which is quite lower than the nationalaverage (91.4). Banks and savings banks rescue territories with loweraverages (68.7 and 76.0, respectively), but not as much as the averagerescued by cooperative banks (41.0). As well, the levels of dispersionof the density of population data for savings banks and banks arehigher than for cooperative banks. This means that rural character is animportant factor to define the risk of financial exclusion, and cooperativebanks are, in compliance with their foundational objectives, the entitieswith greater vocation for financial inclusion of rural areas.
n Population decrease is another factor with a high impact on financialexclusion: regions such as Galicia (Lugo -12.3%, Pontevedra -9.5%),that have lost inhabitants, contrary to the general growth of theSpanish population between 2003 and 2008, face the highestexclusion rates as well. But additionally the quick increase ofpopulation may cause that villages with less than 1,000 inhabitantspass this threshold and become subject of study.
64
89 These findings are based on tables 3.16, 3.17, 3.18 and 3.19, included in the appendix oftables.
90 Carbó and López del Paso, 2002.

Contrary to previous results91, the average variation of population ofthe excluded towns has been positive, and in a higher grade thannational average92. Nevertheless, the level of dispersion of data is quitehigh, and there are some regions where there are an average decrease(e.g. Leon and all the Galician provinces), and others where theincrease of population exceeds 100%, as Guadalajara (143%) andPalencia (123%). In the case of Guadalajara, province adjacent to theoverpopulated Madrid, the relation between the quick developmentof new residential areas to absorb part of the growth of this greaturban centre and the setting up of bank branches on them should bestudied to define clearly the causes of this effect. In this sense, the highestincrease rate of population among rescued towns is also found inGuadalajara, with 68.3%. Generally, the evaluation of populationvariation is quite complex, requiring a deeper analysis concerningfinancial exclusion (variations due to natural increase/decrease, agingof population, migrant flows, etc.). In this chapter, the study of thisissue is limited to the absolute variation of population, but thoseadditional variables are considered in the specific analysis of Cataloniaand Andalusia in chapter 4.
n Unemployment does not seem to be an important factor in definingfinancial exclusion in rural areas. In fact, excluded villages show lowerrates of unemployment than the national average. It can be highlightedthat towns rescued by banks and savings banks have rates slightlyhigher than the excluded ones or those rescued by cooperative banks.This, linked to the data about population density, could be explainedby the fact that most rural areas, which are less attractive for thesettlement of bank branches or are rescued mainly by cooperative banks,usually are not centres of social exclusion or poverty. Depressed areasare more common in larger towns and suburban areas, where thesavings banks sector plays a more important role in financial inclusion.
n Commercial retail activity is lower than the national average in allcategories of towns under analysis (excluded and rescued by each ofthe sectors), but there are no differences between categories.The relative high weight of the commercial activities related to foodand household goods sector, agree with a rural character of theanalysed villages. The low commercial activity which is typical of ruralareas could be considered as a risk factor for financial exclusion, evenwhen several entities, as many cooperative banks, have been createdto give financial support to the cooperative agrarian sector.
65
91 Carbó and López del Paso, 200292 The average increase of population in Spain between end of 2003 and end of 2008 was
8.21%, following data of the Instituto Nacional de Estadística (INE). www.ine.es/
n Furthermore, building activity, which was the main industry in Spainduring the five years prior to 2008 – and which has been also stronglysupported by the banking sector – shows a certain relationship withthe risk of financial exclusion: in the territories where the risk offinancial exclusion is the highest, the building activity rates are the lowest(Galicia and Extremadura). We can also find unusually high rates ofbuilding activity (more than 80%, versus the national average of 58.8%)in rescued villages of several provinces, some of them situated nearbybig urban areas (e.g. The province of Toledo, which is adjacent toMadrid) and others of great importance to tourism (e.g. Balearic Islands).Expectations of population growth or of a boost of the economy,linked to the building activity, seem to be a reason for the ‘financialrescue’ of villages that previously did not have any bank branch.
n In this sense, it is worth studying the relationship between the risk offinancial exclusion and the economic potential of a territory. The marketshare of a town, defined as its consumer capacity based on fivevariables93, determines both the risk of suffering financial exclusion– if this share is low-, and the possibility of being rescued. The highestshares have been founded among the towns rescued by savings banksin Cadiz and Madrid, or by banks in Barcelona, being in those casestowns located in areas with an economic potential much higher thanthe national average. This could be the case of residential centres thathave grown in rural areas nearby big cities.
n Regarding access to telecommunications – fixed phone lines andbroadband-, as an alternative to banking through branches, we findthe worst rates of access only in the regions with the highest risk offinancial exclusion (Galicia and Extremadura), and a strong ruralcharacter. They are followed also by other regions with high rates ofrurality, as Andalusia, and some Castilian provinces as Cuenca and Leon.The richest and most urban regions such as Catalonia, the BasqueCountry, Madrid, Balearic Islands and Navarre, where rates ofgeographical financial exclusion are not especially worrying (exceptfor some areas of Catalonia), are the regions that have the bestpossibilities to benefit from on-line banking, as they have the mostdeveloped network of phone lines and broad band.
66
93 See La Caixa (2009): Anuario Económico de España (Economic Yearbook of Spain),for general description, definitions and methodology. This indicator is considered useful forthe territorial planning of companies, and substitutes the available familiar income,indicator formerly included in the statistical information, and used for the previous analysisregarding financial exclusion in Spain.

67
Population average 2008Rescued Rescued
Rescued by Savings by Coop.Excluded by Banks Banks Banks
A Coruna 2,197 2,085 3,850 -
Alava 2,710 - 1,668 -
Albacete - - 1,298 -
Alicante - - 1,665 1,062
Almeria - - - 1,168
Asturias 2,239 - 1,446 1,740
Avila - - 1,537 -
Badajoz 1,000 1,324 1,470 -
Baleares - - 1,347 -
Barcelona 1,681 3,971 2,783 -
Burgos - - 1,377 -
Caceres 1,614 1,250 1,392 -
Cadiz - - 4,218 -
Cantabria 1,283 1,358 2,252 -
Castellon - - - -
Ciudad Real - - - 1,580
Cordoba - - 1,523 -
Cuenca 1,165 - 1,137 1,162
Girona 1,276 1,080 2,321 -
Granada - - 1,368 1,400
Guadalajara 2,458 - 2,938 -
Guipuzcoa 2,106 - 1,524 -
Huelva - - 2,385 1,711
Huesca - - - -
Jaen - - 1,590 -
La Rioja - - 1,414 -
Las Palmas - - 4,373 -
Leon 1,513 - 1,570 -
Lleida 1,070 - 1,438 -
Lugo 1,451 1,743 2,137 2,933
Table 3.16. Socioeconomic features of excluded and rescued towns (I)

68
Population average 2008
Rescued RescuedRescued by Savings by Coop.
Excluded by Banks Banks Banks
Madrid 1,559 1,469 2,414 -
Malaga 1,155 - 2,426 1,642
Murcia - - 1,541 -
Navarra 1,988 - 1,444 1,050
Ourense 1,333 1,607 1,805 -
Palencia 1,069 - 1,251 -
Pontevedra 1,864 - 3,618 -
Salamanca 1,074 - 1,910 1,192
Segovia - - 2,730 -
Sevilla 2,687 - 1,609 1,425
Soria 1,815 - - -
Tarragona 1,674 - 2,393 -
Tenerife - - 2,427 -
Teruel - - 1,034 -
Toledo 1,674 - 2,529 1,032
Valencia - 1,018 1,700 1,712
Valladolid 1,183 1,154 3,476 -
Vizcaya 1,405 - 1,759 -
Zamora - - 1,374 1,027
Zaragoza - - 1,154 -
Total 1,639 1,642 2,014 1,456

69
Table 3.16. Socioeconomic features of excluded and rescued towns (I)
Variation of Population 03-08 (%)Rescued Rescued
Rescued by Savings by Coop.Excluded by Banks Banks Banks
A Coruna -4.3 -8.6 -4.7 -
Alava 21.2 - 19.8 -
Albacete - - -2.9 -
Alicante - - 40.5 40.3
Almeria - - - 3.0
Asturias -4.7 - -4.8 -3.1
Avila - - 9.5 -
Badajoz -1.7 0.8 -3.4 -
Baleares - - 15.3 -
Barcelona 43.6 44.3 22.8 -
Burgos - - 41.5 -
Caceres 5.5 -11.4 -1.5 -
Cadiz - - 3.5 -
Cantabria 6.4 15.2 7.4 -
Castellon - - - -
Ciudad Real - - - 82.2
Cordoba - - 5.2 -
Cuenca 38.4 - 15.7 3.4
Girona 17.2 36.2 17.8 -
Granada - - 4.2 15.7
Guadalajara 142.8 - 68.3 -
Guipuzcoa 16.6 - 8.5 -
Huelva - - 3.4 -0.8
Huesca - - - -
Jaen - - 0.5 -
La Rioja - - 15.6 -
Las Palmas - - 3.6 -
Leon -0.7 - -3.3 -
Lleida 39.7 - 11.3 -
Lugo -12.3 -12.8 -8.1 -4.4
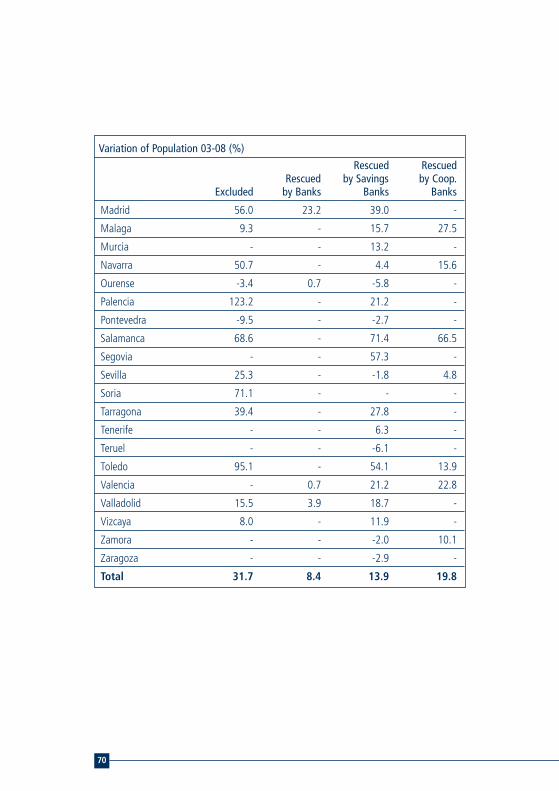
70
Variation of Population 03-08 (%)
Rescued RescuedRescued by Savings by Coop.
Excluded by Banks Banks Banks
Madrid 56.0 23.2 39.0 -
Malaga 9.3 - 15.7 27.5
Murcia - - 13.2 -
Navarra 50.7 - 4.4 15.6
Ourense -3.4 0.7 -5.8 -
Palencia 123.2 - 21.2 -
Pontevedra -9.5 - -2.7 -
Salamanca 68.6 - 71.4 66.5
Segovia - - 57.3 -
Sevilla 25.3 - -1.8 4.8
Soria 71.1 - - -
Tarragona 39.4 - 27.8 -
Tenerife - - 6.3 -
Teruel - - -6.1 -
Toledo 95.1 - 54.1 13.9
Valencia - 0.7 21.2 22.8
Valladolid 15.5 3.9 18.7 -
Vizcaya 8.0 - 11.9 -
Zamora - - -2.0 10.1
Zaragoza - - -2.9 -
Total 31.7 8.4 13.9 19.8

71
Table 3.16. Socioeconomic features of excluded and rescued towns (I)
Density of population (inhab/km2)Rescued Rescued
Rescued by Savings by Coop.Excluded by Banks Banks Banks
A Coruna 44.6 21.2 48.8 -
Alava 19.2 - 33.3 -
Albacete - - 9.8 -
Alicante - - 146.8 48.3
Almeria - - - 22.6
Asturias 45.8 - 5.9 46.5
Avila - - 33.5 -
Badajoz 47.6 41.2 43.6 -
Baleares - - 71.3 -
Barcelona 63.0 220.6 219.4 -
Burgos - - 66.8 -
Caceres 26.0 36.8 24.0 -
Cadiz - - 75.1 -
Cantabria 34.3 114.3 69.7 -
Castellon - - - -
Ciudad Real - - - 56.4
Cordoba - - 9.1 -
Cuenca 14.4 - 7.2 37.5
Girona 74.5 56.8 163.1 -
Granada - - 71.8 46.3
Guadalajara 74.5 - 156.2 -
Guipuzcoa 323.6 - 125.6 -
Huelva - - 29.6 31.5
Huesca - - - -
Jaen - - 10.5 -
La Rioja - - 72.9 -
Las Palmas - - 119.2 -
Leon 30.7 - 25.9 -
Lleida 6.0 - 72.1 -
Lugo 20.1 12.7 17.6 23.4

72
Density of population (inhab/km2)
Rescued RescuedRescued by Savings by Coop.
Excluded by Banks Banks Banks
Madrid 76.2 70.0 131.7 -
Malaga 66.9 - 75.9 70.9
Murcia - - 90.2 -
Navarra 91.0 - 55.5 43.8
Ourense 29.7 34.2 30.8 -
Palencia 56.3 - 31.2 -
Pontevedra 25.2 - 68.7 -
Salamanca 97.6 - 76.5 37.3
Segovia - - 238.5 -
Sevilla 1343.5 - 6.2 18.5
Soria 9.6 - - -
Tarragona 94.8 - 205.7 -
Tenerife - - 78.3 -
Teruel - - 24.6 -
Toledo 37.2 - 102.4 8.5
Valencia - 127.3 252.1 111.8
Valladolid 32.0 20.2 111.5 -
Vizcaya 109.1 - 82.3 -
Zamora - - 15.3 11.0
Zaragoza - - 12.1 -
Total 107.2 68.7 76.0 41.0
Source: Own elaboration based on data from La Caixa (2009): Anuario Económico 2009
(Economic Yearbook 2009).
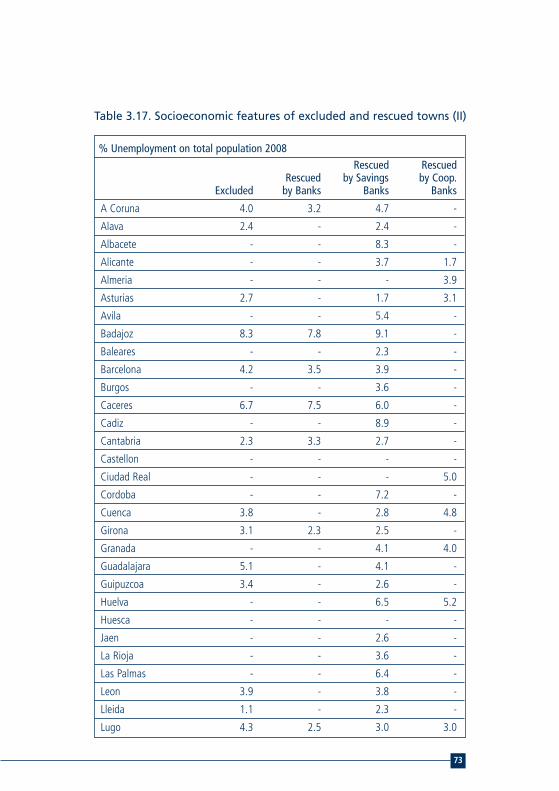
73
Table 3.17. Socioeconomic features of excluded and rescued towns (II)
% Unemployment on total population 2008Rescued Rescued
Rescued by Savings by Coop.Excluded by Banks Banks Banks
A Coruna 4.0 3.2 4.7 -
Alava 2.4 - 2.4 -
Albacete - - 8.3 -
Alicante - - 3.7 1.7
Almeria - - - 3.9
Asturias 2.7 - 1.7 3.1
Avila - - 5.4 -
Badajoz 8.3 7.8 9.1 -
Baleares - - 2.3 -
Barcelona 4.2 3.5 3.9 -
Burgos - - 3.6 -
Caceres 6.7 7.5 6.0 -
Cadiz - - 8.9 -
Cantabria 2.3 3.3 2.7 -
Castellon - - - -
Ciudad Real - - - 5.0
Cordoba - - 7.2 -
Cuenca 3.8 - 2.8 4.8
Girona 3.1 2.3 2.5 -
Granada - - 4.1 4.0
Guadalajara 5.1 - 4.1 -
Guipuzcoa 3.4 - 2.6 -
Huelva - - 6.5 5.2
Huesca - - - -
Jaen - - 2.6 -
La Rioja - - 3.6 -
Las Palmas - - 6.4 -
Leon 3.9 - 3.8 -
Lleida 1.1 - 2.3 -
Lugo 4.3 2.5 3.0 3.0
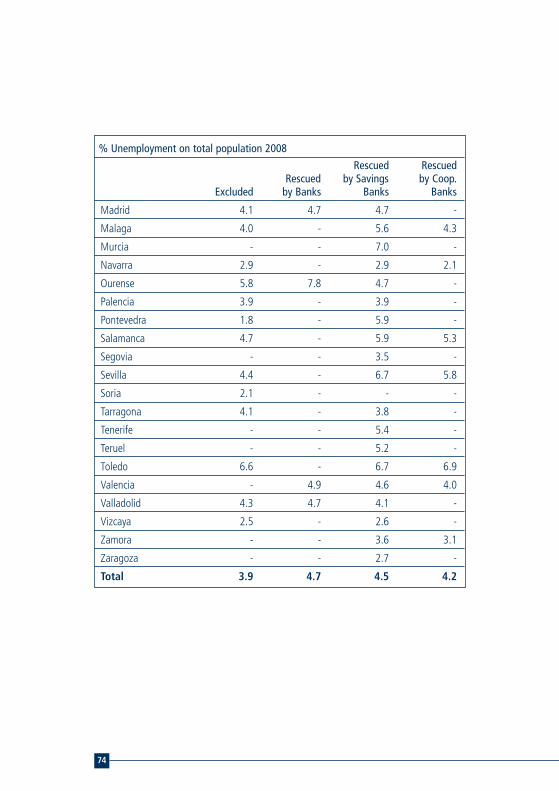
74
% Unemployment on total population 2008
Rescued RescuedRescued by Savings by Coop.
Excluded by Banks Banks Banks
Madrid 4.1 4.7 4.7 -
Malaga 4.0 - 5.6 4.3
Murcia - - 7.0 -
Navarra 2.9 - 2.9 2.1
Ourense 5.8 7.8 4.7 -
Palencia 3.9 - 3.9 -
Pontevedra 1.8 - 5.9 -
Salamanca 4.7 - 5.9 5.3
Segovia - - 3.5 -
Sevilla 4.4 - 6.7 5.8
Soria 2.1 - - -
Tarragona 4.1 - 3.8 -
Tenerife - - 5.4 -
Teruel - - 5.2 -
Toledo 6.6 - 6.7 6.9
Valencia - 4.9 4.6 4.0
Valladolid 4.3 4.7 4.1 -
Vizcaya 2.5 - 2.6 -
Zamora - - 3.6 3.1
Zaragoza - - 2.7 -
Total 3.9 4.7 4.5 4.2

75
Table 3.17. Socioeconomic features of excluded and rescued towns (II)
% Female UnemploymentRescued Rescued
Rescued by Savings by Coop.Excluded by Banks Banks Banks
A Coruna 4.4 2.7 5.3 -
Alava 3.3 - 3.2 -
Albacete - - 12.0 -
Alicante - - 3.7 1.5
Almeria - - - 3.3
Asturias 3.1 - 1.3 3.2
Avila - - 5.5 -
Badajoz 10.2 10.0 11.7 -
Baleares - - 2.8 -
Barcelona 5.5 4.5 4.8 -
Burgos - - 4.2 -
Caceres 7.8 9.6 7.0 -
Cadiz - - 9.7 -
Cantabria 2.3 3.9 3.1 -
Castellon - - - -
Ciudad Real - - - 6.4
Cordoba - - 10.1 -
Cuenca 5.7 - 3.0 6.5
Girona 3.6 3.0 2.9 -
Granada - - 3.8 3.6
Guadalajara 6.4 - 5.1 -
Guipuzcoa 4.6 - 3.3 -
Huelva - - 7.1 4.9
Huesca - - - -
Jaen - - 3.3 -
La Rioja - - 4.2 -
Las Palmas - - 7.5 -
Leon 4.5 - 4.2 -
Lleida 1.3 - 2.5 -
Lugo 4.3 2.8 2.9 3.0

76
% Female Unemployment
Rescued RescuedRescued by Savings by Coop.
Excluded by Banks Banks Banks
Madrid 4.6 3.3 5.2 -
Malaga 2.4 - 5.0 2.4
Murcia - - 6.4 -
Navarra 3.9 - 3.8 2.5
Ourense 6.1 8.9 5.2 -
Palencia 6.1 - 3.8 -
Pontevedra 1.8 - 6.7 -
Salamanca 8.0 - 8.0 6.4
Segovia - - 4.5 -
Sevilla 6.0 - 8.0 5.8
Soria 3.6 - - -
Tarragona 4.7 - 4.2 -
Tenerife - - 6.2 -
Teruel - - 5.9 -
Toledo 8.7 - 8.9 9.7
Valencia - 7.1 5.3 4.1
Valladolid 4.9 5.1 5.2 -
Vizcaya 3.1 - 2.8 -
Zamora - - 3.6 2.7
Zaragoza - - 2.3 -
Total 4.8 5.5 5.2 4.4

77
Table 3.17. Socioeconomic features of excluded and rescued towns (II)
% Unemployment of people over 50 yearsRescued Rescued
Rescued by Savings by Coop.Excluded by Banks Banks Banks
A Coruna 2.6 2.2 3.6 -
Alava 1.3 - 1.9 -
Albacete - - 7.0 -
Alicante - - 2.5 0.3
Almeria - - - 2.6
Asturias 1.2 - 0.7 1.5
Avila - - 3.4 -
Badajoz 7.8 5.5 6.8 -
Baleares - - 1.8 -
Barcelona 3.9 4.2 3.9 -
Burgos - - 4.3 -
Caceres 3.3 5.1 3.2 -
Cadiz - - 6.1 -
Cantabria 1.2 2.2 1.6 -
Castellon - - - -
Ciudad Real - - - 3.1
Cordoba - - 4.6 -
Cuenca 1.7 - 1.2 3.0
Girona 2.8 1.4 2.0 -
Granada - - 2.1 1.5
Guadalajara 3.8 - 2.8 -
Guipuzcoa 4.6 - 2.4 -
Huelva - - 4.7 2.9
Huesca - - - -
Jaen - - 1.4 -
La Rioja - - 2.4 -
Las Palmas - - 4.5 -
Leon 2.2 - 2.1 -
Lleida 0.0 - 1.3 -
Lugo 2.9 1.4 2.1 2.0
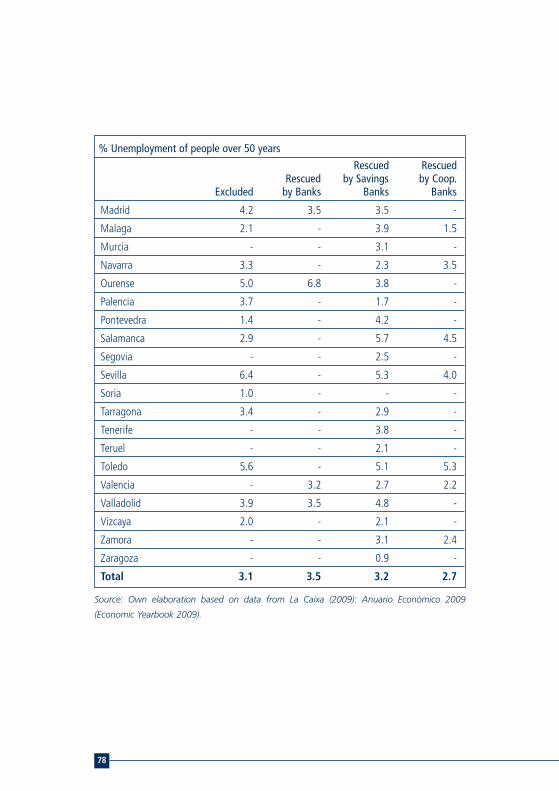
78
% Unemployment of people over 50 years
Rescued RescuedRescued by Savings by Coop.
Excluded by Banks Banks Banks
Madrid 4.2 3.5 3.5 -
Malaga 2.1 - 3.9 1.5
Murcia - - 3.1 -
Navarra 3.3 - 2.3 3.5
Ourense 5.0 6.8 3.8 -
Palencia 3.7 - 1.7 -
Pontevedra 1.4 - 4.2 -
Salamanca 2.9 - 5.7 4.5
Segovia - - 2.5 -
Sevilla 6.4 - 5.3 4.0
Soria 1.0 - - -
Tarragona 3.4 - 2.9 -
Tenerife - - 3.8 -
Teruel - - 2.1 -
Toledo 5.6 - 5.1 5.3
Valencia - 3.2 2.7 2.2
Valladolid 3.9 3.5 4.8 -
Vizcaya 2.0 - 2.1 -
Zamora - - 3.1 2.4
Zaragoza - - 0.9 -
Total 3.1 3.5 3.2 2.7
Source: Own elaboration based on data from La Caixa (2009): Anuario Económico 2009
(Economic Yearbook 2009).

79
Table 3.18. Socioeconomic features of excluded and rescued towns (III)
Retail commercial activities no food or household goods/total retail activityRescued Rescued
Rescued by Savings by Coop.Excluded by Banks Banks Banks
A Coruna 35.0% 62.0% 41.9% -
Alava 58.8% - 48.0% -
Albacete - - 27.8% -
Alicante - - 44.1% 36.4%
Almeria - - - 34.2%
Asturias 29.9% - 23.2% 26.7%
Avila - - 35.2% -
Badajoz 25.0% 23.7% 29.6% -
Baleares - - 36.2% -
Barcelona 48.4% 31.7% 38.8% -
Burgos - - 53.0% -
Caceres 45.0% 35.3% 31.8% -
Cadiz - - 42.1% -
Cantabria 24.2% 35.8% 36.0% -
Castellon - - - -
Ciudad Real - - - 40.0%
Cordoba - - 26.9% -
Cuenca 50.0% - 45.5% 40.0%
Girona 50.2% 27.3% 36.2% -
Granada - - 30.6% 21.0%
Guadalajara 50.0% - 44.8% -
Guipuzcoa 52.9% - 36.0% -
Huelva - - 34.6% 28.3%
Huesca - - - -
Jaen - - 36.2% -
La Rioja - - 31.0% -
Las Palmas - - 36.1% -
Leon 39.2% - 35.8% -
Lleida 42.9% - 47.7% -
Lugo 45.2% 28.6% 38.9% 50.2%

80
Retail commercial activities no food or household goods/total retail activity
Rescued RescuedRescued by Savings by Coop.
Excluded by Banks Banks Banks
Madrid 48.2% 50.0% 45.9% -
Malaga 28.2% - 36.9% 37.8%
Murcia - - 36.0% -
Navarra 53.4% - 40.1% 31.3%
Ourense 37.7% 18.2% 29.6% -
Palencia 42.1% - 21.4% -
Pontevedra 42.9% - 32.5% -
Salamanca 60.0% - 49.3% 46.2%
Segovia - - 27.3% -
Sevilla 55.6% - 10.8% 54.1%
Soria 68.8% - - -
Tarragona 25.0% - 38.5% -
Tenerife - - 47.4% -
Teruel - - 15.4% -
Toledo 33.3% - 42.5% 39.1%
Valencia - 22.2% 32.5% 39.6%
Valladolid 16.7% 43.8% 24.6% -
Vizcaya 54.1% - 45.1% -
Zamora - - 13.8% 4.2%
Zaragoza - - 28.6% -
Total 43.1% 34.4% 35.3% 35.3%

81
Table 3.18. Socioeconomic features of excluded and rescued towns (III)
Building Activity/Total industrial activityRescued Rescued
Rescued by Savings by Coop.Excluded by Banks Banks Banks
A Coruna 56.1% 57.7% 59.4% -
Alava 43.3% - 65.1% -
Albacete - - 64.3% -
Alicante - - 71.8% 95.7%
Almeria - - - 50.8%
Asturias 60.9% - 53.0% 58.8%
Avila - - 71.5% -
Badajoz 38.5% 51.5% 58.8% -
Baleares - - 83.3% -
Barcelona 55.6% 82.3% 59.8% -
Burgos - - 55.1% -
Caceres 39.1% 38.5% 65.8% -
Cadiz - - 56.1% -
Cantabria 64.5% 72.6% 73.6% -
Castellon - - - -
Ciudad Real - - - 50.0%
Cordoba - - 51.9% -
Cuenca 76.0% - 45.0% 57.9%
Girona 55.7% 81.1% 65.1% -
Granada - - 54.7% 57.6%
Guadalajara 69.0% - 73.8% -
Guipuzcoa 41.4% - 52.8% -
Huelva - - 50.6% 45.5%
Huesca - - - -
Jaen - - 65.7% -
La Rioja - - 59.4% -
Las Palmas - - 58.2% -
Leon 59.5% - 61.5% -
Lleida 63.9% - 58.3% -
Lugo 59.4% 33.3% 56.5% 60.0%

82
Building Activity/Total industrial activity
Rescued RescuedRescued by Savings by Coop.
Excluded by Banks Banks Banks
Madrid 66.2% 46.1% 69.8% -
Malaga 30.6% - 40.4% 72.5%
Murcia - - 56.0% -
Navarra 51.1% - 61.6% 34.9%
Ourense 60.8% 47.2% 55.4% -
Palencia 37.3% - 57.8% -
Pontevedra 57.1% - 58.6% -
Salamanca 87.5% - 55.2% 42.1%
Segovia - - 64.1% -
Sevilla 80.0% - 55.6% 68.2%
Soria 48.1% - - -
Tarragona 73.7% - 59.8% -
Tenerife - - 55.8% -
Teruel - - 38.1% -
Toledo 87.5% - 64.2% 55.9%
Valencia - 83.3% 76.6% 64.4%
Valladolid 70.4% 58.3% 79.2% -
Vizcaya 54.7% - 52.1% -
Zamora - - 83.3% 75.0%
Zaragoza - - 68.8% -
Total 58.8% 59.3% 61.0% 59.3%
Source: Own elaboration based on data from La Caixa (2009): Anuario Económico 2009
(Economic Yearbook 2009).

83
Table 3.19. Socioeconomic features of excluded and rescued towns (IV)
Market shareRescued Rescued
Rescued by Savings by Coop.Excluded by Banks Banks Banks
A Coruna 3 4 6 -
Alava 5 - 4 -
Albacete - - 3 -
Alicante - - 4 2
Almeria - - - 2
Asturias 4 - 3 3
Avila - - 4 -
Badajoz 1 3 3 -
Baleares - - 3 -
Barcelona 3 7 6 -
Burgos - - 3 -
Caceres 3 3 3 -
Cadiz - - 7 -
Cantabria 2 3 4 -
Castellon - - - -
Ciudad Real - - - 3
Cordoba - - 3 -
Cuenca 2 - 2 3
Girona 3 3 5 -
Granada - - 3 3
Guadalajara 4 - 5 -
Guipuzcoa 4 - 3 -
Huelva - - 4 3
Huesca - - - -
Jaen - - 3 -
La Rioja - - 3 -
Las Palmas - - 8 -
Leon 3 - 3 -
Lleida 2 - 4 -
Lugo 3 3 4 5

84
Market share
Rescued RescuedRescued by Savings by Coop.
Excluded by Banks Banks Banks
Madrid 5 3 7 -
Malaga 2 - 5 3
Murcia - - 3 -
Navarra 5 - 3 3
Ourense 2 3 4 -
Palencia 2 - 3 -
Pontevedra 2 - 6 -
Salamanca 1 - 3 2
Segovia - - 5 -
Sevilla 3 - 3 3
Soria 3 - - -
Tarragona 3 - 5 -
Tenerife - - 5 -
Teruel - - 2 -
Toledo 3 - 5 3
Valencia - 2 3 3
Valladolid 2 2 6 -
Vizcaya 3 - 3 -
Zamora - - 4 2
Zaragoza - - 3 -
Total 2.9 3.2 4.0 2.9

85
Table 3.19. Socioeconomic features of excluded and rescued towns (IV)
Fixed phone lines/inhabitantRescued Rescued
Rescued by Savings by Coop.Excluded by Banks Banks Banks
A Coruna 0.33 0.33 0.30 -
Alava 0.40 - 0.45 -
Albacete - - 0.34 -
Alicante - - 0.37 0.41
Almeria - - - 0.27
Asturias 0.37 - 0.45 0.38
Avila - - 0.51 -
Badajoz 0.20 0.26 0.30 -
Baleares - - 0.46 -
Barcelona 0.45 0.42 0.44 -
Burgos - - 0.37 -
Caceres 0.29 0.43 0.31 -
Cadiz - - 0.21 -
Cantabria 0.35 0.37 0.34 -
Castellon - - - -
Ciudad Real - - - 0.32
Cordoba - - 0.29 -
Cuenca 0.35 - 0.40 0.24
Girona 0.46 0.53 0.46 -
Granada - - 0.29 0.30
Guadalajara 0.30 - 0.38 -
Guipuzcoa 0.47 - 0.44 -
Huelva - - 0.24 0.24
Huesca - - - -
Jaen - - 0.28 -
La Rioja - - 0.41 -
Las Palmas - - 0.26 -
Leon 0.44 - 0.40 -
Lleida 0.37 - 0.45 -
Lugo 0.35 0.33 0.36 0.34
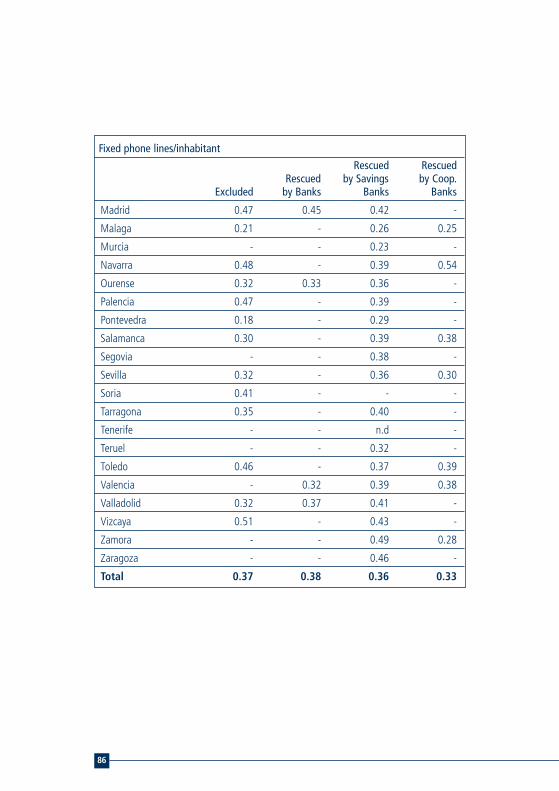
86
Fixed phone lines/inhabitant
Rescued RescuedRescued by Savings by Coop.
Excluded by Banks Banks Banks
Madrid 0.47 0.45 0.42 -
Malaga 0.21 - 0.26 0.25
Murcia - - 0.23 -
Navarra 0.48 - 0.39 0.54
Ourense 0.32 0.33 0.36 -
Palencia 0.47 - 0.39 -
Pontevedra 0.18 - 0.29 -
Salamanca 0.30 - 0.39 0.38
Segovia - - 0.38 -
Sevilla 0.32 - 0.36 0.30
Soria 0.41 - - -
Tarragona 0.35 - 0.40 -
Tenerife - - n.d -
Teruel - - 0.32 -
Toledo 0.46 - 0.37 0.39
Valencia - 0.32 0.39 0.38
Valladolid 0.32 0.37 0.41 -
Vizcaya 0.51 - 0.43 -
Zamora - - 0.49 0.28
Zaragoza - - 0.46 -
Total 0.37 0.38 0.36 0.33
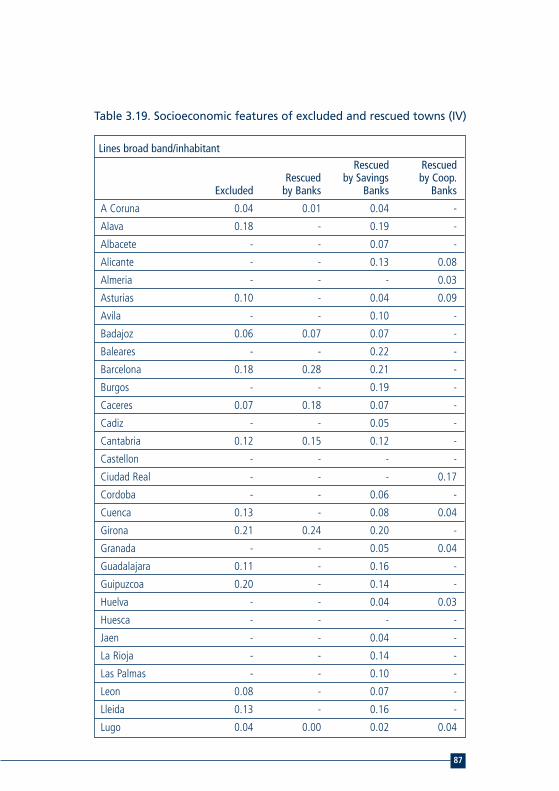
87
Table 3.19. Socioeconomic features of excluded and rescued towns (IV)
Lines broad band/inhabitantRescued Rescued
Rescued by Savings by Coop.Excluded by Banks Banks Banks
A Coruna 0.04 0.01 0.04 -
Alava 0.18 - 0.19 -
Albacete - - 0.07 -
Alicante - - 0.13 0.08
Almeria - - - 0.03
Asturias 0.10 - 0.04 0.09
Avila - - 0.10 -
Badajoz 0.06 0.07 0.07 -
Baleares - - 0.22 -
Barcelona 0.18 0.28 0.21 -
Burgos - - 0.19 -
Caceres 0.07 0.18 0.07 -
Cadiz - - 0.05 -
Cantabria 0.12 0.15 0.12 -
Castellon - - - -
Ciudad Real - - - 0.17
Cordoba - - 0.06 -
Cuenca 0.13 - 0.08 0.04
Girona 0.21 0.24 0.20 -
Granada - - 0.05 0.04
Guadalajara 0.11 - 0.16 -
Guipuzcoa 0.20 - 0.14 -
Huelva - - 0.04 0.03
Huesca - - - -
Jaen - - 0.04 -
La Rioja - - 0.14 -
Las Palmas - - 0.10 -
Leon 0.08 - 0.07 -
Lleida 0.13 - 0.16 -
Lugo 0.04 0.00 0.02 0.04

88
Lines broad band/inhabitant
Rescued RescuedRescued by Savings by Coop.
Excluded by Banks Banks Banks
Madrid 0.20 0.21 0.22 -
Malaga 0.02 - 0.06 0.05
Murcia - - 0.05 -
Navarra 0.20 - 0.12 0.21
Ourense 0.01 0.00 0.02 -
Palencia 0.23 - 0.14 -
Pontevedra 0.00 - 0.04 -
Salamanca 0.17 - 0.18 0.21
Segovia - - 0.21 -
Sevilla 0.27 - 0.06 0.08
Soria 0.18 - - -
Tarragona 0.14 - 0.18 -
Tenerife - - N.D -
Teruel - - 0.14 -
Toledo 0.12 - 0.17 0.02
Valencia - 0.11 0.14 0.15
Valladolid 0.08 0.11 0.23 -
Vizcaya 0.21 - 0.16 -
Zamora - - 0.05 0.00
Zaragoza - - 0.16 -
Total 0.13 0.12 0.11 0.08
Source: Own elaboration based on data from La Caixa (2009): Anuario Económico 2009
(Economic Yearbook 2009).

89
The comparison of two regions with very different socioeconomicfeatures, Andalusia and Catalonia, allows going deeply into the analysisof the causes of geographical financial exclusion. This is the aim ofchapter 4, which applies the methodology already defined in chapter 3,to give answers at a regional level to the following questions: What arethe levels of territorial financial exclusion in the studied regions? Is theexclusion of villages related with different socioeconomic features ineach region? What is the structure of the banking system in each regionregarding the different types of banking entities? Are the potentialdifferences in these structures related with the quantitative andqualitative differences regarding financial exclusion and inclusion?
4.1. Financial exclusion in Andalusia and Catalonia:analysis of factors.
4.1.1. Banking structure of regions and extent of branches
The banking structure in 2008, considered in percentage of bank branchesbelonging to every type of banking entities, differs notably in Andalusiaand Catalonia (figure 4.1 (next page)). While the weight of banks in bothregions is similar (about 29%), the savings banks sector is morerepresentative in Catalonia (69%) than in Andalusia (55%), andcooperative banks have much more importance in this last region (16%)than in Catalonia, where they are a very weak sector (2%).
4. TYPES OF BANKINGENTITIES AND FINANCIALINCLUSION: A COMPARATIVEANALYSIS IN CATALONIAAND ANDALUSIA
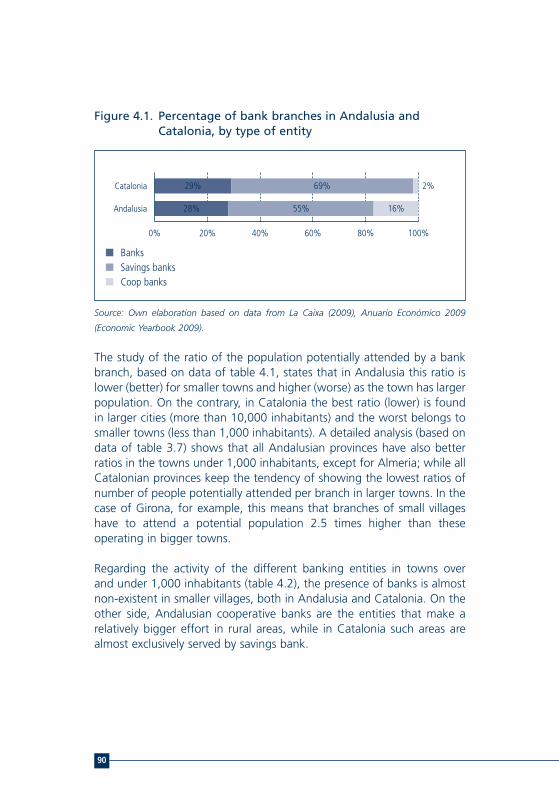
90
Figure 4.1. Percentage of bank branches in Andalusia andCatalonia, by type of entity
Source: Own elaboration based on data from La Caixa (2009), Anuario Económico 2009
(Economic Yearbook 2009).
The study of the ratio of the population potentially attended by a bankbranch, based on data of table 4.1, states that in Andalusia this ratio islower (better) for smaller towns and higher (worse) as the town has largerpopulation. On the contrary, in Catalonia the best ratio (lower) is foundin larger cities (more than 10,000 inhabitants) and the worst belongs tosmaller towns (less than 1,000 inhabitants). A detailed analysis (based ondata of table 3.7) shows that all Andalusian provinces have also betterratios in the towns under 1,000 inhabitants, except for Almeria; while allCatalonian provinces keep the tendency of showing the lowest ratios ofnumber of people potentially attended per branch in larger towns. In thecase of Girona, for example, this means that branches of small villageshave to attend a potential population 2.5 times higher than theseoperating in bigger towns.
Regarding the activity of the different banking entities in towns overand under 1,000 inhabitants (table 4.2), the presence of banks is almostnon-existent in smaller villages, both in Andalusia and Catalonia. On theother side, Andalusian cooperative banks are the entities that make arelatively bigger effort in rural areas, while in Catalonia such areas arealmost exclusively served by savings bank.
Catalonia
Andalusia
0% 20% 40% 60% 80% 100%
29% 69%
28% 55% 16%
2%
n Banksn Savings banksn Coop banks

91
% on % on total total
Size of towns region No Bank branches Population/(inhabitants) Population popul. branches in region branch
Andalusia Less than 1,000 102,621 1.3% 143 2.1% 718
1,000-5,000 827,889 10.1% 784 11.3% 1,056
5,000-10,000 741,250 9.0% 630 9.1% 1,177
More than 10,000 6,530,460 79.6% 5,355 77.5% 1,220
Catalonia Less than 1,000 192,328 2.6% 140 1.7% 1,374
1,000-5,000 597,721 8.1% 651 8.0% 918
5,000-10,000 580,840 7.9% 524 6.5% 1,108
More than 10,000 5,993,189 81.4% 6,787 83.8% 883
Table 4.1. Average of population potentially attended per bank branch
Banks Savings Banks Coop. Banks
No. No. No. branches % branches % branches %
AndalusiaTowns over 1,000 inhabitants 1,976 99.95% 3,783 97.37% 1,108 96.52%Towns under 1,000 inhabitants 1 0.05% 102 2.63% 40 3.48%Total 1,977 100% 3,885 100% 1,148 100%
CataloniaTowns over 1,000 inhabitants 2,352 99.24% 5,466 97.82% 140 100.00%Towns under 1,000 inhabitants 18 0.76% 122 2.18% 0 0.00%Total 2,370 100% 5,588 100% 140 100%
Table 4.2. Number and share of bank branches by kind of entity,population of towns and regions: Catalonia and Andalusia
Source: Own elaboration based on data from La Caixa (2009): Anuario Económico 2009 (Economic Yearbook 2009).
Source: Own elaboration based on data from La Caixa (2009): Anuario Económico 2009 (Economic Yearbook 2009).
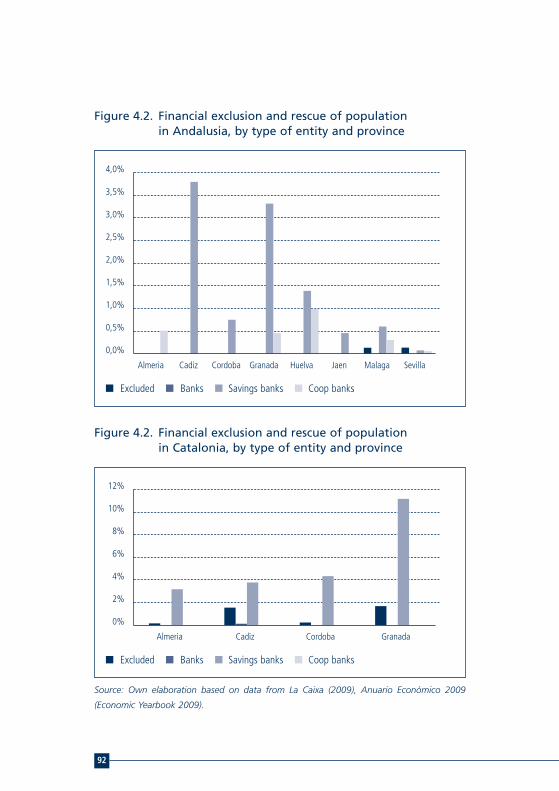
Figure 4.2. Financial exclusion and rescue of populationin Andalusia, by type of entity and province
Figure 4.2. Financial exclusion and rescue of populationin Catalonia, by type of entity and province
Source: Own elaboration based on data from La Caixa (2009), Anuario Económico 2009
(Economic Yearbook 2009).
92
4,0%
3,5%
3,0%
2,5%
2,0%
1,5%
1,0%
0,5%
0,0%
Almeria Cadiz Cordoba Granada Huelva Jaen Malaga Sevilla
n Excluded n Banks n Savings banks n Coop banks
12%
10%
8%
6%
4%
2%
0%
Almeria Cadiz Cordoba Granada
n Excluded n Banks n Savings banks n Coop banks
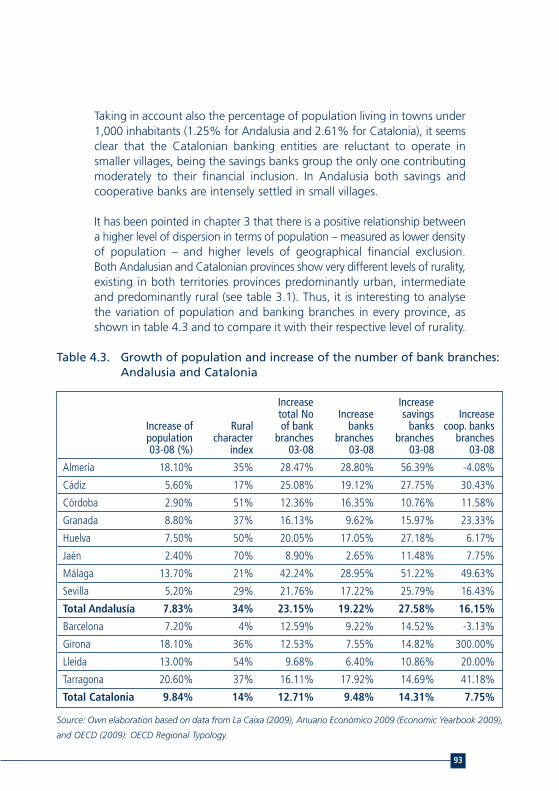
93
Taking in account also the percentage of population living in towns under1,000 inhabitants (1.25% for Andalusia and 2.61% for Catalonia), it seemsclear that the Catalonian banking entities are reluctant to operate insmaller villages, being the savings banks group the only one contributingmoderately to their financial inclusion. In Andalusia both savings andcooperative banks are intensely settled in small villages.
It has been pointed in chapter 3 that there is a positive relationship betweena higher level of dispersion in terms of population – measured as lower densityof population – and higher levels of geographical financial exclusion.Both Andalusian and Catalonian provinces show very different levels of rurality,existing in both territories provinces predominantly urban, intermediateand predominantly rural (see table 3.1). Thus, it is interesting to analysethe variation of population and banking branches in every province, asshown in table 4.3 and to compare it with their respective level of rurality.
Increase Increase total No Increase savings Increase
Increase of Rural of bank banks banks coop. bankspopulation character branches branches branches branches 03-08 (%) index 03-08 03-08 03-08 03-08
Almería 18.10% 35% 28.47% 28.80% 56.39% -4.08%
Cádiz 5.60% 17% 25.08% 19.12% 27.75% 30.43%
Córdoba 2.90% 51% 12.36% 16.35% 10.76% 11.58%
Granada 8.80% 37% 16.13% 9.62% 15.97% 23.33%
Huelva 7.50% 50% 20.05% 17.05% 27.18% 6.17%
Jaén 2.40% 70% 8.90% 2.65% 11.48% 7.75%
Málaga 13.70% 21% 42.24% 28.95% 51.22% 49.63%
Sevilla 5.20% 29% 21.76% 17.22% 25.79% 16.43%
Total Andalusía 7.83% 34% 23.15% 19.22% 27.58% 16.15%
Barcelona 7.20% 4% 12.59% 9.22% 14.52% -3.13%
Girona 18.10% 36% 12.53% 7.55% 14.82% 300.00%
Lleida 13.00% 54% 9.68% 6.40% 10.86% 20.00%
Tarragona 20.60% 37% 16.11% 17.92% 14.69% 41.18%
Total Catalonia 9.84% 14% 12.71% 9.48% 14.31% 7.75%
Table 4.3. Growth of population and increase of the number of bank branches:Andalusia and Catalonia
Source: Own elaboration based on data from La Caixa (2009), Anuario Económico 2009 (Economic Yearbook 2009),
and OECD (2009): OECD Regional Typology.
94
The growth of banking branches in all Andalusian provinces has beenmuch higher than the rate of growth of population. However, thoseprovinces with a lower index of rurality (Cadiz and Malaga) show a higherrate of growth of the number of banking branches. And supporting thisresult, the most rural provinces (Jaen and Cordoba) are those where thegrowth of branches has been the lowest.
Regarding Catalonia, the situation is the opposite: the number ofbanking branches has increased in all provinces between 2003 and 2008,but in three of them less than the number of inhabitants. It is just inBarcelona where the increase of branches is 5 points higher than theincrease of population. This is clearly reflected in the total number ofbranches because Barcelona, the more dynamic economy in Catalonia,owns the 72% of total banking branches of the autonomous community.Barcelona is the most urban province in Catalonia, and jointly with Madrid,also in Spain. Nevertheless, the increase rates of banking branches andpopulation have been more proportioned in Catalonia (2.87 points ofdifference) than in Andalusia (15.32 points of difference), finding themost moderated difference in Lleida, predominantly rural province.
In Andalusia banking entities have made a higher effort to extent theirbranches network, reducing the rate of people attended by every branch,fact that can help to the financial inclusion of under-attended groups ofpopulation due to geographical reasons. Notwithstanding, this inclusioneffort has been more intensive in areas with low level of rurality.And meanwhile, the ratio of people attended per branch has worsenedin the Catalonian provinces with high or intermediate levels of rurality,favouring the increase of financial exclusion. Barcelona must be considereda singular case, and shows that important urban areas follow differentdynamics regarding banking coverage.
Analysing the different kinds of banking entities, it is highlighted thatsavings banks have most increased their network of branches in bothregions. There are just falls in the number of branches of cooperativebanks in Almeria and Barcelona, none of them with high rurality levels.

94 Excepting the village of Castilleja de Guzmán.
95
4.1.2. Financial exclusion: towns without bank branches
There are a higher number of excluded towns with more than 1,000inhabitants in Catalonia (25) than in Andalusia (3) (see table 4.4 andtable 4.5 on the next page). In both regions they have a low average sizeand medium-low population density94, which suggests a rural character inmany cases. But analysing the Andalusian case, we found that the threeexcluded villages belong to the richest and predominantly urbanprovinces (Seville and Malaga), and one of them, Castilleja de Guzmán,has an unusual population density (1,343.5 inhabitants per squarekilometre), belonging to the suburban area of Seville city. Therefore, itcan be stated that in Andalusia rural financial exclusion is a minorproblem (0.52% of towns over 1,000 inhabitants), and there are otherfactors determining the risk of facing financial exclusion.
In Catalonia, these 25 villages comprise 5.39% of the total of towns over1,000 inhabitants (table 4.5). In the provinces of Girona and Tarragona,both of intermediate rural character, the situation is even graver and thisrate rises to 9.89% and 9.09%, respectively. In addition, 7 of thesevillages are located in the province of Barcelona, despite their weight interms of population share is not as important as in the other lesspopulated provinces. Polarisation in the banking supply of urban andrural areas is evident, with an ‘oblivion’ effect of the small villages insome provinces and of those close to large urban centres.
Several socioeconomic factors have been pointed from a theoreticalscope as risk factors regarding financial exclusion: rural areas, decrease ofpopulation, low average incomes and migrant population. Having inaccount that the data series are not too extensive, an analysis of thesesocioeconomic factors of the exclusion (table 4.6 on the page 98) showsa direct correlation between the level of exclusion and the increase ofprovincial population in Catalonia. This increase may involve villages thathad less than 1,000 inhabitants in previous years but have recently gonebeyond this number, and at present keep financially excluded, despitebeing attractive to settle a bank branch. There is another evidence ofcorrelation between the rate of migrant population, potentially relatedwith the increase of population, and the level of financial exclusion.
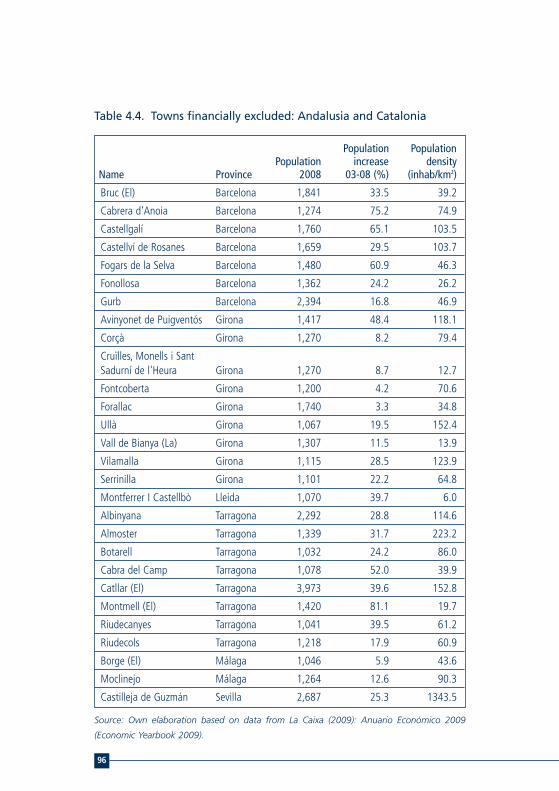
96
Table 4.4. Towns financially excluded: Andalusia and Catalonia
Source: Own elaboration based on data from La Caixa (2009): Anuario Económico 2009
(Economic Yearbook 2009).
Population Population Population increase density
Name Province 2008 03-08 (%) (inhab/km2)
Bruc (El) Barcelona 1,841 33.5 39.2
Cabrera d'Anoia Barcelona 1,274 75.2 74.9
Castellgalí Barcelona 1,760 65.1 103.5
Castellví de Rosanes Barcelona 1,659 29.5 103.7
Fogars de la Selva Barcelona 1,480 60.9 46.3
Fonollosa Barcelona 1,362 24.2 26.2
Gurb Barcelona 2,394 16.8 46.9
Avinyonet de Puigventós Girona 1,417 48.4 118.1
Corçà Girona 1,270 8.2 79.4
Cruïlles, Monells i SantSadurní de l'Heura Girona 1,270 8.7 12.7
Fontcoberta Girona 1,200 4.2 70.6
Forallac Girona 1,740 3.3 34.8
Ullà Girona 1,067 19.5 152.4
Vall de Bianya (La) Girona 1,307 11.5 13.9
Vilamalla Girona 1,115 28.5 123.9
Serrinilla Girona 1,101 22.2 64.8
Montferrer I Castellbò Lleida 1,070 39.7 6.0
Albinyana Tarragona 2,292 28.8 114.6
Almoster Tarragona 1,339 31.7 223.2
Botarell Tarragona 1,032 24.2 86.0
Cabra del Camp Tarragona 1,078 52.0 39.9
Catllar (El) Tarragona 3,973 39.6 152.8
Montmell (El) Tarragona 1,420 81.1 19.7
Riudecanyes Tarragona 1,041 39.5 61.2
Riudecols Tarragona 1,218 17.9 60.9
Borge (El) Málaga 1,046 5.9 43.6
Moclinejo Málaga 1,264 12.6 90.3
Castilleja de Guzmán Sevilla 2,687 25.3 1343.5
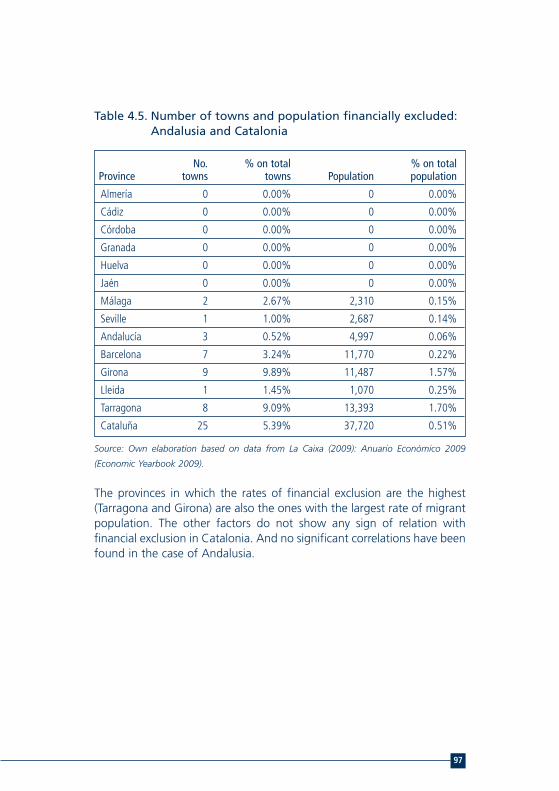
97
Table 4.5. Number of towns and population financially excluded:Andalusia and Catalonia
Source: Own elaboration based on data from La Caixa (2009): Anuario Económico 2009
(Economic Yearbook 2009).
The provinces in which the rates of financial exclusion are the highest(Tarragona and Girona) are also the ones with the largest rate of migrantpopulation. The other factors do not show any sign of relation withfinancial exclusion in Catalonia. And no significant correlations have beenfound in the case of Andalusia.
No. % on total % on totalProvince towns towns Population population
Almería 0 0.00% 0 0.00%
Cádiz 0 0.00% 0 0.00%
Córdoba 0 0.00% 0 0.00%
Granada 0 0.00% 0 0.00%
Huelva 0 0.00% 0 0.00%
Jaén 0 0.00% 0 0.00%
Málaga 2 2.67% 2,310 0.15%
Seville 1 1.00% 2,687 0.14%
Andalucía 3 0.52% 4,997 0.06%
Barcelona 7 3.24% 11,770 0.22%
Girona 9 9.89% 11,487 1.57%
Lleida 1 1.45% 1,070 0.25%
Tarragona 8 9.09% 13,393 1.70%
Cataluña 25 5.39% 37,720 0.51%

98
GDP
per
% fi
n. e
xcl.
Rura
l G
DP P
ERCá
pita
GDP
Popu
latio
non
tota
lch
arac
ter
Rura
lCá
pita
Spai
n in
dex
incr
ease
% m
igra
ntin
crea
sePr
ovin
ce
popu
latio
nin
dex
Typo
logy
2006
= 1
0020
06po
pula
tion
03-0
8 (%
)
Alm
ería
0.00
%35
%IN
20,1
7290
.5%
3.6%
19.7
%18
.1
Cádi
z0.
00%
17%
IN17
,729
79.5
%7.
1%3.
5%5.
6
Córd
oba
0.00
%51
%IN
15,2
0468
.2%
8.2%
2.7%
2.9
Gra
nada
0.00
%37
%IN
16,0
1871
.9%
10.8
%6.
5%8.
8
Huel
va0.
00%
50%
IN18
,521
83.1
%4.
9%7.
3%7.
5
Jaén
0.00
%70
%PR
14,3
9464
.6%
7.1%
2.8%
2.4
Mál
aga
0.15
%21
%PU
17,8
6180
.1%
4.3%
16.0
%13
.7
Sevi
lle0.
14%
29%
PU17
,854
80.1
%6.
4%3.
3%5.
2
Barc
elon
a0.
22%
4%PU
26,2
9111
7.9%
6.1%
13.8
%7.
2
Giro
na1.
57%
36%
IN27
,082
121.
5%7.
8%20
.4%
18.1
Llei
da0.
25%
54%
PR25
,840
115.
9%6.
9%16
.2%
13
Tarra
gona
1.70
%37
%IN
25,8
1211
5.8%
3.4%
17.7
%20
.6
Coef
. Cor
rel.
Coef
. Cor
rel.
Coef
. Cor
rel.
Coef
. Cor
rel.
Coef
. Cor
rel.
Anda
lucía
-0.4
860
0.20
86-0
.326
50.
1920
0.16
94
Cata
loni
a0.
2247
0.30
91-0
.331
70.
8241
0.91
64
Tab
le 4
.6.F
inan
cial
exc
lusi
on
an
d r
isk
fact
ors
, by
pro
vin
ce: A
nd
alu
sia
and
Cat
alo
nia
Sour
ce:
Ow
n el
abor
atio
n ba
sed
on d
ata
from
La
Cai
xa (
2009
), A
nuar
io E
conó
mic
o 20
09 (
Econ
omic
Yea
rboo
k 20
09);
OEC
D (
2009
): O
ECD
Reg
iona
l Typ
olog
y.So
urce
; an
d In
stitu
to N
acio
nal d
e Es
tadí
stic
a.

99
4.2. Financial ‘rescue’ developed by the different typesof banking entities.
Applying the definition and methodology established in chapter 3 to thecomparison of the regional cases of Andalusia and Catalonia, it is worthmentioning the following (see table 4.7 on the next page):
n Savings banks make the main contribution to financial inclusion, bothin Andalusia and in Catalonia, region in which they are almost the onlykind of entity promoting inclusion. In fact, savings banks rescue agreat amount of small villages in Barcelona province, financially‘forgotten’ in relation to the important urban and financial centre ofBarcelona city and surroundings.
n Cooperative banks are also a relatively important player in the financialinclusion of Andalusian towns, but only in some provinces, whichshows a clear link of this kind of entities with certain territories.However, their effort in territorial financial rescue is comparatively thehighest in relation to the size and volume of activity of the sector.The narrow link that cooperative banks have with certain territories,with detriment to those where they have not had much development isillustrated by the case of Catalonia, where their presence is insignificantand their contribution to financial inclusion of villages is null.
n Banks do not contribute to financial inclusion in Andalusia, and do itat a very low level in Catalonia. They show preference to settle theirbranches in urban and larger centres of population.
n In terms of population, the important role of the savings banks needsto be highlighted, since they potentially include 4.23% of inhabitantsof Catalonia, this is, 311,683 people that would become financiallyunattended if these banking branches under discussion are retiredfrom their towns of residence. This rate rises up to 11.23% of thepopulation in the province of Tarragona. In Andalusia the savingsbanks sector is also the main contributor to the financial inclusion interms of population, rescuing 104,239 people, with an especially relevantrole in the provinces of Granada and Cadiz.

100
Rescued Rescued TotalRescued by Savings by Coop. No. of
Excluded by Banks Banks Banks towns
Almería 0 0 0 3 3
Cádiz 0 0 11 0 11
Córdoba 0 0 4 0 4
Granada 0 0 22 3 25
Huelva 0 0 3 3 6
Jaén 0 0 2 0 2
Málaga 2 0 4 3 9
Seville 1 0 1 1 3
Andalusía 3 0 47 13 63
Barcelona 7 1 62 0 70
Girona 9 2 13 0 24
Lleida 1 0 13 0 14
Tarragona 8 0 37 0 45
Catalonia 25 3 125 0 153
Rescued Rescued Rescued by Savings by Coop. Total
Excluded by Banks Banks Banks population
Almería 0 0 0 3,504 3,504
Cádiz 0 0 46,403 0 46,403
Córdoba 0 0 6,092 0 6,092
Granada 0 0 30,098 4,199 34,297
Huelva 0 0 7,155 5,134 12,289
Jaén 0 0 3,179 0 3,179
Málaga 2,310 0 9,703 4,926 16,939
Seville 2,687 0 1,609 1,425 5,721
Andalusía 4,997 0 104,239 19,188 128,424
Barcelona 11,770 3,971 176,589 0 192,330
Girona 11,487 1,080 27,847 0 40,414
Lleida 1,070 0 18,691 0 19,761
Tarragona 13,393 0 88,556 0 101,949
Catalonia 37,720 5,051 311,683 0 354,454
Table 4.7. Relative ratios (No of towns and population) of financial exclusionand rescue, by kinds of banking entities: Andalusia and Catalonia

95 It must have in account the distortion effect of Castilleja de Guzmán, the only excludedtown in Seville province, with an extremely high density of population.
101
4.2.1. Socioeconomic analysis of financially ‘rescued’ population.
Regarding the socioeconomic features of rescued towns, the research studyshows the following results in terms of population (table 4.8 (next page)):
n Villages rescued by cooperative banks are, as well as the excludedones, the smallest ones, and show a major rural character having thelowest rates of population density. Savings banks, both in Andalusiaand Catalonia rescue towns with a higher average size, which meansthat for this sector the size of the market, in addition to social criteria,is a factor to have in account before setting up bank branches. It isalso evident in the case of banks, whose rescue effort is very limited.
n The towns rescued by banks (only in Catalonia) show the highest ratesof population growth, with an average of near 40% during the fiveyears of analysis (2003-2008). Nevertheless, excluded villages in mostof the Catalonian provinces show similar rates, included Barcelona, whatsupport the hypothesis of the above mentioned ‘fast growth’ effect:the increase of population of a village in a short period may lead it toget a potentially attractive market size, but not getting the attentionand reaction of banking entities to set up branches. This may be alsoinfluenced by an ‘oblivion effect’ if the village is near a much largerand complex market. The rescue of some villages may respond to anexpectation of following high growth. However, the rescue of savingsbanks, both in Catalonia and Andalusia, has focused villages of much lowerrates of growth of population. There are lower also the highly dispersedrates of variation of population in villages rescued by cooperative banks.
n Regarding density of population, indicator of rurality, there is not aclear trend, but the excluded villages and those rescued by cooperativebanks tend to show the lowest rates95.
Savings Coop. Banks Banks Banks Total
Relative rate of rescue Andalusia 0.00% 84.45% 15.55% 123,427
Relative rate of rescue Catalonia 1.59% 98.41% 0.00% 316,734
Table 4.7. Relative ratios (No of towns and population) of financial exclusionand rescue, by kinds of banking entities: Andalusia and Catalonia
Source: Own elaboration based on data from La Caixa (2009): Anuario Económico 2009 (Economic Yearbook 2009).
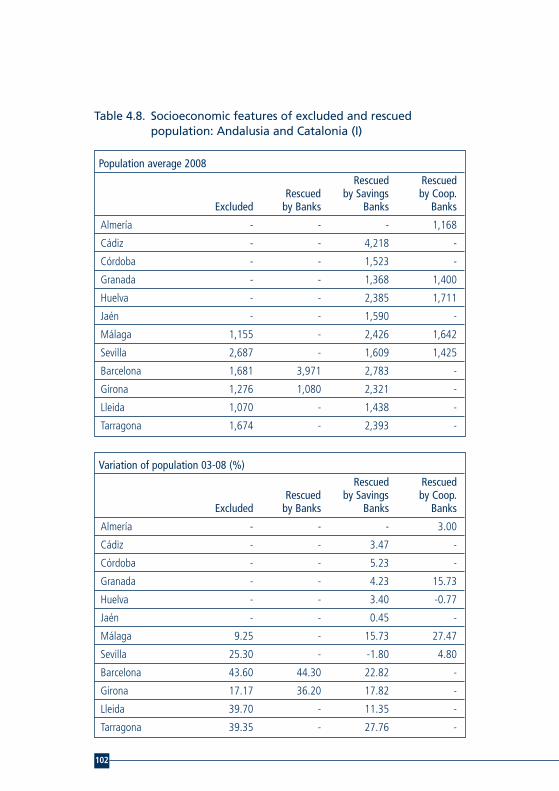
102
Population average 2008
Rescued RescuedRescued by Savings by Coop.
Excluded by Banks Banks Banks
Almería - - - 1,168
Cádiz - - 4,218 -
Córdoba - - 1,523 -
Granada - - 1,368 1,400
Huelva - - 2,385 1,711
Jaén - - 1,590 -
Málaga 1,155 - 2,426 1,642
Sevilla 2,687 - 1,609 1,425
Barcelona 1,681 3,971 2,783 -
Girona 1,276 1,080 2,321 -
Lleida 1,070 - 1,438 -
Tarragona 1,674 - 2,393 -
Variation of population 03-08 (%)
Rescued RescuedRescued by Savings by Coop.
Excluded by Banks Banks Banks
Almería - - - 3.00
Cádiz - - 3.47 -
Córdoba - - 5.23 -
Granada - - 4.23 15.73
Huelva - - 3.40 -0.77
Jaén - - 0.45 -
Málaga 9.25 - 15.73 27.47
Sevilla 25.30 - -1.80 4.80
Barcelona 43.60 44.30 22.82 -
Girona 17.17 36.20 17.82 -
Lleida 39.70 - 11.35 -
Tarragona 39.35 - 27.76 -
Table 4.8. Socioeconomic features of excluded and rescuedpopulation: Andalusia and Catalonia (I)

103
Source: Own elaboration based on data from La Caixa (2009): Anuario Económico 2009
(Economic Yearbook 2009).
Unemployment data are analysed in table 4.9 (on the next page),which shows the following results:
n The highest levels of unemployment rates are found in the excludedtowns of Catalonia. This can be considered to be another indicator ofthis ‘oblivion’ effect of some towns in rich regions, which may becomeareas of social exclusion. In Andalusia, the highest rates of unemploymentare found in the villages rescued by the saving banks, while in theserescued by cooperative banks these rates are relatively low.
Density of population (inhab/km2)
Rescued RescuedRescued by Savings by Coop.
Excluded by Banks Banks Banks
Almería - - - 22.59
Cádiz - - 75.07 -
Córdoba - - 9.08 -
Granada - - 71.84 46.34
Huelva - - 29.56 31.50
Jaén - - 10.53 -
Málaga 66.93 - 75.94 70.95
Sevilla 1343.50 - 6.21 18.51
Barcelona 62.96 220.61 219.42 -
Girona 74.50 56.84 163.10 -
Lleida 6.05 - 72.15 -
Tarragona 94.79 - 205.68 -
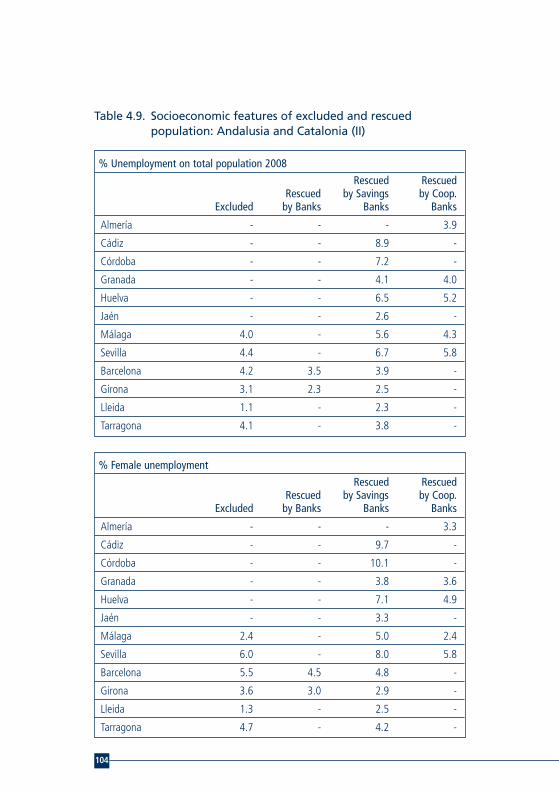
104
% Unemployment on total population 2008
Rescued RescuedRescued by Savings by Coop.
Excluded by Banks Banks Banks
Almería - - - 3.9
Cádiz - - 8.9 -
Córdoba - - 7.2 -
Granada - - 4.1 4.0
Huelva - - 6.5 5.2
Jaén - - 2.6 -
Málaga 4.0 - 5.6 4.3
Sevilla 4.4 - 6.7 5.8
Barcelona 4.2 3.5 3.9 -
Girona 3.1 2.3 2.5 -
Lleida 1.1 - 2.3 -
Tarragona 4.1 - 3.8 -
% Female unemployment
Rescued RescuedRescued by Savings by Coop.
Excluded by Banks Banks Banks
Almería - - - 3.3
Cádiz - - 9.7 -
Córdoba - - 10.1 -
Granada - - 3.8 3.6
Huelva - - 7.1 4.9
Jaén - - 3.3 -
Málaga 2.4 - 5.0 2.4
Sevilla 6.0 - 8.0 5.8
Barcelona 5.5 4.5 4.8 -
Girona 3.6 3.0 2.9 -
Lleida 1.3 - 2.5 -
Tarragona 4.7 - 4.2 -
Table 4.9. Socioeconomic features of excluded and rescuedpopulation: Andalusia and Catalonia (II)

105
Source: Own elaboration based on data from La Caixa (2009): Anuario Económico 2009
(Economic Yearbook 2009).
Regarding economic activity and access to telecommunication facilities,tables 4.10 and 4.11 (next page) allow extracting the following analysis:
n In terms of commercial activity, the Andalusian towns rescued by thesavings banks are more active than those financially included or rescuedby cooperative banks. We find here another evidence of the settlementof savings banks branches in towns with a certain market potential.In Catalonia, villages rescued by banks have relatively higher rates of buildingindustry, which can mean that these are residential areas in development.
n Just like for the general case of Spain, towns with less consumercapacity are the excluded and the rescued by cooperative banks.Towns rescued by the banks have the highest consumer capacity, aswell as the best rates of access to telecommunications. This findingsupports the idea that banks focus their financial rescue only onresidential rich areas. Andalusia shows much lower levels of access totelecommunications, which suggests that on-line banking will noteasily replace bank branches there.
% Unemployment of people over 50 years
Rescued RescuedRescued by Savings by Coop.
Excluded by Banks Banks Banks
Almería - - - 2.6
Cádiz - - 6.1 -
Córdoba - - 4.6 -
Granada - - 2.1 1.5
Huelva - - 4.7 2.9
Jaén - - 1.4 -
Málaga 2.1 - 3.9 1.5
Sevilla 6.4 - 5.3 4.0
Barcelona 3.9 4.2 3.9 -
Girona 2.8 1.4 2.0 -
Lleida 0.0 - 1.3 -
Tarragona 3.4 - 2.9 -
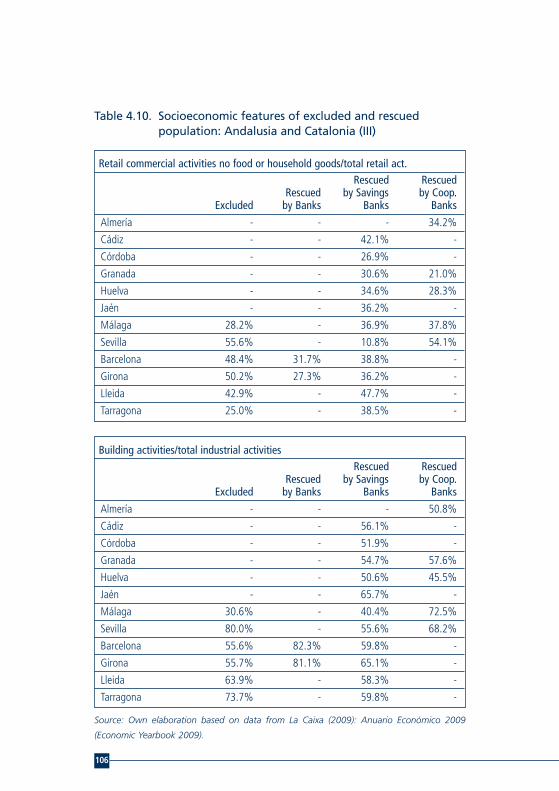
106
Retail commercial activities no food or household goods/total retail act. Rescued Rescued
Rescued by Savings by Coop.Excluded by Banks Banks Banks
Almería - - - 34.2%
Cádiz - - 42.1% -
Córdoba - - 26.9% -
Granada - - 30.6% 21.0%
Huelva - - 34.6% 28.3%
Jaén - - 36.2% -
Málaga 28.2% - 36.9% 37.8%
Sevilla 55.6% - 10.8% 54.1%
Barcelona 48.4% 31.7% 38.8% -
Girona 50.2% 27.3% 36.2% -
Lleida 42.9% - 47.7% -
Tarragona 25.0% - 38.5% -
Building activities/total industrial activitiesRescued Rescued
Rescued by Savings by Coop.Excluded by Banks Banks Banks
Almería - - - 50.8%
Cádiz - - 56.1% -
Córdoba - - 51.9% -
Granada - - 54.7% 57.6%
Huelva - - 50.6% 45.5%
Jaén - - 65.7% -
Málaga 30.6% - 40.4% 72.5%
Sevilla 80.0% - 55.6% 68.2%
Barcelona 55.6% 82.3% 59.8% -
Girona 55.7% 81.1% 65.1% -
Lleida 63.9% - 58.3% -
Tarragona 73.7% - 59.8% -
Table 4.10. Socioeconomic features of excluded and rescuedpopulation: Andalusia and Catalonia (III)
Source: Own elaboration based on data from La Caixa (2009): Anuario Económico 2009
(Economic Yearbook 2009).

107
Market shareRescued Rescued
Rescued by Savings by Coop.Excluded by Banks Banks Banks
Almería - - - 2
Cádiz - - 7 -
Córdoba - - 3 -
Granada - - 3 3
Huelva - - 4 3
Jaén - - 3 -
Málaga 2 - 5 3
Sevilla 3 - 3 3
Barcelona 3 7 6 -
Girona 3 3 5 -
Lleida 2 - 4 -
Tarragona 3 - 5 -
Fixed phone lines/ inhabitantRescued Rescued
Rescued by Savings by Coop.Excluded by Banks Banks Banks
Almería - - - 0.27
Cádiz - - 0.21 -
Córdoba - - 0.29 -
Granada - - 0.29 0.30
Huelva - - 0.24 0.24
Jaén - - 0.28 -
Málaga 0.21 - 0.26 0.25
Sevilla 0.32 - 0.36 0.30
Barcelona 0.45 0.42 0.44 -
Girona 0.46 0.53 0.46 -
Lleida 0.37 - 0.45 -
Tarragona 0.35 - 0.40 -
Table 4.11. Socioeconomic features of excluded and rescuedpopulation: Andalusia and Catalonia (IV)

Table 4.11. Socioeconomic features of excluded and rescuedpopulation: Andalusia and Catalonia (IV)
Source: Own elaboration based on data from La Caixa (2009): Anuario Económico 2009
(Economic Yearbook 2009).
108
Lines of broad band/inhabitant
Rescued RescuedRescued by Savings by Coop.
Excluded by Banks Banks Banks
Almería - - - 0.03
Cádiz - - 0.05 -
Córdoba - - 0.06 -
Granada - - 0.05 0.04
Huelva - - 0.04 0.03
Jaén - - 0.04 -
Málaga 0.02 - 0.06 0.05
Sevilla 0.27 - 0.06 0.08
Barcelona 0.18 0.28 0.21 -
Girona 0.21 0.24 0.20 -
Lleida 0.13 - 0.16 -
Tarragona 0.14 - 0.18 -

109
5.1. Conclusions regarding financial exclusion
n Geographical financial exclusion in Spain is still moderate, as only 2.8%of towns over 1,000 inhabitants lack bank branches, comprising 0.35%of the total Spanish population. These are mainly small villages,having an average of 1,628 inhabitants, and are located mainly intwo kinds of areas: in highly rural regions (e.g. the province of Leon)but also close to large urban centres (e.g. the province of Barcelona).There is an ‘oblivion effect’ regarding the smaller towns inpredominantly urban and rich provinces, where banking activity isconcentrated in big cities (Madrid, Barcelona, and Vizcaya).
n Excluded towns used to have low population density, which is a signof rural character, but they show growing population. This couldmean that they have recently become profitable markets for banks,but these have not reacted yet by creating branches. However it is notvery likely to happen during a phase of branches networks reduction,and particularly if the population growth stems from to the settlementof migrants, as this has been identified also as a risk factor for financialexclusion. In fact, there are evidences of higher rates of financialexclusion and higher demographic weight of migrant population.
n The potential coverage of population per bank branch shows worstratios in larger towns. Thus, it seems that in urban centres there is ahigher risk of financial exclusion due to social factors. In fact, excludedtowns have less unemployment rates and similar economic activityratio to rescued ones.
5. CONCLUSIONS

n There is no geographical financial exclusion in many Spanish regionswith low rate of income which means that banking entities, mainlysavings banks and in some regions cooperative banks, pay specialattention to promote there financial inclusion by the settlement ofbranches.
n As the compared analysis of two regions has demonstrated, bankingstructure differs notably among Spanish regions. It is a very importantfactor for the level of geographical financial exclusion and alsodetermines the socioeconomic features of the excluded population.The strong link of banking entities with the territory – again savingsbanks and cooperative banks, but also local banks in provinces asBadajoz – is a factor of prevention of the financial exclusion,particularly in rural areas.
5.2. Conclusions regarding financial rescue orfinancial inclusion
n 19% of towns and 2.69% of people living in towns over 1,000inhabitants face risk of geographical financial exclusion96. Most ofthem, comprising 2.14% of this population, are financially rescuedby savings banks, which provide banking services in towns with nocompetition with other types of entities.
n However, the comparative analysis between regions shows that savingsbanks behaviour in terms of financial rescue or geographical inclusionof towns may vary in different regions. Often, it is more careful inpoorer regions.
n The rescue of the smallest and more rural villages is more effective inthe regions where there is a strong sector of cooperative banks. In fact,this is the kind of entity that makes a relatively larger effort in rescuingtowns financially, compared to its total activity.
110
96 In the sense that it has been defined in chapter 3, as living in towns where banking servicesthrough branch are provided by only one type of banking entities (banks, savings banks orcooperative banks).

n Banks contribute scarcely to the geographical financial inclusion,and do it only in the case of a clear territorial link or in towns withresidential character and a higher income level.
n Regarding the socioeconomic features of rescued towns, it ishighlighted that banking entities tend to rescue towns with a higherlevel of incomes or economic potential, particularly in the case ofbanks, and with larger size in terms of population (except in the caseof cooperative banks). A higher activity in the building sector seemsalso to promote the financial rescue of towns.
n There are already several Spanish regions with difficulties in the accessto on-line banking, due to low development of telecommunicationsfacilities (phone lines and broad band). These difficulties are moreusual in autonomous communities with high risk of geographicalfinancial exclusion (e.g. Extremadura and Galicia).
n After five years of continuous and generalized growth of the numberof banking branches in all Spanish regions, it was observed already in2009 a turn of this trend, with a general deceleration and decrease insome regions as Catalonia. This fact constitutes an evidence of anexpected worsening in Spain of the coverage ratio regarding bankingprovision by branch.
5.3. General conclusions
Spain is a country with relatively low levels of financial exclusion,regarding the European standard of similar countries. It is also highlightedas having the best coverage ratio of banking services of the EU, measuredby number of branches per volume of population. The intensive workmade since the 19th century by the savings banks sector regardinggeographic financial inclusion, and also in rural areas and smaller villagesby the cooperative banks sector, due in both cases to their narrowterritorial links, has lead to this situation at the end of the first decade ofthe 21st century. Nevertheless, in the turn of the decade, the scenario israpidly changing in Spain and there are new issues to have in account interms of financial exclusion. For this reason, it seems also to be the timeto redefine the principles, orientation and aims of banking entities.
111
n There is an important risk of growing geographical financial exclusionin Spain in the future years, due to a decrease in the number of bankbranches, and to the gradual adoption of productivity criteria, as themaximization of profit margin by bank branches, by socially-orientedentities, to the detriment of their traditional financial inclusion vocation.The lost of the traditionally strong link of savings banks and cooperativebanks with the territory may cause the disappearance of many branchesin rural and/or poor areas that will become financially unattended.
n The restructuring process of the Spanish savings banks industry, whichhas been underway since 2008 (i.e. the year of reference of this study),has involved measures to increase the solvency levels in these entitiesand to meet the requirements imposed by the government. This kindof measures is expected to have a real impact on the supply of retailbanking services by branch, in a medium term97.
n The previous processes – and simultaneous in the temporal scopeto this study – of internationalization and merging among banks,profit-oriented entities, may have also influenced their rhythm ofsettlement of branches in Spain, quite slower than those of social-oriented entities. Merging processes usually lead to reduce thenumber of branches by removal of duplicated networks.
n The potential rise of the general financial exclusion levels in Spaincould mean, like in other European countries, a higher increase ofrural exclusion levels.
n The characteristics of the Spanish rural areas will favour the increaseof financial exclusion because of lack of bank branches, while on-lineor distance banking does not seem to fit completely as an alternativesolution. On-line banking should be introduced combined withan adequate service by bank branch, mainly in the areas and groupsof population with less technological culture. Otherwise, the risk offinancial exclusion will not be determined only by living in a small orrural village but also by technological illiteracy and distrust of severalsocial groups.
112
97 This process has been regulated by the Royal Low-Decree 9/2009, known as ‘FROB Law’,by the Royal Law-Decree 11/2010, about government boards and other aspects of legalregime of Savings Banks, and finally the Royal Low-Decree 2/2011 to reinforcement of theSpanish Financial System.

n The lack of financial culture is another factor to have in account whenassessing the consequences of the absence of banking branches in aterritory. Following the features of the Spanish financial culture,people relies a great part of their financial decisions upon the staff ofbanking branches. Precisely, it is in rural and deprived areas where thelevels of financial education are lower, and where people have greaterneeds regarding financial information and advice in order to choosethe services that fit them. Neither on-line banking nor attendance byunknown staff of branches out from their area of residence, do notallow meeting those needs.
n Both savings banks and cooperative banks, being socially-orientedbanking entities, should actively incorporate the growing risk ofincrease of financial exclusion, in their geographical expansion policiesand decisions, in order to minimize the potential impact on this issue.Former principles and values of those socially-oriented kinds ofbanking entities might be reviewed and used as inspiration to definethe current and future policies of social responsibility.
n Spanish banking entities does not have to relate financial inclusiononly with microcredit, as this is a quite specific tool, not main -streaming, and usually not developed as a business activity, but as asocial commitment. Providing at least basic access to transactionaccounts to any person has to be assumed by banking entities as anobjective within their corporate social responsibility.
n Despite the positive results of self-regulation in the banking sectorregarding financial exclusion80, in Spain it has had not much trajectory.The current experiences of the quoted Spanish banking sector, basedon a voluntary development of CSR, are not enough to address thechallenges of financial exclusion in this country. In fact, most ofthe initiatives, programs and information related to this issue from aCSR point of view are carried out in developing countries.
113
80 See as example, European Commission (2008), chapter 10.

n In this sense, Spanish public authorities should revise their role in thepromotion of financial inclusion. Previously, they have been linked tothe savings banks and cooperative banks sectors, being an importantplayer in determining the socially oriented policies of these entities.However, in the near future, public authorities will have to considerother measures to guarantee the adequate dealing with financialexclusion, such as its periodical study and control, developing effectivepublic policies (i.e. financial education, literacy on the use of newtechnologies), setting up agreements with banking entities to provideminimal banking services to socially excluded groups, or evendeveloping the legal regulation of the access to basic banking servicesand its recognition as a basic right for citizens.
114

115
n AALBERS, Manuel. “Control institucional del 'redlining' bancario: laexclusión financiera de áreas urbanas deprimidas”. Quaderns de PolíticaEconòmica, electronic review, Vol. 5, Sept-Dec 2003. Universidad deValencia. Valencia, 2003. 36-48.
n BANCO DE ESPAÑA (ed.). Informe Anual 2011. Madrid, 2012. n BANCO DE ESPAÑA (ed.). Informe Anual 2008. Madrid, 2009. n BANCO DE ESPAÑA (ed.). Boletín Estadístico 1/2009.Madrid 2009 n BANCO DE ESPAÑA (ed.). Encuesta Financiera de las Familias (EFF) 2005:
métodos, resultados y cambios entre 2002 y 2005. Boletín Económico,No. 12, Madrid, 2007.
n BERNAD, Cristina, Lucio FUENTELSAZ, Jaime GÓMEZ, Juan MAÍCAS,Sergio PALOMAS. ¿Existe riesgo de exclusión financiera en losmunicipios aragoneses de rentas bajas? Documento de trabajo 43/2007.Universidad de Zaragoza and Fundación Economía Aragonesa,FUNDEAR. Zaragoza, 2007.
n BOE (ed.) Real Decreto-ley 2/2011, de 18 de febrero, para elreforzamiento del sistema financiero. Boletín Oficial del Estado, SpanishGovernment. 19/02/2011.
n BOE (ed.). Real Decreto-ley 11/2010, de 9 de julio, de órganos degobierno y otros aspectos del régimen jurídico de las Cajas de Ahorros.Boletín Oficial del Estado, Spanish Government. 13/07/2010.
n BOE (ed.). Real Decreto-ley 9/2009, de 26 de junio, sobrereestructuración bancaria y reforzamiento de los recursos propiosde las entidades de crédito. Boletín Oficial del Estado, SpanishGovernment. 27/06/2009.
n BOE (ed.): LEY 45/2007, de 13 de diciembre, para el desarrollo sostenibledel medio rural. Boletín Oficial del Estado, Spanish Government.14/12/2007.
REFERENCES

n BOYCE, Gordon. “Valuing customers and loyalty: the rhetoric ofcustomer focus versus the reality of alienation and exclusion of(devalued) customers”. Critical Perspectives on Accounting, Vol. 11,2000, 649-689.
n CARBÓ, Santiago, E. GARDENER, P. MOLYNEUX. Financial Exclusion.Palgrave, Macmillan. Series: Studies in Banking and FinancialInstitutions, 2005.
n CARBÓ VALVERDE, Santiago, F. RODRÍGUEZ FERNÁNDEZ, R. LÓPEZDEL PASO. “Las cajas de ahorros: algo más que institucionesfinancieras”, Cuadernos de Información Económica, No. 158. Madrid,Fundación de las Cajas de Ahorros, 2002, 65-76.
n CARBÓ VALVERDE, Santiago, Rafael LÓPEZ DEL PASO. “Exclusiónfinanciera: un panorama”. Perspectivas del Sistema Financiero, No. 84.Madrid, Fundación de las Cajas de Ahorros, 2005, 1-12
n CARBÓ VALVERDE, Santiago, Rafael LÓPEZ DEL PASO. “La inclusiónfinanciera: Un paso cualitativo más”. Cuadernos de InformaciónEconómica, No. 170. Madrid, Fundación de las Cajas de Ahorros,2002, 79-90.
n CNMV, BANCO DE ESPAÑA (eds.). Plan de Educación Financiera2008-2012. Comisión Nacional del Mercado de Valores and Banco deEspaña – Eurosistema, concerted document, 2008.
n DE LA CUESTA, Marta, Beatriz FERNÁNDEZ, Orencio VÁZQUEZ.Razón de ser de la Banca Ética. Experiencias internacionales ynacionales, Colección Ensayos, No. 5. Madrid, Fundación de las Cajasde Ahorros, 2006.
n DE LA CUESTA, Marta, María Jesús MUÑOZ, María Ángeles FERNÁNDEZ.“The analysis of social performance in the Spanish financial industrythrough public data: A proposal”. Journal of Business Ethics 69 (3).2006.
n DELGADO MÁRQUEZ, Blanca, Francisco RODRÍGUEZ FERNÁNDEZ. “Elimpacto de la exclusión financiera en Europa: algo más queintegración financiera”. Perspectivas del Sistema Financiero, No. 88.Madrid, Fundación de las Cajas de Ahorros, 2006, 107-117.
n EUROPEAN COMMISSION (ed.). Financial Services Provision and Preventionof Financial Exclusion. Directorate-General for Employment, SocialAffairs and Equal Opportunities, European Communities, 2008.
n EUROPEAN COMMISSION (ed.). Initiatives in the Area of RetailFinancial Services. Accompanying document to the Communicationfrom the Commission to the European Parliament, the Council, theEuropean Economic and Social Committee and the Committee ofthe Regions, A single market for 21st century Europe. SEC(2007)1520. 20.11.2007 Brussels, 2007.
116

n FONT I VIDAL, Angel. La Transformació de les entitats de FinançamentInclusiu. Comparació entre les Caixes d'Estalvi i les Entitats deMicrocrèdit d'Amèrica Llatina. Barcelona, Universitat Ramon Llull, 2010.
n GARDENER E., Philip MOLYNEUX, Santiago CARBÓ. “La exclusiónfinanciera: un estudio comparativo”. Perspectivas del SistemaFinanciero, No. 84. Madrid, Fundación de las Cajas de Ahorros, 2005.13-24.
n LA CAIXA. Anuario Económico de España 2009. Servicio de Estudiosde "la Caixa", Barcelona. Caja de Ahorros y Pensiones de Barcelona,2009.
n MUÑOZ, María Jesús, María Ángeles FERNÁNDEZ, Marta DE LACUESTA. “Corporate social responsibility in the Banking system:A proposal to evaluate the Spanish Banking institutions performance.”3rd International Conference on Corporate Governance: ”CorporateGovernance and Corporate Social Responsibility”. Birmingham. 2005
n NIERI, Laura. “Access to Credit: the Difficulties of Households”.In ANDERLONI, Luisa, M.A. BRAGA, E.M. CARLUCCIO (eds.) NewFrontiers in Banking Services, part 2. Springer Berlin Heidelberg, 2007,107-140.
n OECD (ed.). OECD Regional Typology. Directorate for Public Governanceand Territorial Development. Organisation for Economic Co-operationand Development (OECD). Paris, 2009.
n PALOMO ZURDO, Ricardo Javier. (ed.) (2004): Banca cooperativa yeconomía social en Europa. Unión Nacional de Cooperativas de Crédito(UNACC), 2004.
n QUINTÁS SEOANE, Juan Ramón. “La Gestación del Modelo Españolde Cajas”. Papeles de Economía Española, No. 100, vol. I. Fundaciónde las Cajas de Ahorro. Madrid, 2004, 268-280.
n RIERA OLIVÉ, Santiago. Les Caixes d’Estalvis i la protecció social aCatalunya. Barcelona, Universitat Autònoma de Barcelona, 2005.
n SINCLAIR, Stephen P. Financial Exclusion: An Introductory Survey.Heriot Watt University, Centre for Research into Socially InclusiveServices (CRSIS). Scotland, 2001.
n WORLD BANK. Indicators of Financial Access - Household - Level Surveys.The World Bank Financial Sector Vice-Presidency. Washington 2005.
117

ON-LINE REFERENCES
n Banco de España. Encuesta Financiera de las Familias (Financial Surveyof Households), 2005:www.bde.es/webbde/es/estadis/eff/eff2005.html
n Comisión Nacional del Mercado de Valores: www.cnmv.es
n European Commission, Financial Inclusion:http://ec.europa.eu/internal_market/finservices-retail/inclusion_en.htm
n European Commission, Social Inclusion:http://ec.europa.eu/employment_social/spsi/financial_exclusion_en.htm
n Financial Services Authority, United Kingdom:www.fsa.gov.uk/
n Instituto Nacional de Estadística (Spanish National Institute of Statistics): www.ine.es/
n Red Española de Educación Financiera:www.rededucacionfinanciera.es/home.htm
118
ESBG – The European Voice of Savings and Retail Banking
ESBG (European Savings Banks Group) is an international banking associationthat represents one of the largest European retail banking networks,comprising about one third of the retail banking market in Europe, with totalassets of over € 7,600 billion, non-bank deposits of € 4,500 billion andnon-bank loans of € 4,200 billion (all figures on 31 December 2011). It representsthe interests of its members vis-à-vis the EU Institutions and generates,facilitates and manages high quality cross-border banking projects.
ESBG members are typically savings and retail banks or associations thereof.They are often organised in decentralised networks and offer their servicesthroughout their region. ESBG member banks have reinvested responsibly intheir region for many decades and are a distinct benchmark for corporatesocial responsibility activities throughout Europe and the world.
Rue Marie-Thérèse, 11 n B-1000 Brussels n Tel: +32 2 211 11 11 n Fax: +32 2 211 11 [email protected] n www.esbg.eu
Published by ESBG. Copyright ESBG December 2011. Responsible editor: Chris De Noose