
Performance Review
25
Performance Review of Thermal Power Stations 1999-00 Section-13 PAGE NO 136 SECTION -13 MATERIAL FOR PERFORMANCE REVIEW 1999-2000 SECTION –13 PART (A)-II EFFICIENY (STATION HEAT RATE) OF THERMAL POWER STATION Station Heat Rate (SHR) is an important factor to assess the efficiency of a thermal power station. Efficiency of TPS is a function of station heat rate and it is inversely proportional to SHR. If SHR reduces, efficiency increases, resulting in fuel saving. Station heat rate improvement also helps in reducing pollution from TPS. In this direction, Performance Evaluation Division of CEA had devised a Performa to monitor the various parameters of efficiency of thermal power stations. On monitoring, the data of station heat rate parameters had been received from 57 TPS during the year 1999-2000. The data of operating station heat rate parameters so received have been compiled & analysed for instituting an incentive scheme on Improved Station Heat Rate (SHR) and have been compared with design SHR of the above thermal power station, for the year 1999-2000. The analysis of station heat rate so carried out has been highlighted in Annexures – I, II & III. The analysis of Station Heat Rate parameters as given below has been carried out broadly in two categories of the stations with SHR variation between (a) 0-10% and (b) >10%. The stations under 0-10% categories have been considered as efficient and greater than 10% as poorly operating. All the stations analysed have used coal as primary fuel to generate power and oil as secondary fuel for starting purposes. Where as Neyveli and Kutch are lignite based TPS. The analysis has been carried out on the station basis. Station may comprise of any size of units. The following assumptions have been adopted: ASSUMPTIONS FOR ANALYASIS OF SHR PARAMETERS:- 1. Analysis of only those power stations has been carried out where data of at least 9 months operation was available. 2. Design station heat rate has been evaluated based on design data of turbine heat rate and boiler efficiency as submitted by TPS and compared with operating station heat. 3. The data of various parameters of station heat rate such as fuel’s calorific value generation, fuel consumption etc. have been taken from TPS authorities/SEB’s/utilities on monthly basis. 4. Actual oil consumption is converted into equivalent coal consumption and added to actual coal consumption to make it as effective coal for calculating heat rate w.r.t. coal GCV on monthly basis as oil consumption is less compared to coal.
-
Upload
manoj-upadhyay -
Category
Documents
-
view
21 -
download
2
description
performance review gives detailed analysis of performance analysis of thermal power plant.it gives detailed analytical analysis of power plant equipments.
Transcript of Performance Review

Performance Review of Thermal Power Stations 1999-00 Section-13 PAGE NO 136
SE CTIO N -13
MATERIAL FOR PERFORMANCE REVIEW 1999-2000
SECTION –13 PART (A)-II EFFICIENY (STATION HEAT RATE) OF THERMAL POWER STATION
Station Heat Rate (SHR) is an important factor to assess the efficiency of a thermal power station. Efficiency of TPS is a function of station heat rate and it is inversely proportional to SHR. If SHR reduces, efficiency increases, resulting in fuel saving. Station heat rate improvement also helps in reducing pollution from TPS. In this direction, Performance Evaluation Division of CEA had devised a Performa to monitor the various parameters of efficiency of thermal power stations. On monitoring, the data of station heat rate parameters had been received from 57 TPS during the year 1999-2000. The data of operating station heat rate parameters so received have been compiled & analysed for instituting an incentive scheme on Improved Station Heat Rate (SHR) and have been compared with design SHR of the above thermal power station, for the year 1999-2000. The analysis of station heat rate so carried out has been highlighted in Annexures – I, II & III. The analysis of Station Heat Rate parameters as given below has been carried out broadly in two categories of the stations with SHR variation between (a) 0-10% and (b) >10%. The stations under 0-10% categories have been considered as efficient and greater than 10% as poorly operating. All the stations analysed have used coal as primary fuel to generate power and oil as secondary fuel for starting purposes. Where as Neyveli and Kutch are lignite based TPS. The analysis has been carried out on the station basis. Station may comprise of any size of units. The following assumptions have been adopted: ASSUMPTIONS FOR ANALYASIS OF SHR PARAMETERS:- 1. Analysis of only those power stations has been carried out where data of at least 9
months operation was available. 2. Design station heat rate has been evaluated based on design data of turbine heat
rate and boiler efficiency as submitted by TPS and compared with operating station heat.
3. The data of various parameters of station heat rate such as fuel’s calorific value
generation, fuel consumption etc. have been taken from TPS authorities/SEB’s/utilities on monthly basis.
4. Actual oil consumption is converted into equivalent coal consumption and added
to actual coal consumption to make it as effective coal for calculating heat rate w.r.t. coal GCV on monthly basis as oil consumption is less compared to coal.
Performance Review of Thermal Power Stations 1999-00 Section-13 PAGE NO 137
Weighted average of coal GCV and oil GCV have been computed yearly for calculating heat rate for the year.
5. Oil GCV has been assumed as 10,000 Kcal/l in case any station has not submitted
the data of oil GCV. 6. All India figures are indicated on weighted average basis for available data for the
year 1999-2000. 7. Heat rate variation is indicated in minus (-) which means no improvement and
gain is indicated without any sign which means positive. The salient feature of station heat rate analysis are enumerated as below: SALIENT FEATURES OF THE STATION HEAT RATE DATA ANALYSIS:
1. The Station Heat Rate (SHR) deviation of operating SHR with respect to design SHR for the years 96-97, 97-98, 98-99 and 99-2000 is given at Annexure-I and highlights of outcomes are given below.
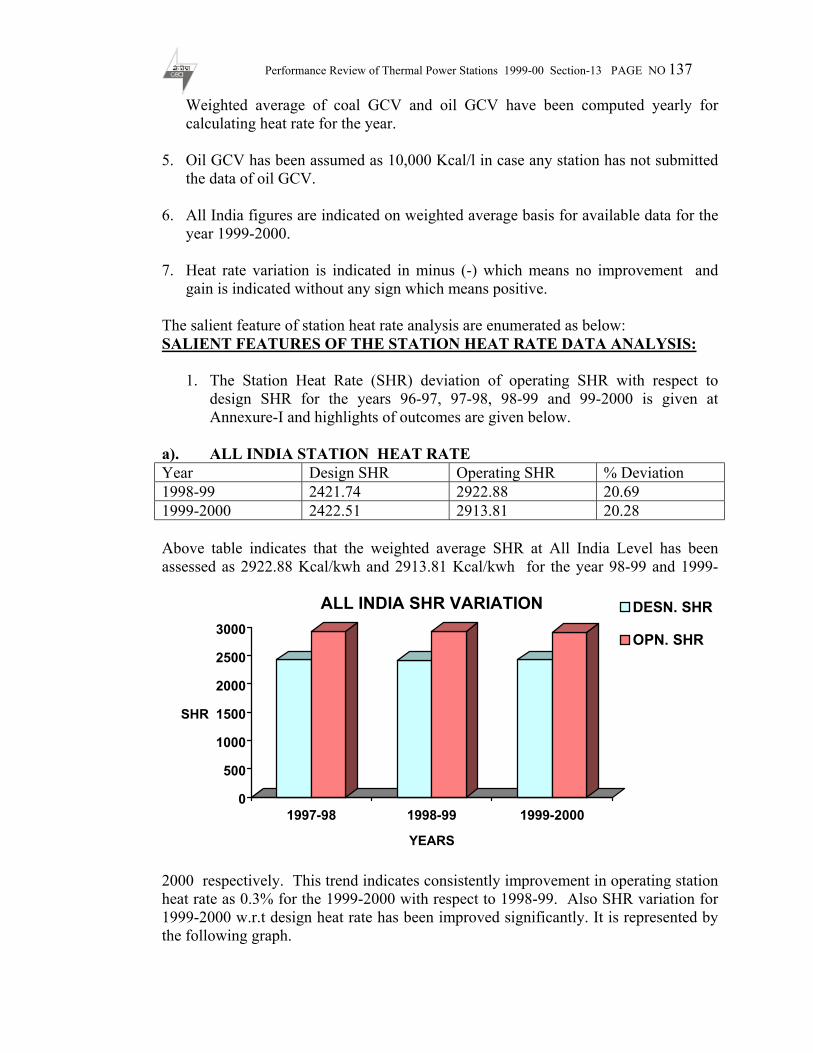
a). ALL INDIA STATION HEAT RATE Year Design SHR Operating SHR % Deviation 1998-99 2421.74 2922.88 20.69 1999-2000 2422.51 2913.81 20.28 Above table indicates that the weighted average SHR at All India Level has been assessed as 2922.88 Kcal/kwh and 2913.81 Kcal/kwh for the year 98-99 and 1999-
2000 respectively. This trend indicates consistently improvement in operating station heat rate as 0.3% for the 1999-2000 with respect to 1998-99. Also SHR variation for 1999-2000 w.r.t design heat rate has been improved significantly. It is represented by the following graph.
0
500
1000
1500
2000
2500
3000
SHR
1997-98 1998-99 1999-2000
YEARS
ALL INDIA SHR VARIATION DESN. SHR
OPN. SHR

Performance Review of Thermal Power Stations 1999-00 Section-13 PAGE NO 138
b) REGION WISE STATION HEAT RATE
Years Design SHR Operating SHR % Deviation
1998-99 2483.18 3172.14 27.75
Northern Region
1999-2000 2483.18 3173.78 27.81 1998-99 2426.26 2799.39 15.38 Southern
Region 1999-2000 2426.26 2780.01 14.58 1998-99 2379.85 2657.10 11.65 Western
Region 1999-2000 2379.68 2617.65 10.0 1998-99 2413.24 3193.48 32.33 Eastern
Region 1999-2000 2426.99 3388.16 39.6 The above table indicates that the OPSHR level of N.R. for the year 98-99& 99-2000 is almost the same. The OPSHR of S.R. for the 99-2000 is 2780 Kcal/Kwh. W.R. indicates that OPSHR for the 99-2000 improved to 2617 Kcal/Kwh as compared to OPSHR value of 2657 Kcal/Kwh of the year 98-99. However E.R. does not show any improvement in OPSHR. c) The number of efficient power stations during the years 1998-99 and 99-2000
stations whose SHR deviation w.r.t. design heat rate in the range of two categories (0-5%, 5-10%) are given in the following table. Details are given at Annexure-III..
Sl. No. Particulars 98-99 99-2000
1. Total station analysed 60 57 2. No. of stations in the range of SHR
deviation (0-5%)
8 9
3. No. of stations in the range of SHR deviation (5-10%)
8 12
4. Total efficient stations Sl. No.(2+3) in the range of (0-10%)
16 21
5. No. of stations with SHR deviation more than 10%
44 36
d) Amarkantak Phase-I and Ib Valley (OPGC) have been assessed as best stations
for 1998-99 with SHR deviation of 1.6% and 3.9% respectively. Amarkantak Phase-I, Ib Valley (OPGC) and Chandrapur (MSEB) have performed as best 1999-2000 with SHR deviation of 1.63%, 2.88% and 2.93% respectively.

Performance Review of Thermal Power Stations 1999-00 Section-13 PAGE NO 139
e) Harduaganj, Parichha, Barauni, Chandrapura (DVC), Nellore and Mulajore
(CESC) have been assessed as poorly performing TPS with SHR deviation more than 60% and upto 90%.
f) About 40 stations at an average of last three years are operating at very poor SHR having variation in SHR greater than 10% and upto 90%. These stations need proper monitoring and Energy Audit implementation.
g) The growth of no. of efficient power stations w.r.t. SHR for the year 1998-99, 99-2000 is 26% and 35% respectively. The growth rate is higher in 1999-2000 due to monitoring of SHR TPS. This can be visualized from Annexure-I
h) The Annexure –IV on Unit capacity group wise indicates that there is continuous improvement in OPSHR of the groups 250 MW, 200/210 MW, 120 MW for the year 1999-2000 .
2. Level of Improvement in Station Heat Rate for the year 1998-99 and 1999-
2000 with respect to preceding year is given at Annexure –II. The outcomes are given below:
2.1 The Station Heat Rate is improving consistently from the year 98-99 and 99-
2000 with respect to preceding year including efficient Stations as well as poor Stations. The level of improvement varies from 0.03% to 20.5% over the preceding year. The numbers of Stations showing improvement are given in the following table:
Year No. of Stations
Analysed No. of Improved
Stations Level of
improvement (%) % of improved
Stations 1998-99 60 29 0.1% - 20.5% 48% 1999-2000 57 32 0.03% - 12% 56% The improvement in numbers of Stations during 1999-2000 is 8% higher than 1998-99.

Performance Review of Thermal Power Stations 1999-00 Section-13 PAGE NO 140
1998-99
1999-2000 S No
Stations & unit capacity Cap.(MW) Design heat rate OPSHR %
DEV OPSHR %
DEV
1. Kota-2X110+3X210 850 2353.55 2596 10.30 2489 5.76 2. Obra-A—5X50+3X100 550 2818.61 - - - - 3. Ukai-
2X120+2X200+1X210 850 2358.27 - - 2554 8.30
4. Gandhi Nagar-2X120+3X210
870 2336 - - - -
5. Wanakbori-6x210 1260 2350.81 2502 6.43 2521 7.24 6. Wanakbori-7x210 1470 2344.75 - - - - 7. Sabarmati(AECO)-
2X30+3X110 390 2553.34 - - 2812 10.13
8. Satpura-5X62.5+1X200+3X210
1142.5 2589.68 2860 10.44 - -
9. Bhusawal –1X62.5+2X210
482.5 2376.26 2609 9.79 - -
10. Nasik-2X140+3X210 910 2347.76 - - 2525 7.55 11. Vijai wada-6X210 1260 2301.4 - - 2492 8.28 12. Ramagundem (B)-
1X62.5 62.5 2616 2867 9.59 2789 6.61
13. Rayalseema-2X210 420 2223 - - 2351 5.76 14. Raichure-5X210 1050 2277.24 - - - - 15. Tuticorin-5X210 1050 2343.94 2544 8.54 2523 7.64 16. N.Chennai-3X210 630 2324.28 - - 2560 10.14 17. Metture-4X210 840 2386 2559 7.25 2528 5.95 18. Tita Garh (CESC)-
4X60 240 2659 2817 5.94 2808 5.60
19. Parli 2X30+3x210 690 2424.29 - - - - 20. Total Station(B) 8 12 21. Total Station(A +B) 16 21
Performance Review of Thermal Power Stations 1999-00 Section-13 PAGE NO 141
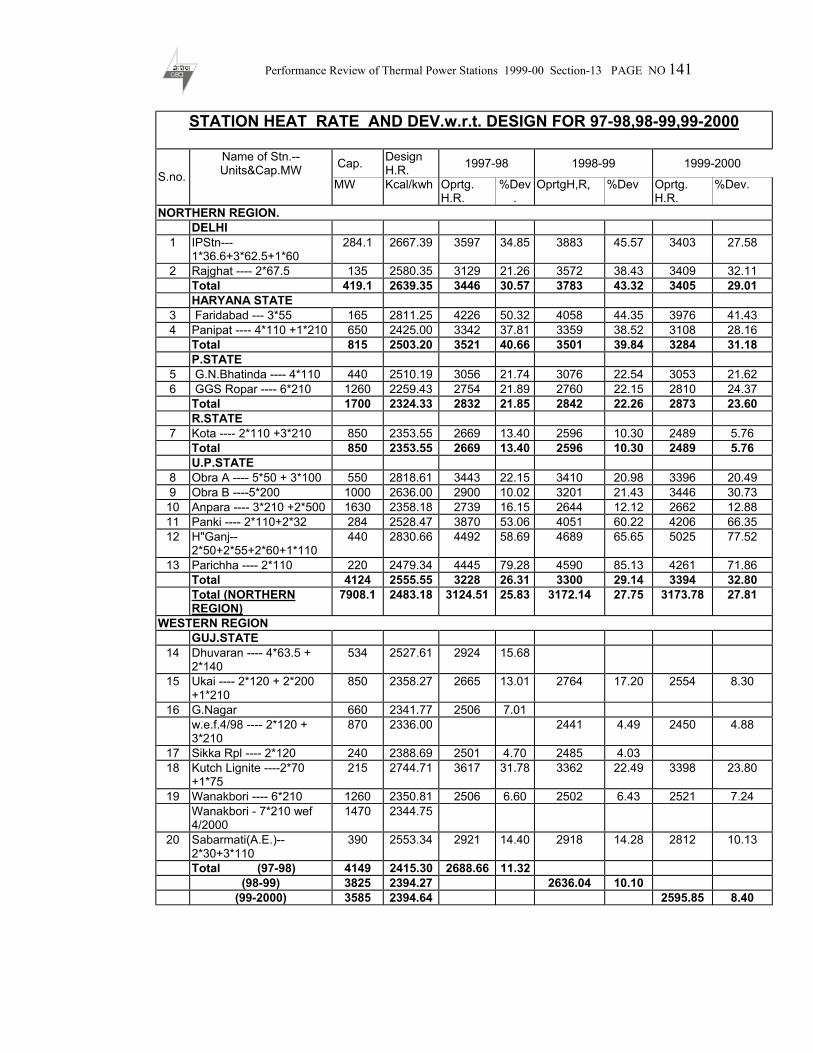
STATION HEAT RATE AND DEV.w.r.t. DESIGN FOR 97-98,98-99,99-2000
Name of Stn.--Units&Cap.MW Cap. Design
H.R. 1997-98 1998-99 1999-2000 S.no. MW Kcal/kwh Oprtg.
H.R. %Dev
. OprtgH,R, %Dev Oprtg.
H.R. %Dev.
NORTHERN REGION. DELHI
1 IPStn---1*36.6+3*62.5+1*60
284.1 2667.39 3597 34.85 3883 45.57 3403 27.58
2 Rajghat ---- 2*67.5 135 2580.35 3129 21.26 3572 38.43 3409 32.11 Total 419.1 2639.35 3446 30.57 3783 43.32 3405 29.01 HARYANA STATE
3 Faridabad --- 3*55 165 2811.25 4226 50.32 4058 44.35 3976 41.43 4 Panipat ---- 4*110 +1*210 650 2425.00 3342 37.81 3359 38.52 3108 28.16 Total 815 2503.20 3521 40.66 3501 39.84 3284 31.18 P.STATE
5 G.N.Bhatinda ---- 4*110 440 2510.19 3056 21.74 3076 22.54 3053 21.62 6 GGS Ropar ---- 6*210 1260 2259.43 2754 21.89 2760 22.15 2810 24.37 Total 1700 2324.33 2832 21.85 2842 22.26 2873 23.60 R.STATE
7 Kota ---- 2*110 +3*210 850 2353.55 2669 13.40 2596 10.30 2489 5.76 Total 850 2353.55 2669 13.40 2596 10.30 2489 5.76 U.P.STATE
8 Obra A ---- 5*50 + 3*100 550 2818.61 3443 22.15 3410 20.98 3396 20.49 9 Obra B ----5*200 1000 2636.00 2900 10.02 3201 21.43 3446 30.73 10 Anpara ---- 3*210 +2*500 1630 2358.18 2739 16.15 2644 12.12 2662 12.88 11 Panki ---- 2*110+2*32 284 2528.47 3870 53.06 4051 60.22 4206 66.35 12 H"Ganj--
2*50+2*55+2*60+1*110 440 2830.66 4492 58.69 4689 65.65 5025 77.52
13 Parichha ---- 2*110 220 2479.34 4445 79.28 4590 85.13 4261 71.86 Total 4124 2555.55 3228 26.31 3300 29.14 3394 32.80 Total (NORTHERN
REGION) 7908.1 2483.18 3124.51 25.83 3172.14 27.75 3173.78 27.81
WESTERN REGION GUJ.STATE
14 Dhuvaran ---- 4*63.5 + 2*140
534 2527.61 2924 15.68
15 Ukai ---- 2*120 + 2*200 +1*210
850 2358.27 2665 13.01 2764 17.20 2554 8.30
16 G.Nagar 660 2341.77 2506 7.01 w.e.f.4/98 ---- 2*120 +
3*210 870 2336.00 2441 4.49 2450 4.88
17 Sikka Rpl ---- 2*120 240 2388.69 2501 4.70 2485 4.03 18 Kutch Lignite ----2*70
+1*75 215 2744.71 3617 31.78 3362 22.49 3398 23.80
19 Wanakbori ---- 6*210 1260 2350.81 2506 6.60 2502 6.43 2521 7.24 Wanakbori - 7*210 wef
4/2000 1470 2344.75
20 Sabarmati(A.E.)--2*30+3*110
390 2553.34 2921 14.40 2918 14.28 2812 10.13
Total (97-98) 4149 2415.30 2688.66 11.32 (98-99) 3825 2394.27 2636.04 10.10 (99-2000) 3585 2394.64 2595.85 8.40
Performance Review of Thermal Power Stations 1999-00 Section-13 PAGE NO 142
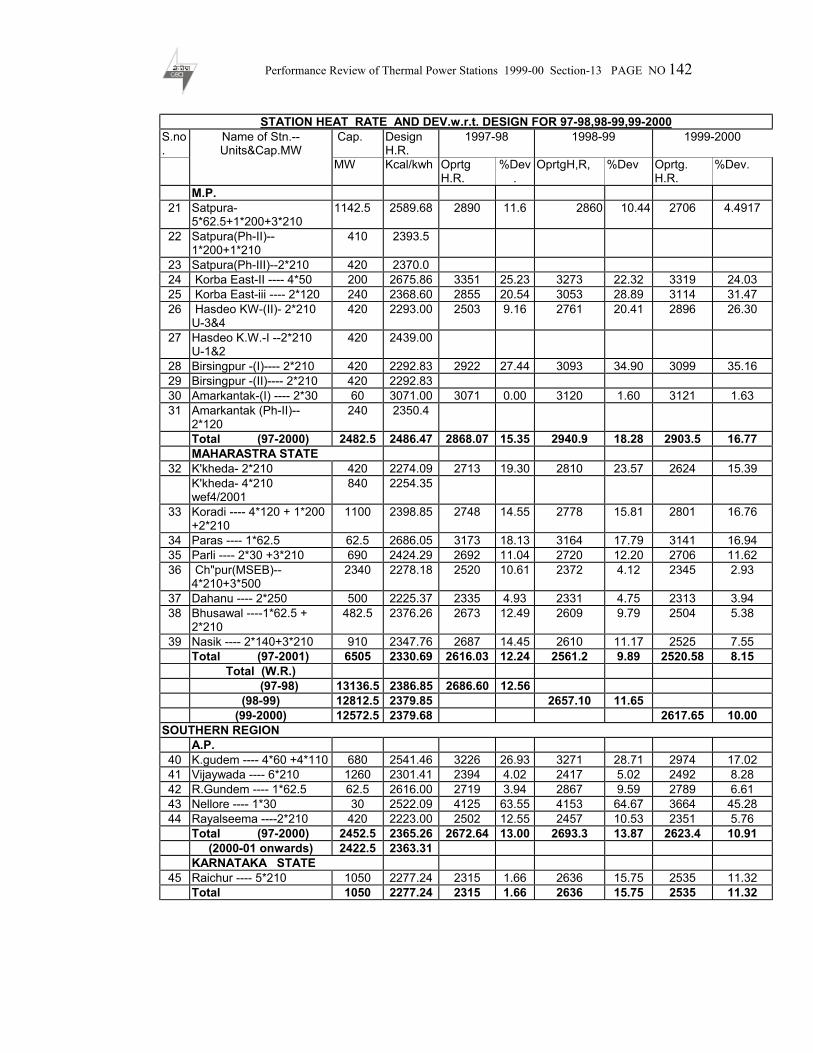
STATION HEAT RATE AND DEV.w.r.t. DESIGN FOR 97-98,98-99,99-2000 S.no.
Name of Stn.--Units&Cap.MW
Cap. Design H.R.
1997-98 1998-99 1999-2000
MW Kcal/kwh Oprtg H.R.
%Dev.
OprtgH,R, %Dev Oprtg. H.R.
%Dev.
M.P. 21 Satpura-
5*62.5+1*200+3*210 1142.5 2589.68 2890 11.6 2860 10.44 2706 4.4917
22 Satpura(Ph-II)--1*200+1*210
410 2393.5
23 Satpura(Ph-III)--2*210 420 2370.0 24 Korba East-II ---- 4*50 200 2675.86 3351 25.23 3273 22.32 3319 24.03 25 Korba East-iii ---- 2*120 240 2368.60 2855 20.54 3053 28.89 3114 31.47 26 Hasdeo KW-(II)- 2*210
U-3&4 420 2293.00 2503 9.16 2761 20.41 2896 26.30
27 Hasdeo K.W.-I --2*210 U-1&2
420 2439.00
28 Birsingpur -(I)---- 2*210 420 2292.83 2922 27.44 3093 34.90 3099 35.16 29 Birsingpur -(II)---- 2*210 420 2292.83 30 Amarkantak-(I) ---- 2*30 60 3071.00 3071 0.00 3120 1.60 3121 1.63 31 Amarkantak (Ph-II)--
2*120 240 2350.4
Total (97-2000) 2482.5 2486.47 2868.07 15.35 2940.9 18.28 2903.5 16.77 MAHARASTRA STATE
32 K'kheda- 2*210 420 2274.09 2713 19.30 2810 23.57 2624 15.39 K'kheda- 4*210
wef4/2001 840 2254.35
33 Koradi ---- 4*120 + 1*200 +2*210
1100 2398.85 2748 14.55 2778 15.81 2801 16.76
34 Paras ---- 1*62.5 62.5 2686.05 3173 18.13 3164 17.79 3141 16.94 35 Parli ---- 2*30 +3*210 690 2424.29 2692 11.04 2720 12.20 2706 11.62 36 Ch"pur(MSEB)--
4*210+3*500 2340 2278.18 2520 10.61 2372 4.12 2345 2.93
37 Dahanu ---- 2*250 500 2225.37 2335 4.93 2331 4.75 2313 3.94 38 Bhusawal ----1*62.5 +
2*210 482.5 2376.26 2673 12.49 2609 9.79 2504 5.38
39 Nasik ---- 2*140+3*210 910 2347.76 2687 14.45 2610 11.17 2525 7.55 Total (97-2001) 6505 2330.69 2616.03 12.24 2561.2 9.89 2520.58 8.15 Total (W.R.) (97-98) 13136.5 2386.85 2686.60 12.56 (98-99) 12812.5 2379.85 2657.10 11.65 (99-2000) 12572.5 2379.68 2617.65 10.00
SOUTHERN REGION A.P.
40 K.gudem ---- 4*60 +4*110 680 2541.46 3226 26.93 3271 28.71 2974 17.02 41 Vijaywada ---- 6*210 1260 2301.41 2394 4.02 2417 5.02 2492 8.28 42 R.Gundem ---- 1*62.5 62.5 2616.00 2719 3.94 2867 9.59 2789 6.61 43 Nellore ---- 1*30 30 2522.09 4125 63.55 4153 64.67 3664 45.28 44 Rayalseema ----2*210 420 2223.00 2502 12.55 2457 10.53 2351 5.76 Total (97-2000) 2452.5 2365.26 2672.64 13.00 2693.3 13.87 2623.4 10.91 (2000-01 onwards) 2422.5 2363.31 KARNATAKA STATE
45 Raichur ---- 5*210 1050 2277.24 2315 1.66 2636 15.75 2535 11.32 Total 1050 2277.24 2315 1.66 2636 15.75 2535 11.32

Performance Review of Thermal Power Stations 1999-00 Section-13 PAGE NO 143
STATION HEAT RATE AND DEV.w.r.t. DESIGN FOR 97-98,98-99,99-2000 Name of Stn.--Units&Cap.MW
Cap. Design H.R.
1997-98 1998-99 1999-2000 S.no.
MW Kcal/kwh Oprtg H.R.
%Dev.
OprtgH,R, %Dev Oprtg. H.R.
%Dev.
TAMIL NADU STATE 46 Tuticorin ---- 5*210 1050 2343.94 2547 8.66 2544 8.54 2523 7.64 47 Ennore ---- 2*60 +3*110 450 2528.21 3285 29.93 3123 23.53 3268 29.26 48 N.Chennai ---- 3*210 630 2324.28 2686 15.56 2568 10.49 2560 10.14 49 Neyveli-I ---- 6*50 +3*100 600 2739.29 3957 44.45 3958 44.49 4127 50.66 50 Neveli-II ---- 7*210 1470 2601.00 2819 8.38 2940 13.03 2939 13.00 51 Metture ---- 4*210 840 2386.00 2551 6.92 2559 7.25 2528 5.95 Total (97-2000) 5040 2486.98 2878.13 15.73 2885.0 16.01 2907.3 16.90 TOTAL (S. R.) (97-2000) 8542.5 2426.26 2749.91 13.34 2799.39 15.38 2780.01 14.58
EASTERN REGION
BIHAR STATE 52 Barauni ---- 2*50 +2*110 320 2532.64 4918 94.18 4681 84.83 4570 80.44 TOTAL 320 2532.64 4918 94.18 4681 84.83 4570 80.44
D.V.C. 53 Bokaro ---- 3*210 630 2399.35 3450 43.79 3173 32.24 3386 41.12 54 Durgapur ---- 1*140 +
1*210 350 2406.00 3085 28.22 2946 22.44 3302 37.24
55 Ch"pur(DVC)--3*140+3*120
780 2352.24 3889 65.33 3896 65.63 4109 74.68
TOTAL (97-98 TO 2000-01)
1760 2379.80 3571.97 50.10 3448.28 44.90 3689.72 55.04
NTPC 56 Farakka --- 2*200 +2*500 1400 2286.69 2593 13.40 2561 12.00 TOTAL (NTPC) 1400 2286.69 2593 13.40 2561 12.00 ORISSA STATE
57 Talchar ----4*62.5 +2*110 460 2621.33 3444 31.38 3257 24.25 58 IB opgc ---- 2*210 420 2350.37 2667 13.47 2442 3.90 2418 2.88 TOTAL (97-98 TO 98-
99) 880 2492.01 3073.16 23.32 2868.02 15.09
(99-2000 onwards) 420 2350.37 2418 2.88 W.B.STATE
59 Kolaghat ---- 6*210 1260 2387.52 3157 32.23 3164 32.52 3170 32.77 60 Bandel ---- 4*80 +1*210 530 2395.78 2722 13.62 3042 26.97 3110 29.81 61 Santaldih(WBSEB)-4*120 480 2300.31 3361 46.11 3680 59.98 3512 52.68 TOTAL (97-98 TO 99-
2000) 2270 2371.01 3098.57 30.69 3244.63 36.85 3228.31 36.16
CESC 62 Budge Budge(CESC)--
2*250 500 2261.00 3271 44.67 2599 14.95 2359 4.33
63 Titagarh (CESC) ---- 4*60 240 2659.00 2826 6.28 2817 5.94 2808 5.60 64 Mulajore (CESC) ---- 4*30 120 3420.00 6074 77.60 6153 79.91 6544 91.35 65 Southern (CESC) ----
2*67.5 135 2707.00 2829 4.51 2832 4.62 2848 5.21
66 N.Cossipore(CESC)-2*30+2*50
160 2920.00 4428 51.64 4522 54.86 4697 60.86
TOTAL 1155 2607.54 3578.37 37.23 3307.2 26.83 3268.1 25.33 TOTAL (EASTERN REGION)

Performance Review of Thermal Power Stations 1999-00 Section-13 PAGE NO 144
STATION HEAT RATE AND DEV.w.r.t. DESIGN FOR 97-98,98-99,99-2000 S.no.
Name of Stn.--Units&Cap.MW
Cap. Design H.R.
1997-98 1998-99 1999-2000
MW Kcal/kwh Oprtg H.R.
%Dev.
OprtgH,R, %Dev Oprtg. H.R.
%Dev.
97-98 7785 2413.24 3257.78 35.00 98-99 7785 2413.24 3193.48 32.33 99-2000 5925 2426.99 3388.16 39.60 2000-01 3510 2381.75 2001-02 2740 2383.47 NORTH EASTERN REGION
67 Bongaigon ---- 4*60 240 2748.55 4563 66.01 4516 64.30 TOTAL 240 2748.55 4563 66.01 4516 64.30 ALL INDIA(SHR) 97-98 37612.1 2423.83 2923.25 20.60 98-99 37288.1 2421.74 2922.88 20.69 99-2000 34948.1 2422.51 2913.81 20.28
LEVEL OF INCREASE / DECREASE IN SHR
FOR THE YEARS 98-99,99-2000 wrt PRECEDING YEAR.
S.no. Name of Stn.--Units&Cap.MW Cap. Design H.R.
1997-98 1998-99 1999-2000
MW Kcal/kwh Oprtg H.R. OprtgH,R, %Imprvt.
Oprtg. H.R.
%Imprvt.
NORTHERN REGION. DELHI
1 IPStn---1*36.6+3*62.5+1*60 284.1 2667.39 3597 3883 -7.95 3403 12.36
2 Rajghat ---- 2*67.5 135 2580.35 3129 3572 -14.16 3409 4.56 HARYANA STATE
3 Faridabad --- 3*55 165 2811.25 4226 4058 3.98 3976 2.02 4 Panipat ---- 4*110 +1*210 650 2425.00 3342 3359 -0.51 3108 7.47 P.STATE
5 G.N.Bhatinda ---- 4*110 440 2510.19 3056 3076 -0.65 3053 0.75 6 GGS Ropar ---- 6*210 1260 2259.43 2754 2760 -0.22 2810 -1.81 R.STATE
7 Kota ---- 2*110 +3*210 850 2353.55 2669 2596 2.74 2489 4.12 U.P.STATE
8 Obra A ---- 5*50 + 3*100 550 2818.61 3443 3410 0.96 3396 0.41 9 Obra B ----5*200 1000 2636.00 2900 3201 -10.38 3446 -7.65
10 Anpara ---- 3*210 +2*500 1630 2358.18 2739 2644 3.47 2662 -0.68 11 Panki ---- 2*110+2*32 284 2528.47 3870 4051 -4.68 4206 -3.83 12 H"Ganj--2*50+2*55+2*60+1*110 440 2830.66 4492 4689 -4.39 5025 -7.17 13 Parichha ---- 2*110 220 2479.34 4445 4590 -3.26 4261 7.17
WESTERN REGION G.STATE
14 Dhuvaran ---- 4*63.5 + 2*140 534 2527.61 2924 15 Ukai ---- 2*120 + 2*200 +1*210 850 2358.27 2665 2764 -3.71 2554 7.60 16 G.Nagar 660 2341.77 2506
w.e.f.4/98 ---- 2*120 + 3*210 870 2336.00 2441 2450 -0.37 17 Sikka Rpl ---- 2*120 240 2388.69 2501 2485 0.64 18 Kutch Lignite ----2*70 +1*75 215 2744.71 3617 3362 7.05 3398 -1.07

Performance Review of Thermal Power Stations 1999-00 Section-13 PAGE NO 145
Name of Stn.--Units&Cap.MW Cap. Design H.R. 1997-98 1998-99 1999-2000
S.no. MW Kcal/kwh Oprtg H.R. OprtgH,R, %Imprvt. Oprtg. H.R.
%Imprvt.
19 Wanakbori ---- 6*210 1260 2350.81 2506 2502 0.16 2521 -0.76 Wanakbori - 7*210 wef 4/2000 1470 2344.75
20 Sabarmati(A.E.)--2*30+3*110 390 2553.34 2921 2918 0.10 2812 3.63 M.P.
21 Satpura-5*62.5+1*200+3*210 1143 2589.68 2890 2860 1.04 2706 5.38 22 Satpura(Ph-II)--1*200+1*210 410 2393.5 23 Satpura(Ph-III)--2*210 420 2370.0 24 Korba East-II ---- 4*50 200 2675.86 3351 3273 2.33 3319 -1.41 25 Korba East-iii ---- 2*120 240 2368.60 2855 3053 -6.94 3114 -2.00 26 Hasdeo KW-(II)- 2*210 U-3&4 420 2293.00 2503 2761 -10.31 2896 -4.89 27 Hasdeo K.W.-I --2*210 U-1&2 420 2439.00 28 Birsingpur -(I)---- 2*210 420 2292.83 2922 3093 -5.85 3099 -0.19 29 Birsingpur -(II)---- 2*210 420 2292.83 30 Amarkantak-(I) ---- 2*30 60 3071.00 3071 3120 -1.60 3121 -0.03 31 Amarkantak (Ph-II)-- 2*120 240 2350.4
M.S. 32 K'kheda- 2*210 420 2274.09 2713 2810 -3.58 2624 6.62
K'kheda- 4*210 wef4/2001 840 2254.35 33 Koradi ---- 4*120 + 1*200 +2*210 1100 2398.85 2748 2778 -1.09 2801 -0.83 34 Paras ---- 1*62.5 62.5 2686.05 3173 3164 0.28 3141 0.73 35 Parli ---- 2*30 +3*210 690 2424.29 2692 2720 -1.04 2706 0.51 36 Ch"pur(MSEB)--4*210+3*500 2340 2278.18 2520 2372 5.87 2345 1.14 37 Dahanu ---- 2*250 500 2225.37 2335 2331 0.17 2313 0.77 38 Bhusawal ----1*62.5 + 2*210 482.5 2376.26 2673 2609 2.39 2504 4.02 39 Nasik ---- 2*140+3*210 910 2347.76 2687 2610 2.87 2525 3.26
SOUTHERN REGION A.P.
40 K.gudem ---- 4*60 +4*110 680 2541.46 3226 3271 -1.39 2974 9.08 41 Vijaywada ---- 6*210 1260 2301.41 2394 2417 -0.96 2492 -3.10 42 R.Gundem ---- 1*62.5 62.5 2616.00 2719 2867 -5.44 2789 2.72 43 Nellore ---- 1*30 30 2522.09 4125 4153 -0.68 3664 11.77 44 Rayalseema ----2*210 420 2223.00 2502 2457 1.80 2351 4.31
K.STATE 45 Raichur ---- 5*210 1050 2277.24 2315 2636 -13.87 2535 3.83
T.N.STATE 46 Tuticorin ---- 5*210 1050 2343.94 2547 2544 0.12 2523 0.83 47 Ennore ---- 2*60 +3*110 450 2528.21 3285 3123 4.93 3268 -4.64 48 N.Chennai ---- 3*210 630 2324.28 2686 2568 4.39 2560 0.31 49 Neyveli-I ---- 6*50 +3*100 600 2739.29 3957 3958 -0.03 4127 -4.27 50 Neveli-II ---- 7*210 1470 2601.00 2819 2940 -4.29 2939 0.03 51 Metture ---- 4*210 840 2386.00 2551 2559 -0.31 2528 1.21
EASTERN REGION BIHAR STATE
52 Barauni ---- 2*50 +2*110 320 2532.64 4918 4681 4.82 4570 2.37 D.V.C.
53 Bokaro ---- 3*210 630 2399.35 3450 3173 8.03 3386 -6.71 54 Durgapur ---- 1*140 + 1*210 350 2406.00 3085 2946 4.51 3302 -12.08 55 Ch"pur(DVC)--3*140+3*120 780 2352.24 3889 3896 -0.18 4109 -5.47 56 Mejia (DVC) ---- 3*210 630 2267.16 2816
NTPC 57 Farakka ---- 2*200 +2*500 1400 2286.69 2593 2561 1.23
ORISSA STATE 58 Talchar ----4*62.5 +2*110 460 2621.33 3444 3257 5.43 59 IB opgc ---- 2*210 420 2350.37 2667 2442 8.44 2418 0.98
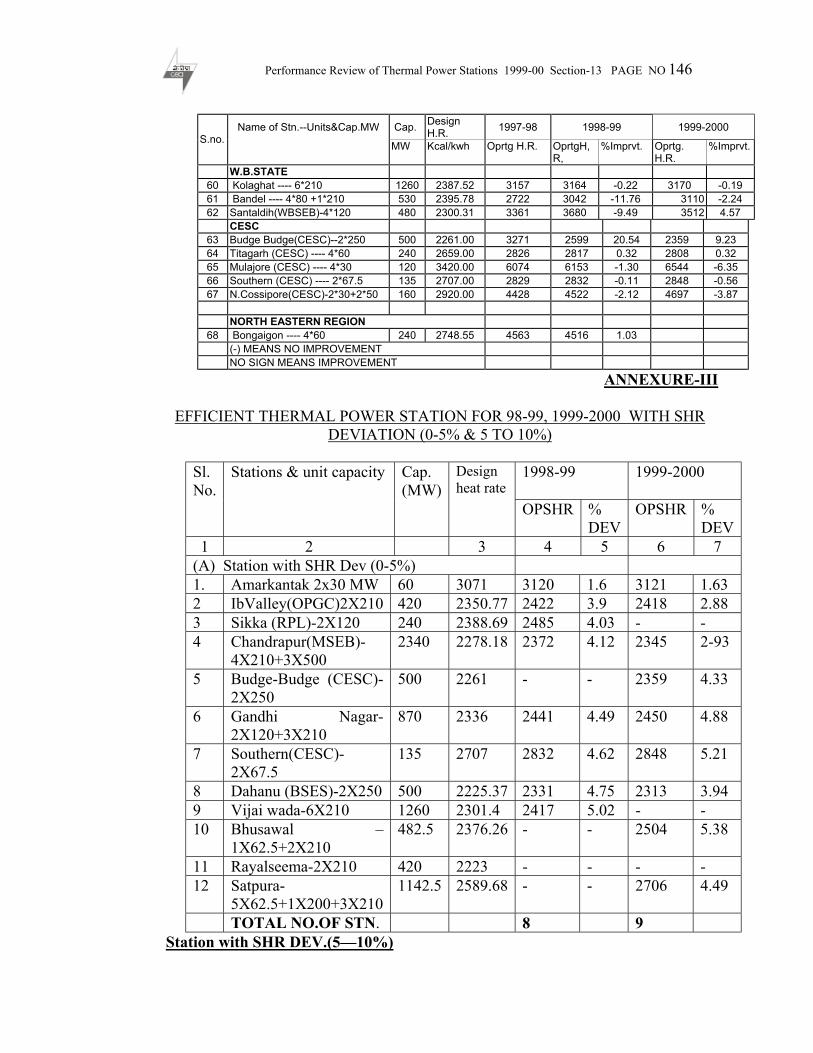
Performance Review of Thermal Power Stations 1999-00 Section-13 PAGE NO 146
Name of Stn.--Units&Cap.MW Cap. Design H.R. 1997-98 1998-99 1999-2000
S.no. MW Kcal/kwh Oprtg H.R. OprtgH,R,
%Imprvt. Oprtg. H.R.
%Imprvt.
W.B.STATE 60 Kolaghat ---- 6*210 1260 2387.52 3157 3164 -0.22 3170 -0.19 61 Bandel ---- 4*80 +1*210 530 2395.78 2722 3042 -11.76 3110 -2.24 62 Santaldih(WBSEB)-4*120 480 2300.31 3361 3680 -9.49 3512 4.57
CESC 63 Budge Budge(CESC)--2*250 500 2261.00 3271 2599 20.54 2359 9.23 64 Titagarh (CESC) ---- 4*60 240 2659.00 2826 2817 0.32 2808 0.32 65 Mulajore (CESC) ---- 4*30 120 3420.00 6074 6153 -1.30 6544 -6.35 66 Southern (CESC) ---- 2*67.5 135 2707.00 2829 2832 -0.11 2848 -0.56 67 N.Cossipore(CESC)-2*30+2*50 160 2920.00 4428 4522 -2.12 4697 -3.87
NORTH EASTERN REGION
68 Bongaigon ---- 4*60 240 2748.55 4563 4516 1.03 (-) MEANS NO IMPROVEMENT NO SIGN MEANS IMPROVEMENT
ANNEXURE-III
EFFICIENT THERMAL POWER STATION FOR 98-99, 1999-2000 WITH SHR DEVIATION (0-5% & 5 TO 10%)
1998-99
1999-2000 Sl. No.
Stations & unit capacity Cap. (MW)
Design heat rate
OPSHR % DEV
OPSHR % DEV
1 2 3 4 5 6 7 (A) Station with SHR Dev (0-5%) 1. Amarkantak 2x30 MW 60 3071 3120 1.6 3121 1.63 2 IbValley(OPGC)2X210 420 2350.77 2422 3.9 2418 2.88 3 Sikka (RPL)-2X120 240 2388.69 2485 4.03 - - 4 Chandrapur(MSEB)-
4X210+3X500 2340 2278.18 2372 4.12 2345 2-93
5 Budge-Budge (CESC)-2X250
500 2261 - - 2359 4.33
6 Gandhi Nagar-2X120+3X210
870 2336 2441 4.49 2450 4.88
7 Southern(CESC)-2X67.5
135 2707 2832 4.62 2848 5.21
8 Dahanu (BSES)-2X250 500 2225.37 2331 4.75 2313 3.94 9 Vijai wada-6X210 1260 2301.4 2417 5.02 - - 10 Bhusawal –
1X62.5+2X210 482.5 2376.26 - - 2504 5.38
11 Rayalseema-2X210 420 2223 - - - - 12 Satpura-
5X62.5+1X200+3X210 1142.5 2589.68 - - 2706 4.49
TOTAL NO.OF STN. 8 9 Station with SHR DEV.(5—10%)

Performance Review of Thermal Power Stations 1999-00 Section-13 PAGE NO 147
ALL INDIA AVERAGE DESIGN/OPERATING STATION HEAT RATE
(CAPACITY GROUP WISE) FOR THE YEAR 1999-2000
1999-2000 MW (Group Wise) Cap.(MW) No. Of Stn. DSHR OPSHR %Dev. 500 MW Group 250 MW Group 1000 2 2243 2336 4.15 200/210 MW Group 13810 16 2376 2782 17.10 120 MW 720 2 2323 3379 45.49 110 MW 660 2 2500 3456 38.25 67.5 MW 270 2 2644 3129 18.35 62.5 MW 125 2 2651 2965 11.84 60 MW 240 1 2659 2808 5.60 55 MW 165 1 2811 3976 41.44 50MW 200 1 2676 3319 24.03 30 MW 210 3 3192.0 5154.6 61.48 Combination of (30--200/210/500 MW)Group 12395.00 13 2376.2 2631 10.73 Combination of (30--140 MW)Group 5153.10 12 2615.6 3775 44.34 TOTAL ALL INDIA 34948.1 57 2422 2914 20.28
Performance Review of Thermal Power Stations 1999-00 Section-13 PAGE NO 148
ENVIRONMENTAL ASPECTS IN POWER SECTOR
(PART-B) 1. INTRODUCTION The implementation of power projects requires clearance from Ministry of Environment and Forests from the following aspects : a) Environmental aspects b) Forest (Conservation) Act 1980 angle The above clearances are communicated separately and a Project requiring both clearance is deemed to be cleared by MOEF only after the clearance from both aspects is given. 2. ENVIRONMENT CLEARANCE The Environment Impact Assessment (EIA) Notification `1994, inter-alia, provides that expansion or modernisation or a new power project shall not be undertaken in the country unless accorded environment clearance by the Central Government in the Ministry of Environment and Forest (MOEF). This however, does not apply to projects with investment costs less than 50 crores. The above EIA Notification, sets out procedure for clearance of projects. For site specific projects, such as hydro electric and pit head thermal power stations, the site clearance is to be obtained first from MOEF for initiation of any surveys and investigations. The MOEF would convey a decision regarding suitability of otherwise of the site within 30 days. Thereafter, such site specific projects are to be submitted by the proponents to MOEF for clearance. The reports shall be evaluated and assessed by the Impact Assessment Agency which may consult a Committee of Experts. If required, comments of the public may be solicited and public hearing arranged. The Notification stipulates that the assessment shall be completed within a period of ninety days from the receipt of the requisite documents and data hearing, where required, and decision conveyed within thirty days thereafter. The clearance granted is valid for a period of five years for commencement of the construction/operation. 3.0 ENVIRONMENTAL APPRAISAL OF THERMAL POWER PROJECTS The proponents of thermal power projects including coal/lignite fired thermal, gas, combined cycle gas based and co-generation projects submit 20 copies of the application to MOEF in the specified Performa along with the Environmental Impact Report/Environment Management Plan. The impact Assessment Agency examines the reports and calls for additional data, documents. on receipt of complete information, the projects are placed before the committee of Experts for thermal power stations. If needed, visits to recommendations of the Committee of Experts, MOEF further process the projects for clearance/rejection of the proposals. The cases rejected for

Performance Review of Thermal Power Stations 1999-00 Section-13 PAGE NO 149
non furnishing of complete information may be reopened on the receipt of complete information. The expert committee Constituted by MOEF and represented by Chief Engineer (C&E)/ CEA, had considered 24 schemes with 5354.78 MW during 1999-2000 . Out of these, 18 schemes with 3585.78MW (99-00) installed capacity had been given clearance from environmental angle. 4.0 ENVIRONMENT CONCERNS OF THERMAL POWER STATIONS The products of combustion in thermal power plants using coal/lignite LDO/Naphtha are gaseous emissions containing carbon dioxide, oxides of sulphur and Nitrogen as also solid particulate matter (ash) where coal/lignite is used. Beside these, the waste water from the process contains pollutants. 4.1 AIR POLLUTION Initially, perceptions of objectionable effects of air pollutants were limited to those easily detected like odour and smoke stacks. Later, it was the concern over long term/chronic effects that led to the identification of six criteria pollutants. These six criteria pollutants are sulphur DI-oxide (S02), Carbon Mono-oxide (CO), Nitrogen oxide (NO2), Ozone (O3), suspended particulate and non methane hydrocarbons (NMHC) now referred to as volatile organic compounds (VOC). There is substantial evidence linking them to health effects at high concentrations. Three of whom namely O3,SO2 and NO2 are also known phytotoxicants (toxic to vegetation). In the later part Lead (Pb) was added to that list. Green House Gases which are responsible for temperature enhancement cause global warming. These Green House Gases are CO2. (Carbon dioxide), CH4 (Methane), N20 (Nitous Oxide) & CO (Carbon Monoxide) 4.1.1. OXIDES OF NITROGEN (NOX ) All combustion processes are sources of NOx at the high temperature generated in the combustion process. Formation of NOx may be due to thermal NOx which is the result of oxidation of nitrogen in the air and due to fuel NOX which is due to nitrogen present in the fuel. In general, higher the combustion temperature the higher NOx is produced. 4.1.2 OXIDES OF SULPHUR The combustion of sulphur containing fossil fuels, especially coal is the primary source of SOX. About 97 to 99% of SOX emitted from combustion sources is in the form of sulphur dioxide which is a criteria pollutant, the reminder is mostly SO3, which in the presence of atmosphere water is transformed into Sulphuric Acid at higher concentrations, produce deleterious effects on the respiratory system.

Performance Review of Thermal Power Stations 1999-00 Section-13 PAGE NO 150
4.1.3. PARTICULATE MATTER The terms particulate matter, particulates, particles are used interchangeably and all refer to finely divided solids and liquids dispersed in the air. 4.1.4. RESPIRATORY MATTER/RM 10 are the five particulate matter upto 10 micron size , which are responsible for respiratory effect and lungs cancer. 4.2 WATER POLLUTION Water pollution refers to any change in natural waters that may impair further use of the water, caused by the introduction of organic or inorganic substances or a change in temperature of the water. In thermal power stations the source of water is either river, lake, pond, ground water or sea where from water is usually taken. There is possibility of water being contaminated from the source itself. Further contamination or pollution could be added by the pollutants of thermal power plant waste as inorganic or organic compounds. 4.3 LAND DEGRADATION The thermal power stations are generally located on the non-forest land and do not involve much Resettlement and Rehabilitation problems. However it’s effects due to stack emission etc, on flora and fauna, wild life sanctuaries and human life etc. have to be studied for any adverse effects. One of the serious effects of thermal power stations are land requirement for ash disposal and hazardous elements percolation to ground water through ash disposal in ash ponds. Due to enormous quantity of ash content in Indian coal, approximately 1 Acre per MW of installed thermal capacity is required for ash disposal. 4.4 NOISE POLLUTION Some areas inside the plant will have noisy equipments such as crushers, belt conveyors, fans, pumps, milling plant, compressors, boiler, turbine etc. Various measures taken to reduce the noise generation and exposure of workers to high noise levels in the plant area will generally include: I) Silencers of fans, compressors, steam safety valves etc. ii) Using noise absorbent materials. iii) Providing noise barriers for various areas. iv) Noise proof control rooms. v) Provision of green belt around the plat will further reduce noise levels. 5.0 REGULATORY MEASURES
Performance Review of Thermal Power Stations 1999-00 Section-13 PAGE NO 151
5.1 AIR (PREVENTION & CONTROL OF POLLUTION) ACT, 1981. In India, 1st Air (Prevention & Control of Pollution) Act was enacted in 1981 with amendments in 1987 for prevention, control and abatement of air pollution and it came into force with effect from May 91. The act provides for Central as well as State Boards with such powers and functions as necessary to provide and control the quality of Air. National ambient air quality standards by Central Pollution Control Board have been issued vide Gazette Notification of April 94. For wider dispersal of SO2, stack height of different capacity units have been stipulated. For units of 500MW and above stack height of 275 meters and units of 200MW & above but less than 500MW a height of 220meter has been stipulated. For units less than 200MW the height (H) is=14(Q) 0.3, where Q is emission rate of SO2 in kg/hr. 5.2 ENVIRONMENT (PROTECTION) ACT 1986 Environment (Protection) Act 1986 came into force w.e.f. 19.11.86 and provides for protection, improvement of environment and for matters connected therewith. It empowers the Central Govt. to take all such measures as deemed necessary for protecting and meeting quality of environment and preventing, controlling and abating environmental pollution. Standards for liquid effluents have been issued under PEA Notification, dated 19th November, 1986 1986 Environment Protection Act has much sharper teeth and provides for stringent punishment for any violation of Act. As per Sec. 15 of the Act, whosoever fails to comply or contravenes any of the provisions of this Act, may be punished with imprisonment which may extend unto five years or with fine extending unto Rs. one lake or both. In case the failure continues for more than one year, the imprisonment may be extended to seven years. 5.3 EMISSION/EFFLUENTS STANDARDS The standards for emissions/effluent have been notified by the CPCB/MOEF as under : 5.3.1 SUSPENDED PARTICULATE MATTER (SPUME) The bulk of the ash produced from the combustion of coal / lignite in the thermal power station and carried by the flue gases is trapped by the ESP’s or bag filters and only a small quantity escapes through stacks. The ESP’s of such designs and efficiency are provided that limit the SPUME in the stack emissions below the prescribed norms. The standards for SPUME levels as notified are given at Annex - I 5.3.2 SULPHUR DIOXIDE EMISSIONS

Performance Review of Thermal Power Stations 1999-00 Section-13 PAGE NO 152
The non-cooking coal available in the country earmarked for power generation generally contains low level of sulphur unto 0.50% except for the coal available in the North Eastern region of the country. There are no prescribed sulphur dioxide emission norms control is sought to be achieved by prescribing minimum stack height limits for power stations which are given at Annex - II. The Indian Air quality Standards prescribed by CPCB stipulates the limits of SPUME, SOx, NOx, Respriable particulate matter (RPM) CO & Pb in the ambient air. These standards are given at Annex - III. Even using high sulphur coal, the sulphur dioxide emission can be reduced in the boilers using fluidised bed combustion technology. The sulphur dioxide produced in the combustion is mixed in the boiler with the lime fed alongwith the coal. 5.3.3 NITROGEN OXIDE EMISSIONS The formation of Nitrogen oxide depends on the temperature and residence time of gases in the combustion chamber at that temperature. The formation of Nitrogen oxide can be reduced by providing low nitrogen oxide burners. No norms for the nitrogen oxide emission at stack have been notified by MOEF for coal/lignite fired thermal power stations. The levels of Oxides of Nitrogen in the ambient air are prescribed by the AAQ standards which would limit the concentration of nitrogen oxide producing industries in an area. 5.3.4 EFFLUENT DISCHARGE The process of power generation produces liquid effluents. The standards for liquid effluents from power stations have been prescribed in the EPA Notification dated 19th Nov. 1986 which are reproduced at Annex - IV. 6.0 OTHER ISSUES 6.1 COAL WASHING/BENEFICIATION. Number of studies have been conducted in the past to quantify the economics of using beneficiated coal in Indian power stations. These studies have indicated in quantitative terms the benefits of using washed coal both in terms of O&M as well as capital cost of the project. Vide MOEF Notification dated 19th September, 1997. These plants include the thermal plants located beyond one thousand Km. from pit heads and thermal plants located in urban areas or sensitive areas. Subsequently a committee was formed under the chairmanship of Member (Thermal), CEA to examine the ways and means of implementation of MOEF Notification. The committee submitted its report in February 2000. Subsequently MOP has set up two more committee for implementing the recommendations of the main committee. 6.2 FLY ASH UTILISATION

Performance Review of Thermal Power Stations 1999-00 Section-13 PAGE NO 153
The Coal/Lignite fired thermal power stations produce enormous quantities of ash. The ash has traditionally been disposed off in the ash ponds which has the potential of polluting the surface and ground water unless adequate care is taken. In order to check the percolation of ash effluents to the ground water, ash pond lining is being provided wherever necessary. The fly ash collected in the dry form, could however, be beneficially used for brick making and cement manufacturing. Incentives have been issued by the ministry of Power letter of 27th May 1996. Which are reproduced at Annexure - V. Inspite of all out efforts only 15 % of ash is being utilised for gainful purpose at present. The notification dated 14-9-99 issued by MOEF in respect of Fly ash is reproduced at Annexure VI. 6.3 FLUE GAS DESULPHURISATION (FGD) PLANT The MOEF insists on making space provision for FGD Plant in the designs of thermal power units of 500 MW and above capacity as also at stations with capacity of 1500 to 2000 MW to facilitate their addition at a later date in case of the need for such plant is established. In case of sensitive areas the installation of FGD is insisted upon even for stations with smaller installation. 6.4. MONITORING OF ENVIRONMENTAL STATUS OF THERMAL POWER STATIONS IN INDIA CEA has also been actively engaged in the monitoring of environmental status of thermal power stations in the country. Monthly environmental status reports in respect of Stack emission, AAQ and effluent discharges are received from the thermal power stations, analysed and remedial measures suggested where ever required. Some of thermal units being operated do not have requisite infrastructure for environmental monitoring. Where-ever the units are not meeting statutory environmental requirements, are unable to install/replace existing ESP`s etc. due to paucity of funds. Though provisions exist in the law for closing down of the thermal power stations for not meeting environmental standards, we can hardly afford to close any unit in the power starved situation. Though, at present emphasis is laid on meeting particulate matter norms from stack emission, even for that regularly data is not being received from some of thermal power stations.

Performance Review of Thermal Power Stations 1999-00 Section-13 PAGE NO 154
Annexure - I
THERMAL POWER PLANTS : EMISSION STANDARDS
NOTIFICATION MOEF vide Notification of 19th May 1993 issued as amendment rules to environment (Protection) Act 1986. The particulate matter emmision limits for thermal power stations are as follows :- (i) Thermal Power Plants 62.5MW or more - 150mg/ Nm3 (ii) Units located in protected area irrespective of generation capacity - 150mg/Nm3
(iii) Generation capacity less than 62.5MW and Units having commissioned prior to 1.1.82 - 350 mg/Nm3
Annexure - II
THERMAL POWER PLANTS : STACK HEIGHT/LIMITS Generation Capacity Stack Height (Metres) 500 MW and above 275 200 MW/210 MW and above to less than 500 MW Less than 200 MW/210 MW
220 H=14 (Q) 0.3 where Q is emission rate of SO2, in Kg/h, and H is Stack height in metres
Source : EPA Notification (G.S.R. 742 (E), dt. 30th Aug, 1990.
Annexure-III
ENVIROMENT & FORESTS CENTRAL POLLUTION BOARD
NATIONAL AMBIENT AIR QUALITY STANDARDS, NOTFN. 11.4.94 S.O. 384(E) - The central pollution Control Board in exercise of its power conferred under section 16 (2) (n) of the Air (Prevention and Control of pollution) Act, 1981 (14 of 1981) hereby notify the National Ambient Air Quality standards with immediate effect.

Performance Review of Thermal Power Stations 1999-00 Section-13 PAGE NO 155
As per CPCB notification dt. 11.4.94,A.A.Q standard has been given below in brackets. SCHEDULE – I
Concentration in Ambient Air Pollutant Time weighted
average Indl. Area (ug/m3)
Res. Rural Other areas (ug/m3)
Sensitive Area (ug/m3)
Method of measure
Sulphur Dioxide (SO2)
* Annual average ** 24 hours
80
120
60
80
15
30
1. Improve West & Gacke method
2. Ultraviolet
flourescence Oxides of Nitrogen
* Annual Average ** 24 hour
80
120
60
80
15
30
1. Jacob and Hochheiser modified (Na Arsenite
2. Gas Phase Chemilumin
scene Suspended Particulate Matter (SPM)
* Annual Average ** 24 hour
360
500
140
200
70
100
High Volume sampling, (Avg. flow rate not less than 1.1m3/min
Respirable particulate matter (size less than 10 um)(RPM)
• Annual Average
** 24 hours
120
150
60
100
50
75
Lead (Pb) • Annual Average
** 24 hours
1.0
1.5
0.75
1.0
0.50
0.75
AAS method after sampling. Using ERM 2000 of equiv. Filter paper.
Carbon monooxide (CO)
** 8 hour mg/m3 1 hour mg/m3
5.0
10.0
2.0
4.0
1.0
2.0
Non dispersive infrared spectroscopy
* Annual Arithmetic Mean of minimum 104 measurements in a year taken twice a week 24 hours at uniform intervals. ** 24 hours/8 hours values should be met 98% of the time in a year. However, 2% of time, it may exceed but not on two consecutive days.
Performance Review of Thermal Power Stations 1999-00 Section-13 PAGE NO 156
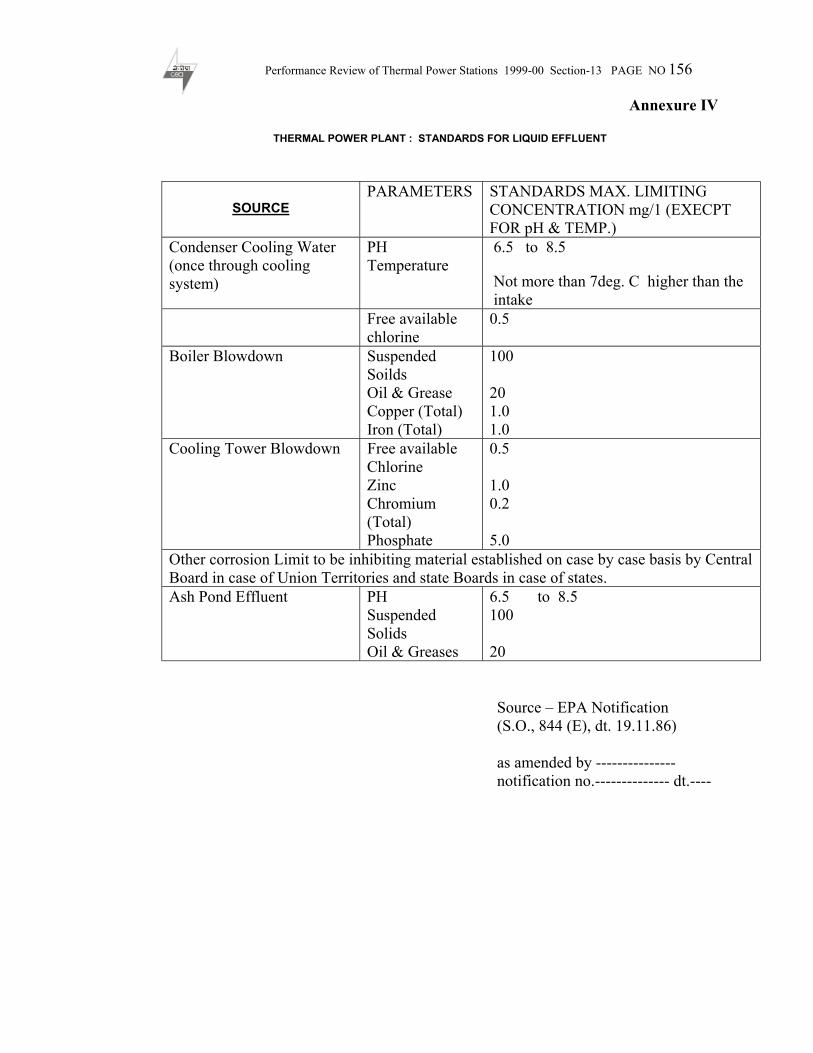
Annexure IV
THERMAL POWER PLANT : STANDARDS FOR LIQUID EFFLUENT
SOURCE PARAMETERS STANDARDS MAX. LIMITING
CONCENTRATION mg/1 (EXECPT FOR pH & TEMP.)
Condenser Cooling Water (once through cooling system)
PH Temperature
6.5 to 8.5
Not more than 7deg. C higher than the intake
Free available chlorine
0.5
Boiler Blowdown Suspended Soilds Oil & Grease Copper (Total) Iron (Total)
100 20 1.0 1.0
Cooling Tower Blowdown Free available Chlorine Zinc Chromium (Total) Phosphate
0.5 1.0 0.2 5.0
Other corrosion Limit to be inhibiting material established on case by case basis by Central Board in case of Union Territories and state Boards in case of states. Ash Pond Effluent PH
Suspended Solids Oil & Greases
6.5 to 8.5 100 20
Source – EPA Notification (S.O., 844 (E), dt. 19.11.86) as amended by --------------- notification no.-------------- dt.----

Performance Review of Thermal Power Stations 1999-00 Section-13 PAGE NO 157
ANNEXURE –V
COPY OF COMPREHENSIVE GUIDELINES FOR FLY ASH UTILISATION
AND DISPOSAL ISSUED BY SECRETARY, MOP VIDE DO NO.11/16/93-RO(K)/E.II DATED 27.5.1996
COMPREHENSIVE GUIDELINES FOR FLY ASH UTILISATION AND DISPOSAL (i) Dry fly ash should be supplied by the power stations, free of cost, to the
entrepreneurs for a period of 10 years from the day a unit goes into fly ash based production. The terms of the supply of ash after the initial period of 10 years, should be settled annually by the Power Station Authorities and the concerned entrepreneurs; in case of disagreement, the matter could be decided by CEA or Building Materials and Technology Promotion Council (BMTC) for which a suitable provision should be incorporated in the contracts.
(ii) Where ever Power Stations do not have dry fly ash collection facilities, they may be required to set up this facility. All new power stations should provide arrangements for collection and supply of dry fly ash. This would be ensured by CEA while appraising projects for techno-economic clearance. If any of the State Electricity Boards (SEBs) dry ash collection, this would considered by the Ministry of Power as a part of R&D Scheme.
(iii) All proposals formulated and sponsored by the concerned Boards/Corporations and Utilities for setting up of the Thermal Power Plants should, in future, invariably incorporate specific provisions for promoting the maximum utilisation of fly ash generated by the plants. Central Electricity Authority would examine such proposals for techno-economic clearance as are found to comply with these requirements.
(iv) The transportation of fly ash from thermal Power Plant should be the responsibility of entrepreneurs. No subsidy for transport of fly ash or its end products would be advisable.
(v) Power utilities should be advised to make arrangements, wherever possible, for giving land to the prospective entrepreneurs on concessional terms contiguous to the power stations. However, supply of power should be settled on case to case basis.
(vi) The Bureau of Indian Standards should formulate Indian Standards on building materials produced from fly ash or incorporate suitable amendments in the existing standards to cover these materials.
(vii) Financial assistance from Governmental financial institutions at subsidised rates of interest should be made available to prospective entrepreneurs for setting up fly ash based unit for manufacturing building materials.
(viii) Indigenous equipment required for setting up fly ash based industry should be exempted from excise duty/sales tax. In case of imported equipment required for manufacture of building materials utilising fly ash should be 50 % of the normal rates.
Performance Review of Thermal Power Stations 1999-00 Section-13 PAGE NO 158
(ix) The end products of coal ash should be exempted for the first 5 years
from excise duty, sales tax etc. where atleast 50% of coal ash is utilised as raw materials for coal ash utilisation between 25 % to 50 % such exemption should be 50 % of the normal rates.
(x) All incentives and according the same preferential treatment should be provided to all coal ash using industries as are given to small scale industries.
(xi) The technologies developed in R&D institutions should be made available at low price to the manufacturers.
(xii) Local authorities, including States Govts. need also to liberalise their industrial policy for establishing ash utilisation industries.
Annexure-VI
Notification of MOEF dated 14.9.1999, in respect of Fly Ash. 1. Use of Fly ash bottom ash or pond ash in the manufacture of bricks and
other construction activities:
(i) No person shall within a radios of fifty kilometers from coal or lignite based thermal power plants, manufacture clay bricks or tiles or blocks for use in construction activities without mixing of least 25% of ash (fly ash, bottom ash or pond ash) with soil on weight to weight basis.
(ii) The authority for ensuring the use of specified quantity of ash as per para (I) above shall be the concerned Regional Officers of the State pollution Control Board or the Pollution Control Committee as the case may be. In case of non-compliance, the said authority, in addition to cancellation of consent order issued to establish the brick kiln, shall move the district administration for cancellation of mining lease. The cancellation of mining lease shall be decided after due hearing. To enable the said authority to verify the actual use of ash, the thermal power plant shall maintain month-wise records of ash made available to each brick kiln.
(iii) In case of non-availability of ash from thermal power plant in sufficient quantities as certified by the said power plant, the stipulation under para (1) shall be suitably modified (waived/relaxed) by the concerned State/Union Territory Government.
(iv) Each coal or lignite based thermal power plant shall constitute a dispute settlement committee which shall include at the General Manager of the thermal power plant and a representative of All India Brick and Tile Manufacture`s Federation (AIBTMF). Such a committee shall ensure unhindered loading and transport of ash without any undue loss of time. Any unresolved dispute shall be dealt with by State/Union Territory level committee to be set up by State/Union Territory Government comprising Member Secretary of the State Pollution Control Board/Pollution Control Committee, representatives of Ministry of Power in the State/Union Territory Government and a representative AIBTMF.
Performance Review of Thermal Power Stations 1999-00 Section-13 PAGE NO 159
2. Utilisation of ash by Thermal Power Plants : All coal or lignite based thermal power plants shall utilise the ash generated in he power plants as follows :
Every coal or lignite based thermal power plant shall make available ash, for a least 10 years from the date of publication of this notification without any payment or any other consideration, for the purpose of manufacturing ash based products such as cement, concrete based, bricks, panels or any other material or for construction of roads, embankment, dams, dykes or for any other construction activity.
(i) Every coal or lignite based thermal power plant commissioned subject to environmentally clearance conditions stipulating the submission of an action plant for full utilisation of fly ash shall, within a period a of nine years from the publication of this notification, phase out the dumping and disposal of fly ash on land in accordance with the plan. Such an action plant shall provide for thirty percent of the fly ash utilisation, within three years from the publication of this notification with further increase in utilisation by at least 10% points every year progressively for the next six years to enable utilisation of the entire fly ash generated in the power plant at least by the end of ninth year Progress in this regard shall be reviewed after five years.
(ii) (iii)Every coal or lignite based thermal power plant not covered by para (ii) above shall, within a period of 15 years from the date of publication of this notification, phase out the utilisation of fly ash in accordance with the action plan to be drawn up by the power plants. Such action plan shall provide for 20% of fly ash utilisation within three years from the date of publication of this notification, with further increase in utilisation every year progressively for next 12 years to enable utilisation of the entire ash generated in the power plan.
(iii) All action plan prepared by coal or lignite thermal power plants in accordance with sub para (ii) and (iii) of para 2 of this notification, shall be submitted to the Central Control Board, concerned State Pollution Control Boards/Committee and concerned regional office of the Ministry of Environment and Forest within a period of six months from the date of publication of this notification.
(iv) The Central and State Government Agencies, the State Electricity Boards, the National Thermal Power Corporation and the management of the thermal power plant shall facilitate in making available land, electricity and water for manufacturing activities and

Performance Review of Thermal Power Stations 1999-00 Section-13 PAGE NO 160
provide access to the ash lifting area for promoting and setting up of ash-based production units in the proximity of the area where ash is generate by power plant.
(v) Annual implementation report providing information about the compliance of provision in this notification shall be submitted by the 30th day of April every year to the Central Pollution Control Board, concerned State Pollution Control Boards/Committee and concerned regional office of the Ministry of Environment and Forests by the Coal or lignite based thermal power plants.
3. Specification for use of ash-based products :
(i) Manufacture of ash-based products such as cement, concrete blocks, bricks, panels or any other material for the use of ash in construction activity such as in road laying, embankments or use as landfill to reclaim low lying areas including back filling in abandoned mines or pitheads or for any other use shall be carried out in accordance with certification and guidelines laid-down by the Bureau of Indian Standards, Indian Bureau of Mines, Indian Roads Congress, Central Building Research Institute, Roorkee, Central Road Research Institute, in New Delhi, Building Material and Technology Promotion Council, New Delhi, Central Public Works Department, State Public Works Departments and other Central and State Government Agencies.
(ii) The Central Public Works Departments, Public Works Departments in the State/Union Territory Government, Development Authority, Housing Boards, National Highway Authority of India and other construction agencies including those in the private sector shall also prescribe the use of ash and ash based products in their respective schedules of specifications and construction applications, including appropriate standards and codes of factors, within a period of four months from the publication of this notification.
(iii) All local authorities shall specify in their respective building bye-laws and regulations the use of ash and ash based products and construction techniques in building materials, roads, embankments or for any other use within a period of four months from the date of publication of this notification.