Performance Overhead and Comparative Performance...
37
Peter Senna Tschudin Performance Overhead and Comparative Performance of 4 Virtualization Solutions Version 1.29
Transcript of Performance Overhead and Comparative Performance...
Peter Senna Tschudin
Performance Overhead andComparative Performanceof 4 Virtualization Solutions
Version 1.29

Table of ContentsProject Description ..........................................................................................4
Virtualization Concepts....................................................................................4
Virtualization.................................................................................................4
Full virtualization versus para-virtualization .................................................5
Test Environment ............................................................................................6
Architecture .................................................................................................6
Operating Systems and auxiliary software ..................................................7
Benchmark Tools .........................................................................................7
CPU and Memory: LINPACK ...................................................................7
Running HPL.........................................................................................7
Disk: Bonnie++ .........................................................................................8
Running Bonnie++................................................................................8
Networking: Netperf .................................................................................9
Running Netperf....................................................................................9
Micro-operations: rdtscbench .................................................................10
Running rdtscbench............................................................................10
Important notes about micro-operations and rdtscbench....................11
Hardware benchmark ................................................................................12
Overhead and Performance ......................................................................12
Numbers ....................................................................................................12
Bash scripts, Windows, and Cygwin ..........................................................13
Operating System version, Tuning, and guest tools ..................................14
Results...........................................................................................................15
Getting the higher score.............................................................................15
Performance Overhead..............................................................................16
VMWare ESXi 5 + vSphere 5.................................................................17
Microsoft Hyper-V Windows 2008 R2 SP1.............................................18
Page 2 of 37

Citrix XenServer 6...................................................................................19
Red Hat Enterprise Virtualization 2.2......................................................20
Overhead ranking...................................................................................21
Comparative Performance .........................................................................22
CPU and Memory: LINPACK .................................................................22
Linux ...................................................................................................22
Windows..............................................................................................23
Linux micro-operations: rdtscbench .......................................................24
Disk I/O and Latency: Bonnie++ ............................................................25
Linux ...................................................................................................25
Windows..............................................................................................27
Network I/O: Netperf ..............................................................................29
Linux....................................................................................................29
Windows..............................................................................................32
Detailed micro-operations results ..............................................................35
VMWare ESXi 5 + vSphere 5 ................................................................35
Microsoft Hyper-V Windows 2008 R2 SP1 ............................................35
Citrix XenServer 6: Linux .......................................................................35
Citrix XenServer 6: PV-Linux .................................................................35
Red Hat Enterprise Virtualization 2.2......................................................35
Important Notes .............................................................................................36
Is it possible to find errors? ........................................................................36
Are the results scenario dependent? .........................................................36
Copyright ...................................................................................................36
Registered trademarks ..............................................................................37
VMWare ESXi EULA and benchmarks result publication...........................37
Page 3 of 37

Project Description The purpose of this study was to determine the differences in performance overhead, and to compare the performance delivered to the virtual machine of the four main virtualization solutions for x86 architecture.
By overhead I mean the computing power and I/O that is spent by the virtualization layer. By performance I mean the computing power and I/O available for the virtual machines.
The 4 major players were selected based on the document: “Server virtualization vendor landscape 2011” from Infotech. The document is available for download at: http://goo.gl/0Y0ST. I've selected one product, or solution, for each player based on commercial issues. The four solutions are commercially competing for data center consolidation.
The product selection: • VMWare ESXi 5 + vSphere 5 • Microsoft Hyper-V Windows 2008 R2 SP1 • Citrix XenServer 6 • Red Hat Enterprise Virtualization 2.2
Benchmark tests: • CPU and memory performance • Network performance for TCP and UDP • Disk performance and latency • Micro operations execution time
Guest Operating Systems: • Microsoft Windows 2008 R2 64 bits • Red Hat Enterprise Linux 6.1 64 bits
Virtualization Concepts
VirtualizationVirtualization is a framework or methodology of dividing the resources of a computer into multiple execution environments. Virtualization techniques create multiple isolated partitions named Virtual Machines (VM) on a single
Page 4 of 37

physical server. There are several kinds of virtualization techniques which provide similar features but differ in the degree of abstraction and the methods used for virtualization.
Full virtualization versus para-virtualization There are several ways to implement virtualization. Two leading approaches are full virtualization and para-virtualization (PV). Full virtualization is designed to provide total abstraction of the underlying physical system and creates a complete virtual system in which the guest operating systems can execute. No modification is required in the guest OS or application; the guest OS or application is not aware of the virtualized environment so they have the capability to execute on the VM just as they would on a physical system. This approach can be advantageous because it enables complete decoupling of the software from the hardware. As a result, full virtualization can streamline the migration of applications and workloads between different physical systems. Full virtualization also helps provide complete isolation of different applications, which helps make this approach highly secure.
However, full virtualization may incur a performance penalty. The VM monitor must provide the VM with an image of an entire system, including virtual BIOS, virtual memory space, and virtual devices. The VM monitor also must create and maintain data structures for the virtual components, such as a shadow memory page table. These data structures must be updated for every corresponding access by the VMs.
In contrast, para-virtualizationn presents each VM with an abstraction of the hardware that is similar but not identical to the underlying physical hardware. Para-virtualization techniques require modifications to the guest operating systems that are running on the VMs. As a result, the guest operating systems are aware that they are executing on a VM, allowing for near-native performance.
While full virtualization does not require modifications on guest operating system, it may incur performance penalty.
While para-virtualization allows near-native performance, it is mandatory to modify the guest operating system to allow it to run as para-virtualized guest.
Page 5 of 37

At the time of writing this document, XenServer was the only solution that provides para-virtualization. Some Linux vendors supports running its operating systems under para-virtualization. Microsoft Windows does not run under para-virtualization.
Test Environment
Architecture
Both server and hypervisor are Sun Fire X4150 servers each with 8GB of RAM, 2X Intel Xeon E5440 CPU, and four gigabit Ethernet ports.
workstation is a Toshiba U205-S5067 notebook with 4GB of RAM and Intel Core 2 Duo T7200 CPU. This host was used as remote control for the virtualization solutions, allowing the creation of virtual machines and hypervisor configuration. The performance of this host does not affect the virtual machine performance.
The host identified as server was iSCSI target and Netperf server for network benchmark. All networking connections are gigabit Ethernet. The RAID 10 array composed by 6X 136GB SAS disks was exported over iSCSI to hypervisor. All virtual machines were stored in the iSCSI volume. Disk tests made on hardware also used the iSCSI volume.
The host identified as hypervisor was used to test the four different virtualization solutions. This is the server that hosted the virtual machines and the server used for hardware benchmark.
Page 6 of 37

The network connections identified as iSCSI and netperf were direct connections with cross-over cables. The switch on management network is a low end device. No performance tests were made over management network.
Operating Systems and auxiliary software server was installed before the beginning of the tests and was not changed until the tests finished. Operating System and Software: Red Hat Enterprise Linux 6.1 64 bits with extra packages for Netperf and iSCSI.
workstation Operating System and Software: Red Hat Enterprise Linux 6.1 with Virtualization package group installed. One virtual machine with Windows 2008 R2 was used as remote control for the virtualization solutions.
hypervisor Operating System and Software: One fresh install for each solution.
Benchmark Tools
CPU and Memory: LINPACK
LINPACK is a software library for performing numerical linear algebra on digital computers. It was originally written in Fortran in the 1970s. The LINPACK Benchmarks are a measure of a system's floating point computing power. This benchmark is widely used in mathematical computer clusters, and a similar tool is used as a performance measure for ranking supercomputers in the TOP500 list of the world's fastest computers.
LINPACK was chosen due its intense use of memory and CPU. It returns a value in GFlops which is directly affected by CPU and memory performance. Intel provides binaries for both Windows and Linux named “Intel® Math Kernel Library – LINPACK”. Those binaries were used in the tests.
Running HPL
For running HPL, it is required to create a configuration file containing the problem size and some other parameters. The maximum problem size is related to memory consumption. For smaller memory setups it is required smaller problem sizes.
Page 7 of 37

Sample Intel(R) LINPACK data file (lininput_xeon32) Intel(R) LINPACK data 9 # number of tests 15000 14000 13000 12000 11000 10000 8000 6000 1000 # problem sizes 15000 14008 13000 12008 11000 10008 8008 6008 1000 # leading dimensions 1 2 2 2 2 2 2 3 4 # times (trials) to run a test 4 4 4 4 4 4 4 4 4 # alignment values (in KBytes)
Input file for hardware and for single VM
Sample Intel(R) LINPACK data file (lininput_xeon32) Intel(R) LINPACK data 4 # number of tests 10000 8000 6000 1000 # problem sizes 10008 8008 6008 1000 # leading dimensions 2 2 3 4 # times (trials) to run a test 4 4 4 4 # alignment values (in KBytes)
Input file for 2 simultaneous VMs
Sample Intel(R) LINPACK data file (lininput_xeon32) Intel(R) LINPACK data 3 # number of tests 7500 4000 1000 # problem sizes 7508 4008 1000 # leading dimensions 3 3 4 # times (trials) to run a test 4 4 4 # alignment values (in KBytes)
Input file for 4 simultaneous VMs
From: http://goo.gl/L1A62
Disk: Bonnie++
Bonnie++ is a benchmark suite for testing disk and filesystem. Several different parameters are evaluated to allow comparison between different systems. Bonnie++ minimizes the effects of disk caching which is important not to generate unrealistic results.
Running Bonnie++
Bonnie++ is flexible and allows high level of configuration. “-n 1” sets to (1 * 1024) the number of files used in files creation tests. “-f” skips per-char IO tests. “-b” means no write buffering, fsync() after every write.
# bonnie++ u 0 n 1 f b d /opt/benchscripts/bonnie
Bonnie command line for all tests
From: http://goo.gl/osId8
Page 8 of 37

Networking: Netperf
“Netperf is a benchmark that can be used to measure the performance of many different types of networking. It provides tests for both unidirectional throughput, and end-to-end latency.” The benchmark tests are listed below:
TCP_STREAM
The TCP_STREAM test is the default test in netperf. It is quite simple, transferring some quantity of data from the system running netperf to the system running netserver. While time spent establishing the connection is not included in the throughput calculation, time spent flushing the last of the data to the remote at the end of the test is.
TCP_RR
Request/response performance is quoted as "transactions/s" for a given request and response size. A transaction is defined as the exchange of a single request and a single response.
TCP_CRR
Connect/Request/Response test measures the performance of establishing a connection, exchanging a single request/response transaction, and tearing-down that connection. This is very much like what happens in an HTTP 1.0 or HTTP 1.1 connection when HTTP Keepalives are not used.
UDP_RRIt is very much the same as a TCP_RR test except UDP is used rather than TCP.
UDP_STREAMA UDP_STREAM test is similar to a TCP_STREAM test except UDP is used as the transport rather than TCP.
Table: Netperf tests description
Running Netperf
To run Netperf it is required to inform the test to be run and the remote host that is running netserver. It is optional to inform the test length. The script below was used to run all Netperf benchmark tests.
Page 9 of 37
#!/bin/bash
LEN=80 TESTS="TCP_STREAM TCP_RR TCP_CRR UDP_RR UDP_STREAM" HOST=server.lmpdc
for test in $TESTS;do FILENAME=`hostname`$HOSTnetperf$test`date +"%d%m%Y%H%M%S"`.txt echo $FILENAME netperf H $HOST l $LEN t $test > $FILENAME sleep 10
done
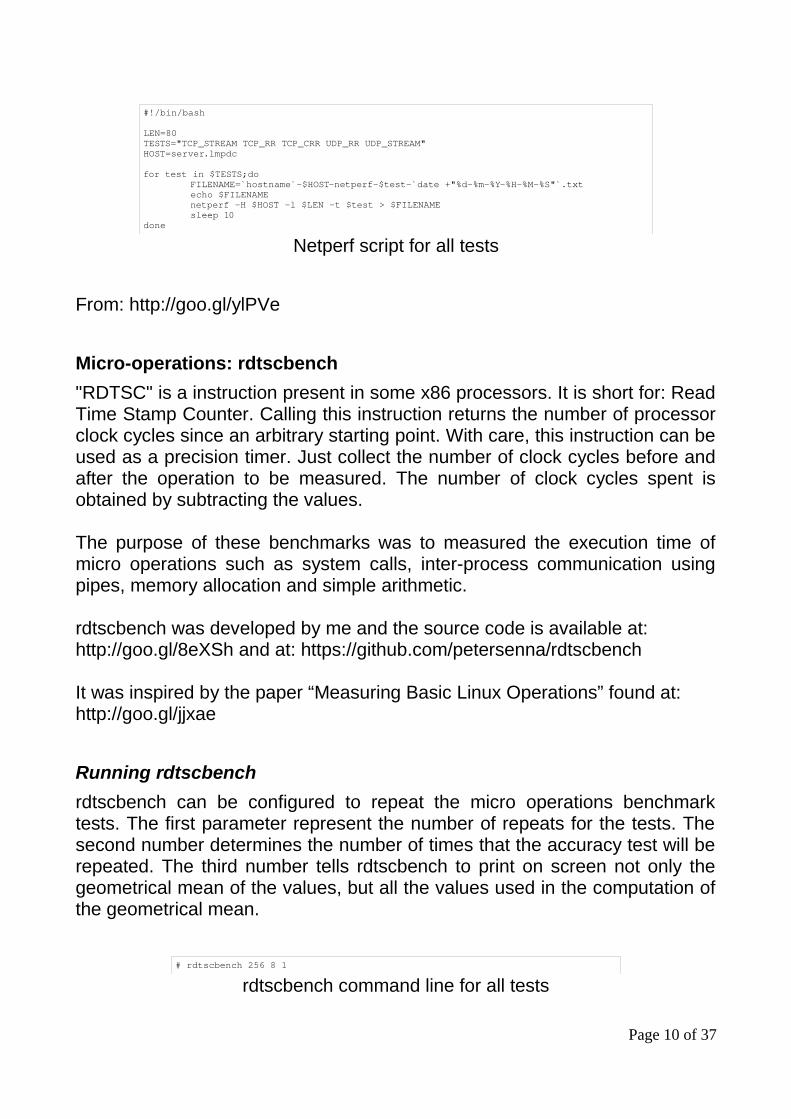
Netperf script for all tests
From: http://goo.gl/ylPVe
Micro-operations: rdtscbench
"RDTSC" is a instruction present in some x86 processors. It is short for: Read Time Stamp Counter. Calling this instruction returns the number of processor clock cycles since an arbitrary starting point. With care, this instruction can be used as a precision timer. Just collect the number of clock cycles before and after the operation to be measured. The number of clock cycles spent is obtained by subtracting the values.
The purpose of these benchmarks was to measured the execution time of micro operations such as system calls, inter-process communication using pipes, memory allocation and simple arithmetic.
rdtscbench was developed by me and the source code is available at: http://goo.gl/8eXSh and at: https://github.com/petersenna/rdtscbench
It was inspired by the paper “Measuring Basic Linux Operations” found at: http://goo.gl/jjxae
Running rdtscbench
rdtscbench can be configured to repeat the micro operations benchmark tests. The first parameter represent the number of repeats for the tests. The second number determines the number of times that the accuracy test will be repeated. The third number tells rdtscbench to print on screen not only the geometrical mean of the values, but all the values used in the computation of the geometrical mean.
# rdtscbench 256 8 1
rdtscbench command line for all tests
Page 10 of 37

Important notes about micro-operations and rdtscbench
The first important note about micro-operations benchmarks is that it was not possible to find direct relations between micro-operations results and real world application performance. Based on the results, it is clear that good results on micro-operations does not “direct” reflect on other benchmarks results.
Real world applications rarely deal with only a tiny set of tasks like sending the word “message” though a pipe between two processes. It is more likely that real world application will be made of very larger set of tasks. Sending a small file over the Internet using the HTTP protocol is a huge task compared to a micro-operation.
The hypervisors are optimized for real world applications and do not perform well on micro-operations. This may not be a problem for your application. The important message is that, unless your entire application is a micro-operation that spends less than 1,000 clock cycles to finish (For a 2.6 GHz CPU, 1,000 clock cycles are spent in 385 nanoseconds), real world benchmarks are more important to you than micro-operation benchmarks.
The hypervisor optimization for non-micro tasks becomes clear on the simplemath[] test which takes about 2.7 million clock cycles to complete on hardware. The time to run inside virtual machines were almost the same to run on hardware for all tested hypervisors. See complete result set on “Detailed micro-operation results”.
The second important note is about the rdtscbench benchmark software. RDTSC is not a popular instruction to be used as a precision timer, because it can report incorrect values if used incorrectly. Can be worst when on multiple CPU environment. To avoid the problems, rdtscbench measure its accuracy every time it is called. It counts the number of clock cycles in a period of a second and compares it to the CPU clock. The average accuracy of rdtscbench during the benchmark tests was over 99%.
# ./rdtscbench 256 8
getpid() : 266.879086 clocks. Geom. mean of 256 values. sysconf() : 994.026190 clocks. Geom. mean of 256 values. gettimeofday() : 451.414197 clocks. Geom. mean of 256 values. malloc[1M] : 334.946010 clocks. Geom. mean of 256 values. malloc[1G] : 8732.190286 clocks. Geom. mean of 256 values. 2pipes[] : 182271.544840 clocks. Geom. mean of 256 values. simplemath[] : 2741467.741784 clocks. Geom. mean of 256 values.
Page 11 of 37
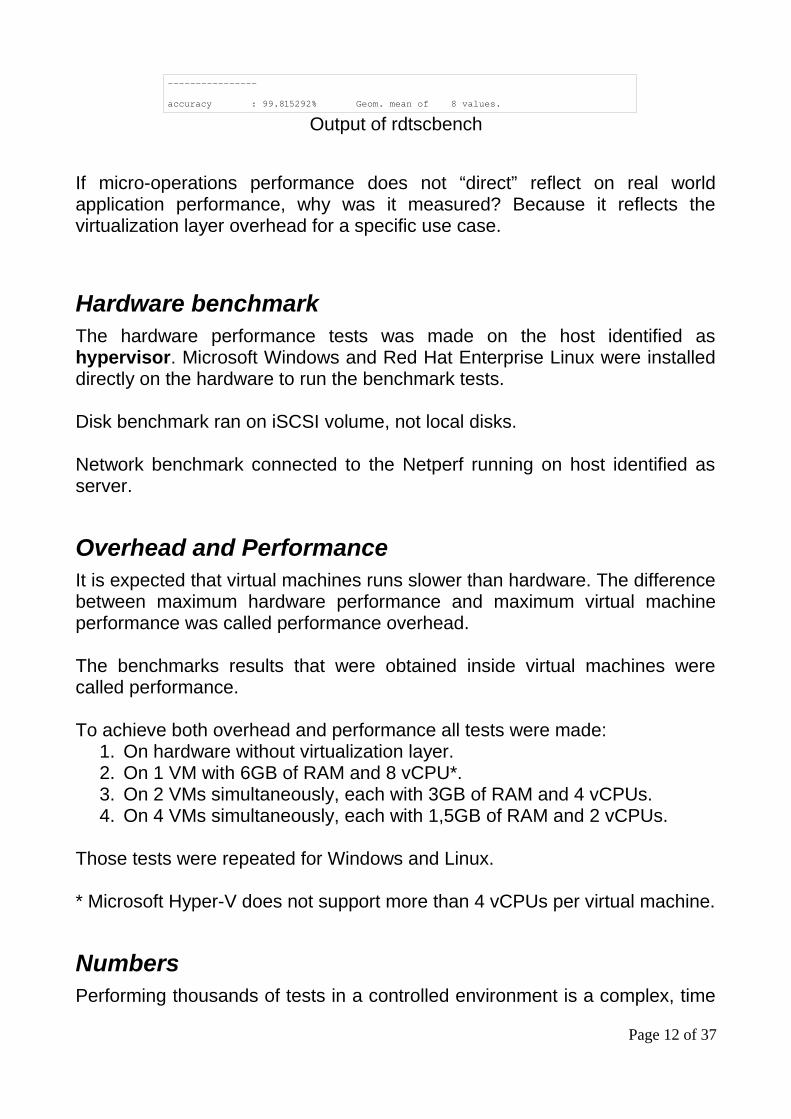
accuracy : 99.815292% Geom. mean of 8 values.
Output of rdtscbench
If micro-operations performance does not “direct” reflect on real world application performance, why was it measured? Because it reflects the virtualization layer overhead for a specific use case.
Hardware benchmark The hardware performance tests was made on the host identified as hypervisor. Microsoft Windows and Red Hat Enterprise Linux were installed directly on the hardware to run the benchmark tests.
Disk benchmark ran on iSCSI volume, not local disks.
Network benchmark connected to the Netperf running on host identified as server.
Overhead and Performance It is expected that virtual machines runs slower than hardware. The difference between maximum hardware performance and maximum virtual machine performance was called performance overhead.
The benchmarks results that were obtained inside virtual machines were called performance.
To achieve both overhead and performance all tests were made: 1. On hardware without virtualization layer. 2. On 1 VM with 6GB of RAM and 8 vCPU*. 3. On 2 VMs simultaneously, each with 3GB of RAM and 4 vCPUs. 4. On 4 VMs simultaneously, each with 1,5GB of RAM and 2 vCPUs.
Those tests were repeated for Windows and Linux.
* Microsoft Hyper-V does not support more than 4 vCPUs per virtual machine.
Numbers Performing thousands of tests in a controlled environment is a complex, time
Page 12 of 37

consuming, expensive, and tedious task. The challenge is to run specific tests several times changing only desirable and known variables like the virtualization software, memory size, or number of virtual CPUs. But there may be external factors, which are hard to control, that affects the results. To minimize the effects of external factors each set of tests was run five times with a boot sequence between each set of tests.
For each one of 4 virtualization solutions, 7 tests were run with different virtual machine configurations. Each test was executed under 2 different operating systems. Each test was run 5 times. Each Windows test set consists of 8 tests. Each Linux test set consists of 9 tests. Therefore the total number of performed tests within virtual machines was:
4 * 7 * 2 * 5 * (8 + 9)/2 = 2380
The hardware was also tested. There are 2 operating systems. Each operating system was tested 5 times. Each Windows test set consists of 8 tests. Each Linux test set consists of 9 tests. Therefore the total number of tests performed on hardware was:
2 * 5 * (8 + 9)/2 = 85
XenServer offers paravirtualized virtual machines for running Linux. These tests were also made. 7 tests with different configurations of virtual machines. Each test was run 5 times. Each Linux test set consists of 9 tests. Therefore the total number of tests performed on paravirtualized machine was:
7 * 5 * 9 = 315
The total number of tests:
2380 + 85 + 315 = 2780
Bash scripts, Windows, and Cygwin The expressive numbers describes part of the challenges of doing large benchmark tests. Automation is the key point that defines if the benchmark is viable or not. It would not be possible if tests required graphical interface intervention like clicking the mouse.
Automation is important due reducing necessary time to complete the
Page 13 of 37

benchmark, but also to remove the operator interference in the results. For repeating and tedious tasks, humans are not so accurate as scripts are.
Automation is easy with Linux, Bash scripts, ssh, and command line tools. I've developed scripts that took care of starting individual benchmark tests, synchronizing concurrent tests, starting services and rebooting virtual machines and servers.
I wanted to reuse as much script code as I could on Windows, I also wanted to use same benchmark tools on Linux and Windows. I opted to use Cygwin to do that.
Cygwin is a collection of tools which provide a Linux look and feel environment for Windows. It allows to compile POSIX compatible source code on Windows without modifications. It also provides ssh server and client.
As the benchmark goals does not include comparing Windows and Linux performance, the use of Cygwin, which may have performance considerations, is not a problem. But I warn you that the benchmark results may not fit to be used to compare Windows and Linux performance.
Cygwin: http://goo.gl/ISv2m
Operating System version, Tuning, and guest tools It was assumed that the virtualization solutions were delivered tuned for best performance. Due that no tuning was made at hypervisor level.
The virtual machines were created following the recommended configuration and the guest tools and/or drivers were installed before starting benchmark tests.
The Linux virtual machines were tuned with Kernel boot parameter “elevator=noop”. This was done to improve disk performance. The exact same tuning was done for all evaluated virtual machines running Linux.
No software updates were executed during the tests. The exact same version of Microsoft Windows and Red Hat Enterprise Linux were used on all tests.
This mean that the exact same operating system were “installed” on the 4 different evaluated solutions.
Page 14 of 37
The virtual machines were not cloned and/or converted between different virtualization solutions. For each virtualization solution, one virtual machine were fresh installed for Linux and other for Windows. The installations were done following the virtualization solution recommendations.
Results
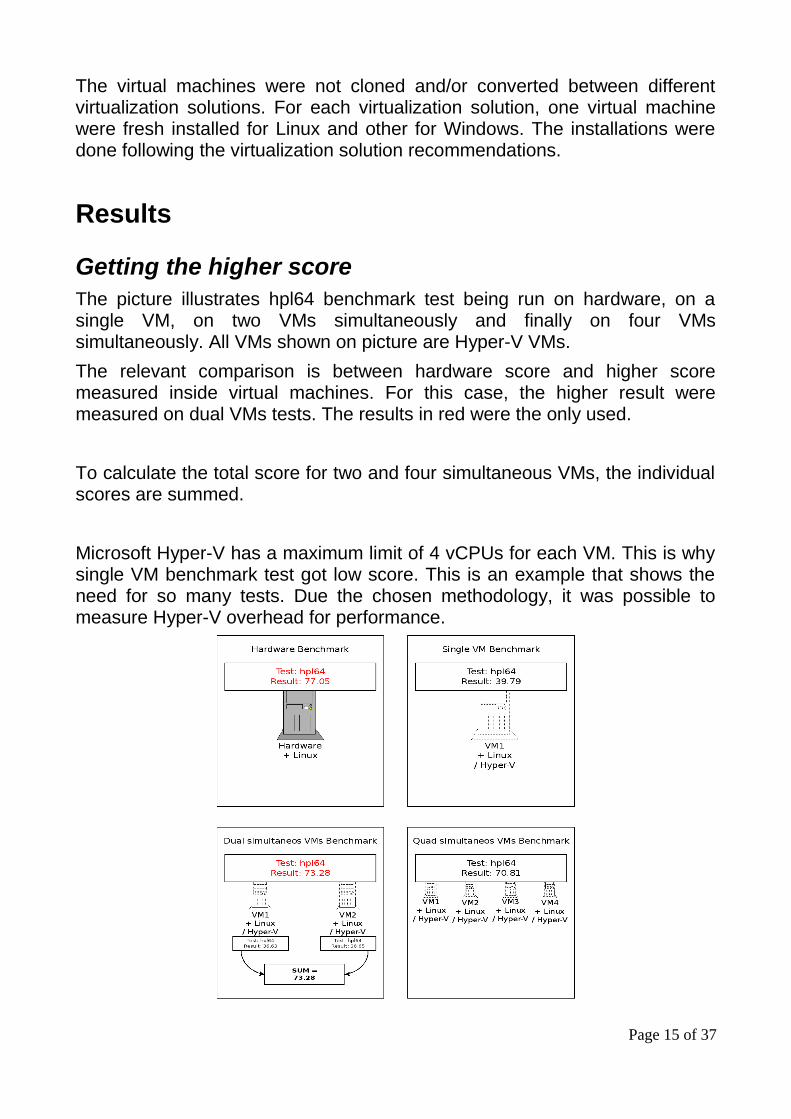
Getting the higher scoreThe picture illustrates hpl64 benchmark test being run on hardware, on a single VM, on two VMs simultaneously and finally on four VMs simultaneously. All VMs shown on picture are Hyper-V VMs.
The relevant comparison is between hardware score and higher score measured inside virtual machines. For this case, the higher result were measured on dual VMs tests. The results in red were the only used.
To calculate the total score for two and four simultaneous VMs, the individual scores are summed.
Microsoft Hyper-V has a maximum limit of 4 vCPUs for each VM. This is why single VM benchmark test got low score. This is an example that shows the need for so many tests. Due the chosen methodology, it was possible to measure Hyper-V overhead for performance.
Page 15 of 37
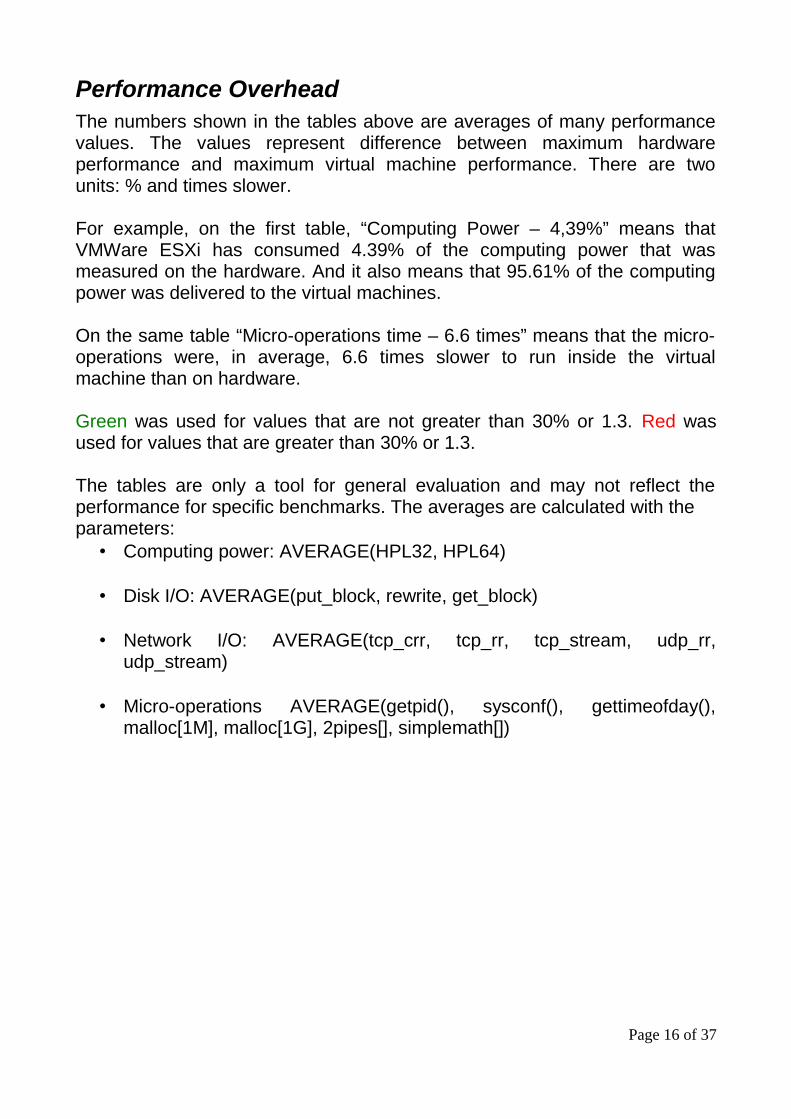
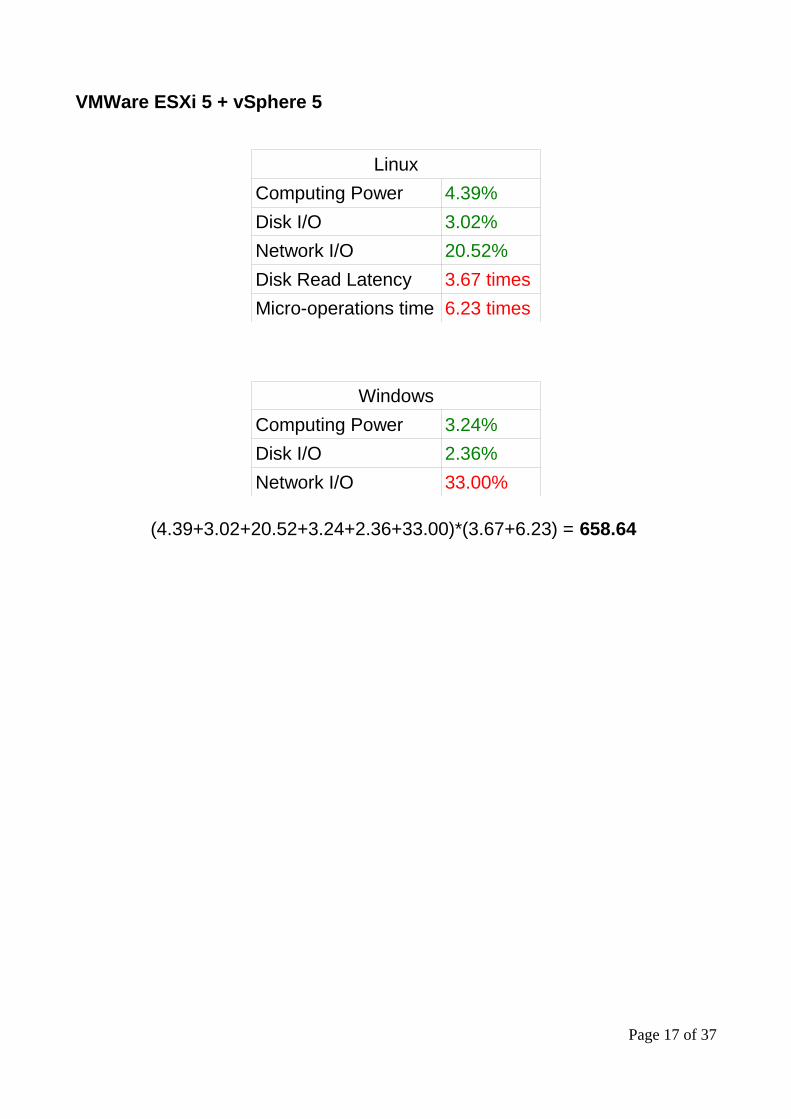
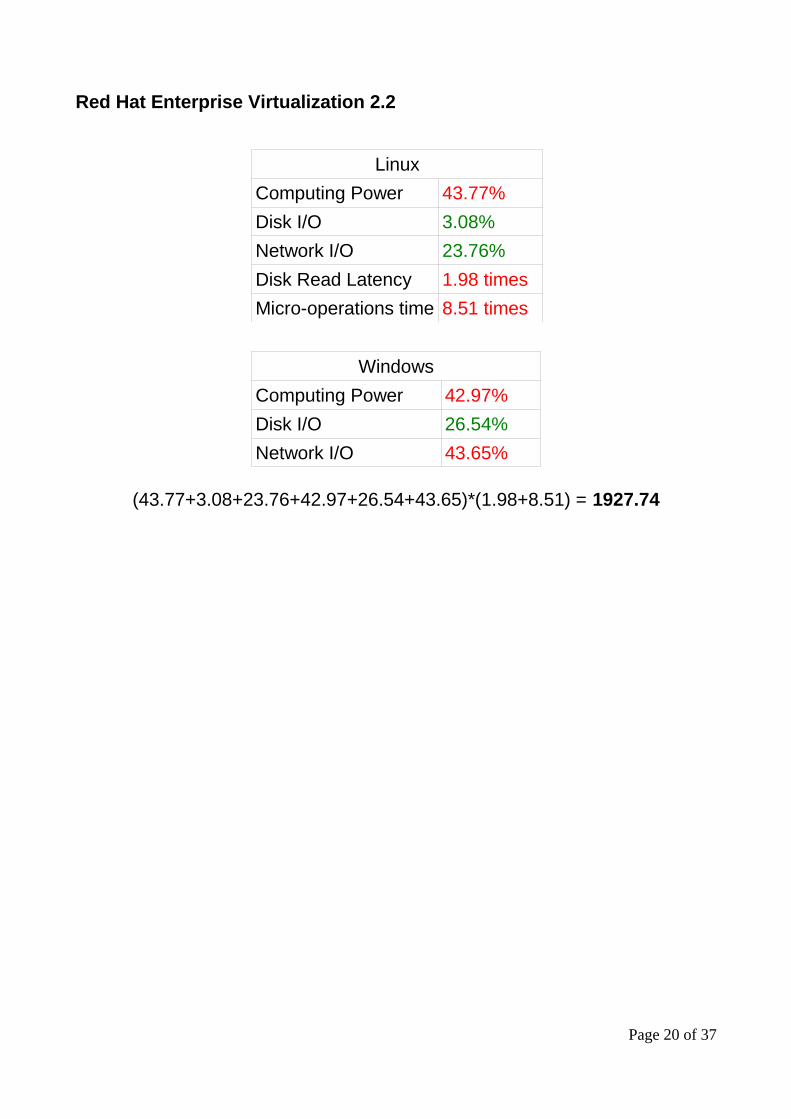
Performance OverheadThe numbers shown in the tables above are averages of many performance values. The values represent difference between maximum hardware performance and maximum virtual machine performance. There are two units: % and times slower.
For example, on the first table, “Computing Power – 4,39%” means that VMWare ESXi has consumed 4.39% of the computing power that was measured on the hardware. And it also means that 95.61% of the computing power was delivered to the virtual machines.
On the same table “Micro-operations time – 6.6 times” means that the micro-operations were, in average, 6.6 times slower to run inside the virtual machine than on hardware.
Green was used for values that are not greater than 30% or 1.3. Red was used for values that are greater than 30% or 1.3.
The tables are only a tool for general evaluation and may not reflect the performance for specific benchmarks. The averages are calculated with the parameters:
• Computing power: AVERAGE(HPL32, HPL64)
• Disk I/O: AVERAGE(put_block, rewrite, get_block)
• Network I/O: AVERAGE(tcp_crr, tcp_rr, tcp_stream, udp_rr, udp_stream)
• Micro-operations AVERAGE(getpid(), sysconf(), gettimeofday(), malloc[1M], malloc[1G], 2pipes[], simplemath[])
Page 16 of 37
VMWare ESXi 5 + vSphere 5
Linux
Computing Power 4.39%
Disk I/O 3.02%
Network I/O 20.52%
Disk Read Latency 3.67 times
Micro-operations time 6.23 times
Windows
Computing Power 3.24%
Disk I/O 2.36%
Network I/O 33.00%
(4.39+3.02+20.52+3.24+2.36+33.00)*(3.67+6.23) = 658.64
Page 17 of 37

Microsoft Hyper-V Windows 2008 R2 SP1
Linux
Computing Power 5.43%
Disk I/O 24.07%
Network I/O 16.50%
Disk Read Latency 2.13 times
Micro-operations time 15.10 times
Windows
Computing Power 3.10%
Disk I/O 20.96%
Network I/O 24.34%
(5.43+24.07+16.50+3.10+20.96+24.34)*(2.13+15.10) = 1626.51
Page 18 of 37

Citrix XenServer 6
Linux*
Computing Power 3.86%
Disk I/O 3.73%
Network I/O 37.06%
Disk Read Latency 1.86
Micro-operations time 13.53
PV-Linux
Computing Power 8.49%
Disk I/O 0.00%
Network I/O 23.96%
Disk Read Latency 2.03
Micro-operations time 4.91
Windows
Computing Power 2.91%
Disk I/O 10.93%
Network I/O 40.07%
PV-Linux: (8.49+0.00+23.96+2.91+10.93+40.07)*(2.03+4.91) = 599.33
Linux: (3.86+3.73+37.06+2.91+10.93+40.07)*(1.86+13.53) = 1516.83
*The “supported” configuration by Citrix is PV-Linux. Linux results were calculated to allow direct comparison with the other 3 solutions.
Page 19 of 37
Red Hat Enterprise Virtualization 2.2
Linux
Computing Power 43.77%
Disk I/O 3.08%
Network I/O 23.76%
Disk Read Latency 1.98 times
Micro-operations time 8.51 times
Windows
Computing Power 42.97%
Disk I/O 26.54%
Network I/O 43.65%
(43.77+3.08+23.76+42.97+26.54+43.65)*(1.98+8.51) = 1927.74
Page 20 of 37
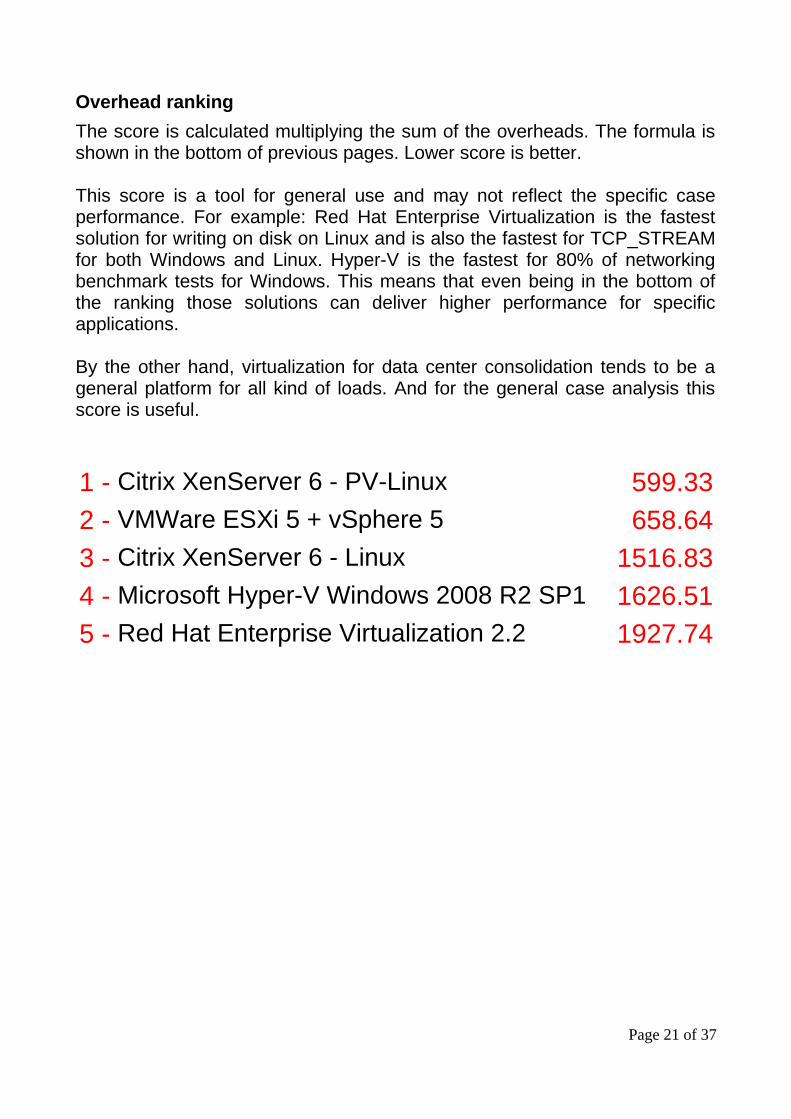
Overhead ranking
The score is calculated multiplying the sum of the overheads. The formula is shown in the bottom of previous pages. Lower score is better.
This score is a tool for general use and may not reflect the specific case performance. For example: Red Hat Enterprise Virtualization is the fastest solution for writing on disk on Linux and is also the fastest for TCP_STREAM for both Windows and Linux. Hyper-V is the fastest for 80% of networking benchmark tests for Windows. This means that even being in the bottom of the ranking those solutions can deliver higher performance for specific applications.
By the other hand, virtualization for data center consolidation tends to be a general platform for all kind of loads. And for the general case analysis this score is useful.
1 - Citrix XenServer 6 - PV-Linux 599.33
2 - VMWare ESXi 5 + vSphere 5 658.64
3 - Citrix XenServer 6 - Linux 1516.83
4 - Microsoft Hyper-V Windows 2008 R2 SP1 1626.51
5 - Red Hat Enterprise Virtualization 2.2 1927.74
Page 21 of 37

Comparative Performance
CPU and Memory: LINPACK
Linux
Page 22 of 37
0
10
20
30
40
50
60
70
80
Test: HPL32 Best result: XenServer
Linux@vSphere Linux@Hyper-V Linux@XenServer
Linux@RHEV PVLinux@XenServer
GF
LO
PS
0
10
20
30
40
50
60
70
80
Test: HPL64 Best result: XenServer
Linux@vSphere Linux@Hyper-V Linux@XenServer
Linux@RHEV PVLinux@XenServer
GF
LO
PS

Windows
Page 23 of 37
0
10
20
30
40
50
60
70
80
Test: HPL32 Best result: vSphere
Windows@vSphere Windows@Hyper-V Windows@XenServer Windows@RHEV
GF
LO
PS
0
10
20
30
40
50
60
70
80
Test: HPL64 Best result: XenServer
Windows@vSphere Windows@Hyper-V
Windows@XenServer Windows@RHEV
GF
LO
PS

Linux micro-operations: rdtscbench
For this test, lower is better.
Page 24 of 37
0
1
2
3
4
5
6
7
8
9
10
Test: rdtsc Best result: XenServer-PV
Linux@vSphere Linux@Hyper-V Linux@XenServer
Linux@RHEV PVLinux@XenServer
time
s s
low
er

Disk I/O and Latency: Bonnie++
Linux
Page 25 of 37
0
20000
40000
60000
80000
100000
120000
140000
Test: put_block Best result: RHEV
Linux@vSphere Linux@Hyper-V Linux@XenServer
Linux@RHEV PVLinux@XenServer
KB
yte
s /
S
0
10000
20000
30000
40000
50000
60000
Test: rewrite Best result: vSphere
Linux@vSphere Linux@Hyper-V Linux@XenServer
Linux@RHEV PVLinux@XenServer
KB
yte
s /
s
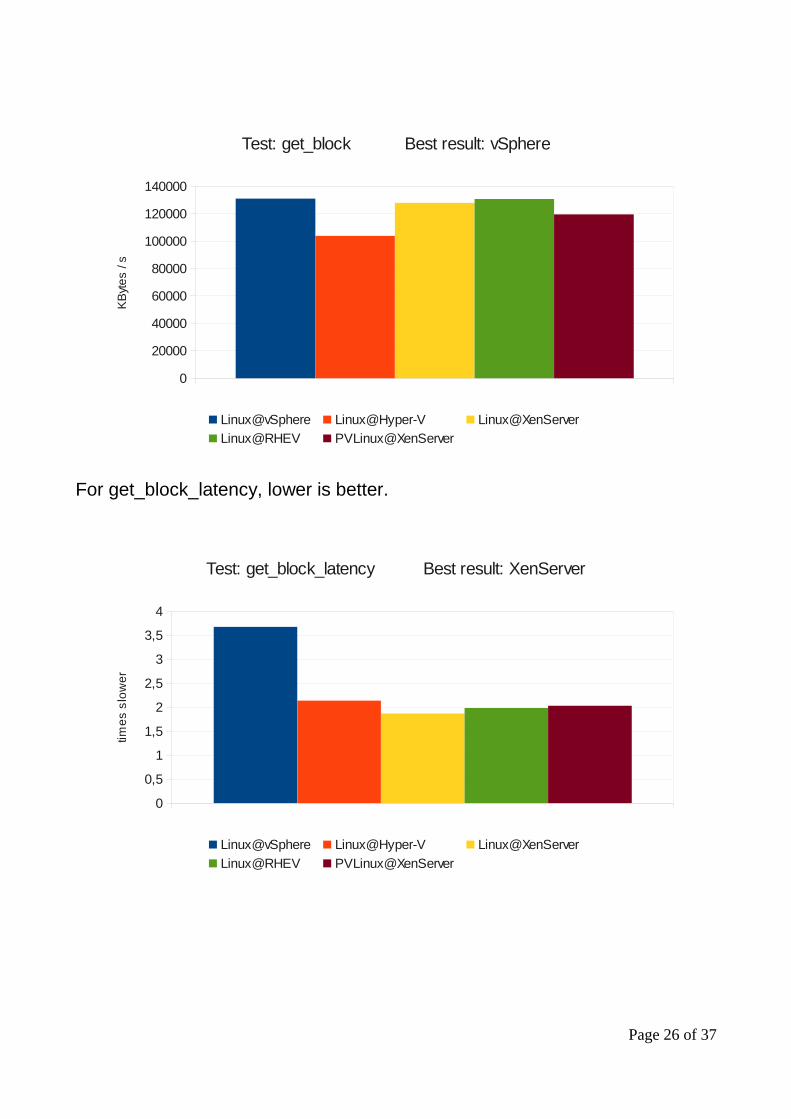
For get_block_latency, lower is better.
Page 26 of 37
0
20000
40000
60000
80000
100000
120000
140000
Test: get_block Best result: vSphere
Linux@vSphere Linux@Hyper-V Linux@XenServer
Linux@RHEV PVLinux@XenServer
KB
yte
s /
s
0
0,5
1
1,5
2
2,5
3
3,5
4
Test: get_block_latency Best result: XenServer
Linux@vSphere Linux@Hyper-V Linux@XenServer
Linux@RHEV PVLinux@XenServer
time
s s
low
er

Windows
Page 27 of 37
0
20000
40000
60000
80000
100000
120000
Test: put_block Best result: XenServer
Windows@vSphere Windows@Hyper-V
Windows@XenServer Windows@RHEV
KB
yte
s /
s
0
5000
10000
15000
20000
25000
30000
35000
40000
45000
Test: rewrite Best result: vSphere
Windows@vSphere Windows@Hyper-V Windows@XenServer Windows@RHEV
KB
yte
s /
s

Page 28 of 37
0
10000
20000
30000
40000
50000
60000
70000
80000
Test: get_block Best result: vSphere
Windows@vSphere Windows@Hyper-V Windows@XenServer Windows@RHEV
KB
yte
s /
s

Network I/O: Netperf
Linux
Page 29 of 37
0
200
400
600
800
1000
1200
1400
1600
1800
Test: tcp_crr Best result: RHEV
Linux@vSphere Linux@Hyper-V Linux@XenServer
Linux@RHEV PVLinux@XenServer
tra
ns
act
ion
s /
se
c
0
1000
2000
3000
4000
5000
6000
7000
Test: tcp_rr Best result: vSphere
Linux@vSphere Linux@Hyper-V Linux@XenServer
Linux@RHEV PVLinux@XenServer
tra
ns
act
ion
s /
se
c
Page 30 of 37
0
100
200
300
400
500
600
700
800
900
1000
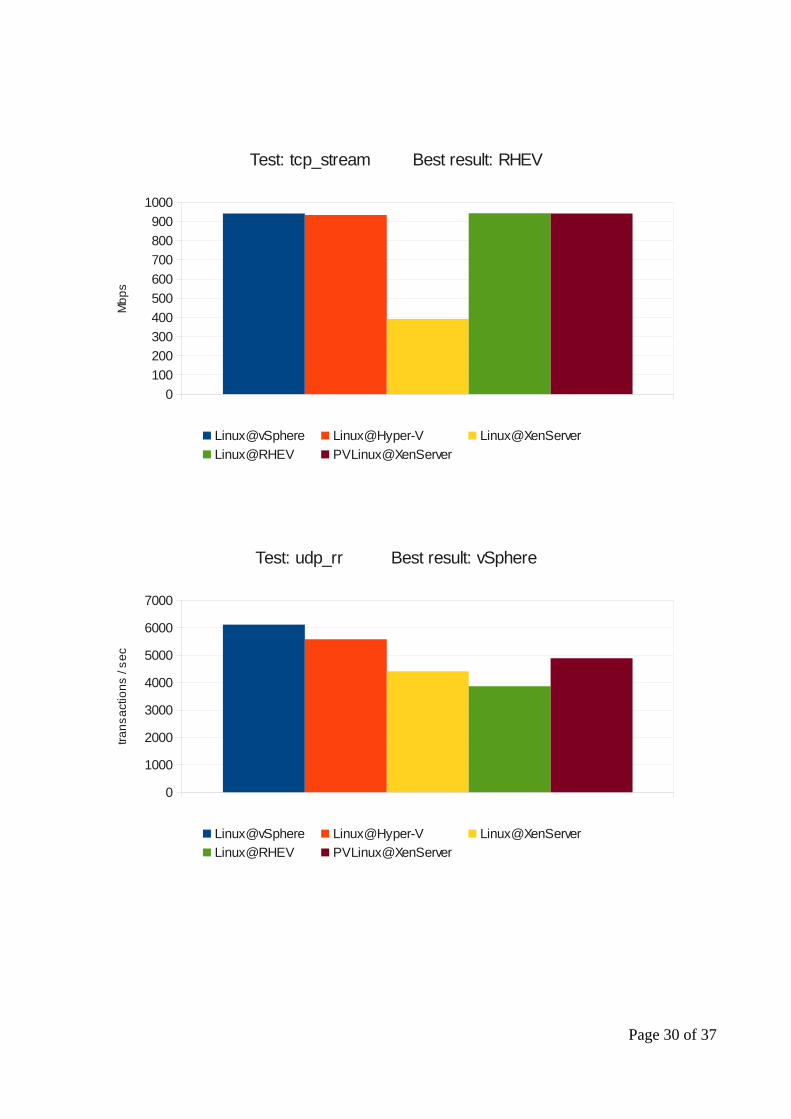
Test: tcp_stream Best result: RHEV
Linux@vSphere Linux@Hyper-V Linux@XenServer
Linux@RHEV PVLinux@XenServer
Mb
ps
0
1000
2000
3000
4000
5000
6000
7000
Test: udp_rr Best result: vSphere
Linux@vSphere Linux@Hyper-V Linux@XenServer
Linux@RHEV PVLinux@XenServer
tra
ns
act
ion
s /
se
c

Page 31 of 37
0
100
200
300
400
500
600
700
800
900
1000
Test: udp_stream Best result: XenServer-PV
Linux@vSphere Linux@Hyper-V Linux@XenServer
Linux@RHEV PVLinux@XenServer
Mb
ps

Windows
Page 32 of 37
0
500
1000
1500
2000
2500
Test: tcp_crr Best result: Hyper-V
Windows@vSphere Windows@Hyper-V
Windows@XenServer Windows@RHEV
tra
ns
act
ion
s /
se
c
0
1000
2000
3000
4000
5000
6000
7000
Test: tcp_rr Best result: Hyper-V
Windows@vSphere Windows@Hyper-V
Windows@XenServer Windows@RHEV
tra
ns
act
ion
s /
se
c

Page 33 of 37
0
100
200
300
400
500
600
700
800
900
1000
Test: tcp_stream Best result: RHEV
Windows@vSphere Windows@Hyper-V
Windows@XenServer Windows@RHEV
Mb
ps
0
1000
2000
3000
4000
5000
6000
7000
Test: udp_rr Best result: Hyper-V
Windows@vSphere Windows@Hyper-V
Windows@XenServer Windows@RHEV
tra
ns
act
ion
s /
se
c

Page 34 of 37
0
200
400
600
800
1000
1200
Test: udp_stream Best result: Hyper-V
Windows@vSphere Windows@Hyper-V
Windows@XenServer Windows@RHEV
Mb
ps
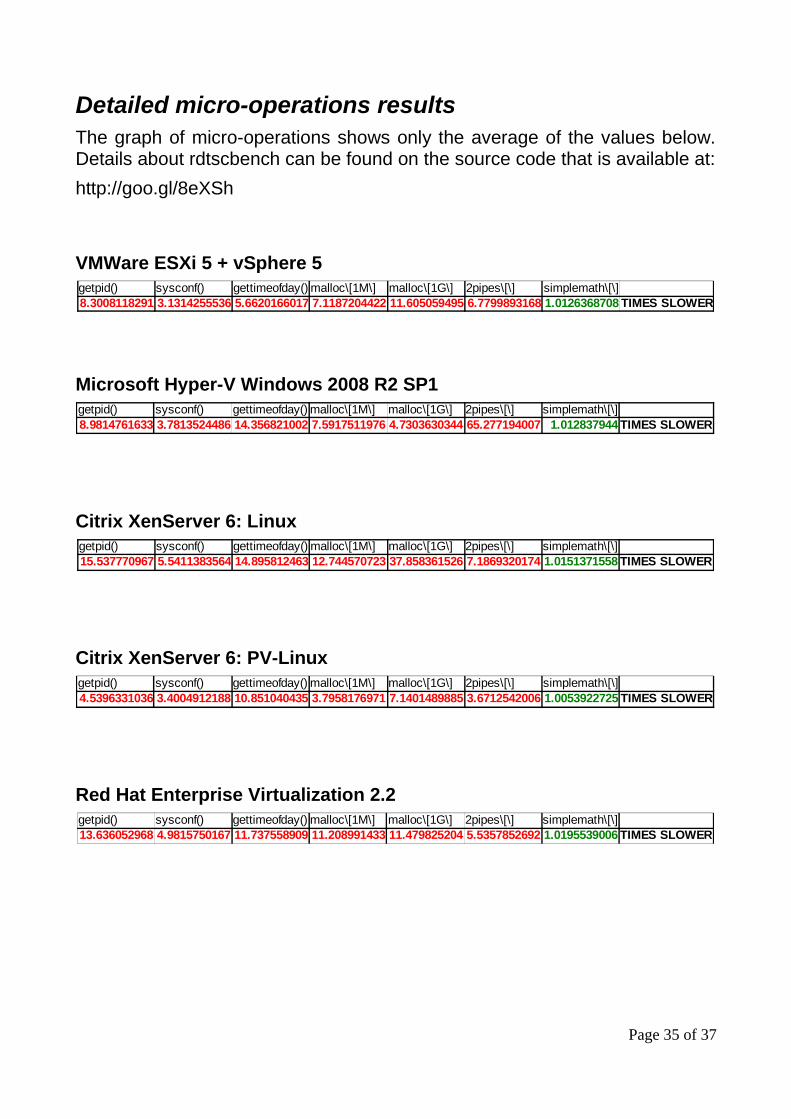
Detailed micro-operations results The graph of micro-operations shows only the average of the values below. Details about rdtscbench can be found on the source code that is available at:
http://goo.gl/8eXSh
VMWare ESXi 5 + vSphere 5
Microsoft Hyper-V Windows 2008 R2 SP1
Citrix XenServer 6: Linux
Citrix XenServer 6: PV-Linux
Red Hat Enterprise Virtualization 2.2
Page 35 of 37
2pipes\[\]8.3008118291 3.1314255536 5.6620166017 7.1187204422 11.605059495 6.7799893168 1.0126368708 TIMES SLOWERgetpid() sysconf() gettimeofday() malloc\[1M\] malloc\[1G\] simplemath\[\]
2pipes\[\]8.9814761633 3.7813524486 14.356821002 7.5917511976 4.7303630344 65.277194007 1.012837944 TIMES SLOWERgetpid() sysconf() gettimeofday() malloc\[1M\] malloc\[1G\] simplemath\[\]
2pipes\[\]15.537770967 5.5411383564 14.895812463 12.744570723 37.858361526 7.1869320174 1.0151371558 TIMES SLOWERgetpid() sysconf() gettimeofday() malloc\[1M\] malloc\[1G\] simplemath\[\]
2pipes\[\]4.5396331036 3.4004912188 10.851040435 3.7958176971 7.1401489885 3.6712542006 1.0053922725 TIMES SLOWERgetpid() sysconf() gettimeofday() malloc\[1M\] malloc\[1G\] simplemath\[\]
2pipes\[\]13.636052968 4.9815750167 11.737558909 11.208991433 11.479825204 5.5357852692 1.0195539006 TIMES SLOWERgetpid() sysconf() gettimeofday() malloc\[1M\] malloc\[1G\] simplemath\[\]
Important Notes
Is it possible to find errors? Even taking great care to achieve error free results, I need to warn you that it is not impossible that there are incorrect values. I did my best to be sure that nothing was missed, but this project deals with enormous amount of data.
About 25MB of plain text results files and 3MB of text-only spreadsheets. Great care was taken, and I think that the probability of finding errors is very low, but is not zero.
Are the results scenario dependent? Yes! All results, published on this document, are scenario dependent. The results may, and probably will, vary with different hardware, and with different benchmark software.
This does not mean that the results are useless, means that you need to be careful when using the results. If you are interested in the general case performance, the overhead ranking may be the appropriate tool while if you are interested in specific performance measurements, focus on the performance graphs.
Copyright
Performance Overhead and Comparative Performance of 4 Virtualization Solutions by Peter Senna Tschudin is licensed under a Creative Commons Attribution-ShareAlike 3.0
Unported License.
Please feel free to contact me about copyright issues and questions. My E-mail address is [email protected].
Page 36 of 37

Registered trademarks All trademarks and registered trademarks are property of their respective owners.
VMWare ESXi EULA and benchmarks result publicationVMWare ESXi EULA has a restriction about publishing benchmark results without prior approval from VMWare. This report received the approval on January 18, 2012 which can be verified contacting [email protected].
About the author:
Peter Senna Tschudin is free software enthusiast since 1998. Worked in development of desktop Linux distributions like Linux Educacional 2 for the Educational Ministry of Brazil, and in development of embedded Linux for thin clients. Created 10 questions and helped in the preparation process of the certification exam LPIC-304 which deals with virtualization and high availability. Worked with Linux on IBM mainframes. Enjoys working with C and Bash. Has a dream of becoming Linux Kernel Developer. On Linuxcon Brazil talked about the LPIC-304, and about this study. On SkoleLinux UC Norway 2008 talked about the use of free software in Brazilian public schools.
Page 37 of 37