Performance of Evapotranspirative Covers Under …Lycium andersonii Desert Thorn 0.2 Grasses...
11
WM’07 Conference, February 26 - March 1, 2007, Tucson, AZ Performance of Evapotranspirative Covers Under Enhanced Precipitation: Preliminary Data L.T. Desotell, D.B. Hudson, D. Anderson, V. Yucel, G. Shott National Security Technologies, LLC P.O. Box 98521 Las Vegas, NV 89193-8521, USA G.L. Pyles, J.T. Carilli U.S. Department of Energy National Security Administration, Nevada Site Office P.O. Box 98518, Las Vegas, NV 89193-8518, USA ABSTRACT Since January 2001, drainage lysimeter studies have been conducted at Yucca Flat, on the Nevada Test Site, in support of an evapotranspirative cover design. Yucca Flat has an arid climate with average precipitation of 16.5 cm annually. The facility consists of six drainage lysimeters 3 m in diameter, 2.4 m deep, and backfilled with a single layer of native soil. The bottom of each lysimeter is sealed and equipped with a small drain that enables direct measurement of saturated drainage. Each lysimeter has eight time-domain reflectometer probes to measure moisture content-depth profiles paired with eight heat-dissipation probes to measure soil-water potential depth profiles. Sensors are connected to dataloggers which are remotely accessed via a phone line. The six lysimeters have three different surface treatments: two are bare-soil; two were revegetated with native species (primarily shadscale, winterfat, ephedra, and Indian rice grass); and two were allowed to revegetate naturally with such species as Russian thistle, halogeton, tumblemustard and cheatgrass. Beginning in October 2003, one half of the paired cover treatments (one bare soil, one invader species, and one native species) were irrigated with an amount of water equal to two times the natural precipitation to achieve a three times natural precipitation treatment. From October 2003 through December 2005, all lysimeters received 52.8 cm precipitation, and the four irrigated lysimeters received an extra 105.6 cm of irrigation. No drainage has occurred from any of the nonirrigated lysimeters, but moisture has accumulated at the bottom of the bare-soil lysimeter and the native-plant lysimeter. All irrigated lysimeters had some drainage. The irrigated bare- soil lysimeter had 48.3 cm of drainage or 26.4 percent of the combined precipitation and applied irrigation for the entire monitoring record. The irrigated invader species lysimeter had 5.8 cm of drainage, about 3.2 percent of the combined precipitation and applied irrigation. An irrigation valve failure caused an additional 50.8 cm of irrigation to be applied to the irrigated native plant lysimeter. There has been 29.3 cm of drainage from this lysimeter, which is 11.5 percent of the total applied water. Approximately 40 percent of the drainage from the irrigated native plant lysimeter occurred within four weeks of the valve failure.
Transcript of Performance of Evapotranspirative Covers Under …Lycium andersonii Desert Thorn 0.2 Grasses...
WM’07 Conference, February 26 - March 1, 2007, Tucson, AZ
Performance of Evapotranspirative Covers Under Enhanced Precipitation: Preliminary Data
L.T. Desotell, D.B. Hudson, D. Anderson, V. Yucel, G. Shott
National Security Technologies, LLC P.O. Box 98521 Las Vegas, NV 89193-8521, USA
G.L. Pyles, J.T. Carilli
U.S. Department of Energy National Security Administration, Nevada Site Office
P.O. Box 98518, Las Vegas, NV 89193-8518, USA
ABSTRACT Since January 2001, drainage lysimeter studies have been conducted at Yucca Flat, on the Nevada Test Site, in support of an evapotranspirative cover design. Yucca Flat has an arid climate with average precipitation of 16.5 cm annually. The facility consists of six drainage lysimeters 3 m in diameter, 2.4 m deep, and backfilled with a single layer of native soil. The bottom of each lysimeter is sealed and equipped with a small drain that enables direct measurement of saturated drainage. Each lysimeter has eight time-domain reflectometer probes to measure moisture content-depth profiles paired with eight heat-dissipation probes to measure soil-water potential depth profiles. Sensors are connected to dataloggers which are remotely accessed via a phone line. The six lysimeters have three different surface treatments: two are bare-soil; two were revegetated with native species (primarily shadscale, winterfat, ephedra, and Indian rice grass); and two were allowed to revegetate naturally with such species as Russian thistle, halogeton, tumblemustard and cheatgrass. Beginning in October 2003, one half of the paired cover treatments (one bare soil, one invader species, and one native species) were irrigated with an amount of water equal to two times the natural precipitation to achieve a three times natural precipitation treatment. From October 2003 through December 2005, all lysimeters received 52.8 cm precipitation, and the four irrigated lysimeters received an extra 105.6 cm of irrigation. No drainage has occurred from any of the nonirrigated lysimeters, but moisture has accumulated at the bottom of the bare-soil lysimeter and the native-plant lysimeter. All irrigated lysimeters had some drainage. The irrigated bare-soil lysimeter had 48.3 cm of drainage or 26.4 percent of the combined precipitation and applied irrigation for the entire monitoring record. The irrigated invader species lysimeter had 5.8 cm of drainage, about 3.2 percent of the combined precipitation and applied irrigation. An irrigation valve failure caused an additional 50.8 cm of irrigation to be applied to the irrigated native plant lysimeter. There has been 29.3 cm of drainage from this lysimeter, which is 11.5 percent of the total applied water. Approximately 40 percent of the drainage from the irrigated native plant lysimeter occurred within four weeks of the valve failure.
WM’07 Conference, February 26 - March 1, 2007, Tucson, AZ
INTRODUCTION
The Area 3 Radioactive Waste Management Site (RWMS) is located within Yucca Flat approximately 120 kilometers (km) northwest of Las Vegas, Nevada, within the Nevada Test Site (NTS). The RWMS was established primarily for disposal of bulk low-level radioactive waste from on-site and off-site generators in 1968. Waste is disposed of within subsidence craters. A subsidence crater is a shallow depression created by the detonation of a nuclear weapon hundreds of meters below land surface [1]. The subsidence craters within the Area 3 RWMS ranged from 122 to 179 m in diameter and from 14 to 32 m in depth at the time of formation [2]. Several closure-design options for low-level waste landfills at the NTS have been evaluated [1, 3, 4, 5]. Physical and chemical characterization, as well as modeling studies of the unsaturated zone at the Area 3 RWMS, indicates the natural vegetated system under the current climatic conditions effectively eliminates groundwater recharge [1, 6]. These findings along with construction costs and performance concerns of conventional Resource Conservation and Recovery Act (RCRA) multilayer prescriptive covers under subsided waste conditions [5] provided the impetus to evaluate the use of a single layer of native soil with native vegetation as a final closure cover. The mechanics of evapotranspiration (ET) covers are fundamentally different than those of traditional RCRA covers. ET covers use the soil column as a storage reservoir to allow precipitation to infiltrate and subsequently return to the atmosphere by plant transpiration. RCRA covers, however, attempt to reduce infiltration and drainage by increasing runoff through the use of low permeability layers. The use and acceptance of ET covers in arid and semiarid regions has grown in recent years as research indicates their performance can equal or exceed that of traditional RCRA prescriptive covers [7, 8, 9, 10 11]. In 2000, U-3 ax/bl, two subsidence craters modified into a mixed waste disposal unit within the Area 3 RWMS, was closed with a monolayer ET cover design with state regulatory approval [11]. In conjunction with the U-3 ax/bl landfill closure, a drainage lysimeter facility was constructed adjacent to the closed landfill to further evaluate and test the deployed monolayer ET cover design. This paper presents preliminary data from these drainage lysimeter studies.
LYSIMETER DESCRIPTION
The Area 3 lysimeter facility consists of six drainage lysimeters, an instrument vault, tipping- bucket rain gauge and irrigation system. Each lysimeter is constructed from a corrugated metal pipe 3 m in diameter and 2.4 m long. The pipe is backfilled with native alluvium at a bulk density of approximately 1.6 g/cm3. The alluvium is classified as a well- to poorly graded sand with silt and gravel under the Unified Soil Classification System with approximately 70 percent sand, 20 percent gravel, and 10 percent fines. The bottom of each lysimeter is epoxy-sealed concrete sloped to a small drain at the center that leads to the instrument vault and a tipping bucket to quantify saturated drainage. The six lysimeters have three different surface treatments: two are bare-soil; two are vegetated with native species, and two are allowed to revegetate naturally with annual invader plant species.

WM’07 Conference, February 26 - March 1, 2007, Tucson, AZ
Invader plant species (forbs) consist primarily of Russian thistle, halogeton, and mustardtumble. Annual grasses are primarily cheatgrass and Mediterranean grass. The lysimeters with native species were seeded according to Table I. The percentage of each species used in the seed mix is based on the relative contribution of a particular species to the total perennial plant cover typical of adjacent native plant communities, the size of the seed, rooting characteristics (e.g. preferentially using shallow rooted species), and revegetation experience at the NTS [12,13]. Seeded areas were covered with straw mulch and irrigated periodically during the first growing season to promote seed germination and plant growth. The native vegetation lysimeters have been re-seeded several times due to drought and low plant densities. The target vegetative cover is the approximate plant cover on the adjacent U3ax/bl closure cover, which was approximately 20 percent in 2005 [14], which included both perennial and annual plant species. Table I. Lysimeter Seeding Mixture
Scientific Name
Common Name
Seeding Rate Pure Live Seed (kg/ha)
Shrubs Artemisia spinescens Budsage 0.1 Atriplex confertifolia Shadscale 4.9 Ephedra nevadensis Nevada Ephedra 3.4 Ericameria nauseosa Rubber Rabbitbrush 1.7
Eriognum fasciculatum Buckwheat 0.3 Grayia spinosa Spiny Hopsage 0.6
Hymenoclea salsola Burrobush 2.5 Krascheninnikovia lanata Winterfat 5.5
Lycium andersonii Desert Thorn 0.2 Grasses
Achnatherum hymenoides Indian Ricegrass 3.8 Elymus elymoides Squirreltail 1.1
Forbs Sphaeralcea ambigua Globemallow 0.8
Totals 24.9
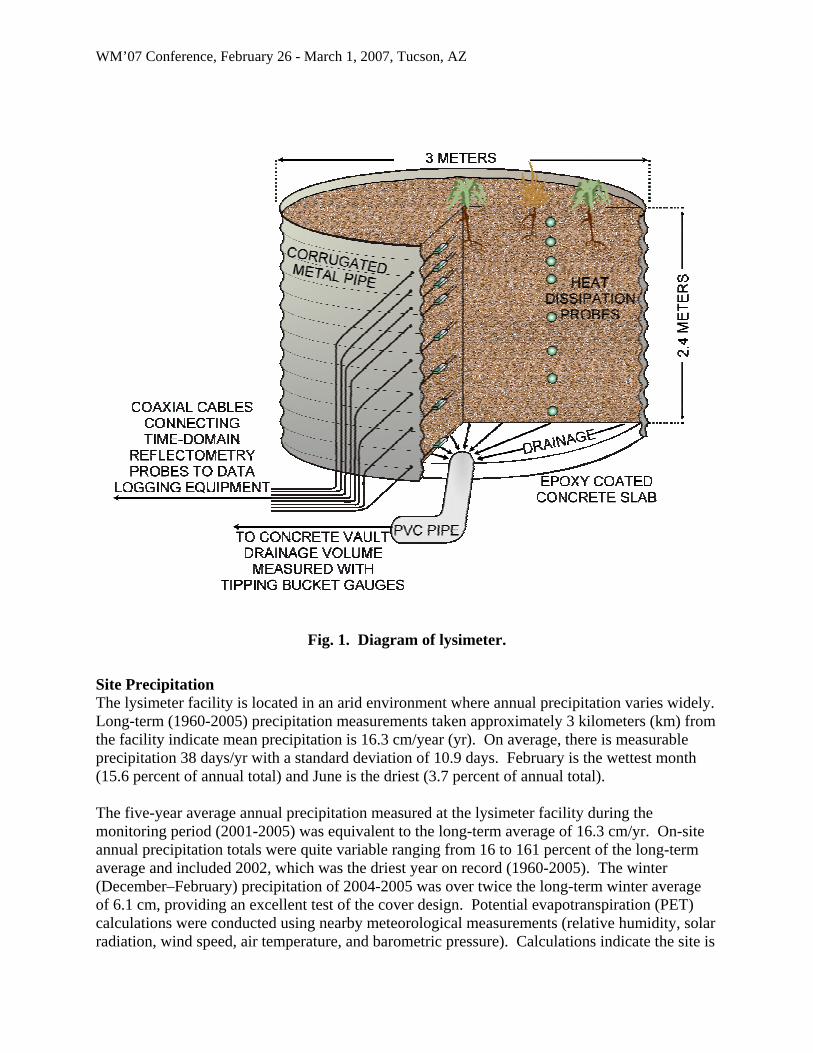
Each lysimeter soil profile is instrumented at depths of 8, 15, 30, 61, 91, 122, 183, and 244 cm with time-domain reflectometer (TDR) probes for volumetric water content measurements and heat dissipation probes for matric potential and soil temperature measurements. Sensor readings are taken daily. Sensor cables are routed laterally out of the lysimeters to dataloggers located within the instrument vault. Dataloggers are linked via telephone line for remote data acquisition. Figure 1 shows a diagram of an instrumented lysimeter.
WM’07 Conference, February 26 - March 1, 2007, Tucson, AZ
Fig. 1. Diagram of lysimeter. Site Precipitation The lysimeter facility is located in an arid environment where annual precipitation varies widely. Long-term (1960-2005) precipitation measurements taken approximately 3 kilometers (km) from the facility indicate mean precipitation is 16.3 cm/year (yr). On average, there is measurable precipitation 38 days/yr with a standard deviation of 10.9 days. February is the wettest month (15.6 percent of annual total) and June is the driest (3.7 percent of annual total). The five-year average annual precipitation measured at the lysimeter facility during the monitoring period (2001-2005) was equivalent to the long-term average of 16.3 cm/yr. On-site annual precipitation totals were quite variable ranging from 16 to 161 percent of the long-term average and included 2002, which was the driest year on record (1960-2005). The winter (December–February) precipitation of 2004-2005 was over twice the long-term winter average of 6.1 cm, providing an excellent test of the cover design. Potential evapotranspiration (PET) calculations were conducted using nearby meteorological measurements (relative humidity, solar radiation, wind speed, air temperature, and barometric pressure). Calculations indicate the site is

WM’07 Conference, February 26 - March 1, 2007, Tucson, AZ
within a highly evaporative environment with PET typically exceeding precipitation by a factor of 9.6 annually; although, the months of December, January, and February have PET to precipitation ratios less than 3. Natural Precipitation Treatment Figure 2a presents a time series plot of total soil water storage from January 2001 through September 2003 for the six lysimeters subjected to natural precipitation. Soil water storage is calculated from volumetric water content measurements. Data indicate 2001 was an average precipitation year. 2002 was the driest year on record (1960-2005) with only 2.6 cm of precipitation measured, while in from January to September in 2003, it was slightly drier than normal, recording 88 percent of the long-term average. As seen in Figure 2a, the bare cover lysimeters (A and B) exhibit a slow drying trend with storage stabilizing at approximately 35 cm. Invader species lysimeters (C and D) and native species lysimeters (E and F) show steep reductions in storage as vegetation becomes established and removes residual soil water present from lysimeter construction. Lysimeters E and F show increases in storage early in the data record due to irrigation to facilitate seed germination. Figure 2a clearly shows the vegetated lysimeters are much drier than the bare cover lysimeters with lysimeter A (bare cover) holding an average of 1.6 times the amount of water than lysimeter E (native vegetation) from January 2002 to September 30, 2003. Additionally, it is evident that the paired lysimeters are performing nearly identically as gauged by their water balances. Relative percentage differences in total soil water storage for the paired bare, invader and native vegetation lysimeters are 2.7, 8.2, and 5.4, respectively. Figure 2b shows the volumetric water content profile with time for lysimeter A (bare). Eight and 15 cm depth data are not presented for figure clarity. This figure shows a slight drying trend with wetting fronts reaching less than 91 cm. Figure 2c shows volumetric water content profile with time for lysimeter E (native vegetation). This figure shows a strong drying trend as vegetation is established in the spring of 2001. The water content profile is nearly uniform throughout 2002. Supplemental irrigation was added to lysimeters E and F in the summer of 2003 to aid plant growth resulting in deeper wetting fronts than those observed in the bare lysimeters. Enhanced Precipitation Treatment Beginning October 1, 2003, half of the paired lysimeters (one bare-soil cover, one native-plant and one invader-plant species) were irrigated to achieve a 3 times natural precipitation condition, to evaluate the performance of the cover treatments under wetter conditions. Water is applied to the lysimeters using a drip irrigation system. A 3000-gallon tank, located on-site, supplies water to the system. A datalogger linked via telephone line controls solenoid valves and an electric pump to enable remote application of irrigation. Irrigation is applied at a rate of 3.1 cm/hr.

WM’07 Conference, February 26 - March 1, 2007, Tucson, AZ
Fig . 2a. Soil water storage in lysimeters.
Jan-01 Jul-01 Jan-02 Jul-02 Jan-03 Jul-03 Jan-04
Dai
ly P
reci
pita
tion/
Irrig
atio
n (c
m)
0
2
4
6
8
10
Soi
l Wat
er S
tora
ge (c
m)
10
20
30
40
50
Fig. 2c. Volumetric water content in native vegetated lysimeter (E).
Jan-01 Jul-01 Jan-02 Jul-02 Jan-03 Jul-03 Jan-04
Volu
met
ric w
ater
con
tent
(%)
0
5
10
15
20
25
30D
aily
Pre
cipi
tatio
n/Irr
igat
ion
(cm
)
0
2
4
6
8
1030 cm 61 cm 91 cm 122 cm
183 cm 244 cm PrecipitationIrrigation
Fig. 2b. Volumetric water content in bare lysimeter (A).
Jan-01 Jul-01 Jan-02 Jul-02 Jan-03 Jul-03 Jan-04
Vol
umet
ric W
ater
Con
tent
(%)
0
5
10
15
20
25
30
Dai
ly P
reci
pita
tion
(cm
)
0
2
4
6
8
1030 cm 61 cm 91 cm 122 cm
183 cm 244 cm Precipitation
PrecipitationLys A (bare)Lys B (bare)
Lys C (invader)Lys D (invader)
Lys E (native)Lys F (native) Irrigation (Lys E, F)
WM’07 Conference, February 26 - March 1, 2007, Tucson, AZ
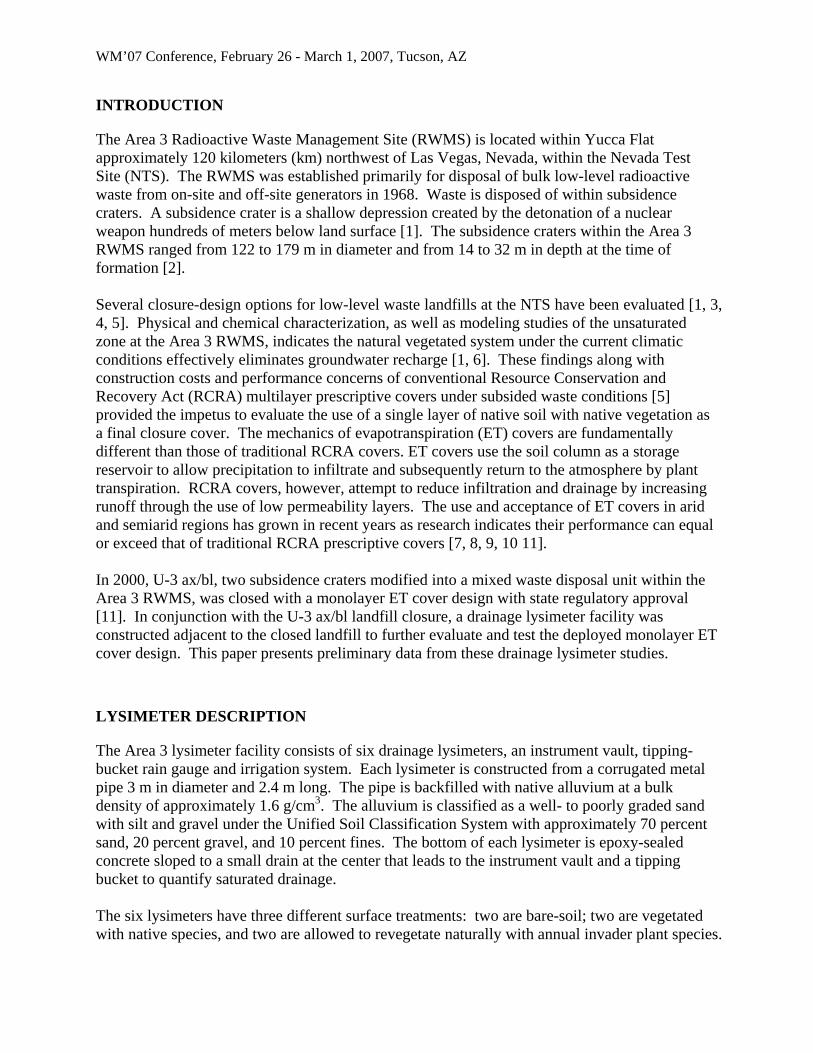
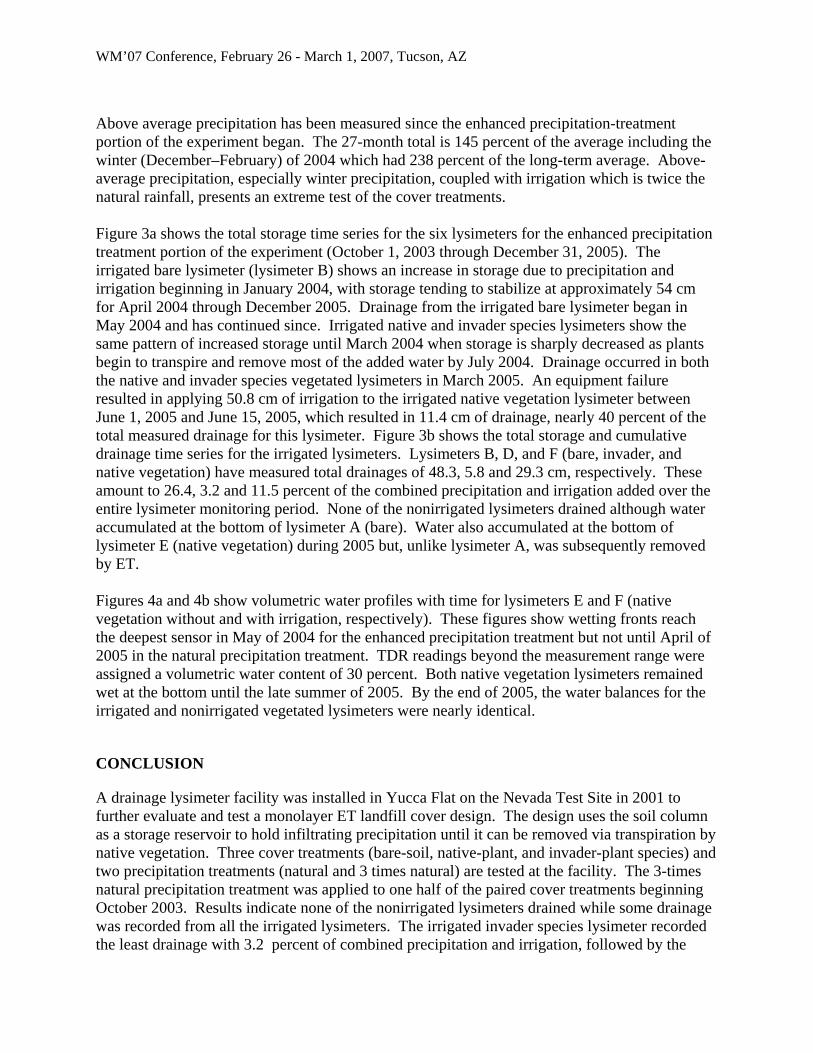
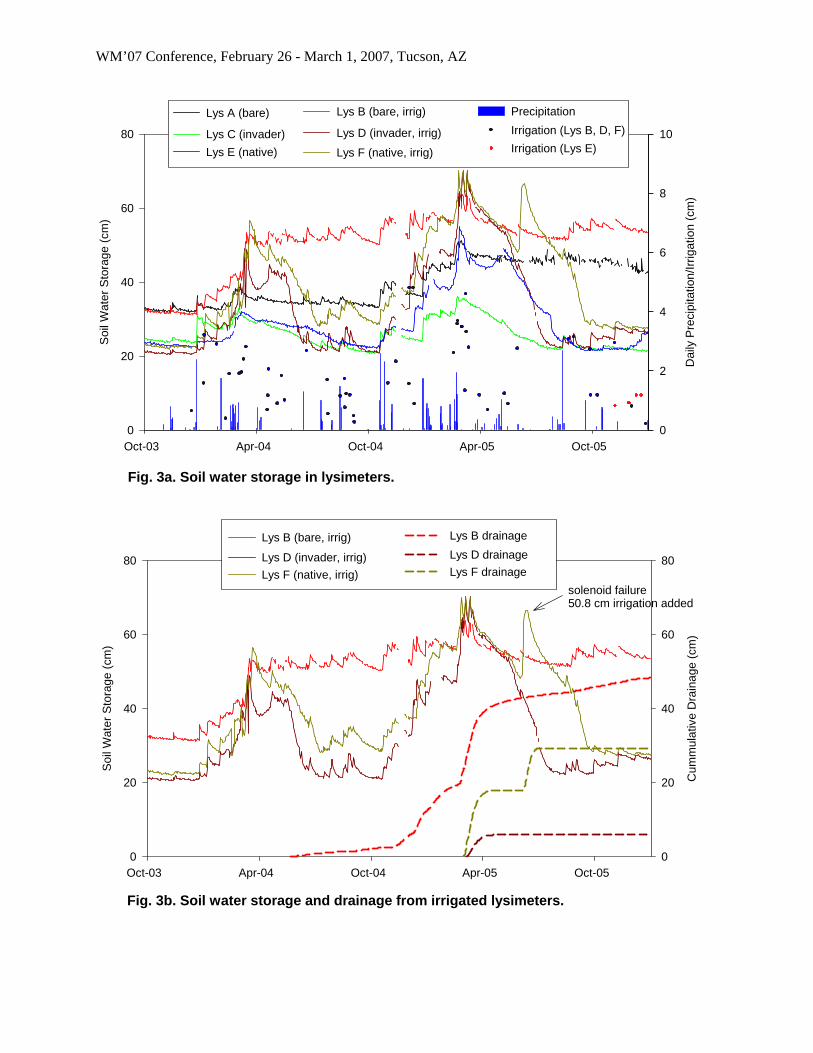
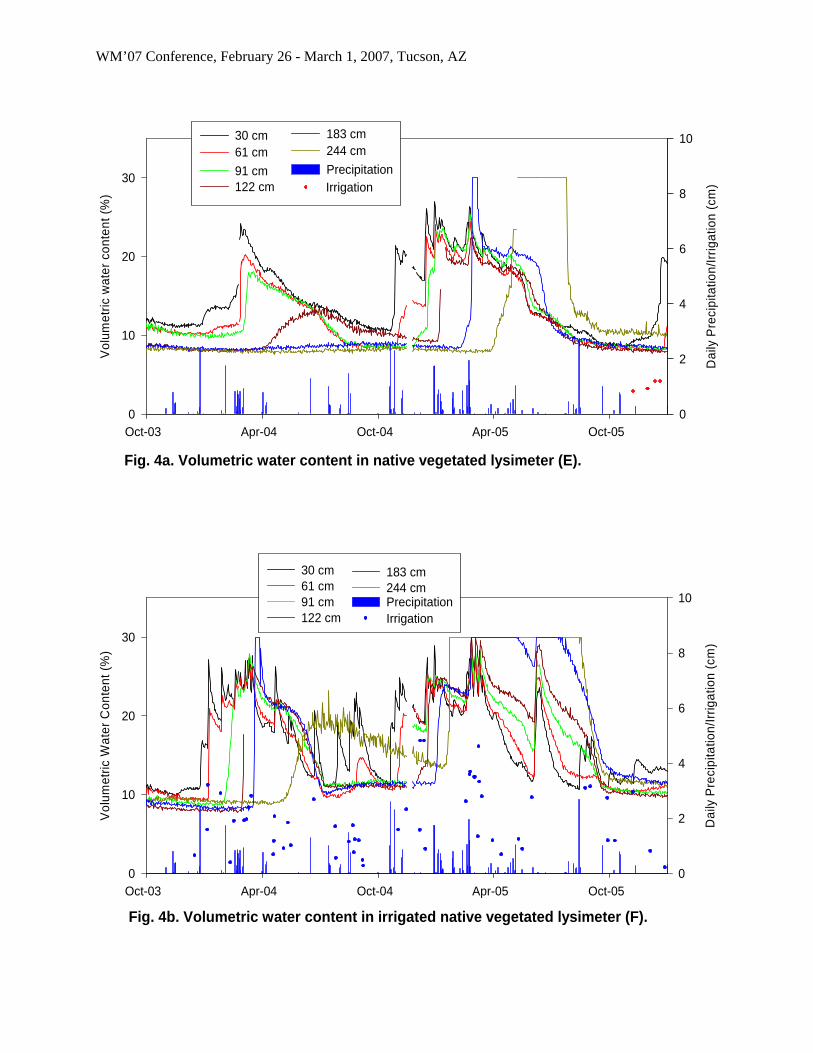
Above average precipitation has been measured since the enhanced precipitation-treatment portion of the experiment began. The 27-month total is 145 percent of the average including the winter (December–February) of 2004 which had 238 percent of the long-term average. Above- average precipitation, especially winter precipitation, coupled with irrigation which is twice the natural rainfall, presents an extreme test of the cover treatments. Figure 3a shows the total storage time series for the six lysimeters for the enhanced precipitation treatment portion of the experiment (October 1, 2003 through December 31, 2005). The irrigated bare lysimeter (lysimeter B) shows an increase in storage due to precipitation and irrigation beginning in January 2004, with storage tending to stabilize at approximately 54 cm for April 2004 through December 2005. Drainage from the irrigated bare lysimeter began in May 2004 and has continued since. Irrigated native and invader species lysimeters show the same pattern of increased storage until March 2004 when storage is sharply decreased as plants begin to transpire and remove most of the added water by July 2004. Drainage occurred in both the native and invader species vegetated lysimeters in March 2005. An equipment failure resulted in applying 50.8 cm of irrigation to the irrigated native vegetation lysimeter between June 1, 2005 and June 15, 2005, which resulted in 11.4 cm of drainage, nearly 40 percent of the total measured drainage for this lysimeter. Figure 3b shows the total storage and cumulative drainage time series for the irrigated lysimeters. Lysimeters B, D, and F (bare, invader, and native vegetation) have measured total drainages of 48.3, 5.8 and 29.3 cm, respectively. These amount to 26.4, 3.2 and 11.5 percent of the combined precipitation and irrigation added over the entire lysimeter monitoring period. None of the nonirrigated lysimeters drained although water accumulated at the bottom of lysimeter A (bare). Water also accumulated at the bottom of lysimeter E (native vegetation) during 2005 but, unlike lysimeter A, was subsequently removed by ET. Figures 4a and 4b show volumetric water profiles with time for lysimeters E and F (native vegetation without and with irrigation, respectively). These figures show wetting fronts reach the deepest sensor in May of 2004 for the enhanced precipitation treatment but not until April of 2005 in the natural precipitation treatment. TDR readings beyond the measurement range were assigned a volumetric water content of 30 percent. Both native vegetation lysimeters remained wet at the bottom until the late summer of 2005. By the end of 2005, the water balances for the irrigated and nonirrigated vegetated lysimeters were nearly identical.
CONCLUSION
A drainage lysimeter facility was installed in Yucca Flat on the Nevada Test Site in 2001 to further evaluate and test a monolayer ET landfill cover design. The design uses the soil column as a storage reservoir to hold infiltrating precipitation until it can be removed via transpiration by native vegetation. Three cover treatments (bare-soil, native-plant, and invader-plant species) and two precipitation treatments (natural and 3 times natural) are tested at the facility. The 3-times natural precipitation treatment was applied to one half of the paired cover treatments beginning October 2003. Results indicate none of the nonirrigated lysimeters drained while some drainage was recorded from all the irrigated lysimeters. The irrigated invader species lysimeter recorded the least drainage with 3.2 percent of combined precipitation and irrigation, followed by the

WM’07 Conference, February 26 - March 1, 2007, Tucson, AZ
irrigated native lysimeter with 11.5 percent, although nearly 40 percent of the drainage total can be attributed to an irrigation equipment failure. The irrigated bare-soil lysimeter recorded the highest total with 26.4 percent of the combined precipitation and irrigation added over the entire lysimeter monitoring period. These studies confirm that vegetation plays a dominant role in the arid climate near surface water balance and its establishment is critical to the success of an ET final cover.
WM’07 Conference, February 26 - March 1, 2007, Tucson, AZ
Fig. 3a. Soil water storage in lysimeters.
Oct-03 Apr-04 Oct-04 Apr-05 Oct-05
Dai
ly P
reci
pita
tion/
Irrig
atio
n (c
m)
0
2
4
6
8
10
Soi
l Wat
er S
tora
ge (c
m)
0
20
40
60
80
Fig. 3b. Soil water storage and drainage from irrigated lysimeters.
Oct-03 Apr-04 Oct-04 Apr-05 Oct-05
Soi
l Wat
er S
tora
ge (c
m)
0
20
40
60
80
Cum
mul
ativ
e D
rain
age
(cm
)
0
20
40
60
80
PrecipitationLys A (bare) Lys B (bare, irrig)
Lys C (invader) Lys D (invader, irrig)Lys E (native) Lys F (native, irrig)
Irrigation (Lys B, D, F)Irrigation (Lys E)
Lys B (bare, irrig)
Lys D (invader, irrig)Lys F (native, irrig)
Lys B drainageLys D drainage Lys F drainage
solenoid failure50.8 cm irrigation added
WM’07 Conference, February 26 - March 1, 2007, Tucson, AZ
Fig. 4a. Volumetric water content in native vegetated lysimeter (E).
Oct-03 Apr-04 Oct-04 Apr-05 Oct-05
Vol
umet
ric w
ater
con
tent
(%)
0
10
20
30
Dai
ly P
reci
pita
tion/
Irrig
atio
n (c
m)
0
2
4
6
8
10
Fig. 4b. Volumetric water content in irrigated native vegetated lysimeter (F).Oct-03 Apr-04 Oct-04 Apr-05 Oct-05
Vol
umet
ric W
ater
Con
tent
(%)
0
10
20
30
Dai
ly P
reci
pita
tion/
Irrig
atio
n (c
m)
0
2
4
6
8
10
30 cm 61 cm 91 cm 122 cm
183 cm 244 cm PrecipitationIrrigation
30 cm 61 cm 91 cm 122 cm
244 cm 183 cm
IrrigationPrecipitation
WM’07 Conference, February 26 - March 1, 2007, Tucson, AZ
REFERENCES 1. Shott, G. J., V. Yucel, M. J. Sully, L. E. Barker, S. E. Rawlinson, and B.A. Moore, 2000.
Performance Assessment for the Area 3 Radioactive Waste Management Site at the Nevada Test Site, Nye County, Nevada (Rev. 2.1) DOE/NV--176, REV 2.1. Bechtel Nevada, Las Vegas, Nevada.
2. Planner, U. N., 1996. Siting Criteria for Angle Drilling Under the U-3ah/at Disposal Unit LA-UR-96-1679. Los Alamos National Laboratory, Los Alamos, New Mexico.
3. Crowe, B., S. Krenzien, D. Hale, L. T. Desotell, S. E. Rawlinson, V. Yucel, M. J. Sully, and M. Giblin, 2005. “Justification for an Alternative Landfill Cover Design for the Mixed Waste Disposal Unit at the Area 5 Radioactive Waste Management Site, Nevada Test Site.” Proceedings of the Waste Management ’05 Conference, Tucson Arizona.
4. Levitt, D. G., M. J. Sully, B. D. Dozier, and C. F. Lohrstorfer, 1999. “Determining the Performance of an Arid Zone Radioactive Waste Site through Site Characterization, Modeling, and Monitoring.” Proceedings of the Waste Management ’99 Conference, Tucson, Arizona.
5. DOE, 1998. Consequences of Subsidence for the Area 3 and Area 5 Radioactive Waste Management Sites, Nevada Test Site. DOE/NV--502, UC-600. Nevada Operations Office, Las Vegas, Nevada.
6. Desotell, L. T., D. B. Hudson, V. Yucel, and J. T. Carilli, 2006. “Use of Long-Term Lysimeter Data in Support of Shallow Land Waste Disposal Cover Design,” DOE/NV-11718-1148. Proceedings of the Waste Management ’06 Conference, Tucson, Arizona.
7. Scanlon, B., R. Reedy, K. Keese, and S. Dwyer 2005. “Evaluation of Evapotranspiration Cover for Waste Containment in Arid and Semiarid Regions in the Southwestern USA.” Vadose Zone Journal 4:55-71.
8. Interstate Technology Regulatory Council (ITRC), 2003. ”Technical and Regulatory Guidance for Design, installation, and Monitoring of Alternative Final Landfill Covers.” Reported by the Alternative Landfill Technologies Team, Interstate Technology & Regulatory Council. December 2003. 198 p.
9. Environmental Protection Agency, 2003. Evapotranspiration Landfill Cover Systems Fact Sheet. EPA 542-F-03-015. September 2003.
10. Dwyer, S. F. 2001. “Finding a Better Cover,” Civil Engineering, V 71, pp 48-63. 11. Smith, J. L. and T. M. Fitzmaurice. 2001. “Regulatory Acceptance of Monolayer Vegetative
Cover for the Mixed Waste Disposal Unit U-3ax/bl at the Nevada Test Site”. [Abstract #131]. 2001 International Containment & Remediation Technology Conference and Exhibition.
12. Anderson, D. C., and W. K. Ostler, 2002. “Revegetation of Degraded Lands at U. S. Department of Energy and U. S. Department of Defense Installations: Strategies and Successes.” Arid Land Research and Management. 16(3): 197-212.
13. Ostler, W. K., D. C. Anderson, D. B. Hall, and D. J. Hansen, 2002. New Technologies to Reclaim Arid Lands User’s Manual. DOE/NV 11718-731. Bechtel Nevada Ecological Services, Las Vegas, Nevada.
14. Bechtel Nevada Ecological Services, 2006. Ecological Monitoring and Compliance Program Calendar year 2005 Report. DOE/NV-11718-1196. Bechtel Nevada, Las Vegas, Nevada.