Performance Highlights Q2 FY15
37
Performance Highlights Q2 FY15 Poised For Growth
-
Upload
dale-benson -
Category
Documents
-
view
44 -
download
2
description
Performance Highlights Q2 FY15. Poised For Growth. Performance Highlights – Sept’14. NET PROFIT. 26%. GLOBAL ADVANCES. GLOBAL DEPOSITS. 19%. 20%. NET INTEREST INCOME. CURRENT ACCOUNT /SAVING ACCOUNT. SHARE OF RETAIL & SME OVERALL LOAN BOOK. 20%. 12%. 2.3%. - PowerPoint PPT Presentation
Transcript of Performance Highlights Q2 FY15
Performance HighlightsQ2 FY15
Poised For Growth
12%
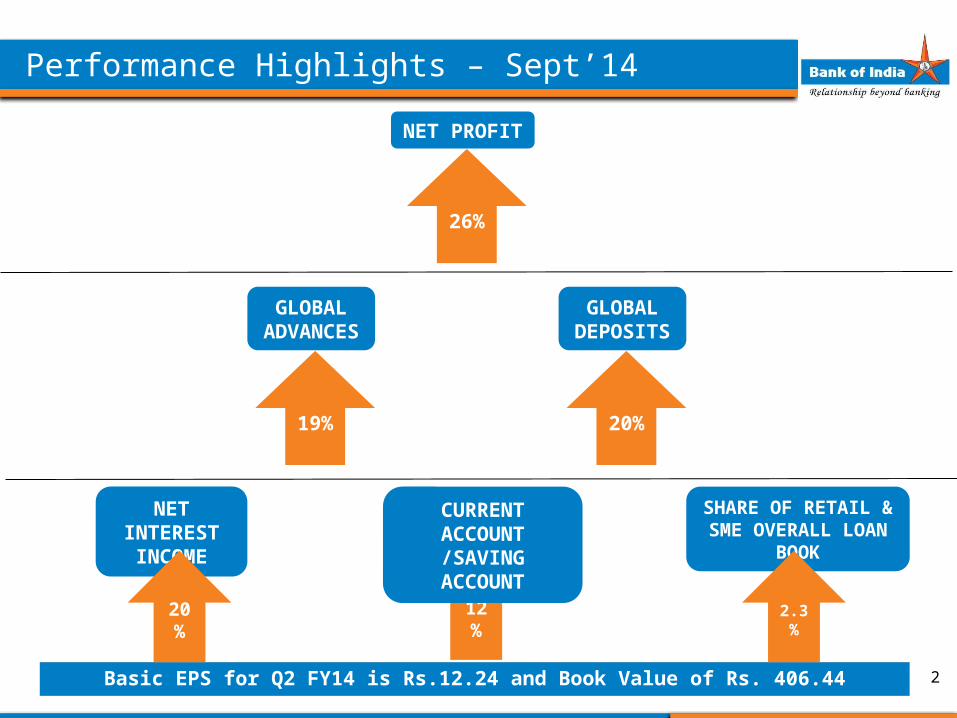
Performance Highlights – Sept’14
NET PROFIT
GLOBALADVANCES
NET INTEREST INCOME
CURRENT ACCOUNT /SAVING
ACCOUNT
GLOBAL DEPOSITS
SHARE OF RETAIL & SME OVERALL LOAN BOOK
Basic EPS for Q2 FY14 is Rs.12.24 and Book Value of Rs. 406.44 2
20% 2.3%
26%
19% 20%
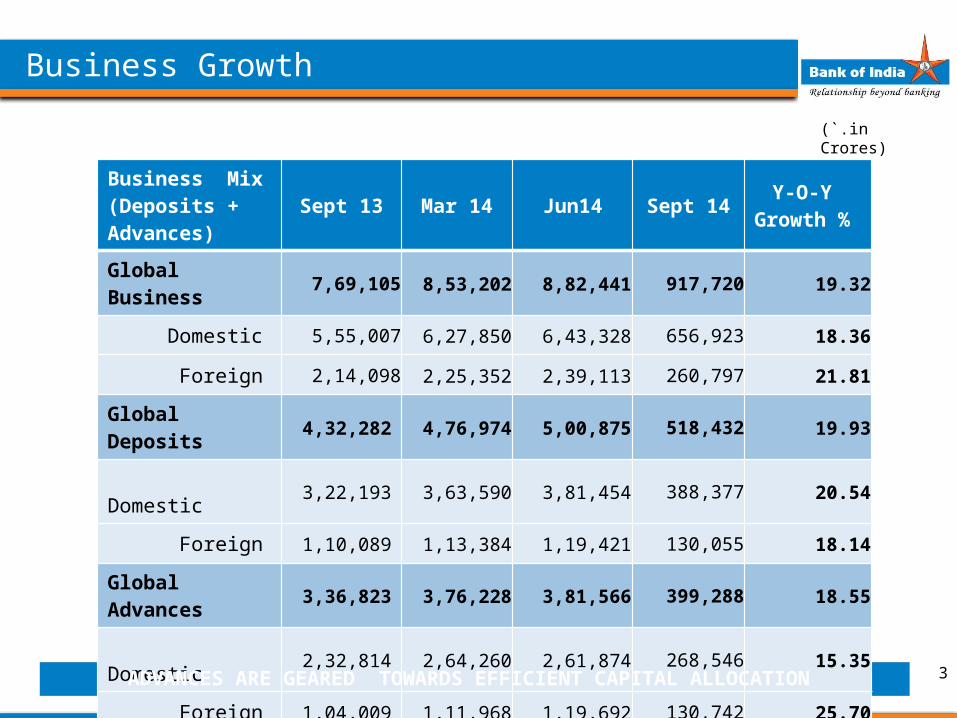
Business Mix(Deposits + Advances)
Sept 13 Mar 14 Jun14 Sept 14 Y-O-Y Growth %
Global Business 7,69,105 8,53,202 8,82,441 917,720 19.32
Domestic 5,55,007 6,27,850 6,43,328 656,923 18.36
Foreign 2,14,098 2,25,352 2,39,113 260,797 21.81
Global Deposits 4,32,282 4,76,974 5,00,875 518,432 19.93
Domestic 3,22,193 3,63,590 3,81,454 388,377 20.54
Foreign 1,10,089 1,13,384 1,19,421 130,055 18.14
Global Advances 3,36,823 3,76,228 3,81,566 399,288 18.55
Domestic 2,32,814 2,64,260 2,61,874 268,546 15.35
Foreign 1,04,009 1,11,968 1,19,692 130,742 25.70
Business Growth
(`.in Crores)
3ADVANCES ARE GEARED TOWARDS EFFICIENT CAPITAL ALLOCATION
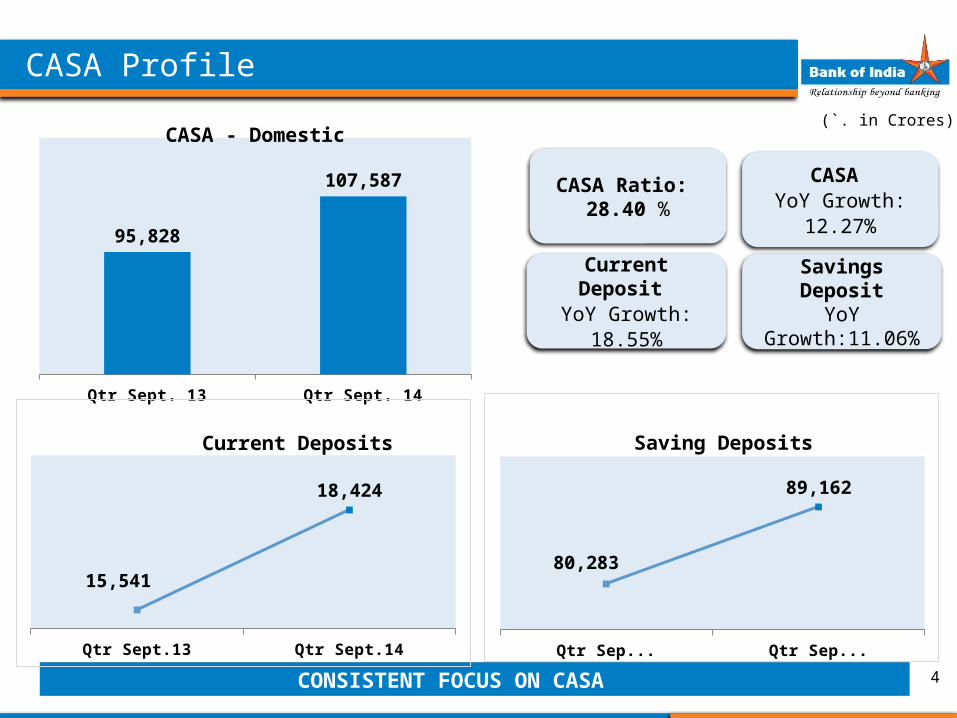
Qtr Sept. 13 Qtr Sept. 14
95,828
107,587
CASA - Domestic
Savings DepositYoY Growth:11.06%
Current Deposit YoY Growth: 18.55%
CASA YoY Growth: 12.27%
CASA Profile
4
Qtr Sept.13 Qtr Sept.14
80,283
89,162
Saving Deposits
(`. in Crores)
CASA Ratio: 28.40 %
Qtr Sept.13 Qtr Sept.14
15,541
18,424
Current Deposits
CONSISTENT FOCUS ON CASA
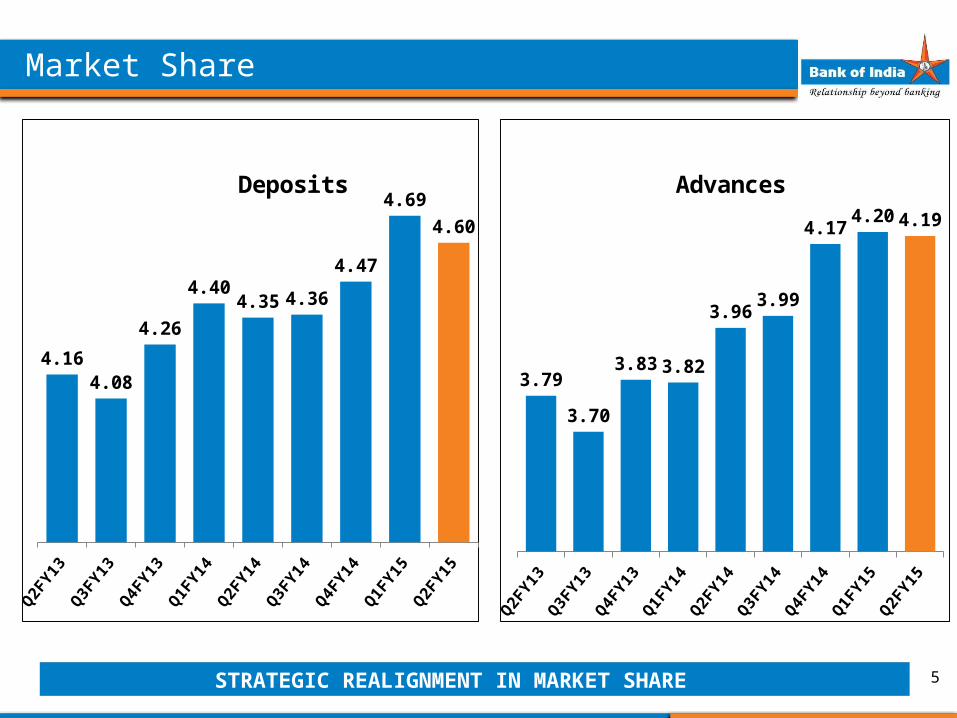
Market Share
5
Q2FY1
3Q3F
Y13
Q4FY1
3Q1F
Y14
Q2FY1
4Q3F
Y14
Q4FY1
4Q1F
Y15
Q2FY1
5
4.164.08
4.26
4.404.35 4.36
4.47
4.694.60
Deposits
Q2FY1
3Q3F
Y13
Q4FY1
3Q1F
Y14
Q2FY1
4Q3F
Y14
Q4FY1
4Q1F
Y15
Q2FY1
5
3.79
3.70
3.83 3.82
3.963.99
4.174.20 4.19
Advances
STRATEGIC REALIGNMENT IN MARKET SHARE
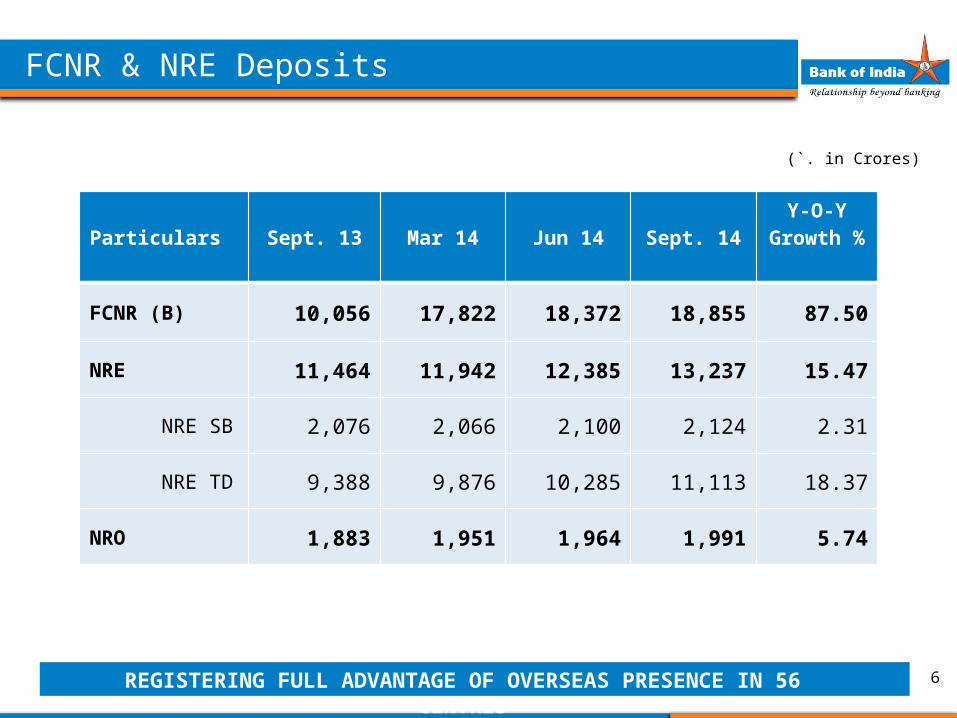
Particulars Sept. 13 Mar 14 Jun 14 Sept. 14 Y-O-Y
Growth %
FCNR (B) 10,056 17,822 18,372 18,855 87.50
NRE 11,464 11,942 12,385 13,237 15.47
NRE SB 2,076 2,066 2,100 2,124 2.31
NRE TD 9,388 9,876 10,285 11,113 18.37
NRO 1,883 1,951 1,964 1,991 5.74
(`. in Crores)
FCNR & NRE Deposits
6REGISTERING FULL ADVANTAGE OF OVERSEAS PRESENCE IN 56 CENTRES
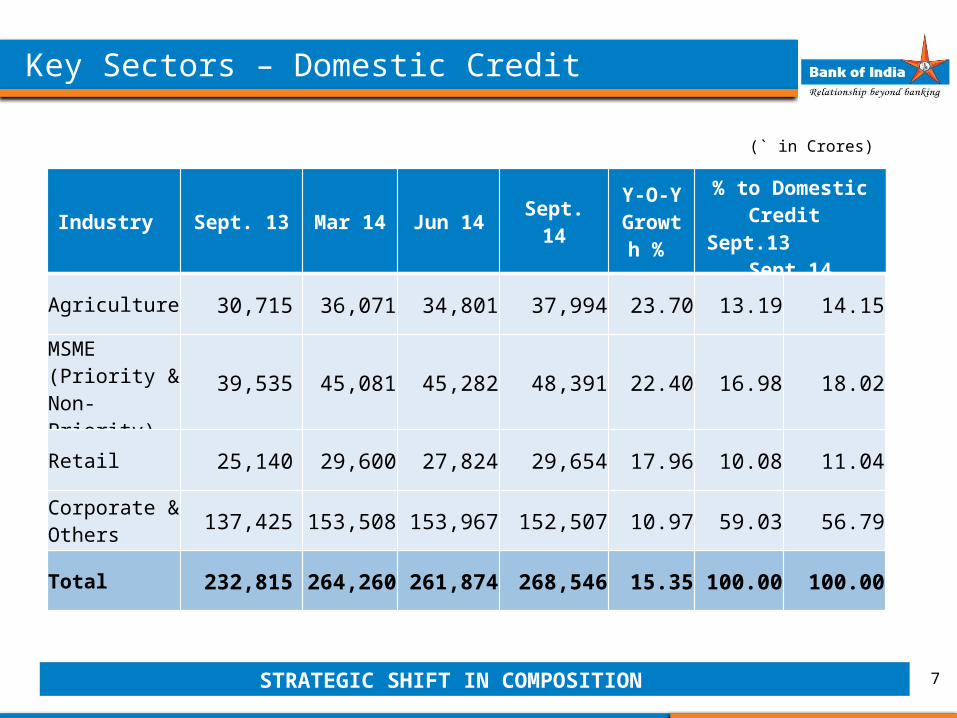
Key Sectors – Domestic Credit
Industry Sept. 13 Mar 14 Jun 14 Sept. 14Y-O-Y
Growth %
% to Domestic Credit
Sept.13 Sept.14
Agriculture 30,715 36,071 34,801 37,994 23.70 13.19 14.15
MSME (Priority & Non- Priority) 39,535 45,081 45,282 48,391 22.40 16.98 18.02
Retail 25,140 29,600 27,824 29,654 17.96 10.08 11.04
Corporate & Others 137,425 153,508 153,967 152,507 10.97 59.03 56.79
Total 232,815 264,260 261,874 268,546 15.35 100.00 100.00
(` in Crores)
7STRATEGIC SHIFT IN COMPOSITION
Particulars Sept. 13 Mar 14 Jun 14 Sept. 14Y-O-Y
Growth % %age to
Domestic Credit
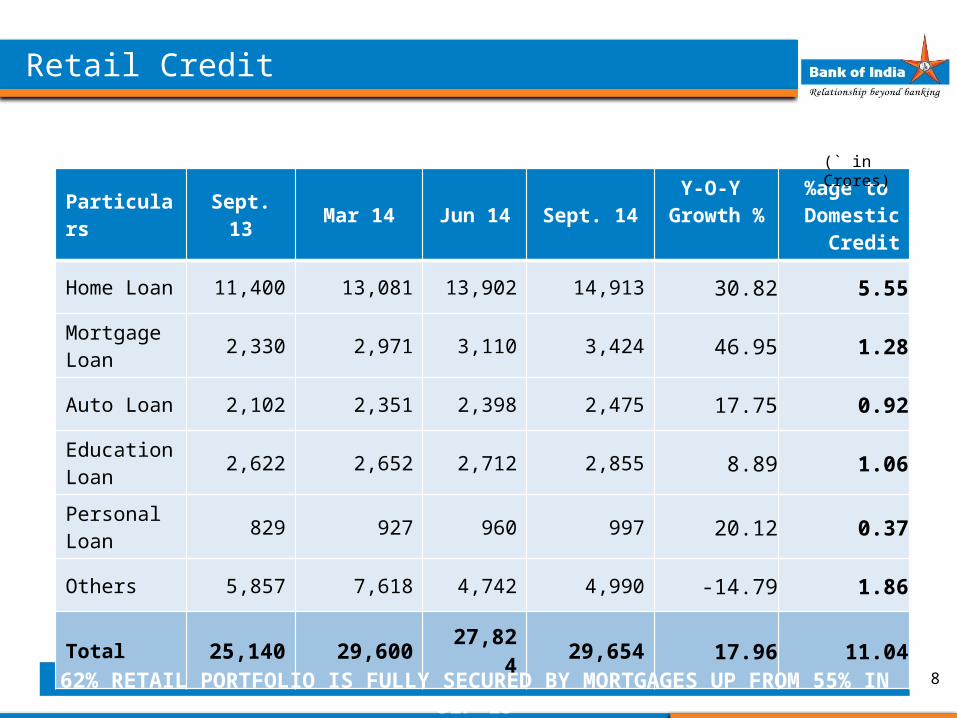
Home Loan 11,400 13,081 13,902 14,913 30.82 5.55
Mortgage Loan 2,330 2,971 3,110 3,424 46.95 1.28
Auto Loan 2,102 2,351 2,398 2,475 17.75 0.92
Education Loan 2,622 2,652 2,712 2,855 8.89 1.06
Personal Loan 829 927 960 997 20.12 0.37
Others 5,857 7,618 4,742 4,990 -14.79 1.86
Total 25,140 29,600 27,824 29,654 17.96 11.04
(` in Crores)
Retail Credit
862% RETAIL PORTFOLIO IS FULLY SECURED BY MORTGAGES UP FROM 55% IN SEP-13
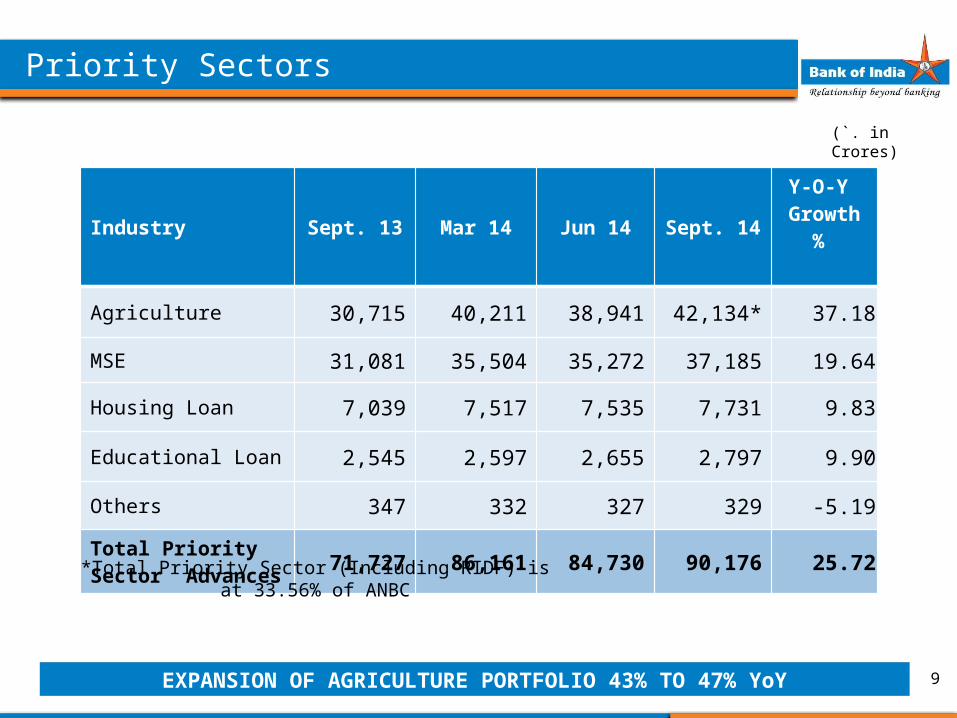
Industry Sept. 13 Mar 14 Jun 14 Sept. 14Y-O-Y
Growth %
Agriculture 30,715 40,211 38,941 42,134* 37.18
MSE 31,081 35,504 35,272 37,185 19.64
Housing Loan 7,039 7,517 7,535 7,731 9.83
Educational Loan 2,545 2,597 2,655 2,797 9.90
Others 347 332 327 329 -5.19
Total Priority Sector Advances 71,727 86,161 84,730 90,176 25.72
(`. in Crores)
Priority Sectors
9
*Total Priority Sector (Including RIDF) is at 33.56% of ANBC
EXPANSION OF AGRICULTURE PORTFOLIO 43% TO 47% YoY
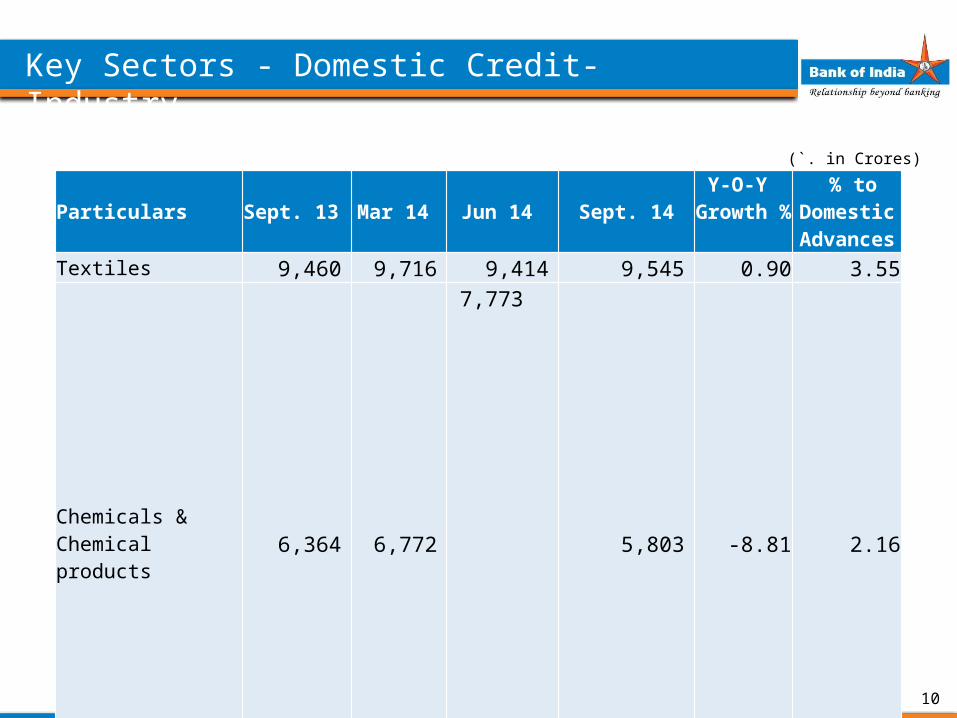
Particulars Sept. 13 Mar 14 Jun 14 Sept. 14Y-O-Y
Growth % % to
Domestic Advances
Textiles 9,460 9,716 9,414 9,545 0.90 3.55
Chemicals & Chemical products 6,364 6,772
7,773
5,803 -8.81 2.16
Rubber, Plastic & their products 2,609 2,726 2,620 2,604 -0.18 0.97
Basic metal & metal products 14,035 12,953 12,351 13,009 -7.31 4.84
Vehicles, vehicle parts & Transport equipment
2,057 2,021 2,156 2,083 1.27 0.78
Gems & Jewellery 5,099 5,665 5,886 6,532 28.11 2.43Construction 1,858 1,822 1,742 2,023 8.85 0.75Infrastructure 36,297 42,358 43,539 44,136 21.60 16.44Other Industries 24,213 29,001 29,682 28,775 18.84 10.72Total 101,992 113,034 115,163 114,511 12.27 42.64
(`. in Crores)
Key Sectors - Domestic Credit- Industry
10
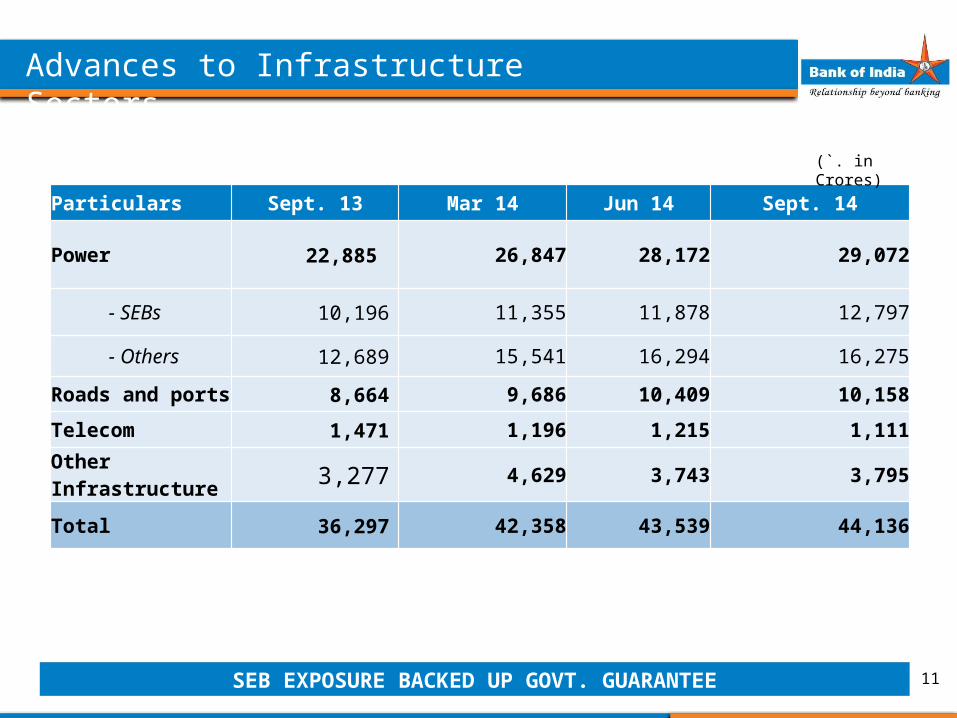
Particulars Sept. 13 Mar 14 Jun 14 Sept. 14
Power 22,885 26,847 28,172 29,072
- SEBs 10,196 11,355 11,878 12,797
- Others 12,689 15,541 16,294 16,275
Roads and ports 8,664 9,686 10,409 10,158
Telecom 1,471 1,196 1,215 1,111
Other Infrastructure 3,277 4,629 3,743 3,795
Total 36,297 42,358 43,539 44,136
(`. in Crores)
Advances to Infrastructure Sectors
11SEB EXPOSURE BACKED UP GOVT. GUARANTEE
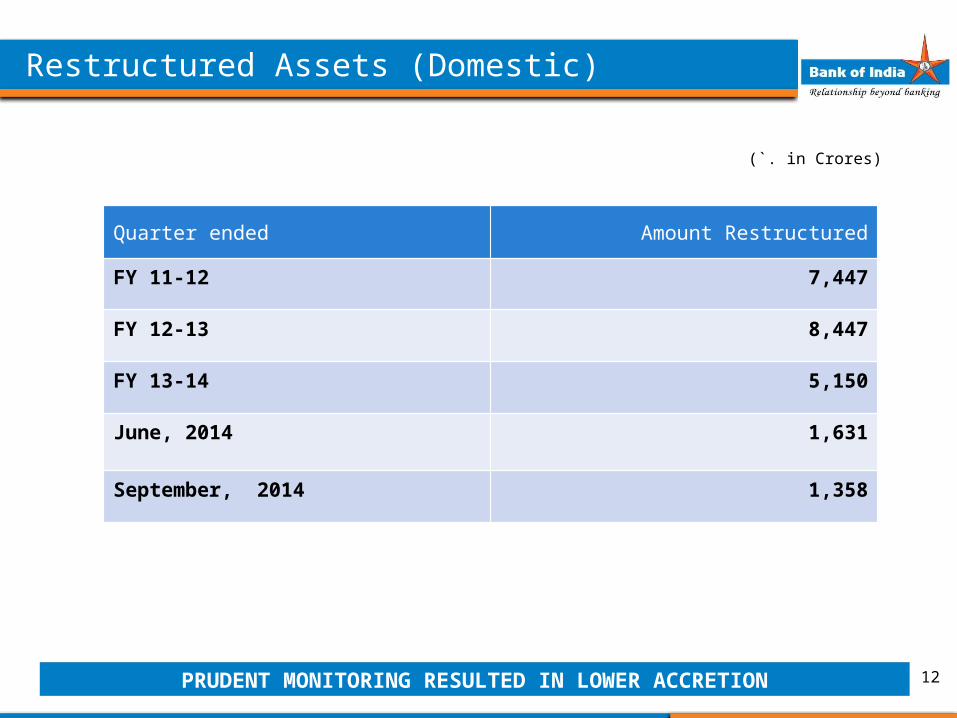
Quarter ended Amount Restructured
FY 11-12 7,447
FY 12-13 8,447
FY 13-14 5,150
June, 2014 1,631
September, 2014 1,358
(`. in Crores)
Restructured Assets (Domestic)
12PRUDENT MONITORING RESULTED IN LOWER ACCRETION
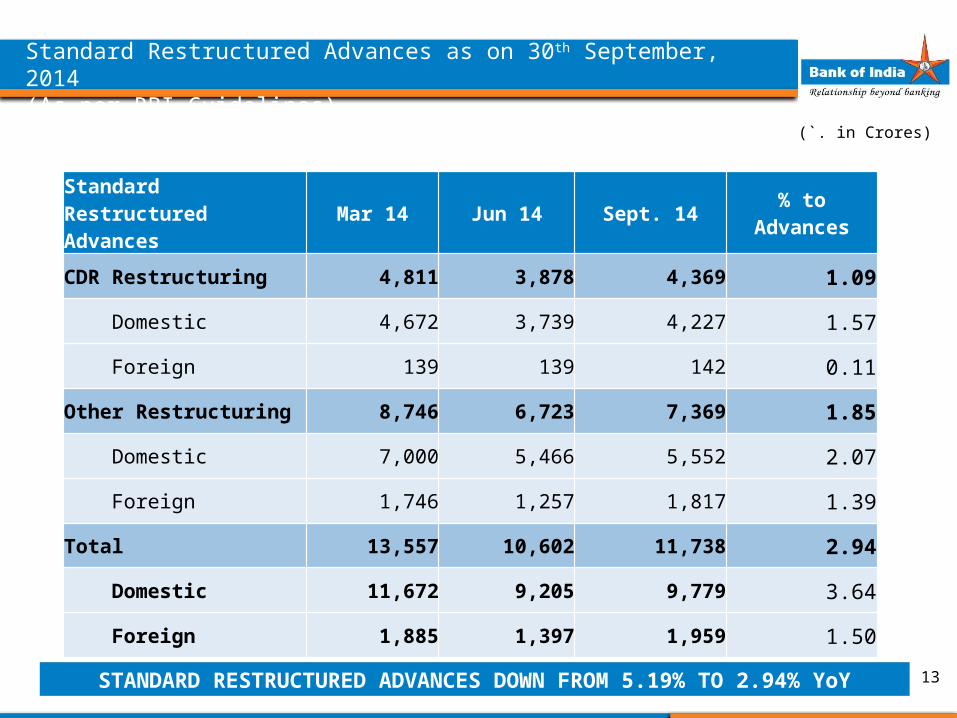
Standard Restructured Advances Mar 14 Jun 14 Sept. 14 % to Advances
CDR Restructuring 4,811 3,878 4,369 1.09
Domestic 4,672 3,739 4,227 1.57
Foreign 139 139 142 0.11
Other Restructuring 8,746 6,723 7,369 1.85
Domestic 7,000 5,466 5,552 2.07
Foreign 1,746 1,257 1,817 1.39
Total 13,557 10,602 11,738 2.94
Domestic 11,672 9,205 9,779 3.64
Foreign 1,885 1,397 1,959 1.50
(`. in Crores)
Standard Restructured Advances as on 30th September, 2014 (As per RBI Guidelines)
13STANDARD RESTRUCTURED ADVANCES DOWN FROM 5.19% TO 2.94% YoY
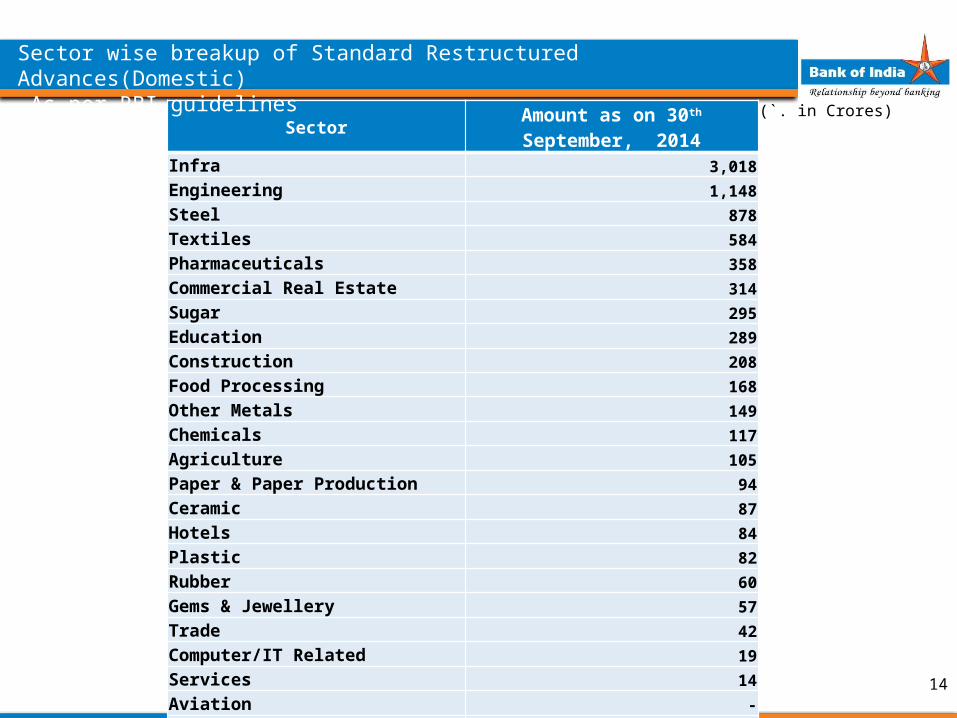
Sector Amount as on 30th September, 2014Infra 3,018Engineering 1,148Steel 878Textiles 584Pharmaceuticals 358Commercial Real Estate 314Sugar 295Education 289Construction 208Food Processing 168Other Metals 149Chemicals 117Agriculture 105Paper & Paper Production 94Ceramic 87Hotels 84Plastic 82Rubber 60Gems & Jewellery 57Trade 42Computer/IT Related 19Services 14Aviation -Automobiles -Misc & Others 1,611
Total 9,779
(`. in Crores)
Sector wise breakup of Standard Restructured Advances(Domestic)-As per RBI guidelines
14
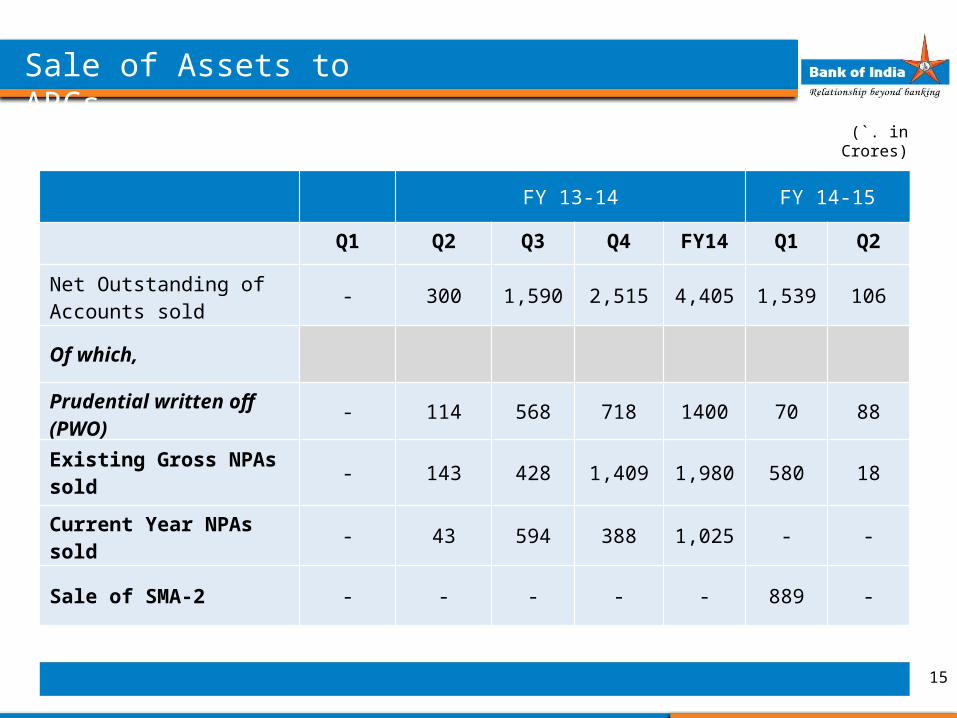
Sale of Assets to ARCs
FY 13-14 FY 14-15
Q1 Q2 Q3 Q4 FY14 Q1 Q2
Net Outstanding of Accounts sold - 300 1,590 2,515 4,405 1,539 106
Of which,
Prudential written off (PWO) - 114 568 718 1400 70 88
Existing Gross NPAs sold - 143 428 1,409 1,980 580 18
Current Year NPAs sold - 43 594 388 1,025 - -
Sale of SMA-2 - - - - - 889 -
15
(`. in Crores)
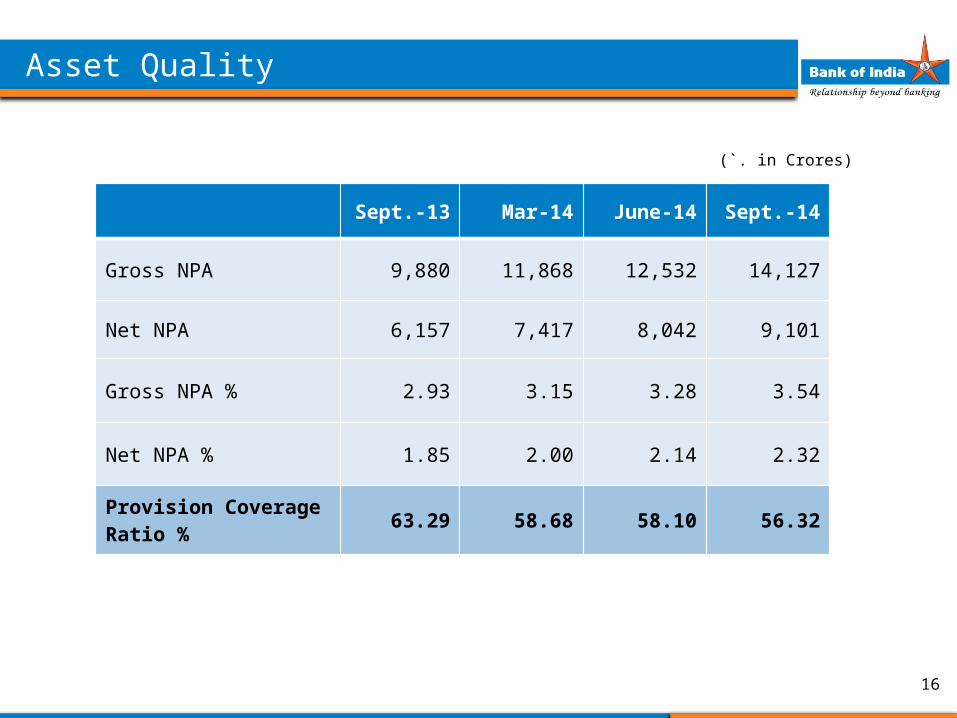
Sept.-13 Mar-14 June-14 Sept.-14
Gross NPA 9,880 11,868 12,532 14,127
Net NPA 6,157 7,417 8,042 9,101
Gross NPA % 2.93 3.15 3.28 3.54
Net NPA % 1.85 2.00 2.14 2.32
Provision Coverage Ratio % 63.29 58.68 58.10 56.32
Asset Quality
16
(`. in Crores)
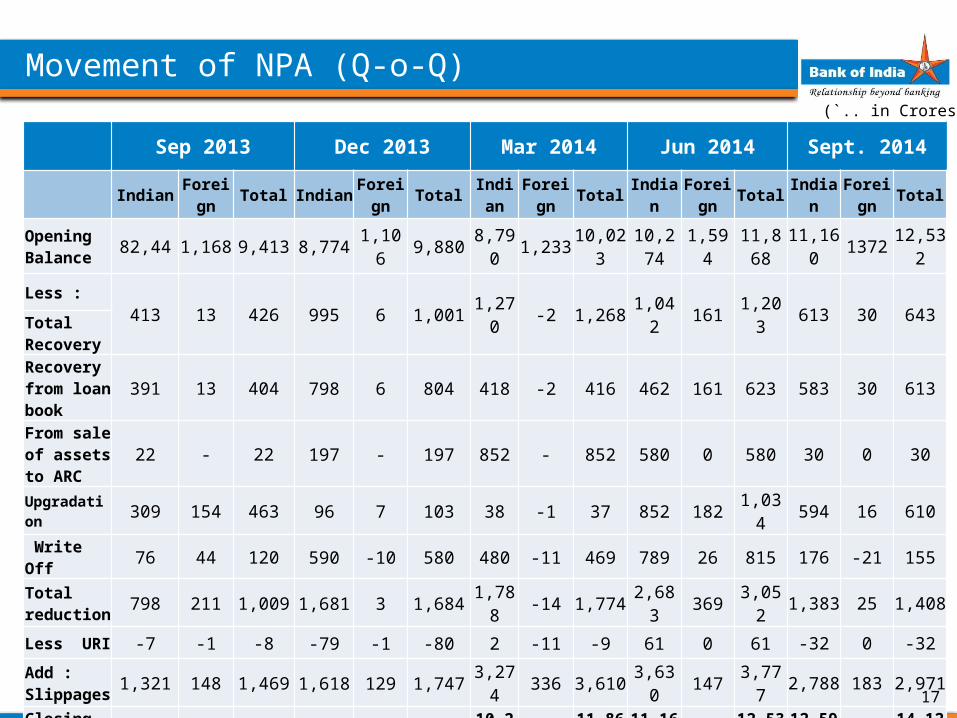
Sep 2013 Dec 2013 Mar 2014 Jun 2014 Sept. 2014
Indian Foreign Total Indian Foreign Total Indian Foreign Total Indian Foreign Total Indian Foreign Total
Opening Balance 82,44 1,168 9,413 8,774 1,106 9,880 8,790 1,233 10,023 10,274 1,594 11,868 11,160 1372 12,532
Less :413 13 426 995 6 1,001 1,270 -2 1,268 1,042 161 1,203 613 30 643
Total RecoveryRecovery from loan book
391 13 404 798 6 804 418 -2 416 462 161 623 583 30 613
From sale of assets to ARC
22 - 22 197 - 197 852 - 852 580 0 580 30 0 30
Upgradation 309 154 463 96 7 103 38 -1 37 852 182 1,034 594 16 610
Write Off 76 44 120 590 -10 580 480 -11 469 789 26 815 176 -21 155Total reduction 798 211 1,009 1,681 3 1,684 1,788 -14 1,774 2,683 369 3,052 1,383 25 1,408
Less URI -7 -1 -8 -79 -1 -80 2 -11 -9 61 0 61 -32 0 -32Add : Slippages 1,321 148 1,469 1,618 129 1,747 3,274 336 3,610 3,630 147 3,777 2,788 183 2,971
Closing Balance 8,774 1,106 9,880 8,790 1,233 10,023 10,274 1,594 11,868 11,160 1,372 12,532 12,597 1,530 14,127
(`.. in Crores)
Movement of NPA (Q-o-Q)
17
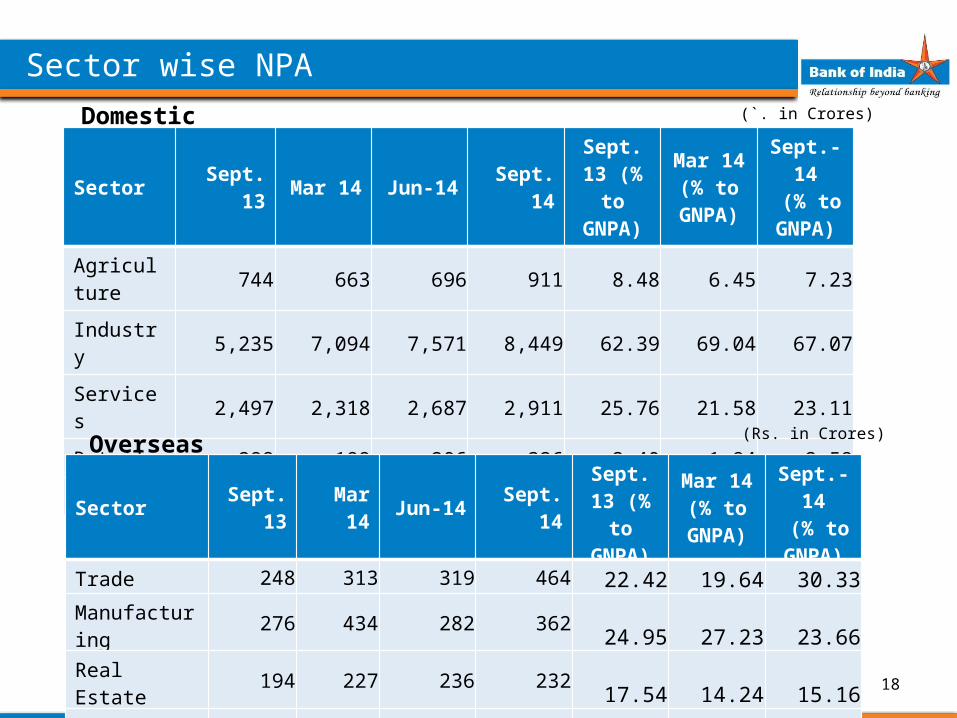
Sector Sept. 13 Mar 14 Jun-14 Sept. 14Sept. 13
(% to GNPA)
Mar 14 (% to
GNPA)
Sept.-14 (% to GNPA)
Agriculture 744 663 696 911 8.48 6.45 7.23
Industry 5,235 7,094 7,571 8,449 62.39 69.04 67.07
Services 2,497 2,318 2,687 2,911 25.76 21.58 23.11
Retail 298 199 206 326 3.40 1.94 2.59
Total 8,774 10,274 11,160 12,597
(`. in Crores)
Sector wise NPA
18
Domestic
Sector Sept. 13 Mar 14 Jun-14 Sept. 14Sept. 13
(% to GNPA)
Mar 14 (% to
GNPA)
Sept.-14 (% to GNPA)
Trade 248 313 319 464 22.42 19.64 30.33Manufacturing 276 434 282 362 24.95 27.23 23.66Real Estate 194 227 236 232 17.54 14.24 15.16Others 388 620 535 472 35.08 38.90 30.85Total 1,106 1,594 1,372 1,530
(Rs. in Crores)Overseas
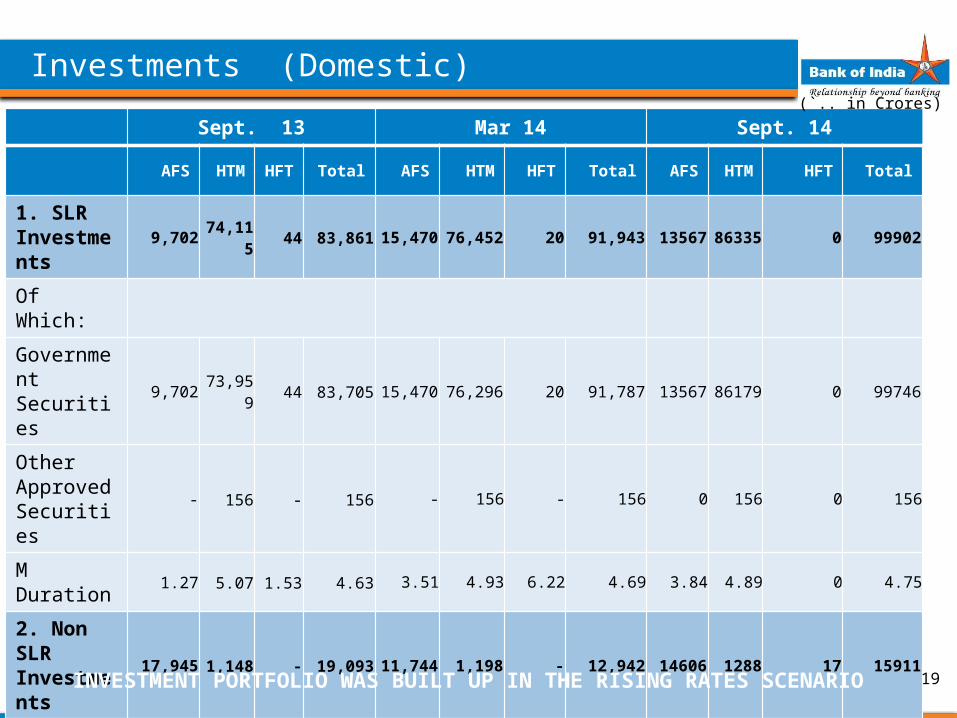
Sept. 13 Mar 14 Sept. 14
AFS HTM HFT Total AFS HTM HFT Total AFS HTM HFT Total
1. SLR Investments 9,702 74,115 44 83,861 15,470 76,452 20 91,943 13567 86335 0 99902
Of Which:
Government Securities 9,702 73,959 44 83,705 15,470 76,296 20 91,787 13567 86179 0 99746
Other Approved Securities
- 156 - 156 - 156 - 156 0 156 0 156
M Duration 1.27 5.07 1.53 4.63 3.51 4.93 6.22 4.69 3.84 4.89 0 4.75
2. Non SLR Investments 17,945 1,148 - 19,093 11,744 1,198 - 12,942 14606 1288 17 15911
M Duration 1.53 0.57 - 1.52 3.16 4.62 - 3.20 3.97 0.58 0 3.89
Total 27,646 75,264 44 1,02,954 27,214 77,650 20 1,04,885 2817 87623 17 115813
(`.. in Crores)
Investments (Domestic)
19INVESTMENT PORTFOLIO WAS BUILT UP IN THE RISING RATES SCENARIO
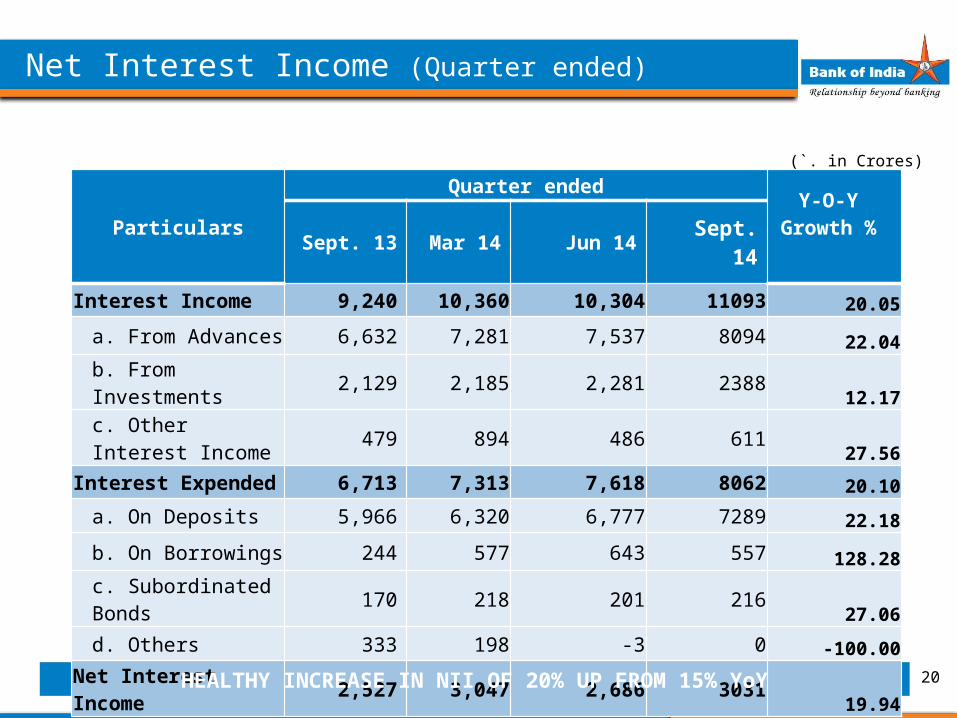
Particulars
Quarter ended Y-O-Y Growth %
Sept. 13 Mar 14 Jun 14 Sept. 14
Interest Income 9,240 10,360 10,304 11093 20.05
a. From Advances 6,632 7,281 7,537 8094 22.04
b. From Investments 2,129 2,185 2,281 2388 12.17c. Other Interest Income 479 894 486 611 27.56
Interest Expended 6,713 7,313 7,618 8062 20.10a. On Deposits 5,966 6,320 6,777 7289 22.18
b. On Borrowings 244 577 643 557 128.28
c. Subordinated Bonds 170 218 201 21627.06
d. Others 333 198 -3 0 -100.00
Net Interest Income 2,527 3,047 2,686 3031 19.94
(`. in Crores)
Net Interest Income (Quarter ended)
20HEALTHY INCREASE IN NII OF 20% UP FROM 15% YoY
(`. in Crores)
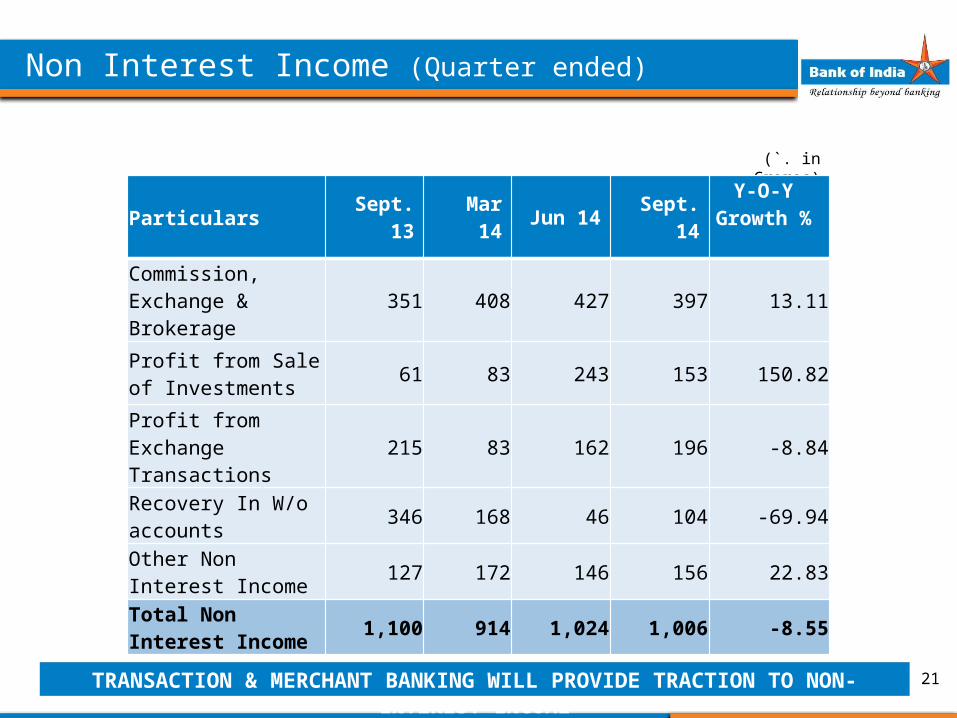
Non Interest Income (Quarter ended)
21
Particulars Sept. 13 Mar 14 Jun 14 Sept. 14Y-O-Y
Growth %
Commission, Exchange & Brokerage 351 408 427 397 13.11
Profit from Sale of Investments 61 83 243 153 150.82
Profit from Exchange Transactions 215 83 162 196 -8.84
Recovery In W/o accounts 346 168 46 104 -69.94
Other Non Interest Income 127 172 146 156 22.83
Total Non Interest Income 1,100 914 1,024 1,006 -8.55
TRANSACTION & MERCHANT BANKING WILL PROVIDE TRACTION TO NON-INTEREST INCOME
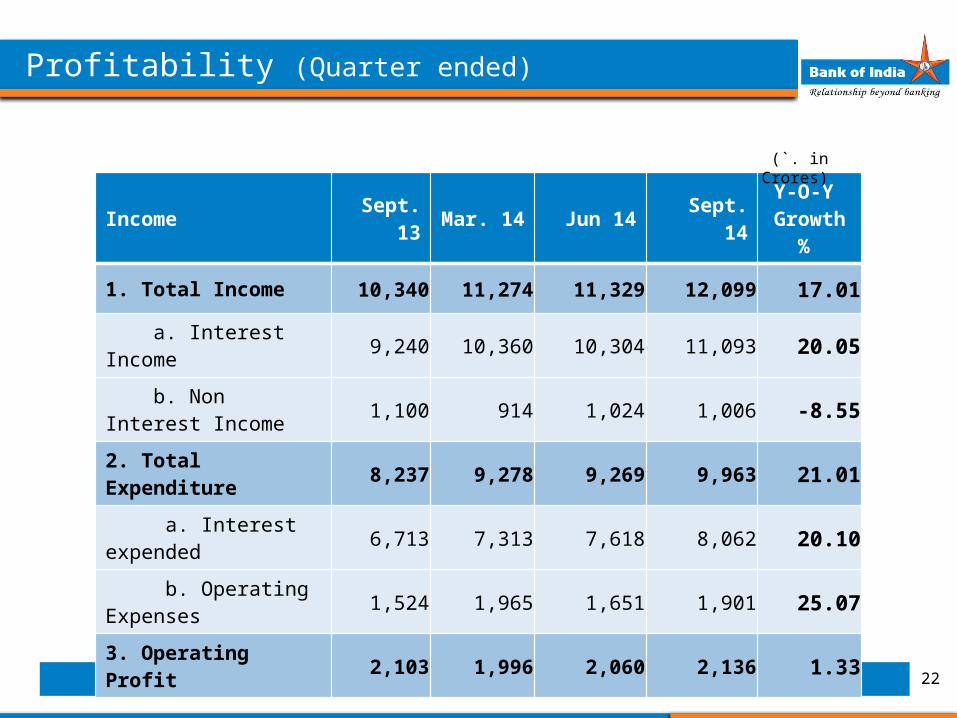
Income Sept. 13 Mar. 14 Jun 14 Sept. 14 Y-O-Y Growth %
1. Total Income 10,340 11,274 11,329 12,099 17.01
a. Interest Income 9,240 10,360 10,304 11,093 20.05
b. Non Interest Income 1,100 914 1,024 1,006 -8.55
2. Total Expenditure 8,237 9,278 9,269 9,963 21.01
a. Interest expended 6,713 7,313 7,618 8,062 20.10
b. Operating Expenses 1,524 1,965 1,651 1,901 25.07
3. Operating Profit 2,103 1,996 2,060 2,136 1.33
(`. in Crores)
Profitability (Quarter ended)
22
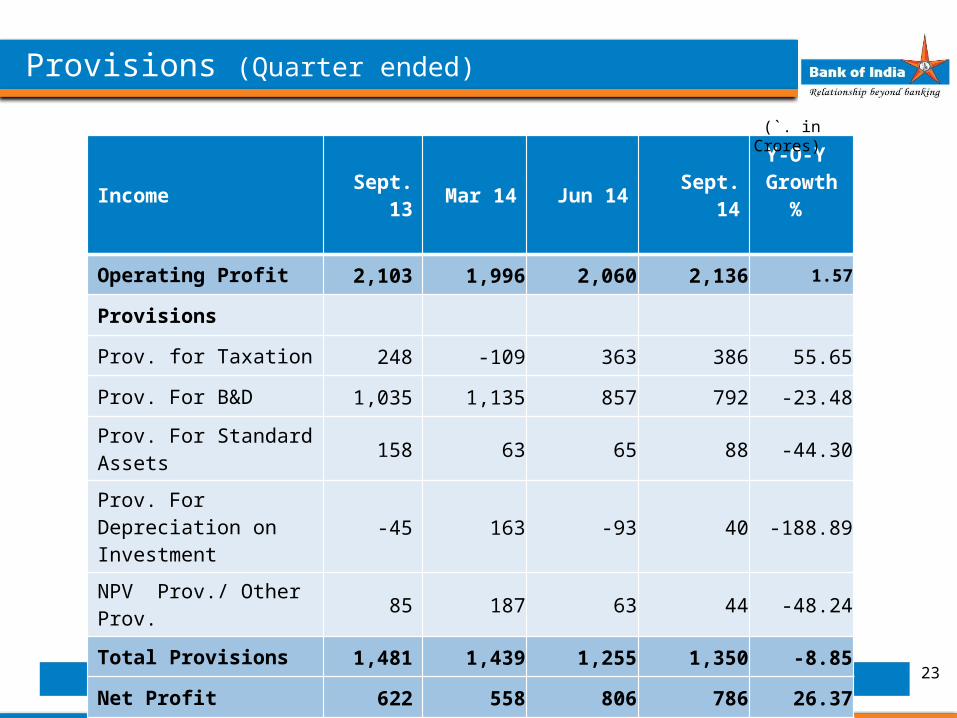
Income Sept. 13 Mar 14 Jun 14 Sept. 14Y-O-Y
Growth %
Operating Profit 2,103 1,996 2,060 2,136 1.57
Provisions
Prov. for Taxation 248 -109 363 386 55.65
Prov. For B&D 1,035 1,135 857 792 -23.48
Prov. For Standard Assets 158 63 65 88 -44.30
Prov. For Depreciation on Investment -45 163 -93 40 -188.89
NPV Prov./ Other Prov. 85 187 63 44 -48.24
Total Provisions 1,481 1,439 1,255 1,350 -8.85
Net Profit 622 558 806 786 26.37
MProvisions (Quarter ended)
(`. in Crores)
23
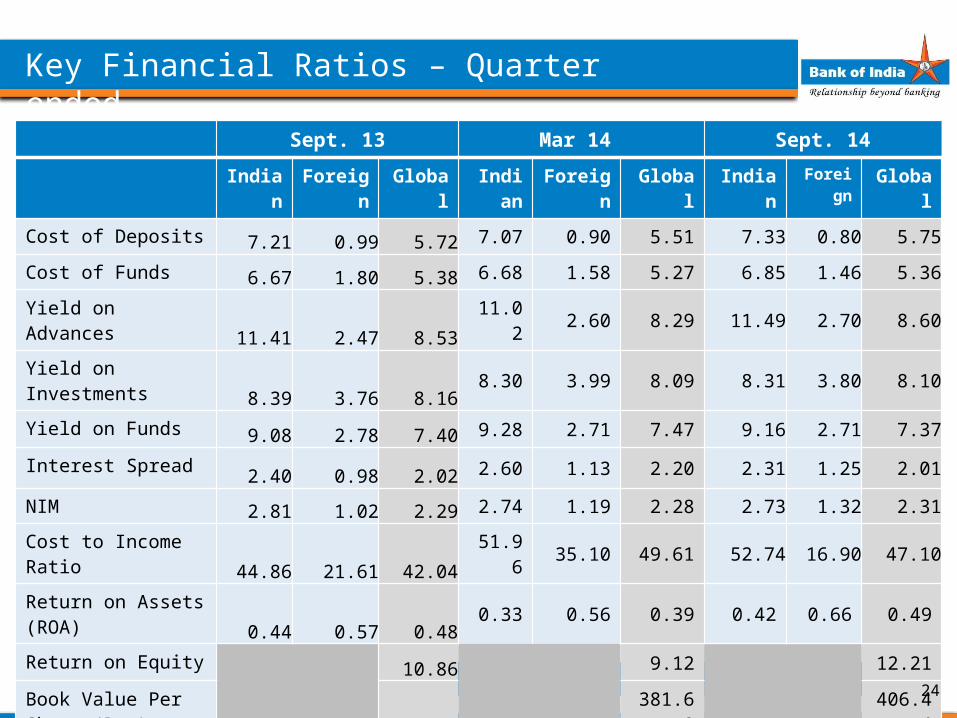
Sept. 13 Mar 14 Sept. 14
Indian Foreign Global Indian Foreign Global Indian Foreign Global
Cost of Deposits7.21 0.99 5.72 7.07 0.90 5.51 7.33 0.80 5.75
Cost of Funds6.67 1.80 5.38 6.68 1.58 5.27 6.85 1.46 5.36
Yield on Advances11.41 2.47 8.53 11.02 2.60 8.29 11.49 2.70 8.60
Yield on Investments8.39 3.76 8.16 8.30 3.99 8.09 8.31 3.80 8.10
Yield on Funds9.08 2.78 7.40 9.28 2.71 7.47 9.16 2.71 7.37
Interest Spread2.40 0.98 2.02 2.60 1.13 2.20 2.31 1.25 2.01
NIM2.81 1.02 2.29 2.74 1.19 2.28 2.73 1.32 2.31
Cost to Income Ratio44.86 21.61 42.04 51.96 35.10 49.61 52.74 16.90 47.10
Return on Assets (ROA)0.44 0.57 0.48 0.33 0.56 0.39 0.42 0.66 0.49
Return on Equity10.86 9.12 12.21
Book Value Per Share (Rs.) 388.95
381.69 406.44
Earning Per Share (Rs.)10.43 8.68 12.24
NKey Financial Ratios – Quarter ended
24
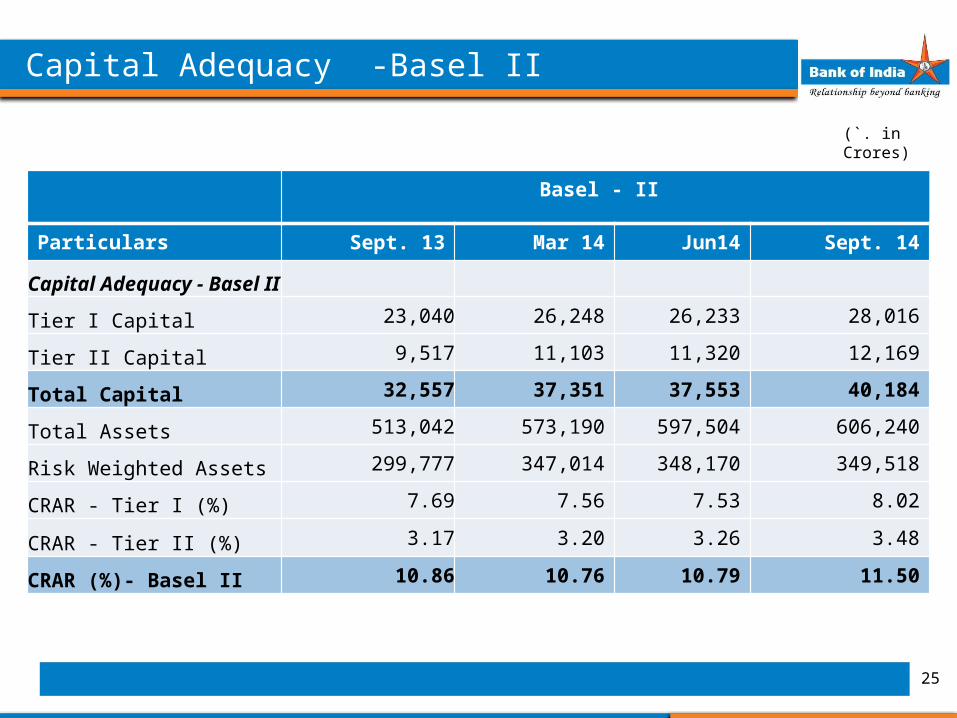
Basel - II
Particulars Sept. 13 Mar 14 Jun14 Sept. 14
Capital Adequacy - Basel II
Tier I Capital 23,040 26,248 26,233 28,016
Tier II Capital 9,517 11,103 11,320 12,169
Total Capital 32,557 37,351 37,553 40,184
Total Assets 513,042 573,190 597,504 606,240
Risk Weighted Assets 299,777 347,014 348,170 349,518
CRAR - Tier I (%) 7.69 7.56 7.53 8.02
CRAR - Tier II (%) 3.17 3.20 3.26 3.48
CRAR (%)- Basel II 10.86 10.76 10.79 11.50
Capital Adequacy -Basel II
(`. in Crores)
25
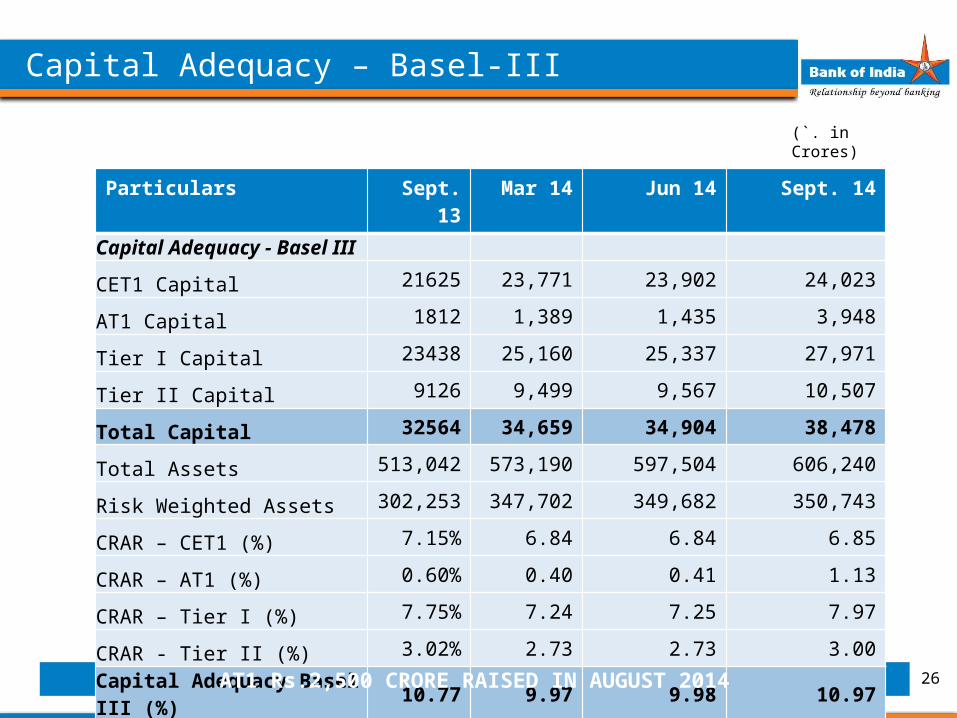
Particulars Sept. 13 Mar 14 Jun 14 Sept. 14
Capital Adequacy - Basel IIICET1 Capital 21625 23,771 23,902 24,023
AT1 Capital 1812 1,389 1,435 3,948
Tier I Capital 23438 25,160 25,337 27,971
Tier II Capital 9126 9,499 9,567 10,507
Total Capital 32564 34,659 34,904 38,478
Total Assets 513,042 573,190 597,504 606,240
Risk Weighted Assets 302,253 347,702 349,682 350,743
CRAR – CET1 (%) 7.15% 6.84 6.84 6.85
CRAR – AT1 (%) 0.60% 0.40 0.41 1.13
CRAR – Tier I (%) 7.75% 7.24 7.25 7.97
CRAR - Tier II (%) 3.02% 2.73 2.73 3.00
Capital Adequacy Basel III (%) 10.77 9.97 9.98 10.97
Capital Adequacy – Basel-III
(`. in Crores)
26AT1 Rs.2,500 CRORE RAISED IN AUGUST 2014
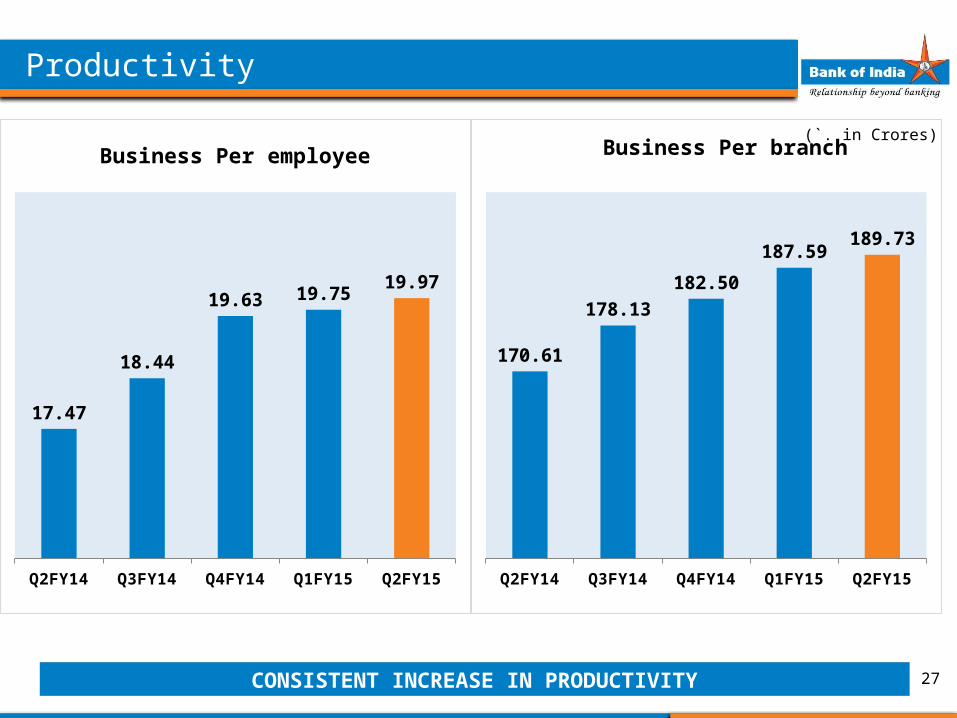
Q2FY14 Q3FY14 Q4FY14 Q1FY15 Q2FY15
170.61
178.13182.50
187.59189.73
Business Per branch (`. in Crores)
Productivity
27
Q2FY14 Q3FY14 Q4FY14 Q1FY15 Q2FY15
17.47
18.44
19.63 19.7519.97
Business Per employee
CONSISTENT INCREASE IN PRODUCTIVITY
Q2FY14 Q3FY14 Q4FY14 Q1FY15 Q2FY15
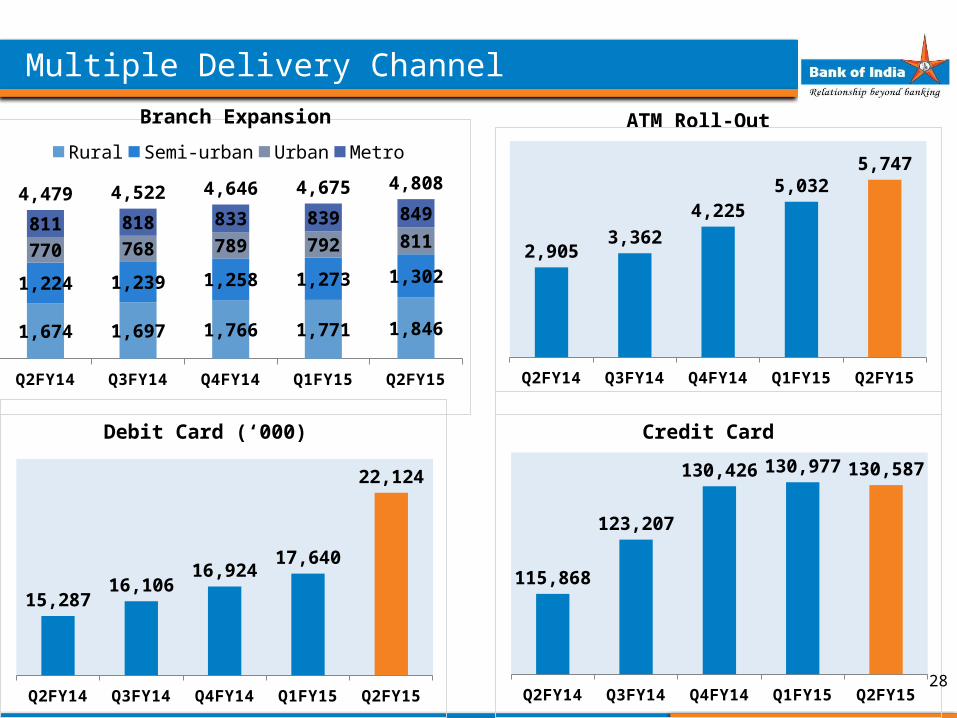
115,868
123,207
130,426 130,977 130,587
Q2FY14 Q3FY14 Q4FY14 Q1FY15 Q2FY15
1,674 1,697 1,766 1,771 1,846
1,224 1,239 1,258 1,273 1,302 770 768 789 792 811 811 818 833 839 849
4,479 4,522 4,646 4,675 4,808
Rural Semi-urban Urban Metro
Q2FY14 Q3FY14 Q4FY14 Q1FY15 Q2FY15
15,287 16,106
16,924 17,640
22,124
Multiple Delivery Channel
Branch Expansion
Debit Card (‘000)
ATM Roll-Out
Q2FY14 Q3FY14 Q4FY14 Q1FY15 Q2FY15
2,905 3,362
4,225 5,032
5,747
28
Credit Card
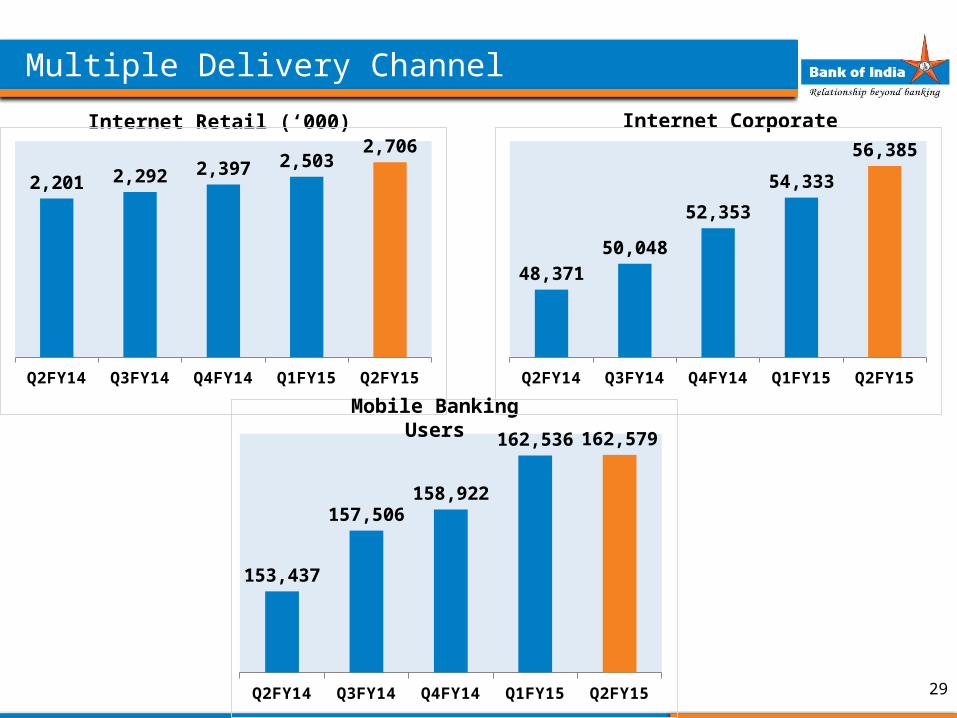
Q2FY14 Q3FY14 Q4FY14 Q1FY15 Q2FY15
153,437
157,506 158,922
162,536 162,579
Multiple Delivery Channel
Internet Retail (‘000)
Mobile Banking Users
Internet Corporate
Q2FY14 Q3FY14 Q4FY14 Q1FY15 Q2FY15
48,371 50,048
52,353
54,333
56,385
29
Q2FY14 Q3FY14 Q4FY14 Q1FY15 Q2FY15
2,201 2,292 2,397 2,503 2,706
FY12 FY13 FY14 Q1FY15 Q2FY15
812
23
28
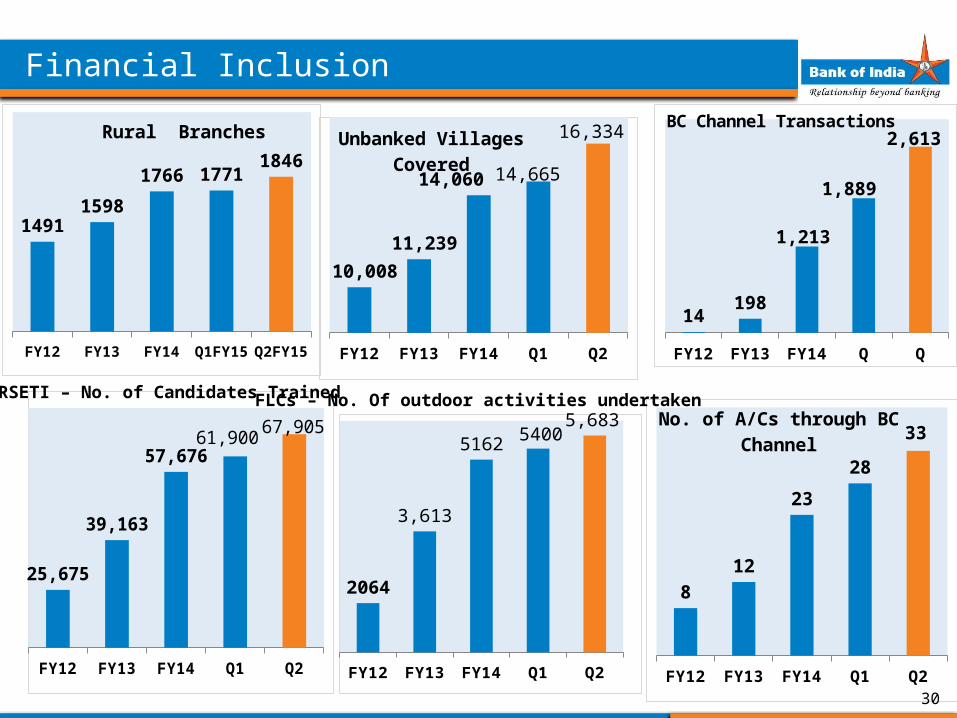
33No. of A/Cs through BC
Channel
Financial Inclusion
30
FY12 FY13 FY14 Q1FY15 Q2FY15
14 198
1,213
1,889
2,613 BC Channel Transactions
FY12 FY13 FY14 Q1FY15 Q2FY15
14911598
1766 17711846
Rural Branches
FY12 FY13 FY14 Q1FY15 Q2FY15
10,008 11,239
14,060 14,665
16,334 Unbanked Villages Covered
FY12 FY13 FY14 Q1FY15 Q2FY15
25,675
39,163
57,676 61,900 67,905
FY12 FY13 FY14 Q1FY15 Q2FY15
2064
3,613
5162 54005,683
FLCs – No. Of outdoor activities undertakenRSETI – No. of Candidates Trained
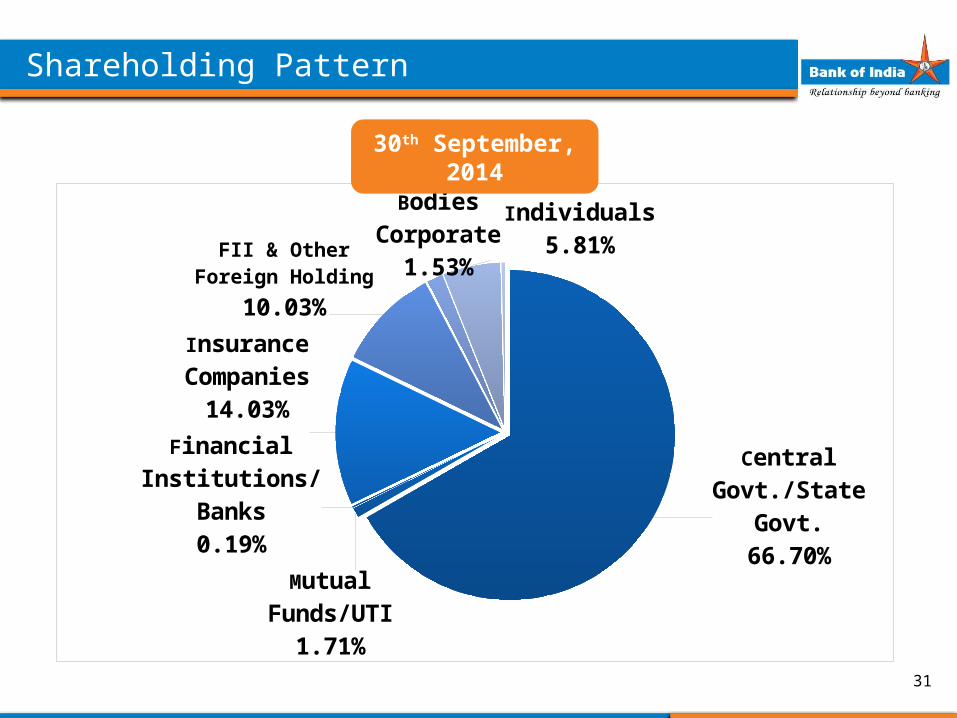
Central Govt./State Govt.
66.70%
Mutual Funds/UTI1.71%
Financial Institu-tions/Banks
0.19%
Insurance Com-panies14.03%
FII & Other Foreign Holding10.03%
Bodies Corporate1.53%
Individuals5.81%
30th September, 2014
Shareholding Pattern
31
Financial Inclusion & Payment System Award by Elets Media at New Delhi at the hands of Minister of Rural Development.
Bank has received Skoch award 2013 for IT innovation.
Bank has received “Best Banker” award at the India SME excellence Awards-2013, for exemplary contribution in Banking Sector.
Bank received the Award CIO 100 2014 for the product Startoken NG
Awards & Recognition
32
Bank received Skoch Group Financial Inclusion Deepening Award – June 2014
Bank won IT excellence award by ETNOW and VMW are for effectively implementing Virtualization in the Bank.
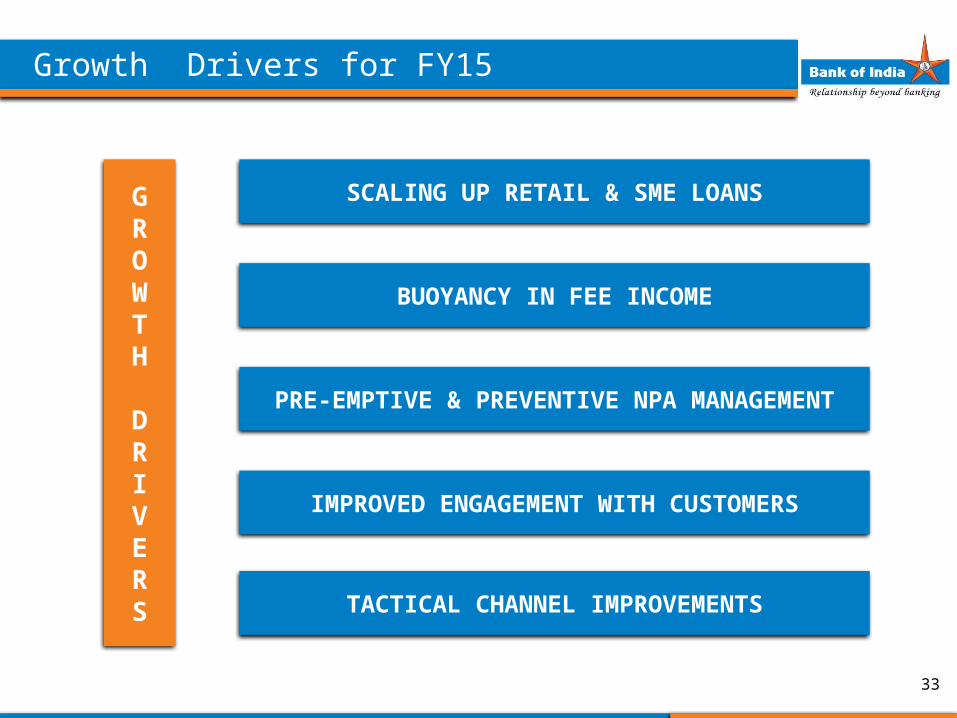
Growth Drivers for FY15
GROWTH DRIVERS
SCALING UP RETAIL & SME LOANS
BUOYANCY IN FEE INCOME
PRE-EMPTIVE & PREVENTIVE NPA MANAGEMENT
IMPROVED ENGAGEMENT WITH CUSTOMERS
33
TACTICAL CHANNEL IMPROVEMENTS
34
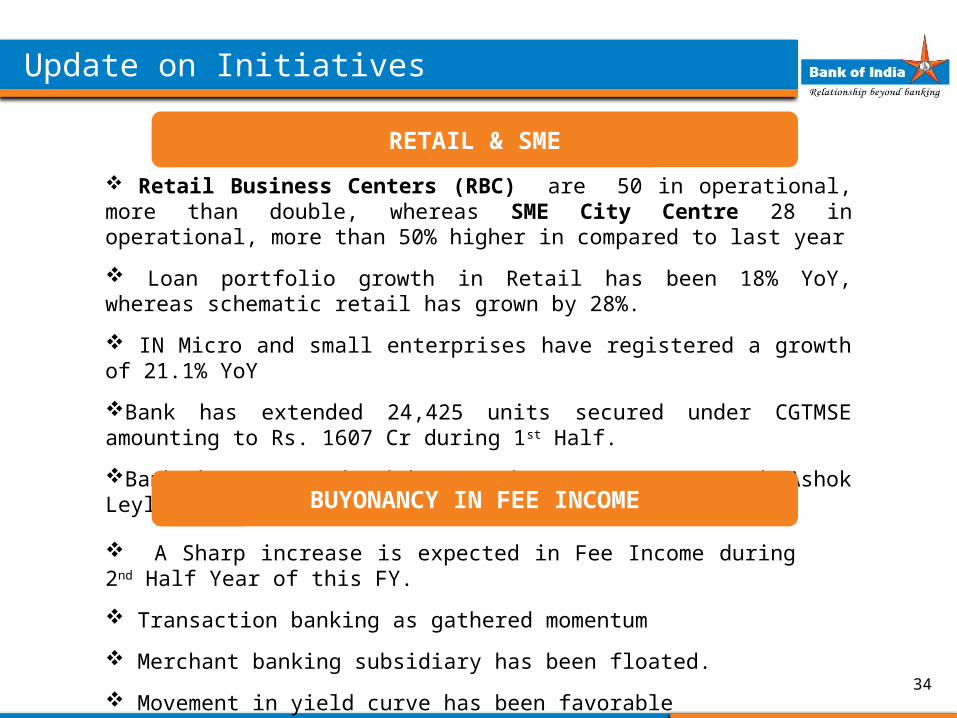
Update on Initiatives
Retail Business Centers (RBC) are 50 in operational, more than double, whereas SME City Centre 28 in operational, more than 50% higher in compared to last year
Loan portfolio growth in Retail has been 18% YoY, whereas schematic retail has grown by 28%.
IN Micro and small enterprises have registered a growth of 21.1% YoY
Bank has extended 24,425 units secured under CGTMSE amounting to Rs. 1607 Cr during 1st Half.
Bank has entered with Maruti, Tata Motors and Ashok Leyland for financing their dealers.
RETAIL & SME
BUYONANCY IN FEE INCOME
A Sharp increase is expected in Fee Income during 2nd Half Year of this FY.
Transaction banking as gathered momentum
Merchant banking subsidiary has been floated.
Movement in yield curve has been favorable
35 35
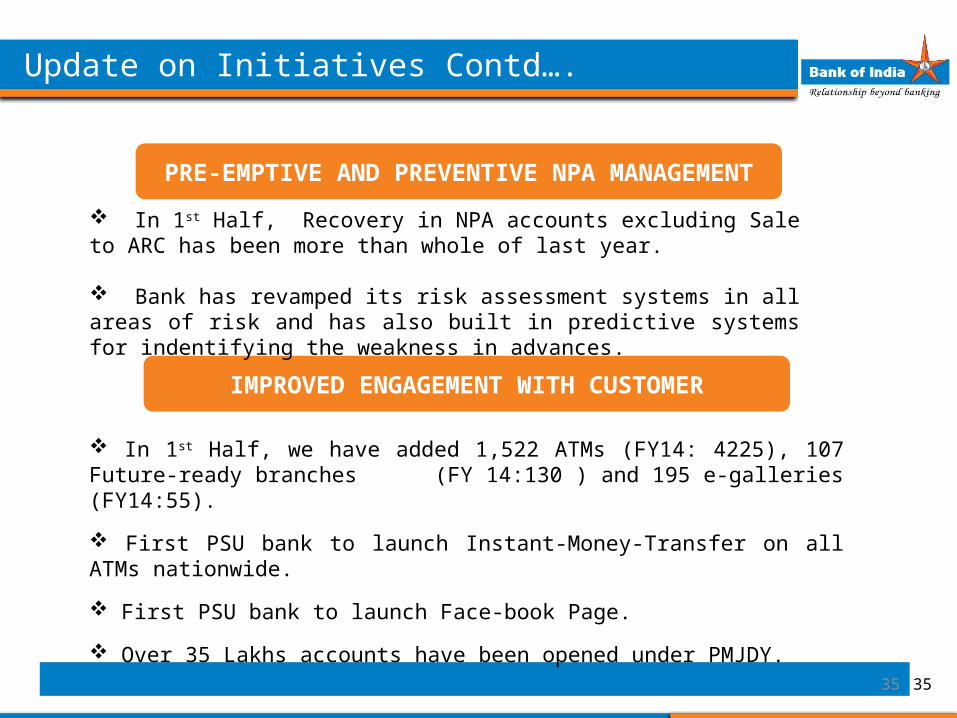
Update on Initiatives Contd….
In 1st Half, we have added 1,522 ATMs (FY14: 4225), 107 Future-ready branches (FY 14:130 ) and 195 e-galleries (FY14:55).
First PSU bank to launch Instant-Money-Transfer on all ATMs nationwide.
First PSU bank to launch Face-book Page.
Over 35 Lakhs accounts have been opened under PMJDY.
IMPROVED ENGAGEMENT WITH CUSTOMER
PRE-EMPTIVE AND PREVENTIVE NPA MANAGEMENT
In 1st Half, Recovery in NPA accounts excluding Sale to ARC has been more than whole of last year.
Bank has revamped its risk assessment systems in all areas of risk and has also built in predictive systems for indentifying the weakness in advances.
36
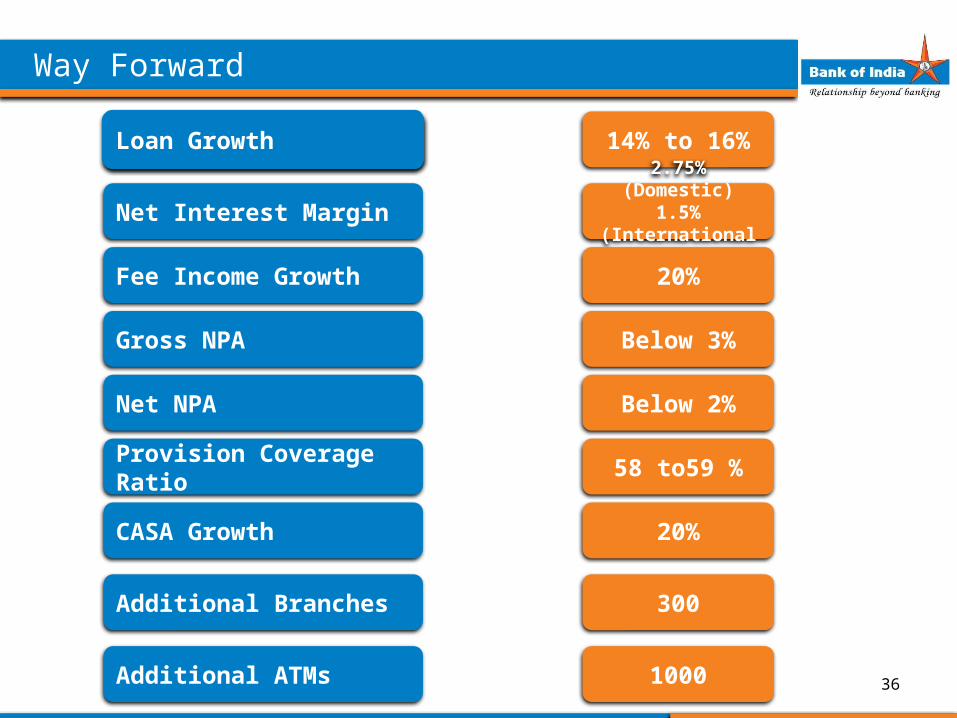
Way Forward
Loan Growth
Net Interest Margin
Fee Income Growth
Gross NPA
Net NPA
CASA Growth
Additional Branches
14% to 16%
2.75% (Domestic)1.5% (International)
20%
Below 3%
Below 2%
20%
300
Additional ATMs 1000
Provision Coverage Ratio 58 to59 %
THANK YOU!
37


![FY16 3rd Quarter Financial Results [IFRS] · FY16 3rd Quarter Financial Results [IFRS] Hitachi High-Technologies Corporation January 27, 2017 ... FY15/Q1 FY15/Q2 FY15/Q3 FY15/Q4 FY16/Q1](https://static.fdocuments.in/doc/165x107/5ec630f9034f80098f725dcb/fy16-3rd-quarter-financial-results-ifrs-fy16-3rd-quarter-financial-results-ifrs.jpg)