Performance Extrapolation across Servers - CMG · PDF fileWhy do performance extrapolation...
24
1 Computer Measurement Group, India www.cmgindia.org Computer Measurement Group, India Performance Extrapolation across Servers Subhasri Duttagupta
Transcript of Performance Extrapolation across Servers - CMG · PDF fileWhy do performance extrapolation...
1 Computer Measurement Group, India
www.cmgindia.org
Computer Measurement Group, India
Performance Extrapolation across
Servers Subhasri Duttagupta

2 Computer Measurement Group, India
Outline
Why do performance extrapolation across servers?
What are the techniques for extrapolation?
– SPEC-Rates of servers
– Single user service-demand based technique
What information is required for extrapolation?
How the strategies perform for real applications?

3 Computer Measurement Group, India
Why use Performance Extrapolation?
Predict Performance of an application from Test to Production
platform
Predict performance for a large number of users
– Not enough virtual user licenses
4 Computer Measurement Group, India
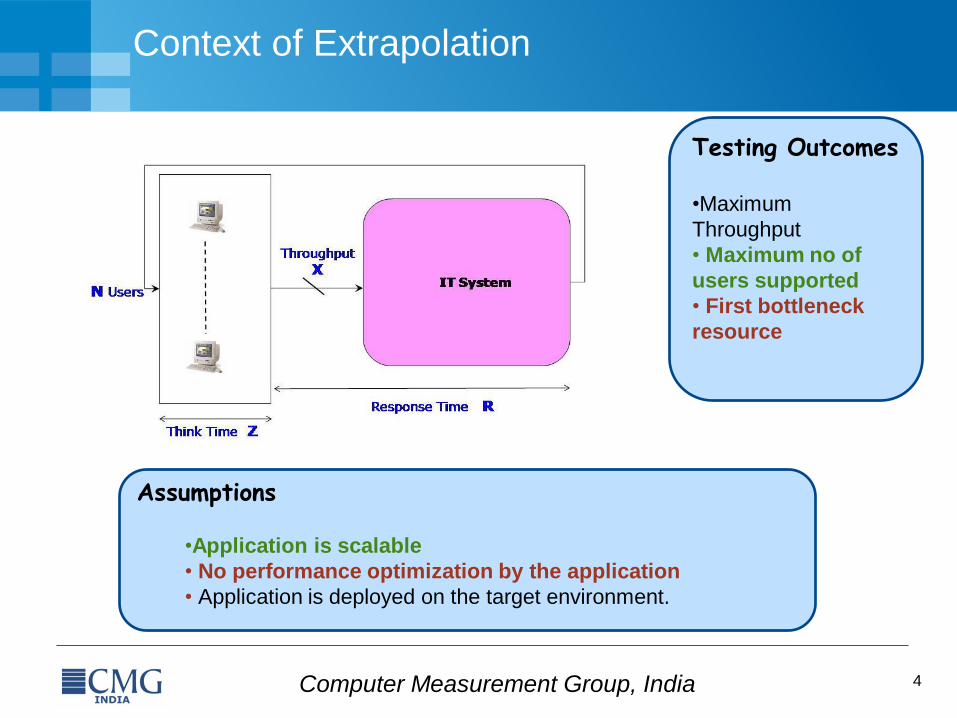
Context of Extrapolation
Assumptions
•Application is scalable
• No performance optimization by the application
• Application is deployed on the target environment.
Testing Outcomes •Maximum
Throughput
• Maximum no of
users supported
• First bottleneck
resource
5 Computer Measurement Group, India
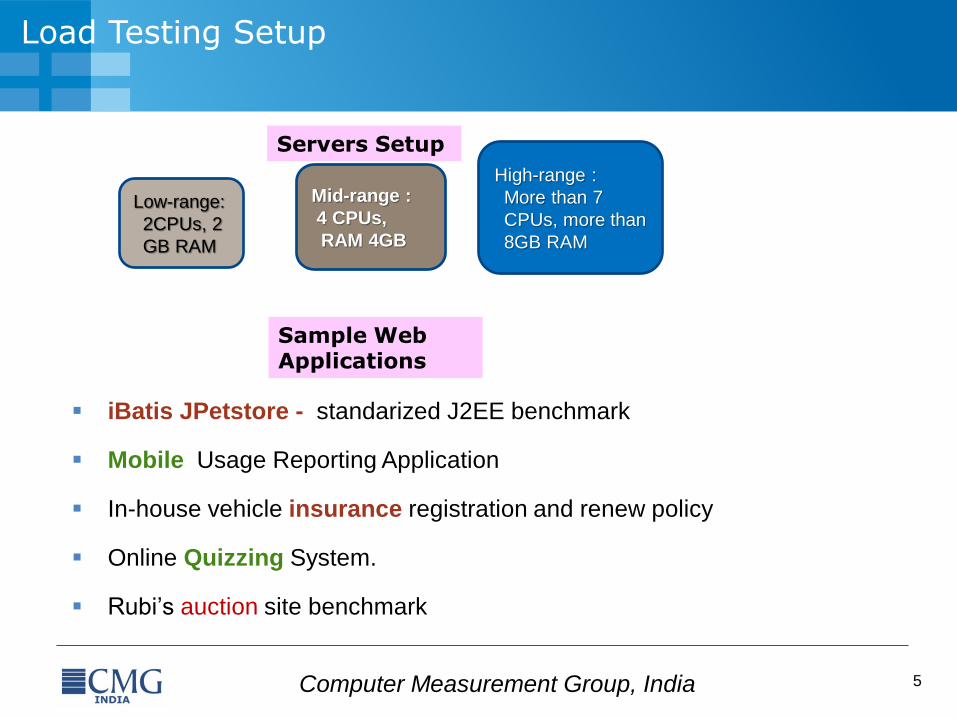
Load Testing Setup
Low-range:
2CPUs, 2
GB RAM
Mid-range :
4 CPUs,
RAM 4GB
High-range :
More than 7
CPUs, more than
8GB RAM
Servers Setup
Sample Web Applications
iBatis JPetstore - standarized J2EE benchmark
Mobile Usage Reporting Application
In-house vehicle insurance registration and renew policy
Online Quizzing System.
Rubi’s auction site benchmark
6 Computer Measurement Group, India
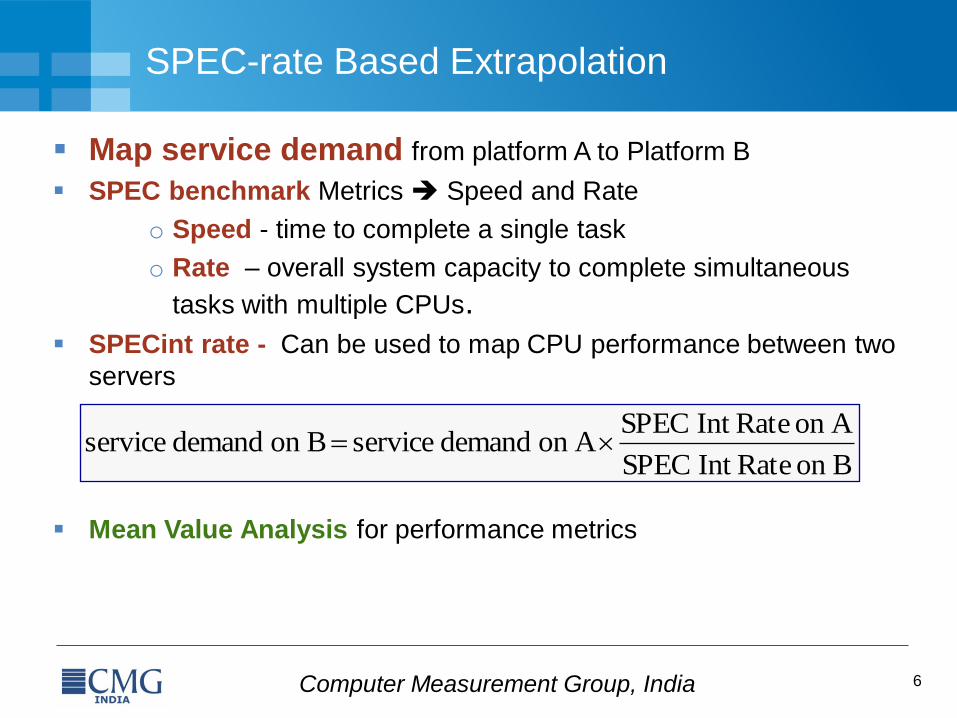
SPEC-rate Based Extrapolation
Map service demand from platform A to Platform B
SPEC benchmark Metrics Speed and Rate
o Speed - time to complete a single task
o Rate – overall system capacity to complete simultaneous
tasks with multiple CPUs.
SPECint rate - Can be used to map CPU performance between two
servers
Mean Value Analysis for performance metrics
Bon RateInt SPEC
Aon RateInt SPECAon demand service Bon demand service
7 Computer Measurement Group, India
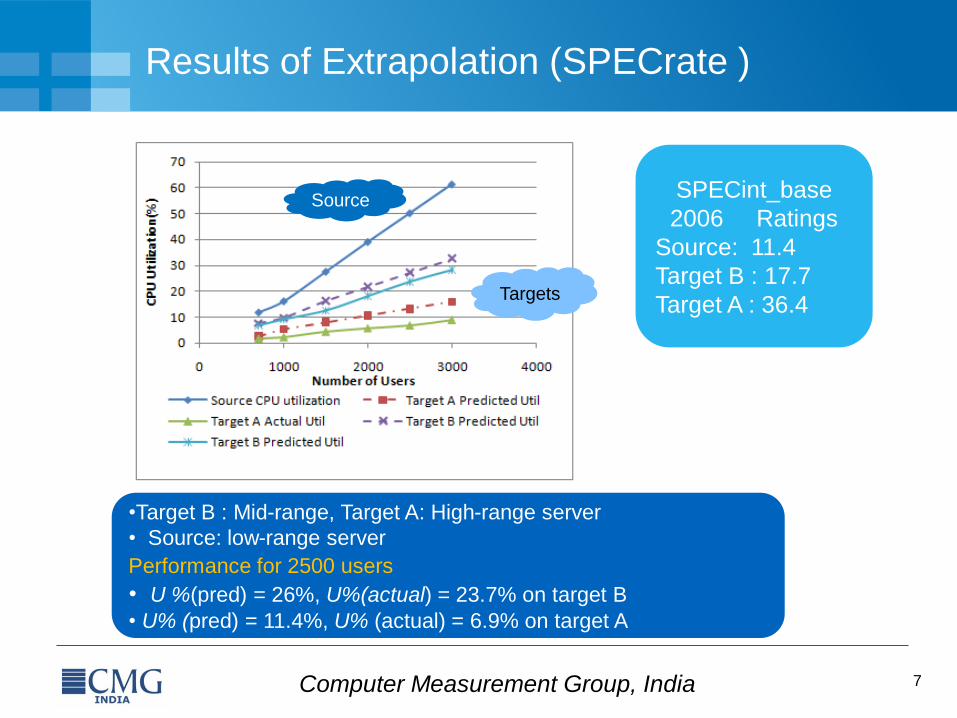
Results of Extrapolation (SPECrate )
SPECint_base
2006 Ratings
Source: 11.4
Target B : 17.7
Target A : 36.4
Source
Targets
•Target B : Mid-range, Target A: High-range server
• Source: low-range server
Performance for 2500 users
• U %(pred) = 26%, U%(actual) = 23.7% on target B
• U% (pred) = 11.4%, U% (actual) = 6.9% on target A

8 Computer Measurement Group, India
Service demand based Extrapolation
Initial Tests on Source
Single User Test on Target
o Captures basic application characteristics on Target.
Load Extrapolation on Target
Test
Production
0
100
200
300
400
500
600
700
0 2000 4000 6000
Th
rou
gh
pu
t
(pa
ges/
sec)
No of Users
Actual Test
Result
Mixed
Mode

9 Computer Measurement Group, India
Steps Involved
Load testing on a Source platform for small number of
users.
– Obtain throughput values x1, x2 .. xs for N1, N2 …Ns users
– Assume same throughput on the target platform
Single User Test on Target platform with think time Z=0
o Service demand for all the resources sdcpu, sddisk
o z ≠0, service demands are high
o Utilization Law to obtain cpu%, disk%
Load Extrapolation on Target
– Make use of utilization and throughput values for N1, N2 …Ns users
– Patented load extrapolation technique

10 Computer Measurement Group, India
Load Extrapolation using Linear Regression
If no bottleneck, throughput increases linearly with the number of
users.
Linear regression is an obvious choice
0
200
400
600
800
0 2000 4000 6000
Th
rou
gh
pu
t
Loads
Actual Test Result
Extrapolated Result (Linear Regression)
Error > 10%
for N > 3000

11 Computer Measurement Group, India
Load Extrapolation using S-curve
0
100
200
300
400
500
600
700
0 2000 4000 6000
Th
rou
gh
pu
t (p
ages
/sec
)
Number of Users Actual Test Result
Extrapolated Result (S curve)
)]exp(1/[max bNaXX
S-curves represents rapid growth followed by saturation
S-curve saturates fast
12 Computer Measurement Group, India
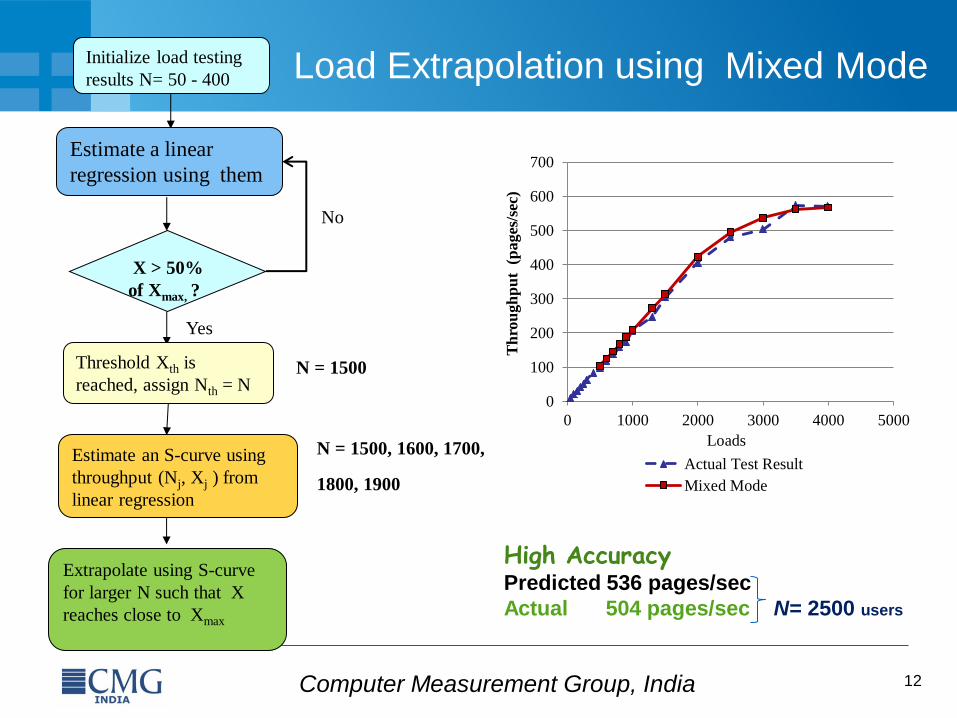
High Accuracy Predicted 536 pages/sec
Actual 504 pages/sec N= 2500 users
Initialize load testing
results N= 50 - 400
Yes
Extrapolate using S-curve
for larger N such that X
reaches close to Xmax
Estimate a linear
regression using them
X > 50%
of Xmax, ?
No
Threshold Xth is
reached, assign Nth = N
N = 1500
Estimate an S-curve using
throughput (Nj, Xj ) from
linear regression
N = 1500, 1600, 1700,
1800, 1900
0
100
200
300
400
500
600
700
0 1000 2000 3000 4000 5000
Th
rou
gh
pu
t (
pages
/sec
)
Loads
Actual Test Result
Mixed Mode
Load Extrapolation using Mixed Mode

13 Computer Measurement Group, India
What contributes to accuracy of Extrapolation?
Target and source may differ
– CPU configurations, # of cores, memory size and storage
Single user test on the target
– Captures impact of target architecture on the performance
– Captures basic application characteristics
Mixed Mode strategy on the target
o Does not use MVA algorithm
o Accurate prediction on throughput at high users
o Load dependent Service Demand (yet to incorporate)
14 Computer Measurement Group, India
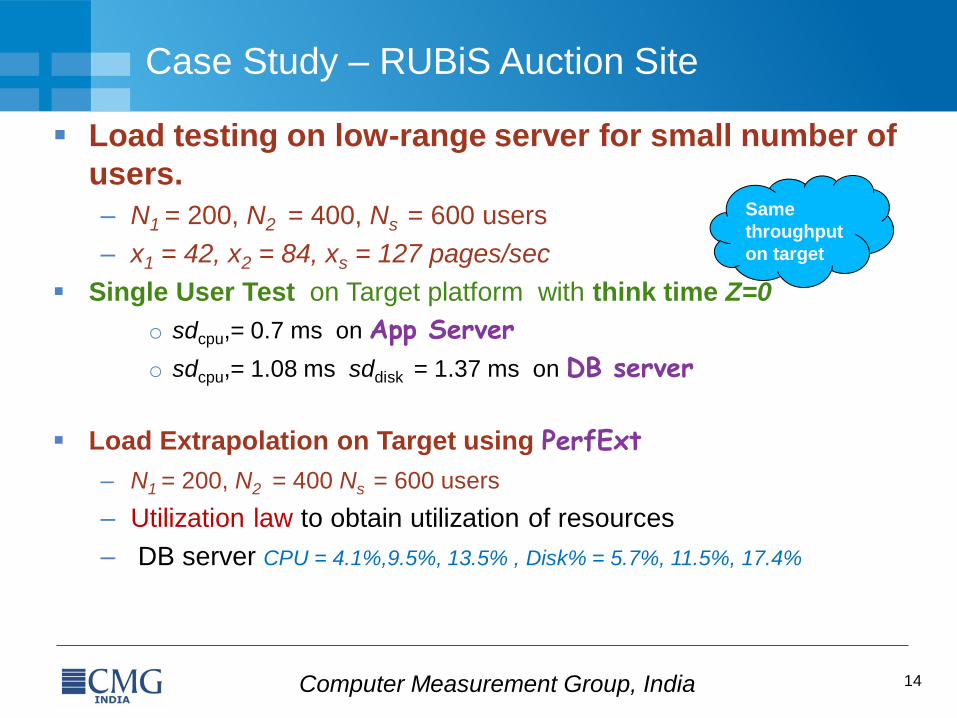
Case Study – RUBiS Auction Site
Load testing on low-range server for small number of
users.
– N1 = 200, N2 = 400, Ns = 600 users
– x1 = 42, x2 = 84, xs = 127 pages/sec
Single User Test on Target platform with think time Z=0
o sdcpu,= 0.7 ms on App Server
o sdcpu,= 1.08 ms sddisk = 1.37 ms on DB server
Load Extrapolation on Target using PerfExt
– N1 = 200, N2 = 400 Ns = 600 users
– Utilization law to obtain utilization of resources
– DB server CPU = 4.1%,9.5%, 13.5% , Disk% = 5.7%, 11.5%, 17.4%
Same
throughput
on target
15 Computer Measurement Group, India
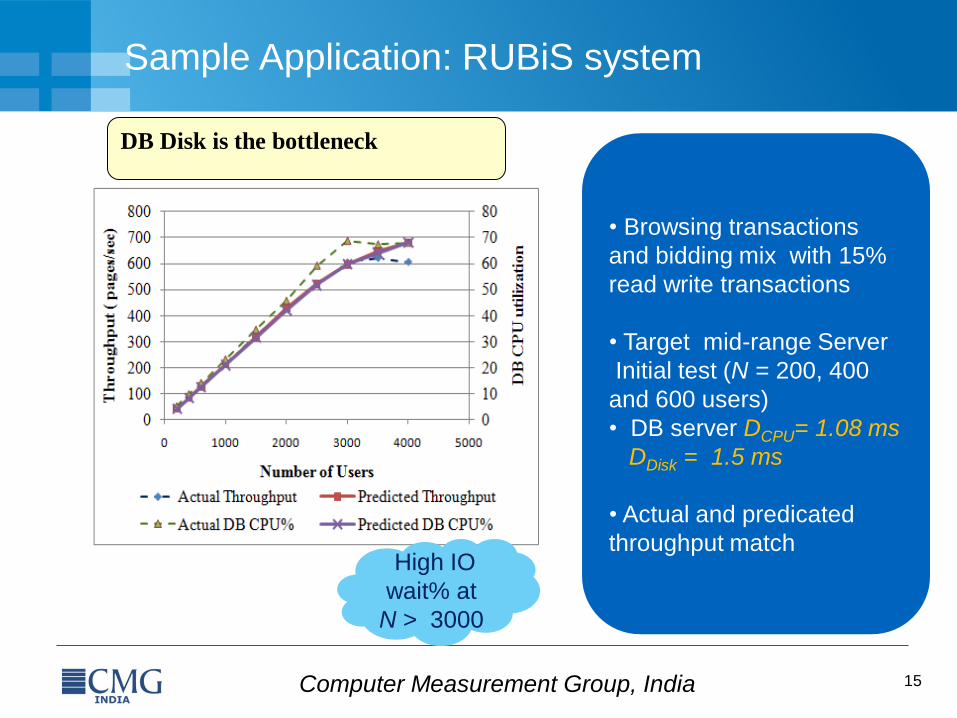
Sample Application: RUBiS system
• Browsing transactions
and bidding mix with 15%
read write transactions
• Target mid-range Server
Initial test (N = 200, 400
and 600 users)
• DB server DCPU= 1.08 ms
DDisk = 1.5 ms
• Actual and predicated
throughput match
DB Disk is the bottleneck
High IO
wait% at
N > 3000

16 Computer Measurement Group, India
Server Extrapolation on Sample Application:
JPetstore
• Predict on Mid-
range Server
• Initial test (N = 500,
700)
• Application service
demand on target:
CPU= 0 .83 ms
Disk = 0.94 ms
• Scales up-to 4000
users
• U% (pred) = 62.4%,
U% (actual) = 58%
• X (pred) = 704,
X(actual) = 650
pages/sec
17 Computer Measurement Group, India
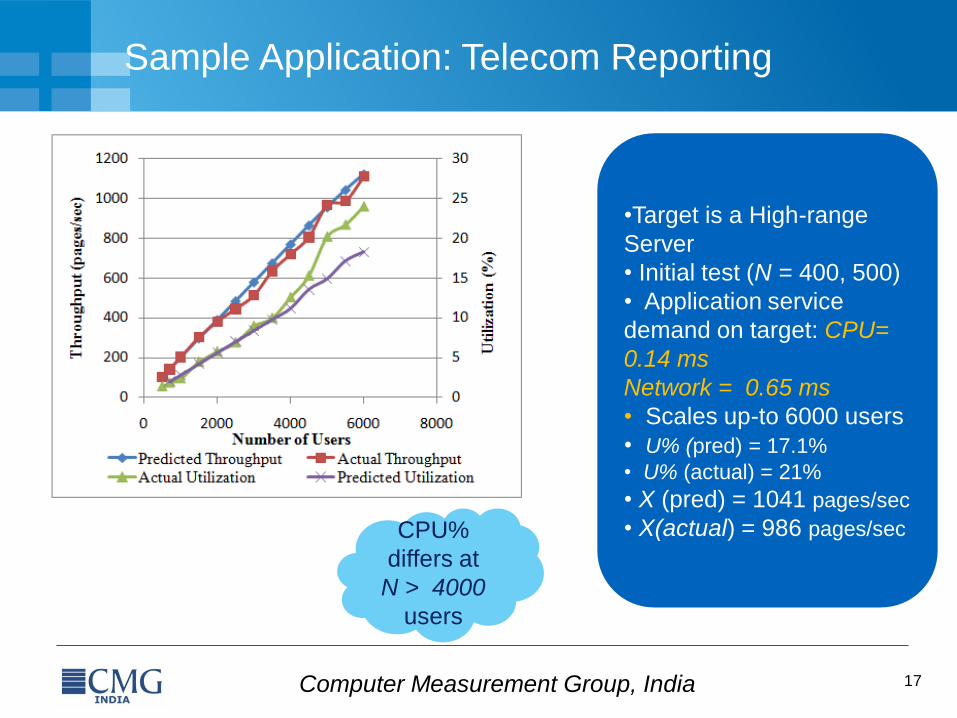
Sample Application: Telecom Reporting
•Target is a High-range
Server
• Initial test (N = 400, 500)
• Application service
demand on target: CPU=
0.14 ms
Network = 0.65 ms
• Scales up-to 6000 users
• U% (pred) = 17.1%
• U% (actual) = 21%
• X (pred) = 1041 pages/sec
• X(actual) = 986 pages/sec CPU%
differs at
N > 4000
users

18 Computer Measurement Group, India
Sample Application: Telecom Reporting
• Extrapolated using
Little’s Law
• N= 6000 users,
response time increases
rapidly
• Actual and predicated
response time follow the
same trend
• R(pred) = 0.45 sec
• R(actual) = 0.3 sec
Actual vs. Predicted Response time
19 Computer Measurement Group, India
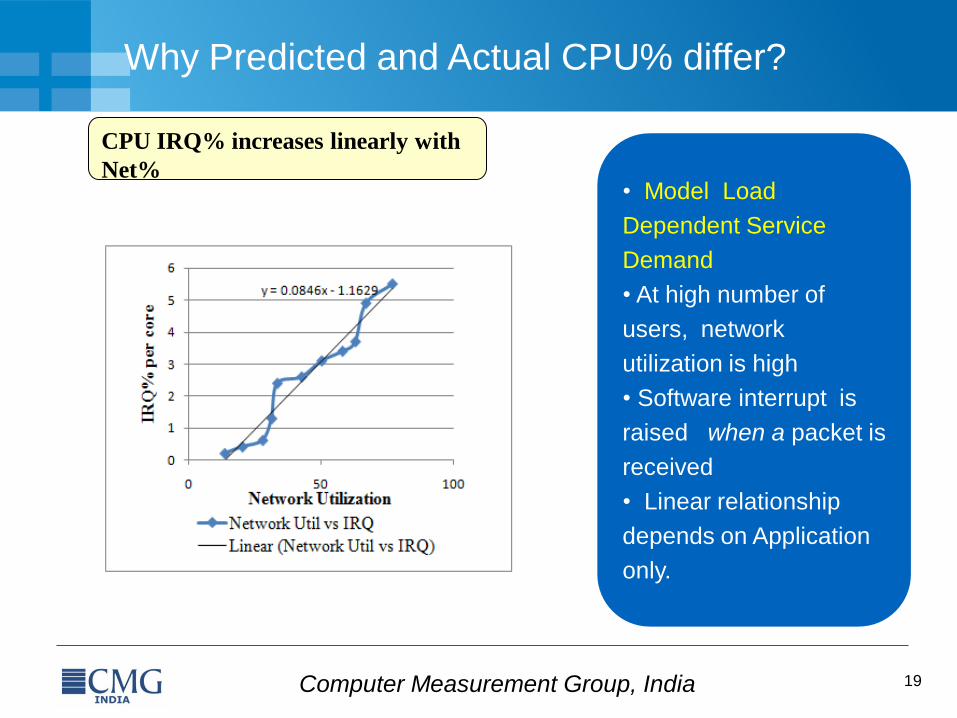
Why Predicted and Actual CPU% differ?
• Model Load
Dependent Service
Demand
• At high number of
users, network
utilization is high
• Software interrupt is
raised when a packet is
received
• Linear relationship
depends on Application
only.
CPU IRQ% increases linearly with
Net%

20 Computer Measurement Group, India
Limitations of the current strategy
Running Single user test on Production Environment
Alternatives..
– obtain resource consumption by running Micro-benchmarks
– Use a number of micro-benchmarks to characterize application
Good for Online Applications
o Throughput, Response time are main input values
Not tested for Open Systems and Batch Jobs
Not Capacity Planning tool

21 Computer Measurement Group, India
Related Work
Simulation tool [ARSH1996]
Gather trace for Parallel Programs [MALO1995] and run on a trace-
driven simulator
Build analytical model for Specific Applications [GIMA2004,
KOU2003]
Architecture simulator [YOUR2007] if target environment not
available
Build Performance Model and predict performance
– METASIM [CARR2003] convolves application signature and machine
profile
– [MARI2004] Gather architecture neutral characteristics and map to
different architecture for Cross-architecture performance prediction
22 Computer Measurement Group, India
Conclusions
Extrapolation strategy from test to production
Load test small number of users on the test, followed by
single user test on the production
Load Extrapolation strategy for smaller to larger load
High Accuracy for a number of Sample applications
Future Work: Characterize an application and Predict performance without
single user test on the target

23 Computer Measurement Group, India
References
[ARSH1996] H. Arsham, "Performance Extrapolation in Discrete-event Systems Simulation," Int. Journal
of Systems Science, vol. 27, no. 9, 1996 pp. 863-869.
[MALO1995] A.D. Malony and K. Shanmugam, "Performance extrapolation of parallel programs," in
Proc. of Int. Conf. on Parallel Processing, 1995, pp. 117-120.
[GIMA2004] R. Gimarc, A Spellmann, and J. Reynolds, "Moving Beyond Test and Guess - Using
modeling with load testing to improve web application readiness," in Computer Measurement Group's
Conference, 2004, pp 429-444.
[KOUN2003] S. Kounev and A. Buchmann, "Performance Modeling and evaluation of large-scale J2EE
applications," in Computer Measurement Group's Conference, 2003, pp 273-284. [DUTT2012] Subhasri Duttagupta and Rupinder Virk, "PerfExt: Performance Extrapolation Tool," in Proc.
of Int. Conf on Computational Intelligence, Modeling and Simulation, CIMSIM, 2012.
[YOUR2007] Matt T. Yourst, "PTLsim: A Cycle Accurate Full System x86-64 Micro architectural
Simulator," in Proc. of Int. Symposium on Performance Analysis of Systems and Software, 2007.
[CARR2003] L. Carrington, A. Snavely, X. Gao, and N. Wolter, "A Performance Prediction Framework for
Scientific Applications," in Proc. of Int. Conf. on Computational Science Workshop on Performance
Modeling and Analysis, 2003.
[MARI2004] G. G. Marin and J. Mellor-Crummey, Cross-Architecture Performance Predictions for
Scientific Applications using Parameterized Models.: Proc. of ACM SIGMETRICS, 2004, pp 2-13.
24 Computer Measurement Group, India
Thank You


![EAS311 Benchmark Comparison of J2EE Application Servers Kashif Ahmed Sr. Consultant [PowerObjects] kashif@powerobjects.com (612) 339-3355.](https://static.fdocuments.in/doc/165x107/56649e225503460f94b0fdc5/eas311-benchmark-comparison-of-j2ee-application-servers-kashif-ahmed-sr-consultant.jpg)