Customer benchmark results for Oracle Database 10g on the ... · * In benchmark 1, the 4 HP...
16
Customer benchmark results for Oracle Database 10g on the HP StorageWorks Enterprise Virtual Array (EVA) 8000 Evaluating performance capabilities of the EVA for Decision Support Systems (DSS) and On-Line Transaction Processing (OLTP) applications using real customer data EVA XL for Oracle White Paper 1.0 Page 1 3/3/06
Transcript of Customer benchmark results for Oracle Database 10g on the ... · * In benchmark 1, the 4 HP...

Customer benchmark results for Oracle Database 10g on the HP StorageWorks Enterprise Virtual Array (EVA) 8000
Evaluating performance capabilities of the EVA for Decision Support Systems (DSS) and On-Line Transaction Processing (OLTP) applications using real customer data
EVA XL for Oracle White Paper 1.0 Page 1 3/3/06

2
Introduction In hundreds of enterprise applications around the world, Oracle databases are putting information to work—driving new innovation, delivering business intelligence, responding to customer needs. Huge volumes of information—much of it mission-critical—are demanded around the clock and with split-second responsiveness. As a result, the storage systems on which this information is stored must offer outstanding performance and availability. Yet today, more than ever, the pressure is on to reduce total cost of ownership in the data center.
HP understands these challenges, and delivers the ideal storage platform for Oracle databases with the new HP StorageWorks Enterprise Virtual Array (EVA) family. The HP StorageWorks EVA is proven in numerous benchmarks to provide outstanding performance and scalability for Oracle databases. Today, the EVA family—including the EVA 4000, EVA 6000, and EVA 8000—is extending this strong heritage. These powerful, versatile arrays offer:
• Storage consolidation and disaster recovery
• Simplification through virtualization
Support for HP-UX, Microsoft Windows, Linux, and more •
The EVA family is sized to meet a broad range of storage requirements in all tiers. These high-performance, high-capacity and high-availability “virtual” array platforms deliver the power and simplicity needed to respond to the changing demands of users, customers, and applications.
One of the distinctive features of the EVA 4000, EVA 6000, and EVA 8000 is the increased capacity available in a space-efficient, cost-effective platform. The table below provides an overview of platform capacity.
EVA 4000 (2C/4D) EVA 6000 (2C/8D) EVA 8000 (2C/12D) EVA 8000 (2C/18D)
4 disk enclosures
56 disks max 56 x 300 GB 10K = 16.8 TB 56 x 250 GB FATA = 14.0 TB 56 x 146 GB 15K = 7.8 TB
8 disk enclosures (with FC loop)
112 disks max 112 x 300 GB 10K = 33.6 TB 112 x 250 GB FATA = 28.0 TB 112 x 146 GB 15K = 15.7 TB
12 disk enclosures
168 disks max 168 x 300 GB 10K = 50.4 TB 168 x 250 GB FATA = 42.0 TB 168 x 146 GB 15K = 24.5 TB
18 disk enclosures (with expansion cabinet)
240 disks max 240 x 300 GB 10K = 72.0 TB 240 x 250 GB FATA = 60.0 TB 240 x 146 GB 15K = 35.0 TB
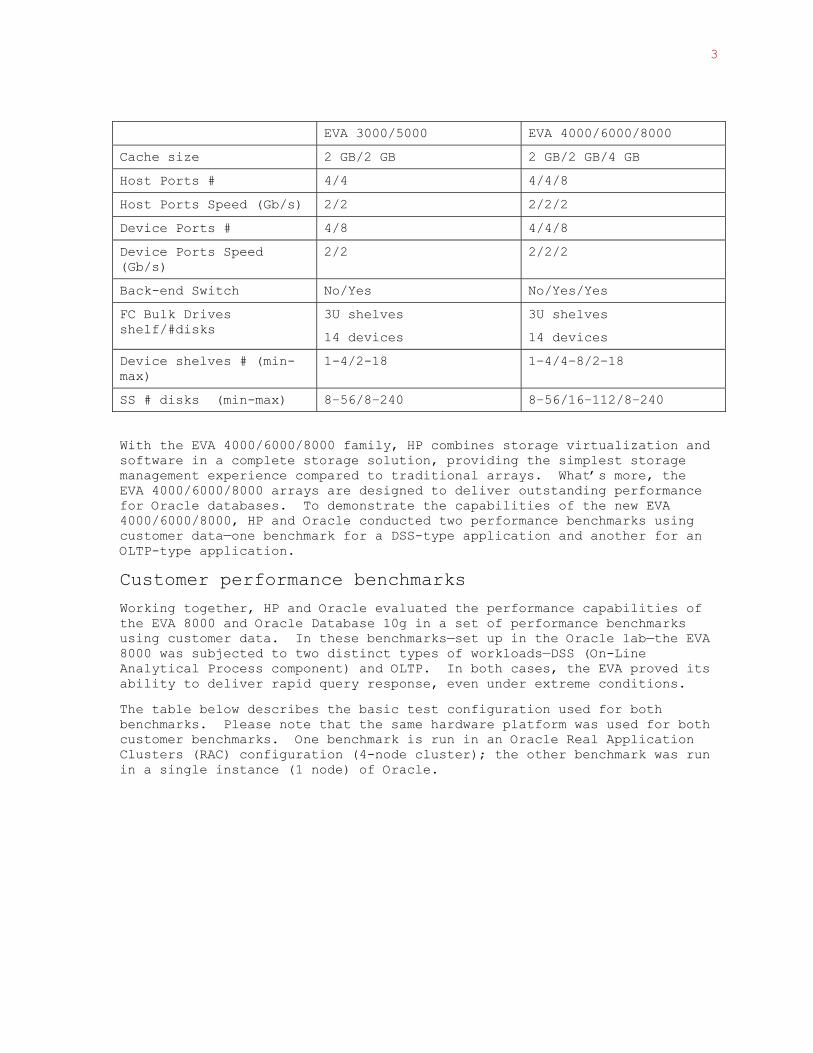
The new EVA 4000/6000/8000 family expands on the EVA 3000 and EVA 5000 arrays with additional configuration options to satisfy a broad range of application requirements. The table below illustrates the differences between the EVA 3000/5000 and the EVA 4000/6000/8000:
3
EVA 3000/5000 EVA 4000/6000/8000
Cache size 2 GB/2 GB 2 GB/2 GB/4 GB
Host Ports # 4/4 4/4/8
Host Ports Speed (Gb/s) 2/2 2/2/2
Device Ports # 4/8 4/4/8
Device Ports Speed (Gb/s)
2/2 2/2/2
Back-end Switch No/Yes No/Yes/Yes
FC Bulk Drives shelf/#disks
3U shelves
14 devices
3U shelves
14 devices
Device shelves # (min-max)
1-4/2-18 1–4/4–8/2–18
SS # disks (min-max) 8–56/8–240 8–56/16–112/8–240
With the EVA 4000/6000/8000 family, HP combines storage virtualization and software in a complete storage solution, providing the simplest storage management experience compared to traditional arrays. What’s more, the EVA 4000/6000/8000 arrays are designed to deliver outstanding performance for Oracle databases. To demonstrate the capabilities of the new EVA 4000/6000/8000, HP and Oracle conducted two performance benchmarks using customer data—one benchmark for a DSS-type application and another for an OLTP-type application.
Customer performance benchmarks
Working together, HP and Oracle evaluated the performance capabilities of the EVA 8000 and Oracle Database 10g in a set of performance benchmarks using customer data. In these benchmarks—set up in the Oracle lab—the EVA 8000 was subjected to two distinct types of workloads—DSS (On-Line Analytical Process component) and OLTP. In both cases, the EVA proved its ability to deliver rapid query response, even under extreme conditions.
The table below describes the basic test configuration used for both benchmarks. Please note that the same hardware platform was used for both customer benchmarks. One benchmark is run in an Oracle Real Application Clusters (RAC) configuration (4-node cluster); the other benchmark was run in a single instance (1 node) of Oracle.

4
System configurations
Database Server Storage Platform Array Configuration
• HP Integrity rx7620 server*
• HP-UX 11iv2
• 8 CPU 1.3GHz
• 32 GB RAM
• 4 dual port Fibre Channel (FC) Host Bus Adapters (8 FC connections per server)
• 4 Fibre Channel (FC)connections per host per EVA controller
• EVA 8000 (2C/18D)
• Array Firmware revision – 5020
• 240 – 72 GB 15K RPM disks – 240 disks for the Oracle database – 2 spares (virtual 144 GB of capacity available as part of the total 240 disks)
• RAID 1
• 2 Controllers – with 4 host ports each
• 2 GB cache per controller – 1 GB read – 1 GB write (512MB mirrored)
• 8 FC connections to the SAN switches
• 1 EVA Disk Group with 240 disks
• 2 – 500 GB LUNs per host port (16 total), using zoning
• LUNs alternately distributed between the 2 EVA controllers (8 LUNs per controller)
• Preferred path defined for each LUN
• LUN access through primary path only
• 4 2/16 SAN switches with zoning – 32 FC connections from the servers to the SAN for Benchmark 1 (4-node cluster)* 8 per switch – 8 FC connections from the server to the SAN for Benchmark 2 (using 1 node)** 2 per switch
* In benchmark 1, the 4 HP Integrity servers are configured in a 4-node Oracle Real Application Clusters (RAC). Each node has 8 FC ports connected to the SAN switch, for a total of 32 host port connections.
** In benchmark 2, the HP Integrity server is configured as a single instance database server (1 node) with 8 host port connections (2 per switch)
For these two customer benchmarks, both databases reside in one Volume Group within a single EVA Disk Group on the array. Please note: one Volume Group contains 16 Physical Volumes (PVs). The EVA Disk Group contains 16 LUNs. The details of each customer benchmark are described in the following sections.

5
Figure 1 below illustrates the hardware configuration used for both customer benchmarks.
Figure 1
Please note that this figure provides a logical view of the EVA 8000. In the actual customer benchmarks a single array was used (EVA8000 2C/18D).

6
Customer benchmark 1
Benchmark overview
The first benchmark test is based on a Decision Support Systems (DSS) application. The data used in this benchmark came from an actual customer application, providing a “real-world” example of how the EVA 8000 responds to high-intensity demands for rapid query response, as in an OLAP application. OLAP applications are defined as set of complex queries with fast response times. OLAP provides decision-makers with a multidimensional view of the data in Data Warehouses or Data Marts to help them quickly analyze the data and provide a better understanding of their business.
In this OLAP benchmark scenario, it is a daytime situation in which many concurrent users query the sales history in a retail operation. Over 30 of the most frequent types of queries are applied, chosen from hundreds of actual queries in the real customer application.
The table below provides details of the test environment.
Test environment
Database layout and configuration Workload
• 4- node RAC cluster
• Oracle Stripe And Mirror Everything (SAME) methodology
• 16 – 500 GB LUN (Created to host the two databases for both benchmarks 1 and 2)
• 1 Large Share Logical Volume Group (SLVM) – 63 LVM RAW devices 12 redo logs 36 data and index 8 undo 3 temp 1 system 1 sysaux 2 control file
• Data stripe size – 1MB
• Redo log stripe size - 128KB
• 32 KB Oracle block size
• 20 GB SGA
• Database size ~ 2TB
• Archiving turned off
• Asynchronous I/O turned on
• I/O and CPU intensive application
• 100% read
• 1MB I/O size
• Workload intensity – Medium Load – 128 users (42 users / server) – Heavy Load – 576 users (144 users / server)
• Max CPU utilization – Medium Load – 49 % – Heavy Load – 96 %
For this benchmark, the Oracle Database resides in one large Shared Logical Volume Manager (SLVM), configured in a 4-node RAC cluster. The workload scenario involves reads only, with different workload intensities to test the array under both typical and extreme conditions. As indicated, a very large number of users is tested, which pushed CPU utilization to nearly 100 percent.

7
Benchmark configuration
Details of the benchmark configuration are illustrated in Figure 2 below.
Figure 2
As shown, this benchmark was configured with a 4-node Oracle RAC cluster with HP ServiceGuard Extension for RAC (SGeRAC). Each server is configured with 4 dual port Host Bus Adapters (HBA), 2 Fibre Channel connections per SAN switch (total of 4 SAN switches) for a total of eight connections from any server to the entire SAN. The Oracle database is approximately 2 TB.
Please note: Previous benchmarks conduced by HP and Oracle established the optimal storage configuration for the EVA to achieve high throughput (see the references section). Therefore, only this optimal configuration was used in these customer benchmarks.
Test metrics
For this customer benchmark, the following metrics were set:
• Number of queries-per-minute – Average number of transactions-per-minute measured during the run under stable condition.
• Average query response time
• Database file sequential read – Wait event measured using the Oracle “statspack” tool. This metric generally indicates a single block read from the Oracle point of view.
• I/O throughput – Total number or physical reads-per-second measured using the Oracle “statspack” tool.

8
• I/O transfer rate – Defined as the amount of data transferred as the result of queries in MB/sec.
Test measurement process
The total test time was 40 minutes, which is based on the real-world customer scenario on which this benchmark was based. This particular customer did not have more than 40 minutes in which to get results. Therefore, the benchmark was designed to mirror this situation.
Prior to taking any measurements, the system was allowed to warm up for 10 minutes, followed by 30 minutes of active workload. This process was repeated four times in the course of the customer benchmark. In following this procedure, no discrepancies were found and consistent results were reached each time the workload was run.
Benchmark results
The results for medium and heavy workloads across the 4-node cluster are presented below. As indicated in the following charts, the EVA 8000 can deliver high throughput in a stressed condition using real customer data. By generating this level of throughput under intense workload conditions, the benchmark proved successful and the overall results exceeded customer expectations.
Queries per minute (transactional throughput)

9
Average query response time
As shown, average query response time is within the typical range. What is important to note is that the EVA 8000 achieved these response times under extremely heavy load.
I/O throughput
I/O transfer rate

10
In the charts above, the transfer rate (MB/sec) and the I/O throughput (I/O per sec) are very close to the maximum array specification. Please note that the 30898 iops is for 32KB I/O.
Oracle read latency
This chart indicates the time required to read a block (32KB) from the Oracle database (disk access) under both medium and heavy loads.
CPU utilization
As indicated earlier, under heavy load, CPU utilization approached 100 percent, which accounts for why the benchmark did not reach the maximum transfer rate and I/O throughput that the array can deliver. This fact led HP and Oracle to couple this customer benchmark with a Full Table Scan Test described below.
Full table scan test
Because the customer benchmark configuration was bound by the limitations of the CPU, HP and Oracle ran an additional test that would also stress the array, but without the CPU limitation. Therefore, in addition to the benchmark using customer data, HP and Oracle issued a full table scan against the database, which resulted in a transfer rate that came very close to the maximum specified for the array: 1.2 GB/sec. In this case, the array reached a transfer rate of 1.1 GB/sec. The results of the full table scan are shown in the figure below.

11
When running Oracle, the EVA 8000 is expected to achieve an I/O transfer rate of at least 1 GB/sec. As shown, when the workload is not bound by CPU limitations, the EVA 8000 was actually able to achieve an I/O transfer rate of 1.1 GB/sec, delivering on the full potential of its performance capabilities.
Benchmark 1 results analysis
This benchmark stressed both the servers and the EVA 8000 array using real test data. Under heavy workload, the EVA 8000 was able to deliver outstanding performance. Also, as shown, if there is no limitation from the server, the array performed very near to its maximum specified level.
Customers running DSS applications with an EVA 8000 array configured as in this benchmark, should expect to achieve I/O transfer rates of 1 GB/sec. or greater.

12
Customer benchmark 2
Benchmark overview
The second customer benchmark test is based on an OLTP-type application. As in the first benchmark, the data used in this benchmark came from an actual customer application—in this case, an order entry application. This benchmark scenario provides a good indication of how the EVA 8000 performs for On-line Transaction Processing applications. Unlike typical OLTP applications, which may contain 60% reads and 40% writes, this customer application is comprised of 92 % reads.
The table below provides details of the test environment.
Test environment
Database layout and configuration Workload
• Stripe And Mirror Everything (SAME) methodology
• 16 – 500 GB LUN (Created to host the two databases for both benchmarks 1 and 2)
• 1 Large Share Logical Volume Group (SLVM) – 23 LVM RAW devices 3 redo logs 7 data and index 8 undo 1 temp 1 system 1 sysaux 2 control file
• Data stripe size – 1MB
• Redo log stripe size - 128KB
• 8 KB Oracle block size
• 50 MB SGA
• Database size ~ 50 GB
• Archiving turned off
• Asynchronous I/O turned on
• I/O and CPU intensive application
• 92% read
• 8% random write
• 8 KB I/O size
• Workload intensity – Light load – 16 users – Medium Load – 32 users – Heavy Load – 128 users
• Max CPU utilization – Light Load – 19% – Medium Load – 40 % – Heavy Load – 99 %
The workload scenario involves primarily reads (92%), with few writes (8%) run across a single server. Three different workload intensities were applied to test the array under a variety of conditions.
Again in this benchmark, the test data resides in one large volume group. This volume group holds the data for customer benchmarks 1 and 2. While the Oracle database is relatively small, at 50 GB, a large volume group was used. Even though the database was small and could easily fit on a single disk, a single disk would not be able to handle the I/O of this application. It is important to note that database size is not a factor in determining the number of disks required; that is, a small database does not indicate a small number of disks and low I/O demand.
Test metrics
For this benchmark test, the following metrics were set:

13
• Number of executes per second – number of SQL statements completed per second.
• Log file parallel write – Wait event measured using oracle tool “statspack”. Indicates log file write latency
• Database file sequential read – Wait event measured using the Oracle “statspack” tool. This metric generally indicates a single block read from the Oracle point of view.
• I/O throughput – Total number or physical reads and writes-per-second measured using the Oracle “statspack” tool.
Test results
Transactional throughput
As illustrated above, transactional throughput in this set of tests was very linear, with increasing throughput as the number of users increases. This is a well scaling benchmark limited only by CPU utilization, as shown below.
CPU utilization

14
This benchmark pushed the CPU to its limits to measure the impact on transactional throughput and I/O throughput.
I/O throughput
Despite pushing the CPU to its limits, the benchmark did not stress the EVA. The level of I/O throughput achieved in this benchmark would not have been possible from a single disk drive. In this case, the EVA 8000 achieved greater than 16,000 I/O per second, while a single disk drive can support only as much as 200 I/O per second for small I/O size. Therefore, it is clear that, although a database is small, capacity is not the only factor to consider. Multiple disk drives may be needed to fulfill the I/O demand of the application.
Oracle read latency
With a 50 GB database spread across 240 disk drives, only a very small amount of data will reside on each drive. As a result, there is very little disk movement, resulting in very short read latency.
15
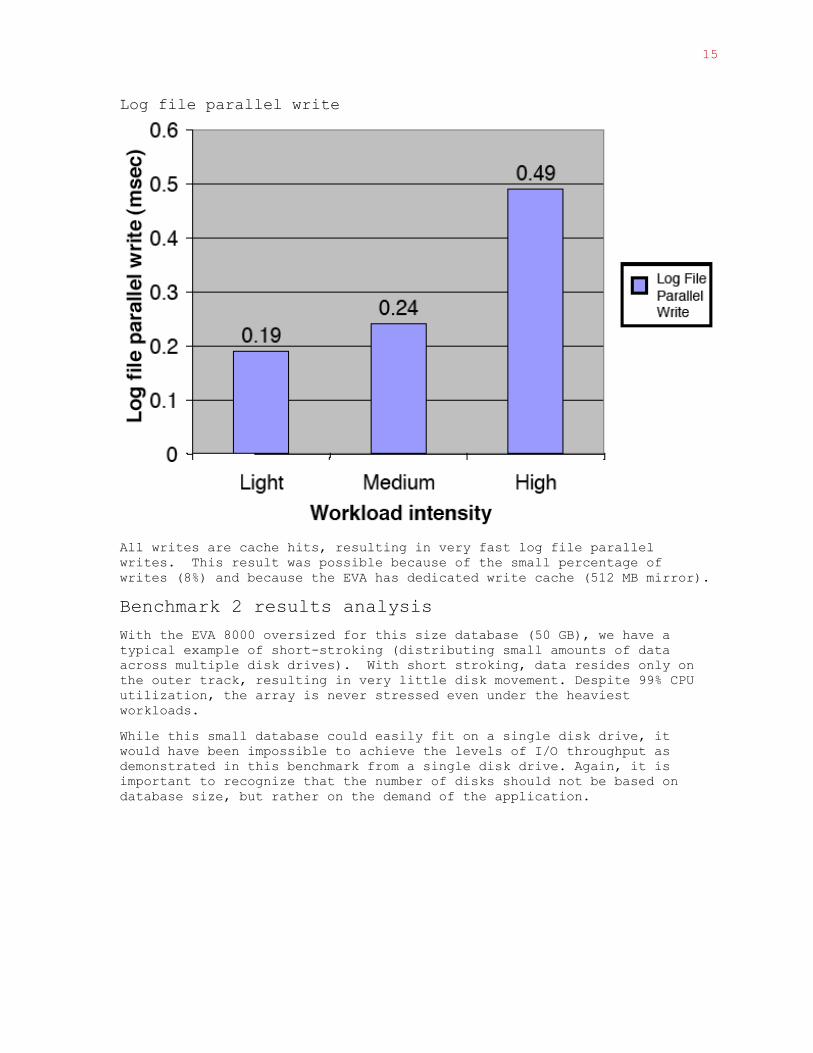
Log file parallel write
All writes are cache hits, resulting in very fast log file parallel writes. This result was possible because of the small percentage of writes (8%) and because the EVA has dedicated write cache (512 MB mirror).
Benchmark 2 results analysis
With the EVA 8000 oversized for this size database (50 GB), we have a typical example of short-stroking (distributing small amounts of data across multiple disk drives). With short stroking, data resides only on the outer track, resulting in very little disk movement. Despite 99% CPU utilization, the array is never stressed even under the heaviest workloads.
While this small database could easily fit on a single disk drive, it would have been impossible to achieve the levels of I/O throughput as demonstrated in this benchmark from a single disk drive. Again, it is important to recognize that the number of disks should not be based on database size, but rather on the demand of the application.

16
Conclusion With increasing demand on Oracle DBAs to deliver greater performance at lower total cost of ownership, it is essential to have a highly efficient and versatile storage platform. As we have seen in this set of tests, the HP StorageWorks EVA 8000 provides excellent performance results, even under heavy workloads.
For DSS and OLTP applications using Oracle Database 10g, the HP StorageWorks EVA 8000 configured as illustrated in this white paper, provides the ideal platform to meet demanding customer application requirements.
References For more information, consult the following references:
HP storage
http://h18006.www1.hp.com/storage/arrayseva.html
Oracle Technology Network
http://otn.oracle.com/deploy/performance/pdf/opt_storage_conf.pdf
Oracle technical white papers
http://technet.oracle.com/deploy/availability/techlisting.html - DS
Authors: Baila Ndiaye, Kotaro Ono, Dai Sakatani
Acknowledgement: Mai Cutler, Herve Lejeune, Umesh pathak
© 2006 Hewlett-Packard Company
All rights reserved.
HP and the HP logo are trademarks of the Hewlett-Packard Company.
Oracle is a registered trademark of Oracle Corporation and/or its affiliates.
All other product names mentioned herein may be trademarks or registered trademarks of their respective companies.
Technical information in this document is subject to change without notice.
Reproduction, adaptation, or translation without prior written permission is prohibited, except as allowed under copyright laws.
[P/N], February 2006