Performance Evaluation of Environmentally Degradable ...
75
Contractor’s Report to the Board Performance Evaluation of Environmentally Degradable Plastic Packaging and Disposable Food Service Ware - Final Report June 2007 Produced under contract by: California State University Chico Research Foundation
Transcript of Performance Evaluation of Environmentally Degradable ...
Contractor’s Report to the Board
Performance Evaluation of Environmentally Degradable Plastic Packaging and Disposable Food Service Ware - Final Report
June 2007
Produced under contract by:
California State University
Chico Research Foundation

ii
iii
Disclaimer: This report to the Board was produced under contract by California State University
Chico Research Foundation. The statements and conclusions contained in this report are those of
the contractor and not necessarily those of the California Integrated Waste Management Board, its
employees, or the State of California and should not be cited or quoted as official Board policy or
direction.
The State makes no warranty, expressed or implied, and assumes no liability for the information
contained in the succeeding text. Any mention of commercial products or processes shall not be
construed as an endorsement of such products or processes.
S T A T E O F C A L I F O R N I A
Arnold Schwarzenegger
Governor
Linda S. Adams
Secretary, California Environmental Protection Agency
INTEGRATED WASTE MANAGEMENT BOARD
Margo Reid Brown
Board Chair Rosalie Mulé
Board Member Wesley Chesbro
Board Member
Gary Petersen Board Member
Jeffrey Danzinger
Board Member Cheryl Peace
Board Member
Mark Leary
Executive Director
For additional copies of this publication, contact:
Integrated Waste Management Board Public Affairs Office, Publications Clearinghouse (MS 6)
1001 I Street P.O. Box 4025
Sacramento, CA 95812-4025 www.ciwmb.ca.gov/Publications/
1-800-CA-WASTE (California only) or (916) 341-6306
Publication #432-08-001
Copies of this document originally provided by CIWMB were printed on recycled paper containing 100 percent post-consumer fiber.
Copyright © 2007 by the California Integrated Waste Management Board. All rights reserved. This publication, or parts thereof, may not be reproduced in any form without permission.
Prepared as part of contract number IWM04072, $250,000
The California Integrated Waste Management Board (CIWMB) does not discriminate on the basis of disability in access to its programs. CIWMB publications are available in accessible formats upon request by calling the Public Affairs Office at (916) 341-6300. Persons with hearing impairments can reach the CIWMB
through the California Relay Service, 1-800-735-2929.
iv
Table of Contents Acknowledgements ......................................................................................................................... 2
Executive Summary ........................................................................................................................ 3
Introduction ..................................................................................................................................... 5
Background Information ................................................................................................................. 6
Conventional Plastics ................................................................................................................ 6
Biodegradable Plastics .............................................................................................................. 6
Compostable Plastics ................................................................................................................ 7
Degradable Plastic Products ............................................................................................................ 8
Life Cycle Assessment of Biodegradable and Conventional Plastics ........................................... 13
Current Standards for Biodegradable Plastics ............................................................................... 15
United States ........................................................................................................................... 15
Europe ..................................................................................................................................... 16
ISO .......................................................................................................................................... 16
Australia .................................................................................................................................. 16
Japan ....................................................................................................................................... 17
Biodegradable and Compostable Plastic Costs ............................................................................. 18
Case Study of Costs at CSU Chico ......................................................................................... 18
Degradation, Residuals, Toxicity, and Safety of Degradable Plastic ............................................ 21
Biodegradation Testing Plan ......................................................................................................... 24
Test Methods ........................................................................................................................... 24
Materials ................................................................................................................................. 25
Laboratory Tests ............................................................................................................................ 26
Test Procedures ....................................................................................................................... 26
Carbon Dioxide Concentration Results................................................................................... 28
Biodegradation Results ........................................................................................................... 29
Phytotoxicity Testing .............................................................................................................. 35
Heavy Metal Testing ............................................................................................................... 36
Marine Testing .............................................................................................................................. 38
Background ............................................................................................................................. 38
Test Procedures ....................................................................................................................... 38
Results ..................................................................................................................................... 39
Anaerobic Digestion ...................................................................................................................... 40
Materials ................................................................................................................................. 40
Test Procedures ....................................................................................................................... 40
Results ..................................................................................................................................... 41
Composting Environments ............................................................................................................ 44
City of Chico Municipal Compost Facility ............................................................................. 44
University Farm In-vessel Compost Facility .......................................................................... 45
Vacaville In-vessel Food-waste Compost Facility .................................................................. 46
v
Mariposa County In-vessel MSW Compost Facility .............................................................. 46
Contamination Effects of Degradable Plastics on Recycled Plastics ............................................ 48
Test Procedures ....................................................................................................................... 48
Results ..................................................................................................................................... 48
Conclusions and Recommendations .............................................................................................. 52
Appendices .................................................................................................................................... 53
Appendix A. Calculations ....................................................................................................... 53
Appendix B. Pictures of Samples at the CSU Chico Experimental Laboratory ..................... 55
Appendix C. Pictures of Samples at the CSU Chico Farm ..................................................... 59
Appendix D. Pictures of Samples at the City of Chico Municipal Compost Facility ............. 60
Appendix E. Pictures of Samples at the Vacaville In-vessel Compost Facility ...................... 62
Appendix F. Pictures of Samples at the Mariposa In-vessel Compost Facility ...................... 63
Appendix G. Experimental Protocol for Composting Sites .................................................... 64
Source Reference Notes .................................................................................................................. 1
List of Figures Figure 1. Laboratory experimental setup ....................................................................................... 27
Figure 2. CO2 ppm concentration of BioBag trash bag on day 21 ................................................ 28
Figure 3. Carbon conversion percentage for compost control alone ............................................. 30
Figure 4. Carbon conversion percentage for cellulose control ...................................................... 31
Figure 5. Carbon conversion percentage for Kraft paper control .................................................. 31
Figure 6. Carbon conversion percentage for polyethylene negative control ................................. 32
Figure 7. Carbon conversion percentage for corn based BioBag trash bag ................................... 32
Figure 8. Carbon conversion percentage for PLA straws .............................................................. 33
Figure 9. Carbon conversion percentage for sugar cane plate ....................................................... 33
Figure 10. Carbon conversion percentage for Mirel bag ............................................................... 34
Figure 11. Carbon conversion percentage for Ecoflex bag ........................................................... 34
Figure 12. Carbon conversion percentage for Oxodegradable bag ............................................... 35
Figure 13. Cumulative biogas production from anaerobic digestion ............................................ 42
Figure 14. Cumulative biogas production from anaerobic digestion ............................................ 42
Figure 15. Biogas yield at day 43 from anaerobic digestion ......................................................... 43
vi
List of Tables Table 1. Test results in six different composting environments. ..................................................... 4
Table 2. Production information for commercially available degradable plastics .......................... 9
Table 3. Certification information of commercially available degradable plastics ....................... 10
Table 4. Commercially available biodegradable and compostable polymers* ............................. 12
Table 5. Summary of key indicators from LCA studies ............................................................... 13
Table 6. Heavy metal limits in European and US Standards [] ...................................................... 16
Table 7. Costs for compostable food service items for CSU, Chico cafeteria .............................. 19
Table 8. Costs for conventional plastic food service items for CSU, Chico cafeteria................... 19
Table 9. Carbon content, and moisture percent for compostable samples .................................... 29
Table 10. Degradation rates for compostable samples .................................................................. 30
Table 11. Phytotoxicity of compost soil ........................................................................................ 36
Table 12. Characteristics of the substrates and sludge .................................................................. 41
Table 13. Quality test results for LDPE and HDPE with oxo- and bio-contamination ................. 50
Table 14. Mechanical test results for LDPE and HDPE with oxo- and bio-contamination .......... 51
Table 15. Mechanical tests results for LDPE and HDPE with oxo- and bio-contamination ......... 51
2
Acknowledgements
This report is the culmination of work from many people who represent many organizations. The author
would like to thank the following people and organizations for their help and advice:
The California Integrated Waste Management Board (CIWMB), who provided the funding for the
project.
The technical advisory board members for excellent comments and suggestions.
Messrs. Edgar Rojas and Mike Leaon of CIWMB for providing excellent input and technical
direction for the project.
The members of the advisory committee who provided excellent technical assistance throughout
the research. These members include: Dr. Robert Dorsey (Clorox), Mr. Lee Doty (Oxo Bio
Organization), Mr. Evan Edgar (Edgar Inc), Mr. Steve Mojo (BPI), Dr. Ramani Narayan (MSU),
and Dr. Robert Whitehouse (Metabolix Inc).
The author’s colleagues at California State University (CSU), Chico, for their expert help in
laboratory testing and experimental development; in particular, Dr. Cindy Daley, Mr. Tim
Devine, Dr. Randy Miller, and Mr. Don Sonnot.
The following students, who provided very thorough research support during the project: Bret
Bosma, Steven Foutes, Jonas Greminger, Nhu Huynh, Maisha Kamunde, Joel Klabo, Deepika
Nayyar, and Kate Taft.
Drs. Hamed El-Mashad and Ruihong Zhang from U.C. Davis for excellent collaboration on
anaerobic digestion.
The people and organizations in the waste management business for the opportunity to test the
degradable materials in commercial composting facilities, including: Dr. Fengyn Wang (NorCal
Waste Systems), Chris Taylor (NorCal Waste Systems), Mr. Greg Pryror (Jepson Prairie
Organics), Mr. Steve Engfer (Mariposa County Waste Management), and Mr. Dale Wangberg
(Waste Management Company, Chico Compost Facility).
Produced by CSU, Chico Research Foundation, under contract with CIWMB. Contacts are Mr. Edgar
Rojas (CIWMB, 916-341-6508) and Dr. Joseph Greene (CSU, Chico, 530-898-4977).
3
Executive Summary
As a way to conserve resources, reduce waste, and eliminate litter that harms marine life, the people of
California, green businesses, environmental organizations, and local governments are increasingly
interested in alternatives to the use of plastic bags and disposable food service ware. In response, a
growing number of manufacturers are offering plastic products and packaging which they claim will
decompose naturally in the environment or through composting. The growing presence of these new
plastics raises a number of important questions for consumers and policymakers.
In response, the California Integrated Waste Management Board (CIWMB) contracted with California
State University (CSU), Chico to study and report on the following:
The designed-use performance and compostability of commercially available products and
packaging that claim to be ―compostable‖ and ―degradable.‖
The degradability of several commercially available compostable plastics under laboratory
conditions.
How well degradable plastic products decompose in actual composting facilities and in a
simulated marine environment.
The potential for degradable plastics to contaminate conventional recycled plastics.
Test Products and Facilities
The researchers tested several commercially available degradable plastic products in six different
composting environments and a simulated marine environment. The composting environments included a
laboratory and actual facilities composting greenwaste, cow manure and straw, food waste, municipal
solid waste, and an enclosed ―in-vessel‖ facility in the absence of oxygen. The possible effects of
contamination were examined by chemically and mechanically testing molded blends of degradable
plastics and recycled plastics.
Research Results
The following results are based on the experimental conditions described in this report:
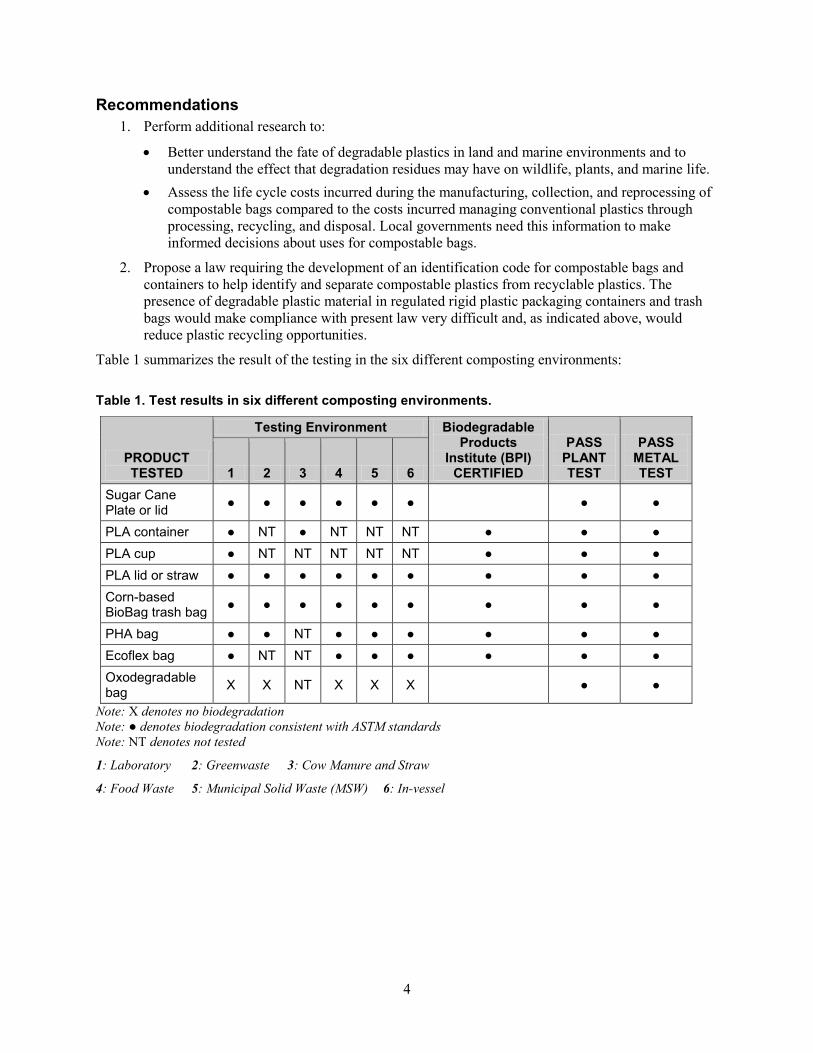
1. All of the products tested, except those that degrade in sunlight or oxygen, disintegrated
satisfactorily in commercial composting operations within 180 days. Specifically, a minimum of
60 percent of the organic carbon converted to carbon dioxide by the end of the test period. See
Table 1.
2. For all products, the measured amounts of lead and cadmium in finished compost were less than
one percent of maximum allowable levels.
3. The polylactic acid (PLA) straws, polyhydroxy alkanoate (PHA) bags, Ecoflex bags, sugar cane
plates and corn starch based trash bags released no toxic materials into the compost and
successfully supported the growth of tomato seedlings after ten days.
4. The PLA lids, PHA bags, Ecoflex bags, Husky bags and corn starch based trash bags degraded
completely in the enclosed ―in-vessel‖ composting facility. However, oxodegradable and uv-
degradable bags, low-density polyethylene (LDPE) plastic bags, sugar cane lids, and Kraft paper
did not degrade.
5. The PHA bags experienced some disintegration in ocean water; all the other products did not
disintegrate at all.
6. Biodegradable plastics and plastics that degrade in oxygen or sunlight reduce the quality and
impair the mechanical properties of finished products manufactured with recycled content.
4
Recommendations
1. Perform additional research to:
Better understand the fate of degradable plastics in land and marine environments and to
understand the effect that degradation residues may have on wildlife, plants, and marine life.
Assess the life cycle costs incurred during the manufacturing, collection, and reprocessing of
compostable bags compared to the costs incurred managing conventional plastics through
processing, recycling, and disposal. Local governments need this information to make
informed decisions about uses for compostable bags.
2. Propose a law requiring the development of an identification code for compostable bags and
containers to help identify and separate compostable plastics from recyclable plastics. The
presence of degradable plastic material in regulated rigid plastic packaging containers and trash
bags would make compliance with present law very difficult and, as indicated above, would
reduce plastic recycling opportunities.
Table 1 summarizes the result of the testing in the six different composting environments:
Table 1. Test results in six different composting environments.
PRODUCT TESTED
Testing Environment Biodegradable Products
Institute (BPI) CERTIFIED
PASS PLANT TEST
PASS METAL TEST 1 2 3 4 5 6
Sugar Cane Plate or lid
● ● ● ● ● ● ● ●
PLA container ● NT ● NT NT NT ● ● ●
PLA cup ● NT NT NT NT NT ● ● ●
PLA lid or straw ● ● ● ● ● ● ● ● ●
Corn-based BioBag trash bag
● ● ● ● ● ● ● ● ●
PHA bag ● ● NT ● ● ● ● ● ●
Ecoflex bag ● NT NT ● ● ● ● ● ●
Oxodegradable bag
X X NT X X X ● ●
Note: X denotes no biodegradation
Note: ● denotes biodegradation consistent with ASTM standards
Note: NT denotes not tested
1: Laboratory 2: Greenwaste 3: Cow Manure and Straw
4: Food Waste 5: Municipal Solid Waste (MSW) 6: In-vessel
5
Introduction
The California Integrated Waste Management Board (CIWMB) initiated a research program to evaluate
performance, degradation rates, and the environmental impact of degradable plastic packaging and food
service ware products in commercially operated compost facilities and in simulated marine environments.
The term ―degradable‖ encompasses products that are marketed as biodegradable, compostable,
photodegradable, oxodegradable, or degradable through other physical or chemical processes.
The Department of Mechanical Engineering, Mechatronic Engineering and Manufacturing Technology at
California State University, Chico, performed the research in the polymer technology laboratory. The
objectives of the research project were:
1. To evaluate the effectiveness of commercially available degradable plastic products on the basis
of intended use, degradability, toxicity, and cost.
2. Generate environmental safety assessments.
3. Assess the impact of degradable plastics on the plastics recycling stream.
4. Identify future research needs.
The project is broken down into four areas, including: a detailed work plan and budget, literature review,
testing for performance evaluation in full-scale composting and anaerobic digestion, and evaluation
report.
This research is the continuation of a previous research study that presented the results of biodegradation
testing on several compostable plastics that are commercially available in California. The research found
that the compostable materials degrade under laboratory compostable conditions as specified in ASTM
D6400. The past research project was an initial study of several common compostable plastic materials.
The research did not address other degradable products nor accelerated in-vessel composting methods.
6
Background Information
Conventional Plastics
Plastics can be produced from natural or synthetic materials. Traditional plastics, with an annual world
production of approximately 140 million tons [1]
, are typically made from petroleum-based products.
Alternatively, biobased polymers are produced from natural materials, e.g., starch from corn, potato,
tapioca, rice, wheat, etc.; oils from palm seed, linseed, soy bean, etc.; or fermentation products, like
polylactic acid (PLA), polyhydroxyalkanoate (PHA), and polyhydroxybutyrate (PHB).
Some petroleum-based products are considered biodegradable polymers since they are consumed by
microbes in the soil and biodegrade in compost environments. For example, aliphatic-aromatic co-
polyester polymers from BASF™ and -caprolactam are made from petroleum materials and are
consumed by microorganisms.
Most petroleum-based polymers are not biodegradable. However, additives can be blended that cause
them to behave similar to a biodegradable plastic by fragmenting in soil.
Petroleum-based plastics that have starch or degradable additives as a component are not biodegradable
since only the starch portion of the plastic is consumed by microbes in the soil. Prodegradant additives are
combined with polyethylene to produce an oxodegradable synthetic polymer that causes the plastic to
disintegrate into small fragments when exposed to oxygen. Similarly, photodegradable plastics have
additives that cause the plastic to disintegrate in sunlight.
The fragmented plastic leaves small pieces in the soil and may take many decades to fully disappear.
Additionally, since they are not consumed by microorganisms, they may cause considerable
environmental harm to animals if ingested.
Biodegradable Plastics
Biodegradability is defined as a process where all material fragments are consumed by microorganisms as
a food and energy source. Biodegradable polymers cannot have any residuals or by-products remaining.
The time period required for biodegradation is dependent upon the disposal system environment, which
can be landfill soil, aerobic compost, anaerobic digestion, or marine. Many types of biodegradable
polymers are available that degrade in a variety of environments, including landfill, sunlight, marine, or
compost. The three essential components of biodegradability are:
1. That the material is used as a food or energy source for microbes.
2. That a certain time period is necessary for the complete biodegradation.
3. That the material is completely consumed in the environment.
Most biobased materials are biodegradable, though some are not. For example, polyesters can be made
from soybean oil, but they are not biodegradable since the polymer is not consumed by microorganisms.
Polyurethane can be made by reacting organic alcohol with isocyanate, but it is not biodegradable since it
also is not consumed by microorganisms.
Definitions of biodegradable plastics are of utmost importance today. All plastic materials are degradable,
though the mechanism of degradation can vary. Most plastics will degrade through the breakage of
polymer chains when exposed to ultra violet (UV) light, oxygen, or high heat. Stabilizers are added to
polymers to prevent their breakdown in the sun, heat, and oxygen.
Biodegradation occurs when microorganisms break down the polymer chains by consuming the polymer
as a food source. Many plastics claim to be biodegradable yet are not completely consumed by
microorganisms, nor are they completely mineralized. Also, biodegradation does not specify a length of
7
time for the plastic to completely disappear. To be considered biodegradable should also mean that
degradation occurs in a reasonable time frame. Traditional petroleum-based plastic might degrade
completely in approximately 100 years. Thus, traditional plastics are not biodegradable. To be considered
biodegradable, a practical time span is usually one growing season or 180 days.
Biodegradable plastics can degrade in composting facilities and break down into water, methane, carbon
dioxide and biomass. Microorganisms in the soil or compost degrade the polymer in ways that can be
measured by standard tests over specified time-frames. Biodegradable plastic is defined according to the
American Society for Testing and Materials (ASTM) D6400 standard as a degradable plastic in which the
degradation results from the action of naturally occurring microorganisms such as bacteria, fungi, and
algae.
The key to understanding true biodegradability is to ensure that the plastic will behave like other organic
materials in the soil, i.e., like leaves and sticks. Organic materials completely disappear because they are a
food source for the organisms in the soil. With a good soil environment such as compost, which is about
60C and moist, organic materials will disappear within 180 days and not leave any small fragments or
residue. True biodegradable plastics should behave the same way and not leave any small pieces or
residue that might harm the soil.
The general effects degradable materials have on physical and chemical soil properties as well as on the
soil ecology were evaluated.[2]
The degradation of several biopolymers improved the soil quality, resulted
in no residue, and had a positive environmental effect. The biopolymers included starch-based, PHB,
PLA, polyester, and polyester copolymers. [3]
The ecotoxic effects of biodegradable polymers after
composting or degradation in soil or marine environments are rarely studied. Additional research is
needed in the future to study the environmental fate of degradable materials.
Compostable Plastics
―Compostable‖ is an even more accurate term than biodegradable. Compostable specifies that, in a proper
compost environment, the plastic not only completely biodegrades, but is also completely consumed in
180 days or less.
The ASTM D6400 standard defines compostable plastics as materials that undergo degradation by
biological processes during composting to yield carbon dioxide, water, inorganic compounds, and
biomass at a rate consistent with other known compostable materials and that leave no visible
distinguishable or toxic residue. If a degradable plastic does not meet these requirements, then it cannot
be labeled as ―compostable‖ in California. [4]
Compostable plastics can then be collected along with non-plastic compostable materials and sent to
composting facilities rather than landfills. Unfortunately, not all products marked as biodegradable are
also compostable. This compostable requirement can lead to confusing product labeling and a
misunderstanding of acceptable biodegradability.
Two independent organizations, the US Composting Council (USCC) and the Biodegradable Products
Institute (BPI), jointly established procedures to verify the compostability claims of biodegradable
products and created a ―compostable‖ logo to verify the compliance with ASTM D6400 compostability
standards.[5]
BPI, in conjunction with the USCC, performs product evaluations on every product awarded the
compostable logo. BPI provides important criteria for valid full-scale testing of compostable plastics. [6]
The BPI Logo Program is designed to certify plastic products that will biodegrade and compost
satisfactorily in actively managed compost facilities. To help consumers, BPI provides a list of certified
compostable products. The products include compostable bags and film, food service items, and resins.
8
Degradable Plastic Products
Many communities are interested in using biodegradable products to reduce the pollution caused by
lightweight plastic bags. For example, San Francisco is requiring the use of compostable or recyclable
bags in supermarkets, drugstores, and other retail stores. [7]
Similarly, the compost facility of the City of Hutchinson, MN, will collect greenwaste only in
biodegradable plastic bags. [8]
Biodegradable bags are delivered every four months to those who
participate in the curbside organics program. All types of organic materials can be placed in the
biodegradable bags, especially if the material is smelly, drippy, or might blow around in the wind. The
EcoGuard compost bag that Hutchinson distributes converts into carbon dioxide and water within a few
weeks after disposal.
In Europe, compostable plastic bags are available for use as supermarket carrier bags, ―knot‖ bags for
fruits and vegetables, kitchen waste bags, and garden waste sacks.[9]
Eastman Chemical opened an Eastar
Bio plant in the United Kingdom in 2002 with a production capacity of 33 million pounds per year. [10]
In 1999, the total polymer consumption for plastic bags and sacks in the European Union was on the order
of 2 to 2.5 million tons per year. The total consumption of all biodegradable polymer products in the
European Union was estimated to be 20,000 to 25,000 tons per year. [11]
Approximately 8,000 tons per
year of Novamont’s Master-Bi corn starch plastic bags are used. [12]
In Australia, biodegradable polymer materials are being used in grocery, retail, and compost industries as
bags for fruit, bait, bread, and ice.[13]
Australia uses the European standards for compostable and
biodegradable plastics certification. Biodegradable plastic bags are available in the local bottle-shop and
liquor stores. The environmentally friendly bags are made from Mater-Bi biodegradable plastic. In
Australia and Europe, Cadbury Chocolates of Australia has selected Plantic, a biodegradable polymer
from Plantic Technologies of Australia, for thermoformed trays that hold individual chocolates in their
box of chocolates. The compostable plastic material is made from starch.
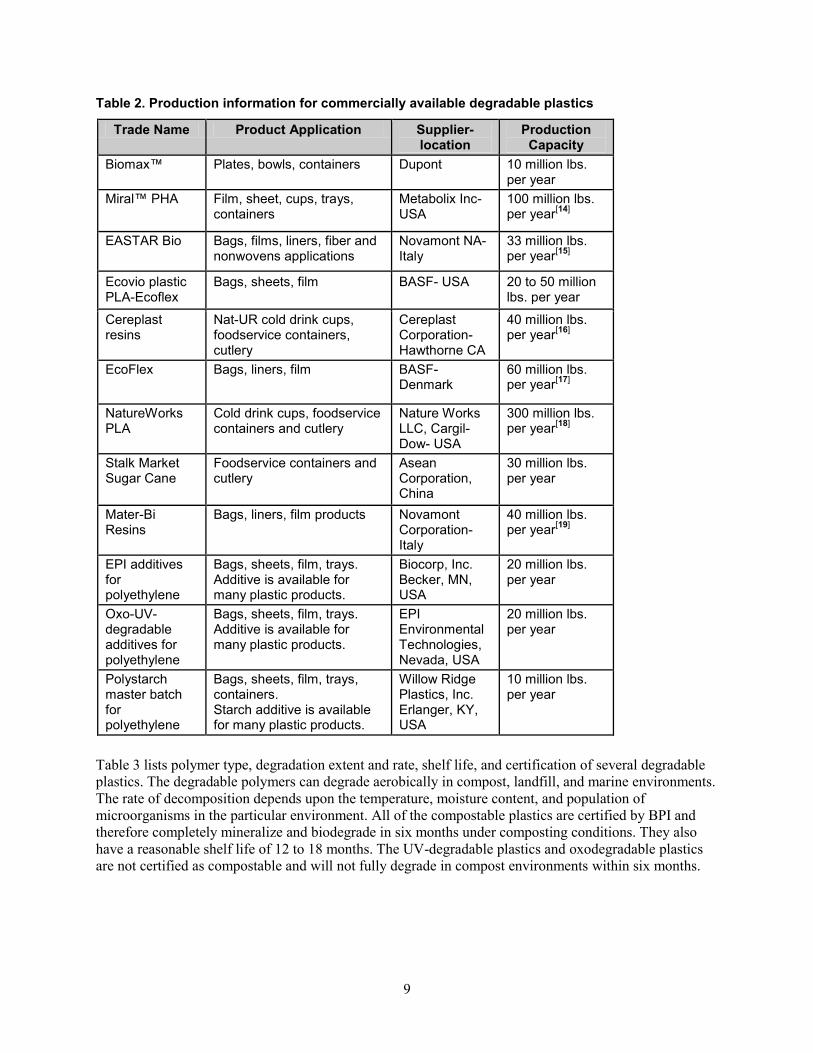
Table 2 lists the product applications, supplier information and production capacity of several
commercially available degradable plastics. The plastic products include biodegradable, compostable,
oxodegradable, and UV-degradable polymers.
Compostable products are produced in higher volumes every year. Many suppliers are expanding
production facilities to meet the increasing worldwide demand for true biodegradable or compostable
plastics. With several production plants in the world, the most common biodegradable plastic is PLA. It
has found success in rigid containers and cutlery. Mater-Bi starch based plastics are also used in many
applications worldwide and are expanding production capacities. Mater-Bi is most commonly used in
bag and film applications. Ecoflex® also is very successfully used for bag and film applications.
Unfortunately, several plastic products with prodegradant additives are sold throughout the world and
claim to be biodegradable when they clearly are not degraded by microorganisms. Likewise, polyethylene
plastics blended with starch are also produced worldwide and claim to be biodegradable, even though
only the starch portions of the plastic will biodegrade and disappear. The rest of the plastic will remain in
the soil for decades.
9
Table 2. Production information for commercially available degradable plastics
Trade Name Product Application Supplier-location
Production Capacity
Biomax™ Plates, bowls, containers Dupont 10 million lbs. per year
Miral™ PHA Film, sheet, cups, trays, containers
Metabolix Inc- USA
100 million lbs. per year
[14]
EASTAR Bio Bags, films, liners, fiber and nonwovens applications
Novamont NA- Italy
33 million lbs. per year
[15]
Ecovio plastic PLA-Ecoflex
Bags, sheets, film BASF- USA 20 to 50 million lbs. per year
Cereplast resins
Nat-UR cold drink cups, foodservice containers, cutlery
Cereplast Corporation- Hawthorne CA
40 million lbs. per year
[16]
EcoFlex Bags, liners, film BASF- Denmark
60 million lbs. per year
[17]
NatureWorks PLA
Cold drink cups, foodservice containers and cutlery
Nature Works LLC, Cargil-Dow- USA
300 million lbs. per year
[18]
Stalk Market Sugar Cane
Foodservice containers and cutlery
Asean Corporation, China
30 million lbs. per year
Mater-Bi Resins
Bags, liners, film products Novamont Corporation- Italy
40 million lbs. per year
[19]
EPI additives for polyethylene
Bags, sheets, film, trays. Additive is available for many plastic products.
Biocorp, Inc. Becker, MN, USA
20 million lbs. per year
Oxo-UV-degradable additives for polyethylene
Bags, sheets, film, trays. Additive is available for many plastic products.
EPI Environmental Technologies, Nevada, USA
20 million lbs. per year
Polystarch master batch for polyethylene
Bags, sheets, film, trays, containers. Starch additive is available for many plastic products.
Willow Ridge Plastics, Inc. Erlanger, KY, USA
10 million lbs. per year
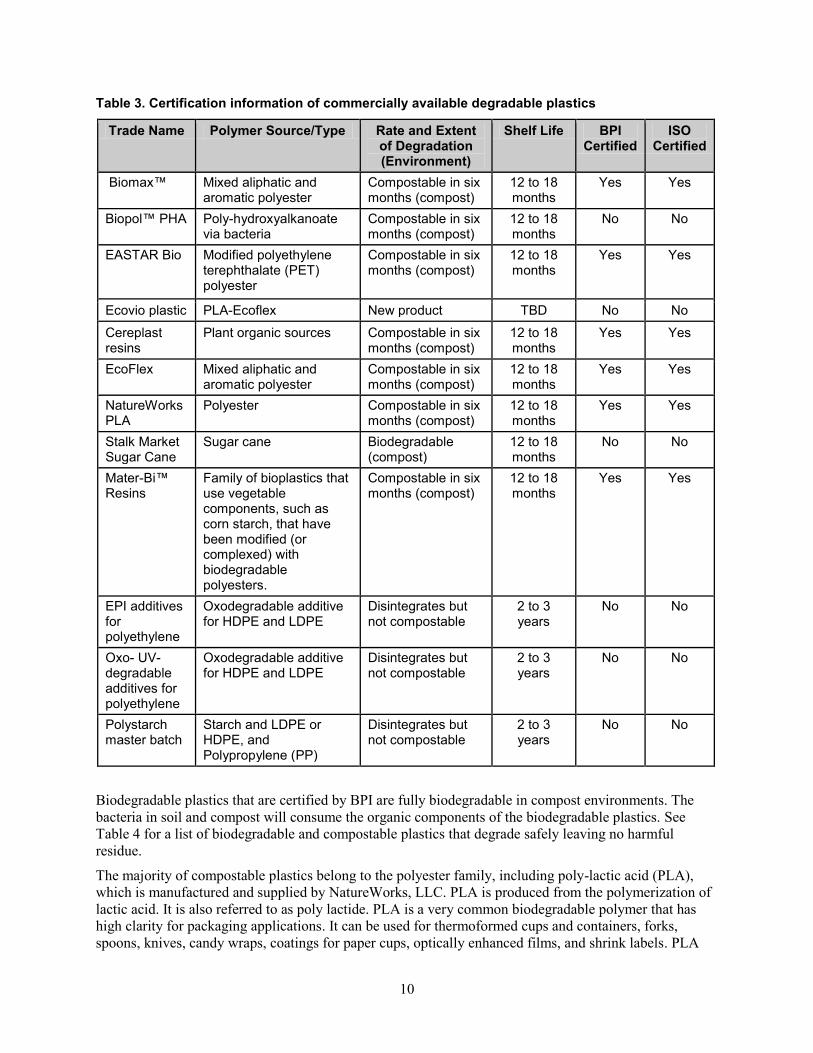
Table 3 lists polymer type, degradation extent and rate, shelf life, and certification of several degradable
plastics. The degradable polymers can degrade aerobically in compost, landfill, and marine environments.
The rate of decomposition depends upon the temperature, moisture content, and population of
microorganisms in the particular environment. All of the compostable plastics are certified by BPI and
therefore completely mineralize and biodegrade in six months under composting conditions. They also
have a reasonable shelf life of 12 to 18 months. The UV-degradable plastics and oxodegradable plastics
are not certified as compostable and will not fully degrade in compost environments within six months.
10
Table 3. Certification information of commercially available degradable plastics
Trade Name Polymer Source/Type Rate and Extent of Degradation (Environment)
Shelf Life BPI Certified
ISO Certified
Biomax™ Mixed aliphatic and aromatic polyester
Compostable in six months (compost)
12 to 18 months
Yes Yes
Biopol™ PHA Poly-hydroxyalkanoate via bacteria
Compostable in six months (compost)
12 to 18 months
No No
EASTAR Bio Modified polyethylene terephthalate (PET) polyester
Compostable in six months (compost)
12 to 18 months
Yes Yes
Ecovio plastic PLA-Ecoflex New product TBD No No
Cereplast resins
Plant organic sources Compostable in six months (compost)
12 to 18 months
Yes Yes
EcoFlex Mixed aliphatic and aromatic polyester
Compostable in six months (compost)
12 to 18 months
Yes Yes
NatureWorks PLA
Polyester Compostable in six months (compost)
12 to 18 months
Yes Yes
Stalk Market Sugar Cane
Sugar cane Biodegradable (compost)
12 to 18 months
No No
Mater-Bi™ Resins
Family of bioplastics that use vegetable components, such as corn starch, that have been modified (or complexed) with biodegradable polyesters.
Compostable in six months (compost)
12 to 18 months
Yes Yes
EPI additives for polyethylene
Oxodegradable additive for HDPE and LDPE
Disintegrates but not compostable
2 to 3 years
No No
Oxo- UV- degradable additives for polyethylene
Oxodegradable additive for HDPE and LDPE
Disintegrates but not compostable
2 to 3 years
No No
Polystarch master batch
Starch and LDPE or HDPE, and Polypropylene (PP)
Disintegrates but not compostable
2 to 3 years
No No
Biodegradable plastics that are certified by BPI are fully biodegradable in compost environments. The
bacteria in soil and compost will consume the organic components of the biodegradable plastics. See
Table 4 for a list of biodegradable and compostable plastics that degrade safely leaving no harmful
residue.
The majority of compostable plastics belong to the polyester family, including poly-lactic acid (PLA),
which is manufactured and supplied by NatureWorks, LLC. PLA is produced from the polymerization of
lactic acid. It is also referred to as poly lactide. PLA is a very common biodegradable polymer that has
high clarity for packaging applications. It can be used for thermoformed cups and containers, forks,
spoons, knives, candy wraps, coatings for paper cups, optically enhanced films, and shrink labels. PLA
11
plastics are the biodegradable plastics most commonly used by customers around the world. PLA has
applications in the United Sates, Europe, Japan, Australia, and other countries.
In 1999, Dow Chemical and Cargill created a joint venture, named Cargill Dow, LLC, to become the
largest biodegradable polylactic acid producer in the world with annual capacity of 140,000 tons per
year.[20]
In 2005, Dow and Cargill ended the partnership when Cargill purchased all of Dow Chemical’s
interests in Cargill Dow, LLC.
Some degradable products are made from synthetic polymers that have additives that will, over time,
cause disintegration in outside environments. EPI Environmental Technologies Incorporated provides
TDPA® (Totally Degradable Plastic Additive) for polyethylene and polypropylene manufacturers to
produce plastic bags, films, and products that degrade over time.[21]
This non-starch based additive uses
ultraviolet light and oxidation to break the polymer chains, resulting in a reduction of the plastic’s
molecular weight. The additive is for use in food contact applications. [22]
TDPA® additive technology
has been used in plastic products in North America, Europe, Asia, Australia, and New Zealand.
Oxodegradable plastics can leave small plastic fragments as residue after oxidation. When starch is added
to polyethylene and then degrades, a similar residue is left. Microorganisms in the soil digest the starch
that causes the plastic to break down into smaller pieces.
Starch-based polyethylene plastics are available at Willow Ridge Plastics Incorporated. The starch
master-batch products have been developed for use in blown film, injection molding and other
applications with polyethylene, polypropylene, and polystyrene plastics.[23]
In 1989, Mobil Company produced Hefty bags from polyethylene with a cornstarch additive. When
exposed to sunlight, the bags broke down into smaller plastic particles but did not degrade in landfills.[24]
The starch-polyethylene bags are not BPI certified and can cause serious environmental consequences as
fragments of polyethylene will be left in the soil after the starch biodegrades.
12
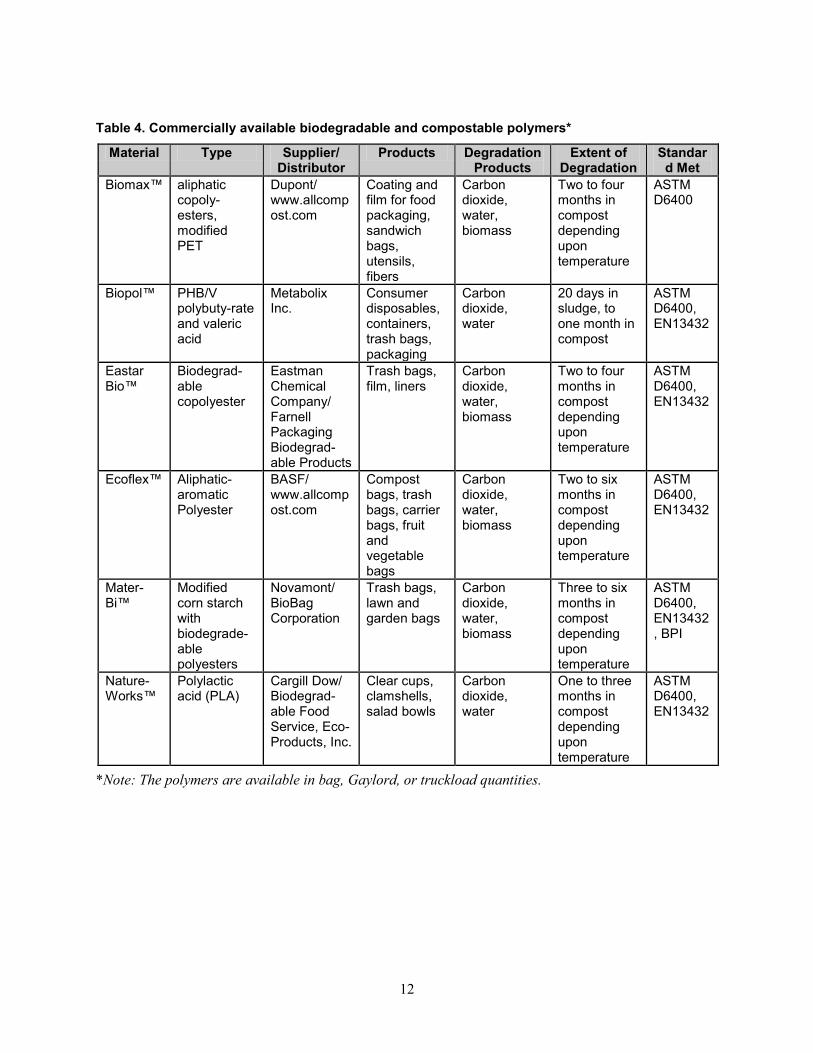
Table 4. Commercially available biodegradable and compostable polymers*
Material Type Supplier/ Distributor
Products Degradation Products
Extent of Degradation
Standard Met
Biomax™ aliphatic copoly-esters, modified PET
Dupont/ www.allcompost.com
Coating and film for food packaging, sandwich bags, utensils, fibers
Carbon dioxide, water, biomass
Two to four months in compost depending upon temperature
ASTM D6400
Biopol™ PHB/V polybuty-rate and valeric acid
Metabolix Inc.
Consumer disposables, containers, trash bags, packaging
Carbon dioxide, water
20 days in sludge, to one month in compost
ASTM D6400, EN13432
Eastar Bio™
Biodegrad-able copolyester
Eastman Chemical Company/ Farnell Packaging Biodegrad- able Products
Trash bags, film, liners
Carbon dioxide, water, biomass
Two to four months in compost depending upon temperature
ASTM D6400, EN13432
Ecoflex™ Aliphatic-aromatic Polyester
BASF/ www.allcompost.com
Compost bags, trash bags, carrier bags, fruit and vegetable bags
Carbon dioxide, water, biomass
Two to six months in compost depending upon temperature
ASTM D6400, EN13432
Mater-Bi™
Modified corn starch with biodegrade- able polyesters
Novamont/ BioBag Corporation
Trash bags, lawn and garden bags
Carbon dioxide, water, biomass
Three to six months in compost depending upon temperature
ASTM D6400, EN13432, BPI
Nature- Works™
Polylactic acid (PLA)
Cargill Dow/ Biodegrad- able Food Service, Eco-Products, Inc.
Clear cups, clamshells, salad bowls
Carbon dioxide, water
One to three months in compost depending upon temperature
ASTM D6400, EN13432
*Note: The polymers are available in bag, Gaylord, or truckload quantities.
13
Life Cycle Assessment of Biodegradable and Conventional Plastics
Environmental Life Cycle Assessment (LCA) is a method developed to evaluate the overall
environmental costs of using a particular material. LCA includes the inventory and measurement of
system inputs and outputs and then organizes and converts these into environmental themes or categories
relative to resource use, human health, and ecological areas.[25]
LCA consists of three stages:
1. Life cycle inventory
2. Life cycle impact assessment
3. Life cycle improvement [26]
The first stage inventory includes setting the goal and scope of the analysis, which determines the extent
of the work to be done and the procedures to be used. Additionally, the first stage includes measurement
of the inputs and outputs of a system, including all emissions on a volume or mass basis (e.g., kg of CO2,
kg of cadmium, cubic meter of solid waste).
The impact assessment, or interpretation stage, links the results from the inventory to potential
environmental problems.
And the third stage, life cycle improvement, suggests changes to reduce or eliminate any negative impacts
on the environment.
In the case of plastics, LCA reports all the inputs and outputs necessary to produce 1 kg of material
(polymer resin).
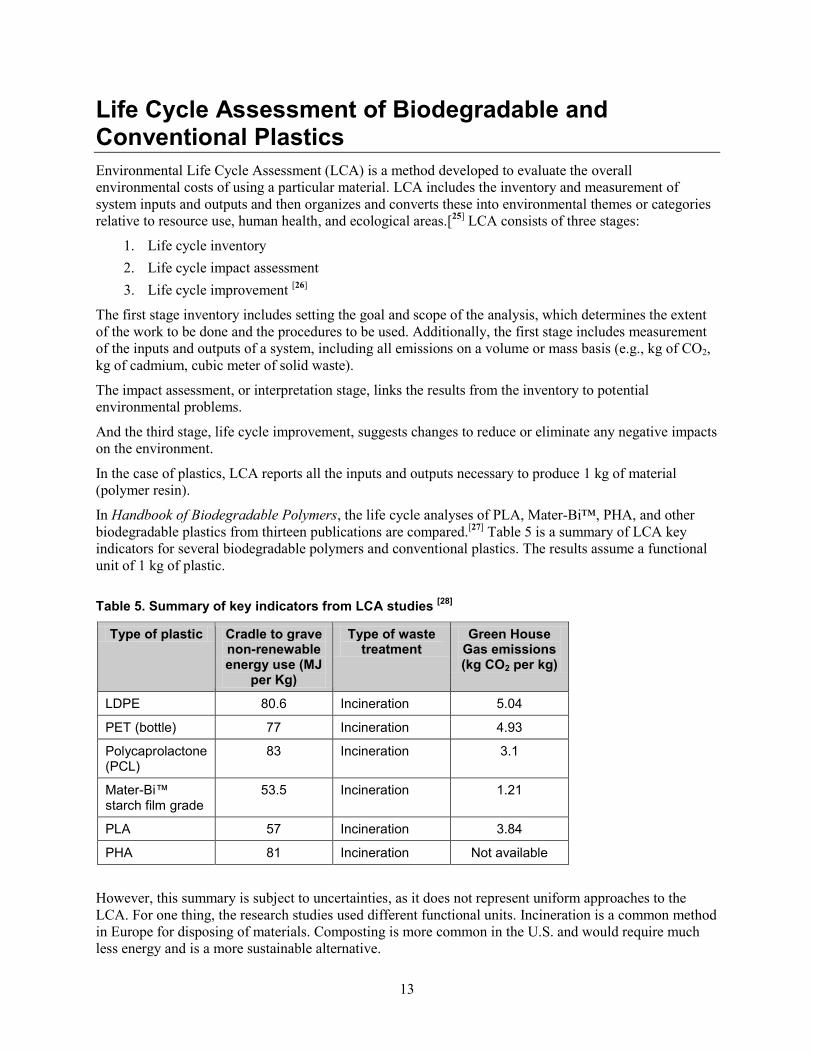
In Handbook of Biodegradable Polymers, the life cycle analyses of PLA, Mater-Bi™, PHA, and other
biodegradable plastics from thirteen publications are compared.[27]
Table 5 is a summary of LCA key
indicators for several biodegradable polymers and conventional plastics. The results assume a functional
unit of 1 kg of plastic.
Table 5. Summary of key indicators from LCA studies
[28]
Type of plastic Cradle to grave non-renewable energy use (MJ
per Kg)
Type of waste treatment
Green House Gas emissions (kg CO2 per kg)
LDPE 80.6 Incineration 5.04
PET (bottle) 77 Incineration 4.93
Polycaprolactone (PCL)
83 Incineration 3.1
Mater-Bi™ starch film grade
53.5 Incineration 1.21
PLA 57 Incineration 3.84
PHA 81 Incineration Not available
However, this summary is subject to uncertainties, as it does not represent uniform approaches to the
LCA. For one thing, the research studies used different functional units. Incineration is a common method
in Europe for disposing of materials. Composting is more common in the U.S. and would require much
less energy and is a more sustainable alternative.
14
Very little LCA research is available for composting solutions. The number of LCAs for biodegradable
polymers is limited. No comprehensive LCAs have been published for PLA (plant based), cellulose
polymers (plant based), or for petroleum-based biodegradable polymers such as Ecoflex.
A life cycle analysis of bags made of Mater-Bi™ showed that they can have a better environmental
impact than paper bags, and are comparable with bags made of polyethylene that are separated from the
waste and incinerated alone.[29]
NatureWorks®
polylactide
(PLA)
is a versatile polymer produced by Nature Works, LLC. [30]
NatureWorks®
polymer requires fewer fossil resources to manufacture and emits significantly less greenhouse gases than
most of the traditional plastics. The cradle-to-factory gate production process of NatureWorks® polymer
currently uses 62-68 percent less fossil fuel resources than the traditional plastic materials such as
polyethylene terephthalate (PET), polystyrene (PS), polypropylene (PP), high density polyethylene
(HDPE), and low density polyethylene (LDPE).[31]
15
Current Standards for Biodegradable Plastics
Several worldwide organizations are involved in setting standards for biodegradable and compostable
plastics, including: American Society for Testing and Materials (ASTM), European Committee for
Standardization (CEN), International Standards Organization (ISO), German Institute for Standardization
(DIN), Japanese Institute for Standardization (JIS), and British Plastics Federation. The standards set by
these organizations have helped the industry create biodegradable and compostable products that meet the
increasing worldwide demand for more environmentally friendly plastics. [32]
Germany, the United States, and Japan are cooperating in developing certification schemes to enable
international cross-certification of products, so that a product certified in one of these countries would
automatically be eligible for certification in another.
United States
In the US, ASTM D6400 is the accepted standard for evaluating compostable plastics. The ASTM D6400
standard specifies the procedures for certifying that compostable plastics will degrade in municipal and
industrial aerobic composting facilities over a 180-day time period.[33]
The standard establishes the
requirements for materials and product labeling, including packaging made from plastics, to be designated
as ―compostable in municipal and industrial composting facilities.‖ The standard determines if plastics
and products made from plastics will compost satisfactorily, including biodegrading at a rate comparable
to known compostable materials. The standards assure that the degradation of the materials will not
contaminate the compost site nor diminish the quality of the finished compost.
ASTM D6400 utilizes ASTM D6002 as a guide for assessing the compostability of environmentally
degradable plastics, in conjunction with ASTM D5338 to determine aerobic biodegradation under
controlled composting conditions. ASTM D6400 specifies that a satisfactory rate of biodegradation is the
conversion of 60 percent of the organic carbon in the plastic into carbon dioxide over a time period not
greater than 180 days. If a biodegradable polymer does not meet the requirements listed in ASTM D6400
or EN13433, then it is not considered compostable. It must degrade in the specified time frame without
leaving any residuals in the compost. [34]
In this research, ASTM D6400 was followed when testing the compostability of several rigid packaging
containers, bags, and cutlery that are made from biodegradable and compostable plastics.
Compostable plastics are being used safely in the United States with the help of a certification program
and the establishment of ASTM D6400 standards. BPI and the US Composting Council (USCC)
established the Compostable Logo program in the United States.[35]
The BPI certification demonstrates
that biodegradable plastic materials meet the specifications in ASTM D6400 and will biodegrade swiftly
and safely during municipal and commercial composting. Several degradable plastics, which are available
for composting, were certified ―compostable‖ in 2002. [36]
The ―compostable‖ logo helps consumers to
identify which products meet the ASTM D6400 standard. [37]
To ensure objectivity, verification of the
ASTM standard is accomplished through an independent third-party consultant selected by the
manufacturer.
Biodegradation of biodegradable plastics in marine environment is based upon ASTM D6691 and ASTM
D7081. ASTM D6691 is a test method for determining aerobic biodegradation of plastic materials by a
defined microbial consortium in the marine environment. ASTM D7081 is a standard specification for
non-floating biodegradable plastics in marine environments. Both standards also require measuring the
amount of CO2 generated during the degradation process. A test sample demonstrates satisfactory
biodegradation if after 180 days, 30 percent or more of the sample is converted to carbon dioxide.
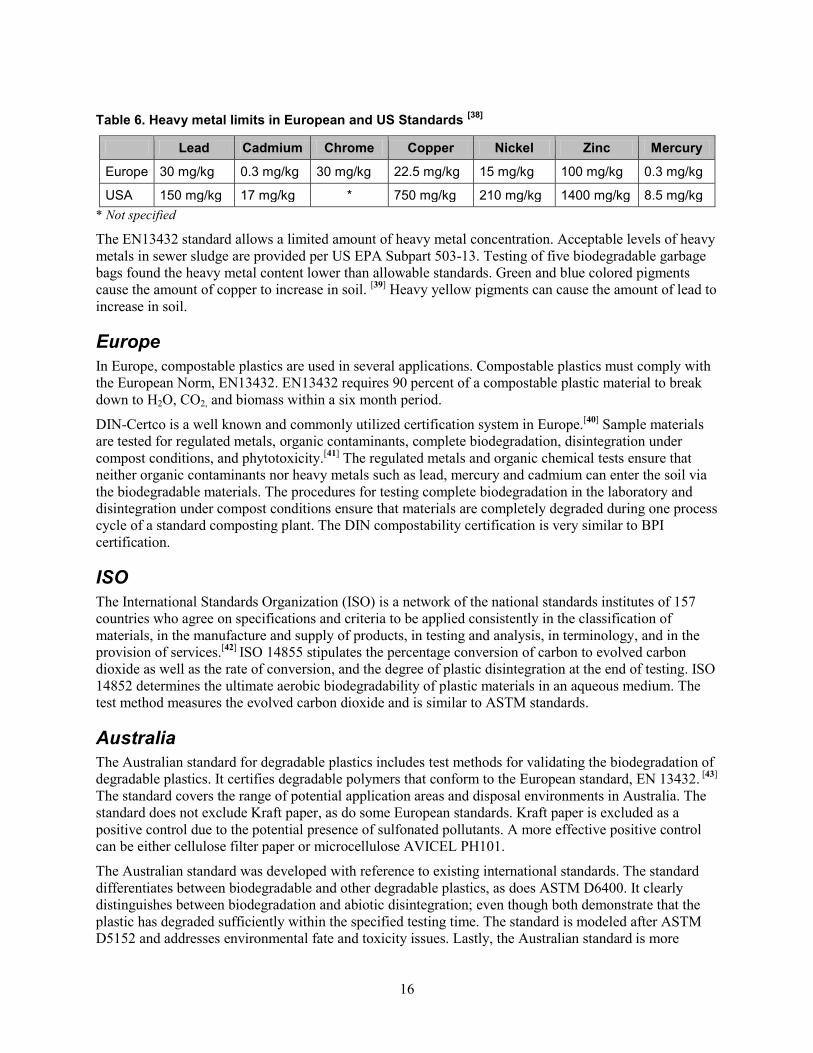
As shown in Table 8, the heavy metal limits in the European standard are more stringent that those listed
in the US standards.
16
Table 6. Heavy metal limits in European and US Standards
[38]
Lead Cadmium Chrome Copper Nickel Zinc Mercury
Europe 30 mg/kg 0.3 mg/kg 30 mg/kg 22.5 mg/kg 15 mg/kg 100 mg/kg 0.3 mg/kg
USA 150 mg/kg 17 mg/kg * 750 mg/kg 210 mg/kg 1400 mg/kg 8.5 mg/kg
* Not specified
The EN13432 standard allows a limited amount of heavy metal concentration. Acceptable levels of heavy
metals in sewer sludge are provided per US EPA Subpart 503-13. Testing of five biodegradable garbage
bags found the heavy metal content lower than allowable standards. Green and blue colored pigments
cause the amount of copper to increase in soil. [39]
Heavy yellow pigments can cause the amount of lead to
increase in soil.
Europe
In Europe, compostable plastics are used in several applications. Compostable plastics must comply with
the European Norm, EN13432. EN13432 requires 90 percent of a compostable plastic material to break
down to H2O, CO2, and biomass within a six month period.
DIN-Certco is a well known and commonly utilized certification system in Europe.[40]
Sample materials
are tested for regulated metals, organic contaminants, complete biodegradation, disintegration under
compost conditions, and phytotoxicity.[41]
The regulated metals and organic chemical tests ensure that
neither organic contaminants nor heavy metals such as lead, mercury and cadmium can enter the soil via
the biodegradable materials. The procedures for testing complete biodegradation in the laboratory and
disintegration under compost conditions ensure that materials are completely degraded during one process
cycle of a standard composting plant. The DIN compostability certification is very similar to BPI
certification.
ISO
The International Standards Organization (ISO) is a network of the national standards institutes of 157
countries who agree on specifications and criteria to be applied consistently in the classification of
materials, in the manufacture and supply of products, in testing and analysis, in terminology, and in the
provision of services.[42]
ISO 14855 stipulates the percentage conversion of carbon to evolved carbon
dioxide as well as the rate of conversion, and the degree of plastic disintegration at the end of testing. ISO
14852 determines the ultimate aerobic biodegradability of plastic materials in an aqueous medium. The
test method measures the evolved carbon dioxide and is similar to ASTM standards.
Australia
The Australian standard for degradable plastics includes test methods for validating the biodegradation of
degradable plastics. It certifies degradable polymers that conform to the European standard, EN 13432. [43]
The standard covers the range of potential application areas and disposal environments in Australia. The
standard does not exclude Kraft paper, as do some European standards. Kraft paper is excluded as a
positive control due to the potential presence of sulfonated pollutants. A more effective positive control
can be either cellulose filter paper or microcellulose AVICEL PH101.
The Australian standard was developed with reference to existing international standards. The standard
differentiates between biodegradable and other degradable plastics, as does ASTM D6400. It clearly
distinguishes between biodegradation and abiotic disintegration; even though both demonstrate that the
plastic has degraded sufficiently within the specified testing time. The standard is modeled after ASTM
D5152 and addresses environmental fate and toxicity issues. Lastly, the Australian standard is more
17
restrictive than ASTM D6400 as it states that total mineralization is required in 180 days; i.e., all of the
plastic is converted to carbon dioxide, water, inorganic compounds and biomass under aerobic conditions,
rather than disintegration into finely indistinguishable fragments and partial mineralization.[44]
Standards Australia Incorporated is developing two separate standards for compostable and
oxodegradable materials. The draft standards are based upon established international standards. The DR
04425CP standard is based on ISO 14855-99 for determining the ultimate aerobic biodegradability and
disintegration of plastic materials under controlled composting conditions. The DR 04424CP standard
will determine the ultimate aerobic biodegradability and disintegration of plastic materials in an aqueous
medium. The standards committee has established two subgroups to develop the standards: one for
biodegradable plastics and the second for other types of degradable plastics, including oxodegradable and
photodegradable plastics. [45]
Japan
The Japanese JIS standards are met with a GreenPLA certification system. The GreenPLA system has
very similar testing requirements as the US and European certification methods. In particular, the
GreenPLA certification assures biodegradability by measuring:
1. Carbon dioxide evolution after microbial biodegradation.
2. Mineralization (the ability to disintegrate and not leave visible fragments after composting).
3. Organic compatibility (the ability of the compost to support plant growth).
The JIS standard requires the same amount of carbon dioxide evolution as ASTM D6400 for certification:
60 percent in 45 days. The same 11 regulated metals are monitored in GreenPLA as in EN 13432.
However, several aspects of the certification are different from the US BPI and European Din-Certco
certifications. GreenPLA certification requires toxicological safety data on the biodegradable plastic
material from either oral acute toxicity tests with rats or environmental safety test with algae, Daphnia, or
fish. [46]
18
Biodegradable and Compostable Plastic Costs
Compostable plastic products are more expensive than conventional plastic products due in part to their
low volume of production. If more products are purchased and the production rate rises, the price should
be reduced. Biodegradable plastic products currently on the market are from two to ten times more
expensive than traditional plastic products. The cost for biodegradable polyesters varies from $1.50 to
$2.00 per pound. The high cost of the compostable plastic is a disadvantage when compared to paper,
LDPE, PP, PS, and PET. One Australian company is trying to produce affordable biodegradable plastics
by incorporating low-cost materials and processing methods. [47]
Nat-UR Cutlery Food Service provides biodegradable spoons, knives, and forks at a price of $15.50 for
240 pieces. They also sell compostable trash bags for San Francisco residents. The cost of 40 bags of 20-
gallon size is $19. They also offer plates and a trash bag at a cost of $24 for 100 plates and $24 for 40
bags of 40-gallon size, respectively. Plastic cups are also available at a cost of $26 for 100, 10-oz cups.
All of the products claim to meet ASTM D6400-99 standards.
Several companies provide compostable, rigid plastic packaging containers (RPPC), cutlery, and bags. [48]
NatureWorks® PLA is made into many different types of containers, including cups, lids, plates, and
storage containers. The cost for 1000 pieces can range from $25 to $145. [49]
Other environmentally friendly and biodegradable bags and cups are available at BioBag USA
Corporation. [50]
The bags are produced from Mater-Bi materials. All of the BioBag products meet the
ASTM D6400 standard for degradation and safe residues, are certified by the US Composting Council,
and comply with California state law regarding biodegradation. BioBag products are available for bags
and liners, shopping bags, pet products, composting systems, Agro Film, and toilet systems. Retail
biobags are available for kitchen bags, garden film, toilet systems, and Nature Waste Bags. Biodegradable
plastic cups are also available. The costs range from $0.08 to $0.20 per bag and $0.07 to $0.14 per cup.
The cost of biodegradable plastic bags is expensive when compared to the cost of typical polyethylene
bags at $0.01 to $0.02 per bag.
Some environmental organizations argue that the cheaper price of traditional plastics does not reflect their
true cost when you consider the expenses of disposal and environmental impact. The true costs of
compostable plastics can be offset by the cost of disposal. California’s cost for cleaning up and diverting
plastic waste to landfills is conservatively estimated at more than $750 million annually.[51]
Plastic
represents 50 to 80 percent of the litter volume collected from roads, parks and beaches, and 90 percent of
floating litter in the marine environment. In 2005, the California Department of Transportation spent $16
million cleaning up litter on California highways. [52]
Case Study of Costs at CSU Chico
The costs of disposal at CSU, Chico were studied in the research project. For one week, compostable
plastic products replaced the standard plastic products at the university campus cafeteria. The
compostable products were collected and sorted to remove non-compostable items and then sent to the
university farm for composting. The disposal costs were monitored and compared to typical weekly costs.
Several companies provide compostable Rigid Plastic Packaging Containers (RPPCs), cutlery, and bags,
which are sold through retailers and distributors.[53]
Three of them are Eco-Products of Colorado,
Biodegradable Food Service of Oregon, and NAT-UR Store of California. The products include: trash
bags, storage bags, pet products, lawn and leaf bags, and typical food services items, e.g., cups, plates,
and utensils. Eco-Products provided a quote for one week’s worth of products for use at the CSU, Chico
cafeteria.
19
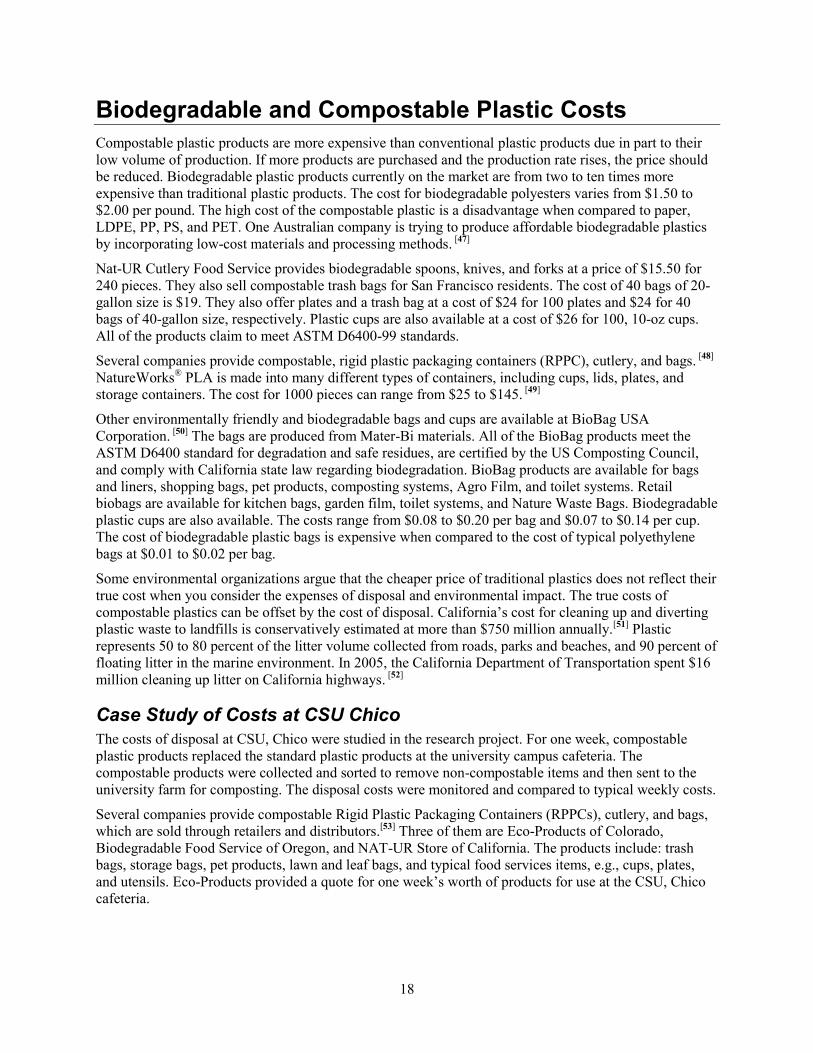
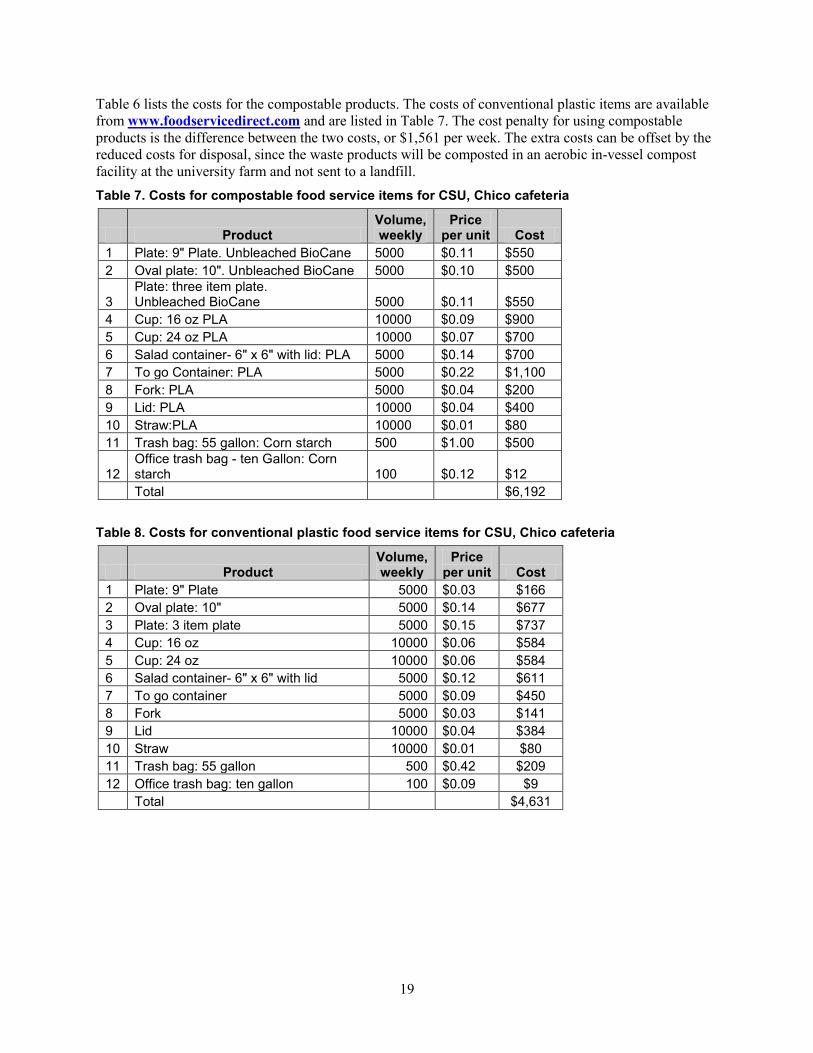
Table 6 lists the costs for the compostable products. The costs of conventional plastic items are available
from www.foodservicedirect.com and are listed in Table 7. The cost penalty for using compostable
products is the difference between the two costs, or $1,561 per week. The extra costs can be offset by the
reduced costs for disposal, since the waste products will be composted in an aerobic in-vessel compost
facility at the university farm and not sent to a landfill.
Table 7. Costs for compostable food service items for CSU, Chico cafeteria
Product Volume, weekly
Price per unit Cost
1 Plate: 9" Plate. Unbleached BioCane 5000 $0.11 $550
2 Oval plate: 10". Unbleached BioCane 5000 $0.10 $500
3 Plate: three item plate. Unbleached BioCane 5000 $0.11 $550
4 Cup: 16 oz PLA 10000 $0.09 $900
5 Cup: 24 oz PLA 10000 $0.07 $700
6 Salad container- 6" x 6" with lid: PLA 5000 $0.14 $700
7 To go Container: PLA 5000 $0.22 $1,100
8 Fork: PLA 5000 $0.04 $200
9 Lid: PLA 10000 $0.04 $400
10 Straw:PLA 10000 $0.01 $80
11 Trash bag: 55 gallon: Corn starch 500 $1.00 $500
12 Office trash bag - ten Gallon: Corn starch 100 $0.12 $12
Total $6,192
Table 8. Costs for conventional plastic food service items for CSU, Chico cafeteria
Product Volume, weekly
Price per unit Cost
1 Plate: 9" Plate 5000 $0.03 $166
2 Oval plate: 10" 5000 $0.14 $677
3 Plate: 3 item plate 5000 $0.15 $737
4 Cup: 16 oz 10000 $0.06 $584
5 Cup: 24 oz 10000 $0.06 $584
6 Salad container- 6" x 6" with lid 5000 $0.12 $611
7 To go container 5000 $0.09 $450
8 Fork 5000 $0.03 $141
9 Lid 10000 $0.04 $384
10 Straw 10000 $0.01 $80
11 Trash bag: 55 gallon 500 $0.42 $209
12 Office trash bag: ten gallon 100 $0.09 $9
Total $4,631
20
Compostable plastics are more expensive than petroleum-based plastics. Compostable plastic
performance is limited primarily by low temperature requirements and high cost. PLA compostable
plastic has a maximum use temperature of 60C. The temperature performance can be improved with the
addition of natural reinforcements or nanocomposites.
The cost of the compostable plastics can be reduced if larger volumes are produced in expanding
production facilities. The cost of compostable plastics should be reduced in the next several years and the
performance to cost ratio will become similar to traditional petroleum-based plastics.
21
Degradation, Residuals, Toxicity, and Safety of Degradable Plastic
The by-products of the biodegradation of compostable polymers have minimal environmental effect. The
by-products of compostable plastics are water, CO2, and a biomass similar to plant biomass. The biomass
residue provides carbon and nitrogen amendments as it is absorbed by the soil.
Degradable plastics can break down into smaller particles if blended with an additive to facilitate
degradation. However, oxodegradable plastic bags in compost environments can take several years to
biodegrade, depending on the amount of sunlight and oxygen exposure.[54]
Polyethylene plastic bags
produced with starch additives also partially degrade over time as microorganisms digest the starch, but
leave the polyethylene intact.
Degradable plastics break down in one of two ways: [55]
Disintegration occurs when the plastic materials break up and are no longer visible, but the polymer
still maintains a finite chain length.
Mineralization occurs after the initial oxidation process and the polymer chains are metabolized by
microorganisms into carbon dioxide, water, and biomass.
Oxodegradable polymers break down into small fragments over time but are not considered
biodegradable, since they do not meet the degradation rate or the residual-free content specified in the
ASTM D6400 standard. The plastics do disintegrate but leave small plastic fragments in the compost,
which violates the ASTM D6400 standard.
Results From Similar Biodegradable Plastics Studies
Mater-Bi is a wholly compostable polymer based on a blend of at least 50 percent starch and a
synthetic hydrophilic degradable polyester. The polymer was evaluated for suitability in disposal by
composting. [56],[57],[58]
The results indicate that Mater-Bi is readily degradable in standard laboratory
biodegradation tests, including a semi-continuous activated sludge (SCAS) test for simulating breakdown
in municipal wastewater treatment plants and pilot composting systems. The degradation rate of Mater-
Bi bags depends on the exact formulation used and the physical properties of the product. Toxicity tests
undertaken with the Mater-Bi bags and composted products have shown that they are nontoxic in
standard animal and plant tests.
Biological degradation of the aliphatic-aromatic copolyester, Ecoflex®, was investigated by evaluating the
degree of degradation and the intermediates that are formed during the degradation process. [59]
No
significant toxicological effects were observed, either for the monomeric intermediates or the oligomeric
intermediates. The risk for Ecoflex in a composting process was assessed as minimal and indicates no
environmental risk. More research is needed to assess the environmental risks and fate of intermediated
products of other biodegradable plastics in composting environments.
Biodegradation
The research documented in this report is a continuation of a previous research study on the
biodegradation of several compostable plastics that are commercially available in California. That
research found that the selected compostable materials degrade under laboratory compostable conditions
as specified in ASTM D6400. [60]
The degradation and disintegration results at the university farm demonstrated that the compostable
materials degrade in moist, manure-based compost in 90 days. The potato starch based tray, cornstarch
22
based trash bag, PLA plate, PLA straw, and PLA container degraded at rates similar to the cellulose
control.
The degradation and disintegration results at the municipal compost facility demonstrated that the
compostable materials degrade in moist greenwaste compost. The PLA container, PLA cup, and PLA
knife degraded at a rate similar to the Avicell cellulose control and degraded completely in seven weeks.
The cornstarch-based trash bag and sugar cane plate degraded at a rate similar to the Kraft paper control.
The three materials degraded 80-90 percent after 20 weeks.
The biodegradability of five different biodegradable garbage bags was analyzed according to the DIN-
standard. [61]
The tests proved that a biodegradable polymer can be degraded under controlled composting
conditions. The bags were made from cornstarch, polycaprolactone (PCL) and Kraft paper. PCL is a
biodegradable polyester that is often used as an additive for resins to improve their processing
characteristics while lowering cost and increasing biodegradability. The results demonstrated that all five
plastic products decomposed to the European standards of 60 percent within six months. The bags were
considered fully biodegradable since they degraded and disintegrated by breaking down into carbon
dioxide and water, and left no toxic residue in the soil. The bags are not considered compostable since
they were not tested for phytotoxicity.
Toxicity
Compostable materials must also not leave any toxic residues or chemicals that negatively affect the
compost soil quality. The quality of the compost can be evaluated using analytical and biological criteria,
including soil density, total dry solids, salt content, inorganic nutrients content, and eco-toxicological
behavior.[62]
The inorganic nutrients evaluated in the compost are total nitrogen, phosphorous, magnesium
or calcium, and ammonium-nitrogen. The eco-toxicological tests include determination of growth
inhibition with tomato and radish plants.
Phytotoxicity testing on the finished compost that contains degraded polymers can determine if the
buildup of inorganic materials from the plastics is harmful to plants and crops and if they slow down soil
productivity. [63]
ASTM 6002 establishes the standards for phytotoxicity testing. The ASTM procedure
determines phytotoxicity by blending the compost containing the compostable plastic material with
compost soil. Plant emergence survival and growth are then evaluated. Three plant species are generally
tested. The results from compost containing plastic material are compared to compost without plastic
material and a soil control. [64]
The plant species can be tomato, cucumber, radish, rye, barley, or grass.
Plant biomass tests can reveal quality differences between composts and can indicate potential plant stress
induced by the compost at the level used in the test. [65]
The PLA cup and container, sugar cane plate, and corn starch-based trash bag met the phytotoxicity
requirements and supported growth of tomato seedlings after ten days. Soil samples from the compostable
materials did not leave any toxic residue and had very little detectable heavy metals, i.e., lead and
cadmium were 100 times lower than established limits.
Safety
A safety assessment of the biodegradable plastics is listed on each product’s materials safety data sheet
(MSDS). The MSDS for the Ecoflex plastic states that the hot plastic can cause thermal burns and that
frequent or prolonged skin contact can cause irritation. However, the MSDS does not provide any data on
human, plant, or aquatic toxicity. The overall health hazard for Ecoflex is listed as low.
The MSDS for the Novomont Mater-Bi biodegradable plastic states that there is no evidence of harmful
effects to the eyes, skin, or lungs with the product. Furthermore, the MSDS states that the Novomont
product is not harmful to health if handled correctly.
23
The MSDS for the PLA plastic states that contact with the PLA fibers may cause skin irritation, that PLA
fibers may cause discomfort for individuals who experience bronchitis or asthma, and that PLA is not
hazardous to skin absorption or inhalation. The overall health hazard for PLA is listed as low.
The health risks for Mirel PHA should also be low, though an MSDS is not available.
Sugar cane powder can cause respiratory irritation. The LD-50 for sugar cane in rats is 29,700 mg/kg,
which translates into a lethal dosage for 50 percent of the rats that were given 29.7g of sugar cane per kg
of rat.[66]
Some aromatic aldehydes, ketones, quinones, metal complexes, and salts can activate photodegradation in
plastics. However, caution should be observed since some of them might also contribute to the toxicity of
the final product. Dithiocarbamates, for example, are skin irritants and responsible for long-term
abnormal thyroid function. They are considered a probable carcinogen. Anthracene is a suspected
endocrine disruptor, and a gastrointestinal and skin toxicant. Low molecular weight sensitizers might
leach out of the plastics by diffusion and this therefore, would prevent their use in food packaging
applications. Pyrene, which can be used as a sensitizer in degradable plastics, can cause health problems.
The overall health risks for UV-degradable plastics are minimal due to their LDPE basis and benign UV-
additive. Oxodegradable plastics might cause some health risks due to the use of transitional metal
complexes and salts. The oxodegradable additives are typically based on ionic Cobalt (II). Co (II) and its
compounds may cause adverse effects to humans and the environment. It is classified as a possible human
carcinogen and is very toxic to marine organisms. [67]
24
Biodegradation Testing Plan
Test Methods
The degradable materials were tested for biodegradation using five methods:
1. Following ASTM D6400 standards, monitor all of types of degradable plastics, including
oxodegradable, biodegradable, and compostable for biodegradation by measuring the CO2
evolution for 45 days.
Additionally, test the compost soil for heavy metals and phytotoxicity.
2. Allow compostable and degradable plastic materials and food waste to biodegrade at the City of
Chico Municipal Compost Facility.
3. Allow compostable plastic materials with BPI certification and food waste to biodegrade using
aerobic in-vessel composting at a commercial compost site in Vacaville.*
4. Allow compostable plastic materials with BPI certification and manure to biodegrade using
aerobic in-vessel composting at the university farm.*
5. Allow compostable plastic materials with BPI certification and municipal solid waste to
biodegrade using in-vessel composting at a commercial compost site in Mariposa County, CA.*
*Note: degradable materials will not be composted with the in-vessel compost methods due to the
potential contamination of the compost from residual non-degraded plastics.
Composting is a well-accepted process of biodegrading organic materials. The compost can be produced
with three techniques, namely, aerated static pile, turned windrow, or in-vessel container.
1. Windrows are long piles of compost up to two meters high. Static piles or windrows are not
turned or moved until composting is completed.
2. Turned windrows are aerated by periodic mechanical mixing with a large auger.
3. In-vessel composting places the material in a tank, where the compost material is aerated and
mixed by tumbling or stirring. Composting in a vessel is much faster than traditional windrow
methods. [68]
The first testing environment was under controlled laboratory settings. The closely monitored
environment allowed measurement of the degradation rate of the compostable materials as well as control
of important laboratory conditions, such as compost temperature, moisture, and pH. The purpose of the
laboratory experiment was to compare the degradation rates of several compostable materials with known
compostable standard materials, as well as to assess toxicity of the degradation products from the
compostable plastics. The experiment used ASTM D5338 laboratory protocols, though the successful
materials will not be certified to meet the ASTM D5338 standards since the laboratory is not ASTM
certified. The ASTM D6400 standard uses the experimental methods specified in ASTM D5338, but
extends the test time from 45 days to 180 days and the acceptable carbon conversion percentage from 60
to 90 percent. We used ASTM D5338 standards due to limited time in the study. Future research work is
needed to test the biodegradable, compostable, and degradable plastics under the longer ASTM D6400
standards.
Biodegradation can be measured at a chemical level by monitoring the conversion of starch in the plastics
to carbon dioxide. The compostable plastic materials are exposed to mature compost at a constant
temperature and moisture level over a 45-day period. Mature compost of 18 months is used to ensure that
the degradation is due to the conversion of the compostable plastic and not from degradation of organics
in the soil. The inoculums, defined as compost material that is comprised of soil and green yard waste,
25
were screened with a sieve of less than 10 mm to remove the large pieces. The test is an optimized
simulation of intensive aerobic composting where the biodegradability of the samples is determined under
moist conditions.
The one-week case study at CSU, Chico disposed of the food waste and compostable products at the
university farm. The materials were composted with an in-vessel aerobic method. The quality of the
compost was monitored for temperature, pH, moisture, and pathogens.
Another case study was performed at the Mariposa Compost facility, which processes municipal solid
waste (MSW) for Mariposa County, including Yosemite National Park. Their in-vessel system is state-of-
the-art technology, using a New Zealand in-vessel process, called Hot Rot Composting Systems.[69]
The
in-vessel system provides sufficient oxygen for aerobic degradation, while maintaining sustained
temperature in excess of 55º C for three days to achieve sanitization and odor control. The quality of the
compost was monitored for temperature, pH, moisture, and pathogens.
Anaerobic digestion was studied with UC Davis and Dr. Zhang. Marine testing was studied per ASTM
standards. Contamination studies will research the effects of degradable plastics on the recycling stream.
Materials
The materials were all commercially available compostable, biodegradable, UV-degradable, and oxo-
degadable plastics made from polylactic acid (PLA), corn starch, copolyesters, PHA, sugar cane, and low
density polyethylene (LDPE). See Table 4 for a complete description of the test materials.
Cellulose filter paper (Cellupure filter) from FilterQueen and Kraft paper were used as positive control
materials. A polyethylene plastic sheet (Clingwrap) from Glad was used as a negative control as required
in the ASTM standard. The test materials were cut up into approximately 25 mm by 25 mm pieces.
26
Laboratory Tests
The biodegradation of the compostable materials was tested in a controlled experimental environment.
The laboratory experiment set up was based upon procedures outlined in ASTM D5338. Gases were
measured with detectors allowed in the ASTM standards.
Test Procedures
The samples were prepared by adding 100g of the cut up degradable sample to 600g of mature soil
compost in a 3.8-liter glass-canning jar. The sample materials occupied 1.5 liters of the vessel and left 2.3
liters of open volume for the gas to occupy. ASTM D5338 specifies that a maximum of 75 percent of the
container can be filled with the test sample and compost.
The samples were placed in an oven maintained at 58 C for 45 days. The room temperature was
maintained between 22 C and 27 C for the course of the experiment. The jar container tops had a rubber
seal. The lids of the jars were modified to add two rubber stoppers with 5 mm tubes for moist air supply
and gas withdrawal.
The mature compost, at least 18 months old, had a pH of 8.7, ash content of 35 percent, and
carbon/nitrogen (C/N) ratio of ten. Carbon dioxide and ammonia measurements were taken on the
compost with a Solvita test kit at the beginning of the test. These measurements were then used to
calculate the C/N ratio.
Solvita is an easy-to-use test that measures both carbon-dioxide (CO2) and ammonia (NH3) levels in the
soil and also gives a Maturity Index value.[70]
The blank compost had a Solivita overall maturity index of
seven with carbon dioxide rating of seven and ammonia rating of five. The mature compost rating
indicates well matured, aged compost with few limitations for use.
The blank compost was screened with a sieve of less than 10 mm. The dry solids content was 95 percent
and the volatile solids content was 63 percent. The volatile solids percentage was calculated by taking the
difference between the dry weight and the ash content and dividing by the dry weight.
The experimental set-up is shown in Figure 1. Shop air was first sent to a CO2 scrubber from Fisher
Scientific to remove CO2, H20, and other gases from the air. It was then sent to an aluminum cylinder
with water in the bottom to moisten the air. Moist air was then sent to a manifold for distribution to the 42
jars in the oven.
The moisture content of the samples was regularly monitored with a digital Sartorias moisture analyzer.
Distilled water was added, as needed, to achieve an overall moisture content of 50 percent. The moisture
content was found by drying the sample with infrared heat until the mass was unchanged. The
temperature of the air in the laboratory was between 22 C and 27 C throughout the 45 days.
The jars were rotated and shaken weekly to maintain uniformity. Excess liquid was noted on the daily log
and removed by adding air.
The jars were fed the moist air as the biogas was withdrawn with the aid of a vacuum pump. The biogases
were sent to a bank of 42 gas valves. Each valve was opened to send the biogas from each jar to a gas
manifold and then to a 320 ml sample jar holding either a CO2 or O2 Pasco gas sensor. The gas manifold
and sample jars were purged with room air between each measurement. The measurement cycle took
approximately 30 minutes with all 42 jars measured every 24 hours.
The gas sensors use infrared (IR) detection to measure the energy absorbed by carbon dioxide or oxygen
molecules and then display the appropriate concentration. The carbon dioxide concentration is expressed
in parts-per-million (ppm). The CO2 gas sensor had a range between 0 and 300,000 ppm with an accuracy
of 100 ppm or ten percent of value for a range of 0 to 10,000 ppm, whichever is greater. It had 20 percent
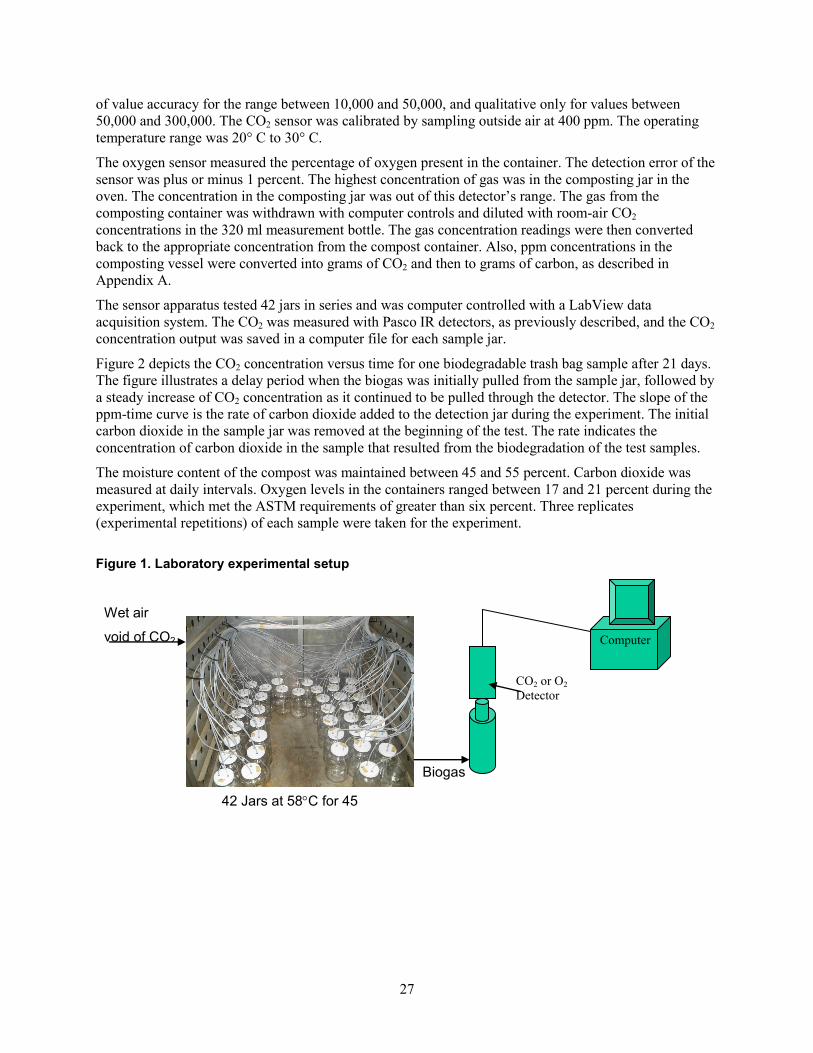
27
of value accuracy for the range between 10,000 and 50,000, and qualitative only for values between
50,000 and 300,000. The CO2 sensor was calibrated by sampling outside air at 400 ppm. The operating
temperature range was 20° C to 30° C.
The oxygen sensor measured the percentage of oxygen present in the container. The detection error of the
sensor was plus or minus 1 percent. The highest concentration of gas was in the composting jar in the
oven. The concentration in the composting jar was out of this detector’s range. The gas from the
composting container was withdrawn with computer controls and diluted with room-air CO2
concentrations in the 320 ml measurement bottle. The gas concentration readings were then converted
back to the appropriate concentration from the compost container. Also, ppm concentrations in the
composting vessel were converted into grams of CO2 and then to grams of carbon, as described in
Appendix A.
The sensor apparatus tested 42 jars in series and was computer controlled with a LabView data
acquisition system. The CO2 was measured with Pasco IR detectors, as previously described, and the CO2
concentration output was saved in a computer file for each sample jar.
Figure 2 depicts the CO2 concentration versus time for one biodegradable trash bag sample after 21 days.
The figure illustrates a delay period when the biogas was initially pulled from the sample jar, followed by
a steady increase of CO2 concentration as it continued to be pulled through the detector. The slope of the
ppm-time curve is the rate of carbon dioxide added to the detection jar during the experiment. The initial
carbon dioxide in the sample jar was removed at the beginning of the test. The rate indicates the
concentration of carbon dioxide in the sample that resulted from the biodegradation of the test samples.
The moisture content of the compost was maintained between 45 and 55 percent. Carbon dioxide was
measured at daily intervals. Oxygen levels in the containers ranged between 17 and 21 percent during the
experiment, which met the ASTM requirements of greater than six percent. Three replicates
(experimental repetitions) of each sample were taken for the experiment.
Figure 1. Laboratory experimental setup
Wet air
void of CO2 Computer
CO2 or O2
Detector
Biogas
42 Jars at 58C for 45 days
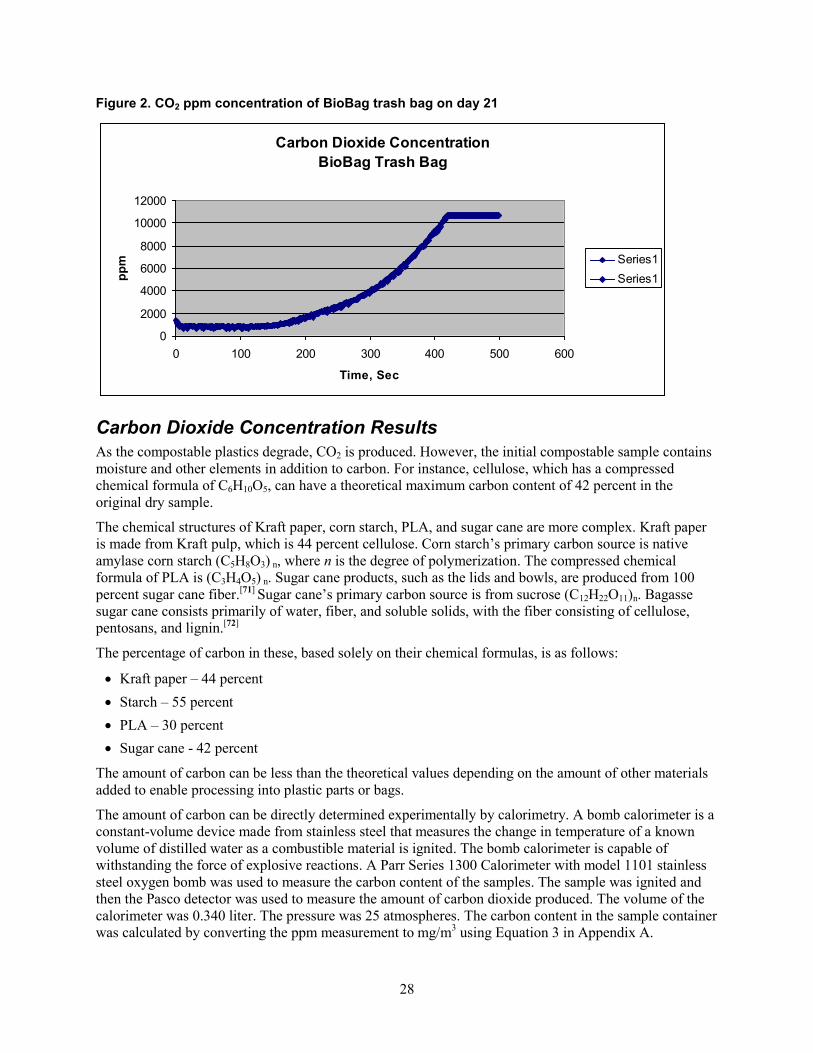
28
Figure 2. CO2 ppm concentration of BioBag trash bag on day 21
Carbon Dioxide Concentration
BioBag Trash Bag
0
2000
4000
6000
8000
10000
12000
0 100 200 300 400 500 600
Time, Sec
pp
m Series1
Series1
Carbon Dioxide Concentration Results
As the compostable plastics degrade, CO2 is produced. However, the initial compostable sample contains
moisture and other elements in addition to carbon. For instance, cellulose, which has a compressed
chemical formula of C6H10O5, can have a theoretical maximum carbon content of 42 percent in the
original dry sample.
The chemical structures of Kraft paper, corn starch, PLA, and sugar cane are more complex. Kraft paper
is made from Kraft pulp, which is 44 percent cellulose. Corn starch’s primary carbon source is native
amylase corn starch (C5H8O3) n, where n is the degree of polymerization. The compressed chemical
formula of PLA is (C3H4O5) n. Sugar cane products, such as the lids and bowls, are produced from 100
percent sugar cane fiber.[71]
Sugar cane’s primary carbon source is from sucrose (C12H22O11)n. Bagasse
sugar cane consists primarily of water, fiber, and soluble solids, with the fiber consisting of cellulose,
pentosans, and lignin.[72]
The percentage of carbon in these, based solely on their chemical formulas, is as follows:
Kraft paper – 44 percent
Starch – 55 percent
PLA – 30 percent
Sugar cane - 42 percent
The amount of carbon can be less than the theoretical values depending on the amount of other materials
added to enable processing into plastic parts or bags.
The amount of carbon can be directly determined experimentally by calorimetry. A bomb calorimeter is a
constant-volume device made from stainless steel that measures the change in temperature of a known
volume of distilled water as a combustible material is ignited. The bomb calorimeter is capable of
withstanding the force of explosive reactions. A Parr Series 1300 Calorimeter with model 1101 stainless
steel oxygen bomb was used to measure the carbon content of the samples. The sample was ignited and
then the Pasco detector was used to measure the amount of carbon dioxide produced. The volume of the
calorimeter was 0.340 liter. The pressure was 25 atmospheres. The carbon content in the sample container
was calculated by converting the ppm measurement to mg/m3 using Equation 3 in Appendix A.
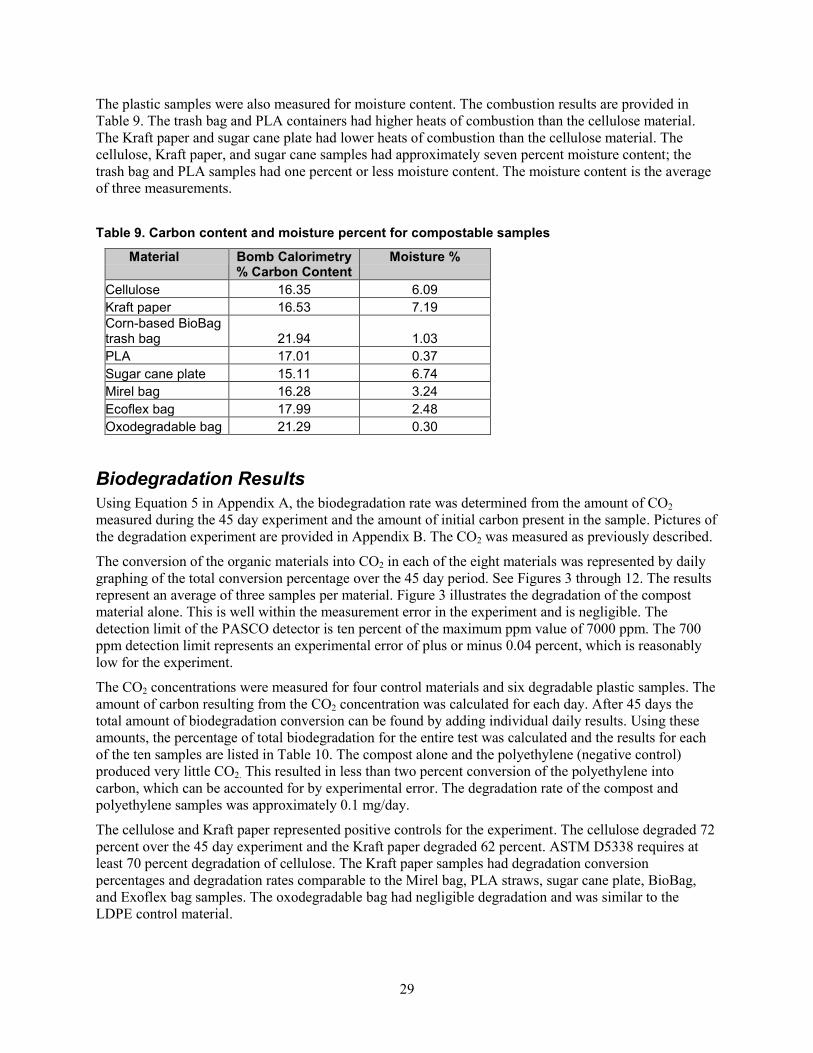
29
The plastic samples were also measured for moisture content. The combustion results are provided in
Table 9. The trash bag and PLA containers had higher heats of combustion than the cellulose material.
The Kraft paper and sugar cane plate had lower heats of combustion than the cellulose material. The
cellulose, Kraft paper, and sugar cane samples had approximately seven percent moisture content; the
trash bag and PLA samples had one percent or less moisture content. The moisture content is the average
of three measurements.
Table 9. Carbon content and moisture percent for compostable samples
Material Bomb Calorimetry % Carbon Content
Moisture %
Cellulose 16.35 6.09
Kraft paper 16.53 7.19
Corn-based BioBag trash bag 21.94 1.03
PLA 17.01 0.37
Sugar cane plate 15.11 6.74
Mirel bag 16.28 3.24
Ecoflex bag 17.99 2.48
Oxodegradable bag 21.29 0.30
Biodegradation Results
Using Equation 5 in Appendix A, the biodegradation rate was determined from the amount of CO2
measured during the 45 day experiment and the amount of initial carbon present in the sample. Pictures of
the degradation experiment are provided in Appendix B. The CO2 was measured as previously described.
The conversion of the organic materials into CO2 in each of the eight materials was represented by daily
graphing of the total conversion percentage over the 45 day period. See Figures 3 through 12. The results
represent an average of three samples per material. Figure 3 illustrates the degradation of the compost
material alone. This is well within the measurement error in the experiment and is negligible. The
detection limit of the PASCO detector is ten percent of the maximum ppm value of 7000 ppm. The 700
ppm detection limit represents an experimental error of plus or minus 0.04 percent, which is reasonably
low for the experiment.
The CO2 concentrations were measured for four control materials and six degradable plastic samples. The
amount of carbon resulting from the CO2 concentration was calculated for each day. After 45 days the
total amount of biodegradation conversion can be found by adding individual daily results. Using these
amounts, the percentage of total biodegradation for the entire test was calculated and the results for each
of the ten samples are listed in Table 10. The compost alone and the polyethylene (negative control)
produced very little CO2. This resulted in less than two percent conversion of the polyethylene into
carbon, which can be accounted for by experimental error. The degradation rate of the compost and
polyethylene samples was approximately 0.1 mg/day.
The cellulose and Kraft paper represented positive controls for the experiment. The cellulose degraded 72
percent over the 45 day experiment and the Kraft paper degraded 62 percent. ASTM D5338 requires at
least 70 percent degradation of cellulose. The Kraft paper samples had degradation conversion
percentages and degradation rates comparable to the Mirel bag, PLA straws, sugar cane plate, BioBag,
and Exoflex bag samples. The oxodegradable bag had negligible degradation and was similar to the
LDPE control material.
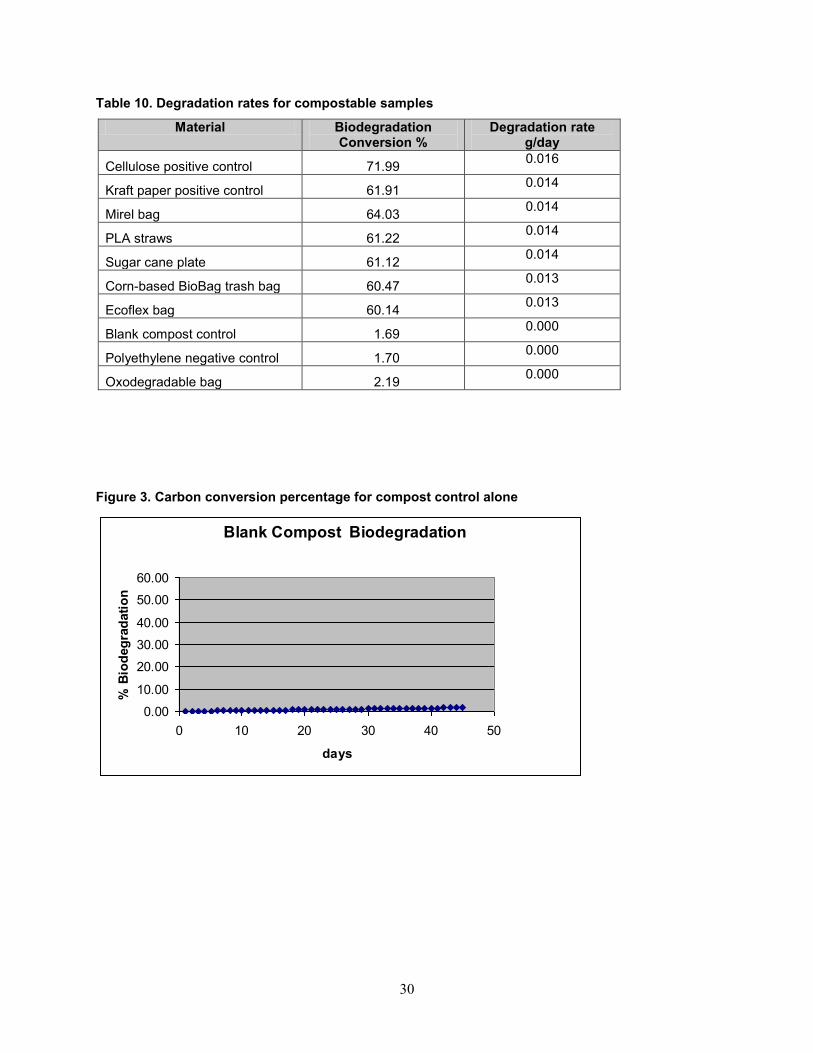
30
Table 10. Degradation rates for compostable samples
Material Biodegradation Conversion %
Degradation rate g/day
Cellulose positive control 71.99 0.016
Kraft paper positive control 61.91 0.014
Mirel bag 64.03 0.014
PLA straws 61.22 0.014
Sugar cane plate 61.12 0.014
Corn-based BioBag trash bag 60.47 0.013
Ecoflex bag 60.14 0.013
Blank compost control 1.69 0.000
Polyethylene negative control 1.70 0.000
Oxodegradable bag 2.19 0.000
Figure 3. Carbon conversion percentage for compost control alone
Blank Compost Biodegradation
0.00
10.00
20.00
30.00
40.00
50.00
60.00
0 10 20 30 40 50
days
% B
iod
eg
rad
ati
on
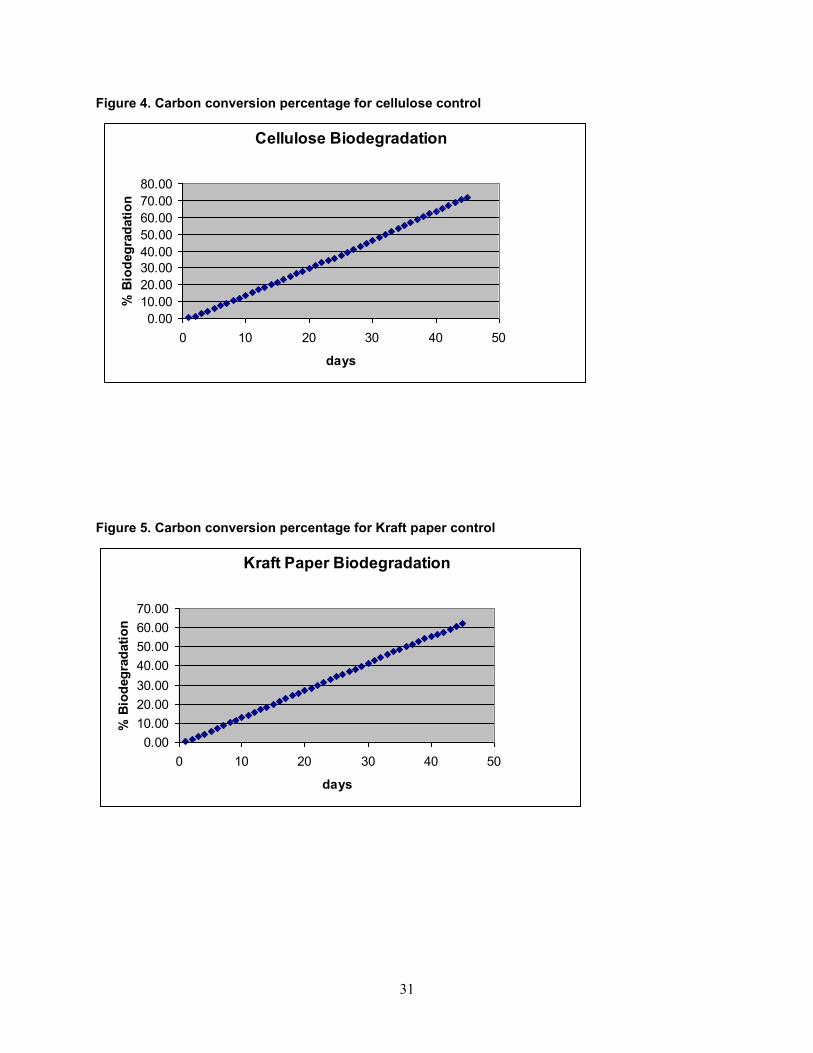
31
Figure 4. Carbon conversion percentage for cellulose control
Cellulose Biodegradation
0.00
10.00
20.00
30.00
40.00
50.00
60.00
70.00
80.00
0 10 20 30 40 50
days
% B
iod
eg
rad
ati
on
Figure 5. Carbon conversion percentage for Kraft paper control
Kraft Paper Biodegradation
0.00
10.00
20.00
30.00
40.00
50.00
60.00
70.00
0 10 20 30 40 50
days
% B
iod
eg
rad
ati
on
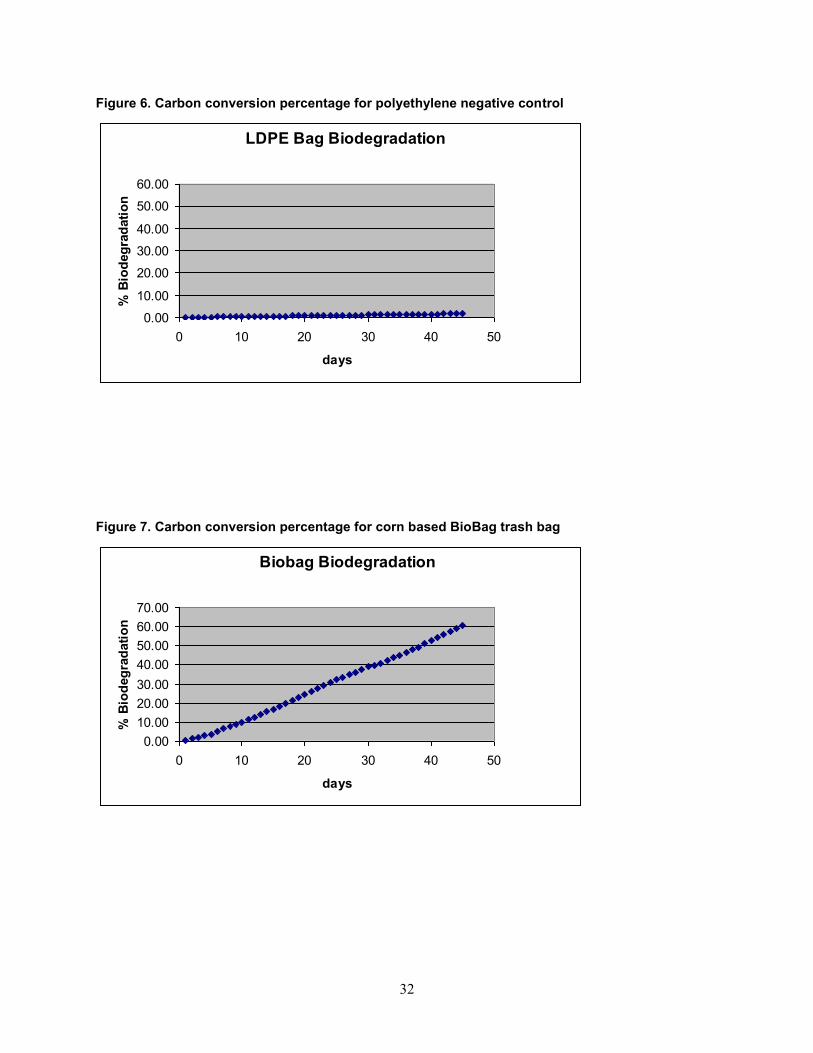
32
Figure 6. Carbon conversion percentage for polyethylene negative control
LDPE Bag Biodegradation
0.00
10.00
20.00
30.00
40.00
50.00
60.00
0 10 20 30 40 50
days
% B
iod
eg
rad
ati
on
Figure 7. Carbon conversion percentage for corn based BioBag trash bag
Biobag Biodegradation
0.00
10.00
20.00
30.00
40.00
50.00
60.00
70.00
0 10 20 30 40 50
days
% B
iod
eg
rad
ati
on

33
Figure 8. Carbon conversion percentage for PLA straws
PLA Straws Biodegradation
0.00
10.00
20.00
30.00
40.00
50.00
60.00
70.00
0 10 20 30 40 50
days
% B
iod
eg
rad
ati
on
Figure 9. Carbon conversion percentage for sugar cane plate
Sugar Cane Lid Biodegradation
0.00
10.00
20.00
30.00
40.00
50.00
60.00
70.00
0 10 20 30 40 50
days
% B
iod
eg
rad
ati
on
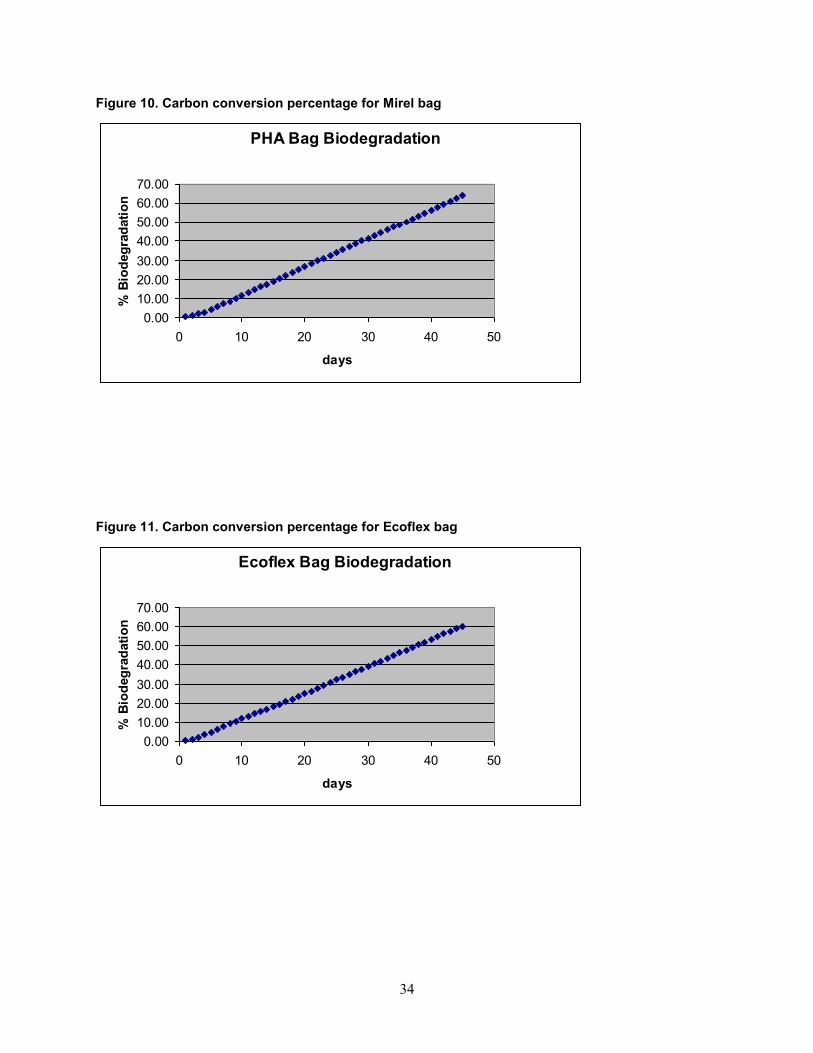
34
Figure 10. Carbon conversion percentage for Mirel bag
PHA Bag Biodegradation
0.00
10.00
20.00
30.00
40.00
50.00
60.00
70.00
0 10 20 30 40 50
days
% B
iod
eg
rad
ati
on
Figure 11. Carbon conversion percentage for Ecoflex bag
Ecoflex Bag Biodegradation
0.00
10.00
20.00
30.00
40.00
50.00
60.00
70.00
0 10 20 30 40 50
days
% B
iod
eg
rad
ati
on
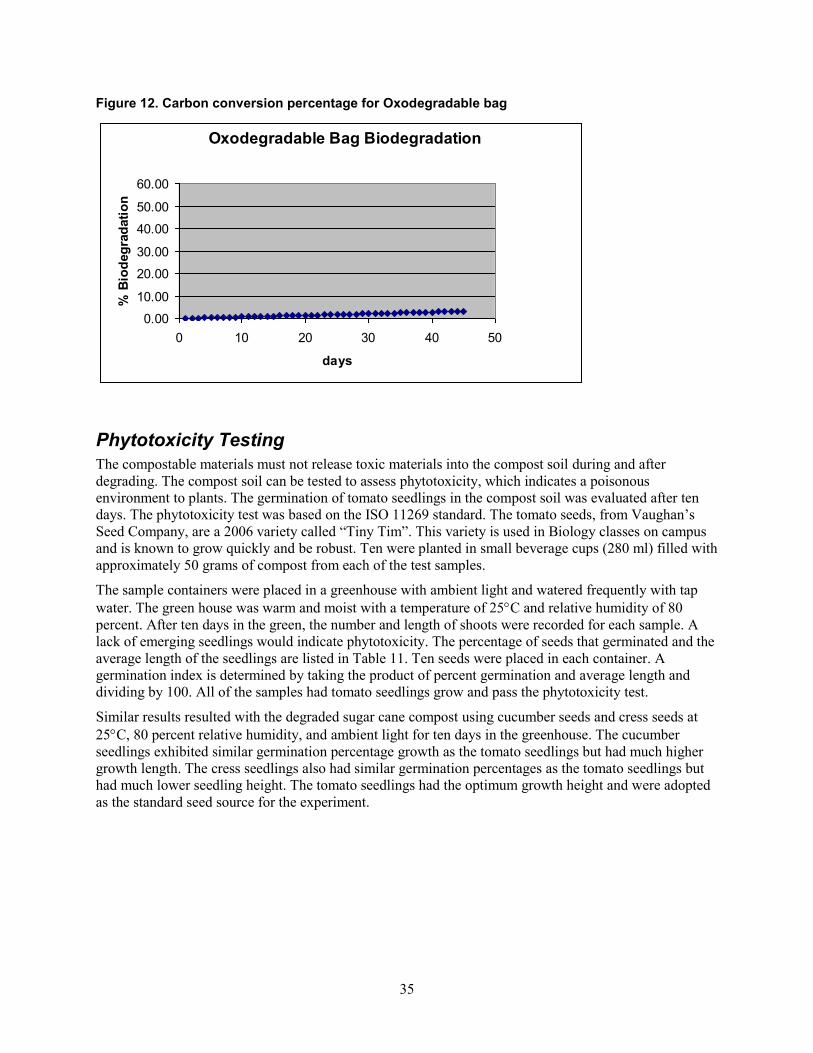
35
Figure 12. Carbon conversion percentage for Oxodegradable bag
Oxodegradable Bag Biodegradation
0.00
10.00
20.00
30.00
40.00
50.00
60.00
0 10 20 30 40 50
days
% B
iod
eg
rad
ati
on
Phytotoxicity Testing
The compostable materials must not release toxic materials into the compost soil during and after
degrading. The compost soil can be tested to assess phytotoxicity, which indicates a poisonous
environment to plants. The germination of tomato seedlings in the compost soil was evaluated after ten
days. The phytotoxicity test was based on the ISO 11269 standard. The tomato seeds, from Vaughan’s
Seed Company, are a 2006 variety called ―Tiny Tim‖. This variety is used in Biology classes on campus
and is known to grow quickly and be robust. Ten were planted in small beverage cups (280 ml) filled with
approximately 50 grams of compost from each of the test samples.
The sample containers were placed in a greenhouse with ambient light and watered frequently with tap
water. The green house was warm and moist with a temperature of 25C and relative humidity of 80
percent. After ten days in the green, the number and length of shoots were recorded for each sample. A
lack of emerging seedlings would indicate phytotoxicity. The percentage of seeds that germinated and the
average length of the seedlings are listed in Table 11. Ten seeds were placed in each container. A
germination index is determined by taking the product of percent germination and average length and
dividing by 100. All of the samples had tomato seedlings grow and pass the phytotoxicity test.
Similar results resulted with the degraded sugar cane compost using cucumber seeds and cress seeds at
25C, 80 percent relative humidity, and ambient light for ten days in the greenhouse. The cucumber
seedlings exhibited similar germination percentage growth as the tomato seedlings but had much higher
growth length. The cress seedlings also had similar germination percentages as the tomato seedlings but
had much lower seedling height. The tomato seedlings had the optimum growth height and were adopted
as the standard seed source for the experiment.
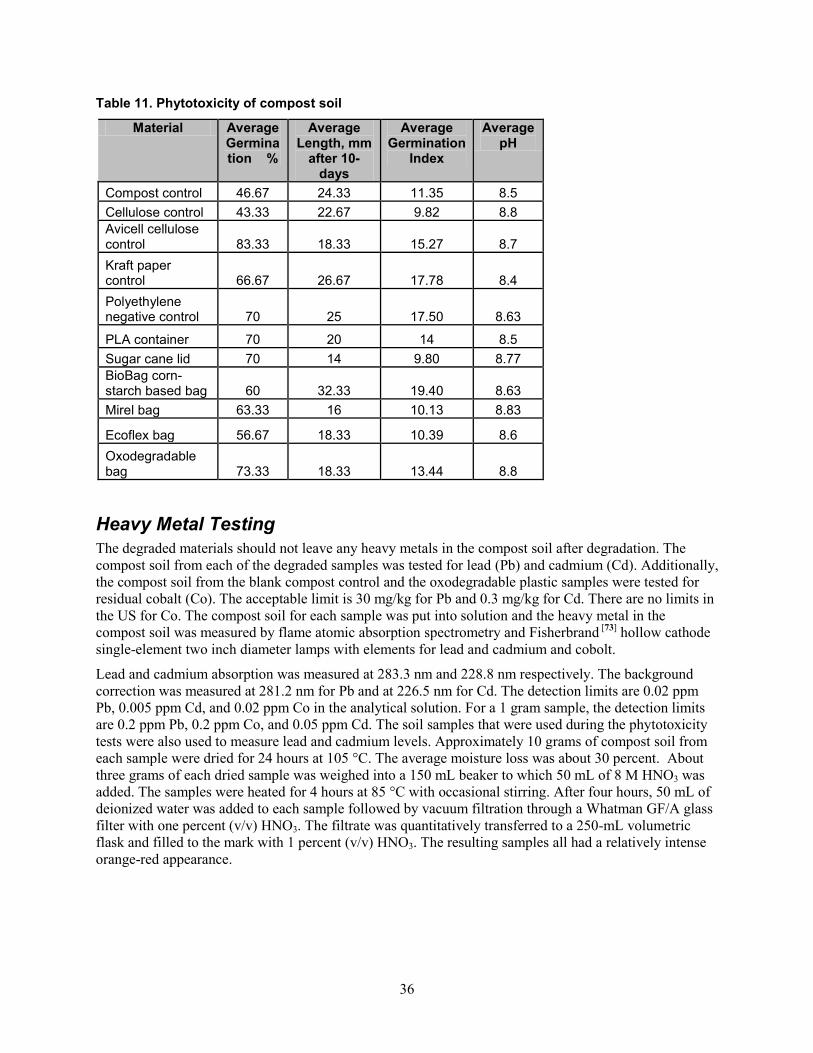
36
Table 11. Phytotoxicity of compost soil
Material Average Germination %
Average Length, mm
after 10-days
Average Germination
Index
Average pH
Compost control 46.67 24.33 11.35 8.5
Cellulose control 43.33 22.67 9.82 8.8
Avicell cellulose control 83.33 18.33 15.27 8.7
Kraft paper control 66.67 26.67 17.78 8.4
Polyethylene negative control 70 25 17.50 8.63
PLA container 70 20 14 8.5
Sugar cane lid 70 14 9.80 8.77
BioBag corn-starch based bag 60 32.33 19.40 8.63
Mirel bag 63.33 16 10.13 8.83
Ecoflex bag 56.67 18.33 10.39 8.6
Oxodegradable bag 73.33 18.33 13.44 8.8
Heavy Metal Testing
The degraded materials should not leave any heavy metals in the compost soil after degradation. The
compost soil from each of the degraded samples was tested for lead (Pb) and cadmium (Cd). Additionally,
the compost soil from the blank compost control and the oxodegradable plastic samples were tested for
residual cobalt (Co). The acceptable limit is 30 mg/kg for Pb and 0.3 mg/kg for Cd. There are no limits in
the US for Co. The compost soil for each sample was put into solution and the heavy metal in the
compost soil was measured by flame atomic absorption spectrometry and Fisherbrand [73]
hollow cathode
single-element two inch diameter lamps with elements for lead and cadmium and cobolt.
Lead and cadmium absorption was measured at 283.3 nm and 228.8 nm respectively. The background
correction was measured at 281.2 nm for Pb and at 226.5 nm for Cd. The detection limits are 0.02 ppm
Pb, 0.005 ppm Cd, and 0.02 ppm Co in the analytical solution. For a 1 gram sample, the detection limits
are 0.2 ppm Pb, 0.2 ppm Co, and 0.05 ppm Cd. The soil samples that were used during the phytotoxicity
tests were also used to measure lead and cadmium levels. Approximately 10 grams of compost soil from
each sample were dried for 24 hours at 105 °C. The average moisture loss was about 30 percent. About
three grams of each dried sample was weighed into a 150 mL beaker to which 50 mL of 8 M HNO3 was
added. The samples were heated for 4 hours at 85 °C with occasional stirring. After four hours, 50 mL of
deionized water was added to each sample followed by vacuum filtration through a Whatman GF/A glass
filter with one percent (v/v) HNO3. The filtrate was quantitatively transferred to a 250-mL volumetric
flask and filled to the mark with 1 percent (v/v) HNO3. The resulting samples all had a relatively intense
orange-red appearance.
37
Sample preparation included adding a 0.8239 g sample of Pb(NO3)2 to a 500-mL volumetric flask,
dissolved and diluted to the mark with 1 percent (v/v) HNO3 yielding a 1099.5 ppm Pb2+
solution.
Various standard solutions in the range of 0.220 to 1.10 ppm Pb2+
in one percent (v/v) HNO3 were
prepared along with a 1 M HNO3 solution. Standard solutions were prepared by dissolving 0.2460g Cd in
approximately 3 mL of 6M HCl and approximately 2 mL of 8M HNO3 in a 250 mL volumetric flask and
diluted to the mark with 1 percent HCl (v/v) yield on 984 ppm Cd solution. Various standard solutions
including a blank from mature compost alone were prepared from 0.0984ppm to 9.840 ppm Cd in one
percent HCl.
The standard solutions and eight sample solutions were analyzed using a ThermoElectron S Series Flame
Atomic Absorption Spectrophotometer using an air-acetylene flame and equipped with a Pb hollow-
cathode lamp detecting at 283.3 nm, a Co hollow-cathode lamp, and a Cd hollow-cathode lamp. The
sample solutions gave absorbances at or very near the lowest standard employed which was just above the
detection limit of the instrument. Using 0.022 ppm Pb2+
as the detection limit leads to an upper limit of 20
ppm Pb2+
in the original soil samples. The 20 ppm value equates to 0.02 mg/kg for Pb. The Cd
concentrations were lower than 1ppm which equates to 0.001 mg/kg Cd. All of the soil samples from the
compostable materials had lead concentrations much lower than the limit of 30 mg/kg Pb and Cd
concentrations lower than the limit of 17 mg/kg Cd. In fact, the measured values for Pb and Cd were at
the lower detection limits of the Pb and Cd detectors. Similarly, the cobalt concentrations were very low
in both the control and the oxodegradable samples.
38
Marine Testing
Background
Marine pollution is a worldwide concern. Marine environmental pollution is regulated by the MARPOL
treaty. The treaty prohibits ocean disposal of any plastic waste from ships and off shore platforms. [74]
Petroleum-based plastics can cause environmental concern because they remain floating in the water for a
long time before disintegrating. Poly-ester-urethane had a significant weight loss in sea water within 12
months, whereas, poly-ether urethane did not experience any weight loss in 12 months. [75]
Polyethylene plastics typically float in ocean water and can take 100 years to disintegrate completely.
Polyethylene did not degrade in a marine environment at a temperature of 30C after 12 weeks.[76]
Floating, low density polyethylene with a UV-degradant deteriorated slower in a marine environment than
on land.[77]
Photodegradable LDPE plastic ring connectors can degrade in marine and land environments
with a 50 percent loss in properties in 12 months.[78],[79]
Biodegradable plastic will biodegrade much faster than polyethylene due to its ability to absorb water and
sink in ocean water. However, only PHA, PHB, and poly- caprolactone were shown to biodegrade in
marine environment. [80]
The use of biodegradable plastics has been studied for biodegradation in marine
environments. [81]
The biodegradation of biodegradable plastics is essential for the plastics to be used for
fishing nets and other aquatic applications. Polyhydroxyalkanoates (PHA), polyhydroxyvalerate (PHV)
and polyhydroxybutyrate (PHB) have been studied extensively for biodegradation in marine
environments. PHB biodegraded in sea water at a rate of 0.6 g/week at 25C. However, PLA did not
biodegrade in sea water at the same temperature. [82]
PLA did not biodegrade in an anaerobic liquid
environment, either. PHB biodegraded rapidly in three weeks, though Mirel degraded more slowly. [83]
Test Procedures
There were two marine tests conducted. The sample materials for the first marine test included: Kraft
paper and low density polyethylene controls, UV-degradable six-pack rings, ecosafe and eco-friendly
oxodegradable plastic trash bags, PLA straws, corn starch trash bags, Mirel bags, Ecoflex bags, and Stalk
Market sugarcane lids.
The samples were tested for marine exposure using procedures based on ASTM D6691 and ASTM
D7081. ASTM D6691 is a test method for determining aerobic biodegradation of plastic materials in the
marine environment by defined microbial consortium. A test sample material demonstrates satisfactory
disintegration if after 12 weeks, at least 70 percent of the material disintegrates. ASTM D7081 is a
standard specification for non-floating biodegradable plastics in marine environments. Both standards
also require that the amount of CO2 generated during the degradation process be measured. A test sample
demonstrates satisfactory biodegradation if after 180 days, 30 percent or more of the sample is converted
to carbon dioxide. The sampling and specimen preparation are identical in both standards.
The degradable samples were prepared according to ASTM D7081. A small sample, 0.030g, of each
material was placed in a jar with 100 ml of ocean water. Ocean water was retrieved in July from Big Sur
beach in California and held at 5°C for 30 days until testing started. The samples were placed in an oven
maintained at 30C. The mass of the material was recorded after 30 days and 60 days. After 30 days, the
samples were removed from the jar and allowed to dry overnight. After weighing the samples were placed
in jars with new ocean water and then placed in the oven again.
A second test was conducted using larger samples (3 g) that sink. This caused more carbon dioxide to be
generated than with the 0.030 g sample size specified in ASTM D7081 standard. The amount of carbon
dioxide produced during the second experiment was measured with the PASCO detector. The samples
were kept in an oven and held at 30C for three weeks. The samples included Kraft paper control, Mirel
39
bag, Ecoflex bag, BioBag, sugar cane, and PLA. Carbon dioxide was measured with the computer
controlled equipment from the ASTM D5338 compost testing. Dry air, void of CO2, was added to 3.8 L
jars containing 3 g of each sample along with 300 ml of ocean water and 10 ml of ocean soil. The
LabView software controlled the opening of valves and recorded the amount of CO2 as measured with the
PASCO detectors.
Results
For the first test, after 30 days in ocean water, the Mirel sample had 36 percent disintegration. There was
no disintegration of the oxodegradable and UV-degradable plastic trash bags, LDPE control, Kraft paper
control, PLA straws, sugar cane lids, corn starch trash bags, or Ecoflex bag.
Similarly, after 60 days in ocean water, the Mirel sample had 60 percent disintegration. The other samples
still did not experience any disintegration. There was no disintegration of the oxodegradable and UV-
degradable plastic trash bags, LDPE control, Kraft paper control, PLA lids, sugar cane lids, corn starch
trash bags, or Ecoflex bag. The materials that sank in the marine water were Kraft paper control, PLA
straws, Mirel bag, Ecoflex bag, and cornstarch bag. The materials that floated included the LDPE control,
sugar cane lid, oxodegradable bag, UV-degradable bag, and UV-degradable soda rings.
The UV-degradable six-pack ring polyethylene samples experienced no weight loss in 14 days, but did
become more brittle. Three plastic rings were placed in ocean water and exposed to sunlight and
temperatures between 15C and 35C. Likewise, three plastic rings were placed in a wooden box without
sea water and also exposed to sunlight and temperatures between 15C and 35C. None of the six samples
experienced any weight loss after 14 days. Several of the samples could be pulled apart and broken. This
was most likely due to polymer chain scission from exposure to ultra violet light. Additional research is
needed to better understand the breakdown of UV degradable plastics in marine water and land
environments.
The results of the second marine testing are similar to the first round of testing in that none of the samples
had detectable amounts of CO2 other than the Mirel PHA bag and sugar cane lid. After 21 days, the
amount of carbon biodegradation was six percent for the Mirel bag and two percent for the sugar cane lid.
The other compostable plastics, e.g., PLA, BioBag, Ecoflex, and Kraft paper had less than one percent
biodegradation which is within experimental error limits.
The amount of biodegradation was less in the second experiment due to several factors including:
insufficient original sample mass, improper ratio of sample mass to ocean water volume, and other
experimental conditions. Future experiments should be modified to improve the measurement techniques.
Additional research is needed to better understand the biodegradation of compostable and biodegradable
polymers in the marine environment.
40
Anaerobic Digestion
Degradable plastics can also break down in anaerobic conditions. Anaerobic digestion occurs when
organic materials are broken down by bacteria in the absence of oxygen.[84]
Anaerobic digesters are
commonly used for sewage treatment or for managing animal waste on farms. Organic materials that can
be anaerobically digested include waste paper, grass clippings, food waste, sewage and animal waste.
Many factors affect the biodegradability of polymers, including pH, bacterium type, temperature,
molecular weight, chemical linkages, and access of the material to the enzymatic system.[85]
Several kinds
of commercial biodegradable plastics were shown to degrade under aerobic and anaerobic conditions.
Biodegradable plastics derived from natural polymers, such as starch or cellulose, contain recalcitrant
components that can inhibit microbial degradation. Results have shown that degradation behavior of
commercial biodegradable plastics is different from pure polymers due to the additives used to improve
the performance of the final product.[86]
Thermophilic anaerobic digestion of the organic fraction of
municipal solid waste has been successfully applied in lab-scale[87]
and full scale anaerobic digesters.[88]
Materials
The degradable polymers were evaluated under anaerobic conditions and characterized with methods
established for digestion of food waste.[89]
The degradable materials included PLA cup and straw, sugar
cane plate, corn starch based BioBag, Mirel bag, Ecoflex bag, oxodegradable bag, UV degradable bag,
and Kraft paper as a control. BioBag is made from a Novamont resin, derived from corn starch, in
combination with fully biodegradable aliphatic polyesters, aliphatic/aromatic polyesters or in particular
polylactic acid. Ecoflex is an aliphatic-aromatic copolyester based on 1,4-butanediol and the dicarboxylic
acids, adipic acid and terephthalic acid. Biogas production from these seven substrates was compared
with that produced from Kraft paper. Food waste was added to provide a source for the macro and micro
elements necessary for microorganism growth
Test Procedures
The degradable samples, 1g each, were combined with food waste in one-liter bottles. Each reactor bottle
was purged with helium gas for five minutes to ensure anaerobic conditions. All experiments were
performed in duplicate under thermophilic conditions at 50oC. The initial pH of all the materials was 7.4.
Total solids and volatile solids of the sludge and food waste were measured according to the ASTM
D5630 and Amirel standard methods for 43 days. Pressure was measured daily in each of the batch
reactors headspace using a WAL-BMP-Test system pressure gauge. The biogas in the reactors headspace
was released under water to prevent any gas exchange between the reactor and the air. Biogas volumes of
each reactor were determined with the following equation:
R.T
CPVV head
Biogas Equation 1
Where VBiogas = daily biogas volume (L),
P = absolute pressure difference (mbar),
Vhead = volume of the head space (L),
C = molar volume (22.41 L mol-1
),
R = universal gas constant (83.14 L.mbar.K-1
.mol-1
),
T = absolute temperature (K).
The amounts of methane and carbon dioxide produced in each reactor were periodically measured using
gas chromatography, HP 5890 A, with 1.8 × 0.32 mm Alltech carbospher column. Helium was the carrier
gas at a flow rate of 60 ml/min. The temperatures of the oven and thermal conductivity detector were 100o
and 120o C, respectively. The gas flowed into a helium filled column where a thermal conductivity
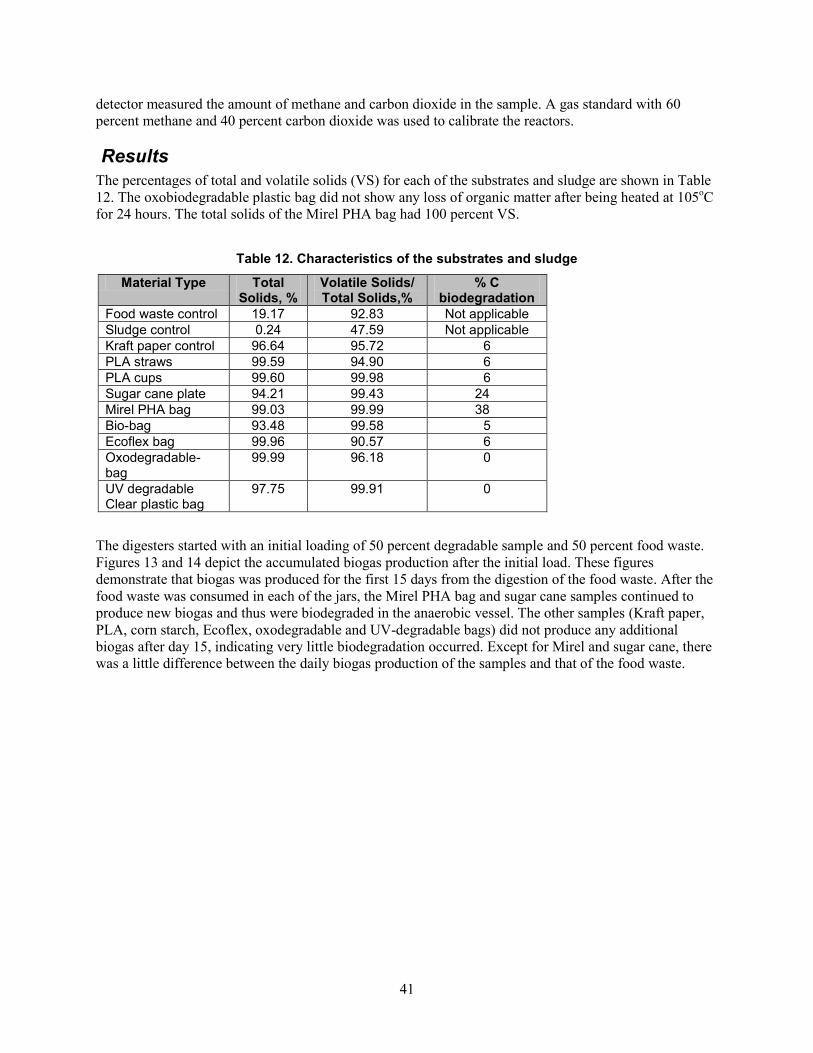
41
detector measured the amount of methane and carbon dioxide in the sample. A gas standard with 60
percent methane and 40 percent carbon dioxide was used to calibrate the reactors.
Results
The percentages of total and volatile solids (VS) for each of the substrates and sludge are shown in Table
12. The oxobiodegradable plastic bag did not show any loss of organic matter after being heated at 105oC
for 24 hours. The total solids of the Mirel PHA bag had 100 percent VS.
Table 12. Characteristics of the substrates and sludge
Material Type Total Solids, %
Volatile Solids/ Total Solids,%
% C biodegradation
Food waste control 19.17 92.83 Not applicable
Sludge control 0.24 47.59 Not applicable
Kraft paper control 96.64 95.72 6
PLA straws 99.59 94.90 6
PLA cups 99.60 99.98 6
Sugar cane plate 94.21 99.43 24
Mirel PHA bag 99.03 99.99 38
Bio-bag 93.48 99.58 5
Ecoflex bag 99.96 90.57 6
Oxodegradable-bag
99.99 96.18 0
UV degradable Clear plastic bag
97.75 99.91 0
The digesters started with an initial loading of 50 percent degradable sample and 50 percent food waste.
Figures 13 and 14 depict the accumulated biogas production after the initial load. These figures
demonstrate that biogas was produced for the first 15 days from the digestion of the food waste. After the
food waste was consumed in each of the jars, the Mirel PHA bag and sugar cane samples continued to
produce new biogas and thus were biodegraded in the anaerobic vessel. The other samples (Kraft paper,
PLA, corn starch, Ecoflex, oxodegradable and UV-degradable bags) did not produce any additional
biogas after day 15, indicating very little biodegradation occurred. Except for Mirel and sugar cane, there
was a little difference between the daily biogas production of the samples and that of the food waste.
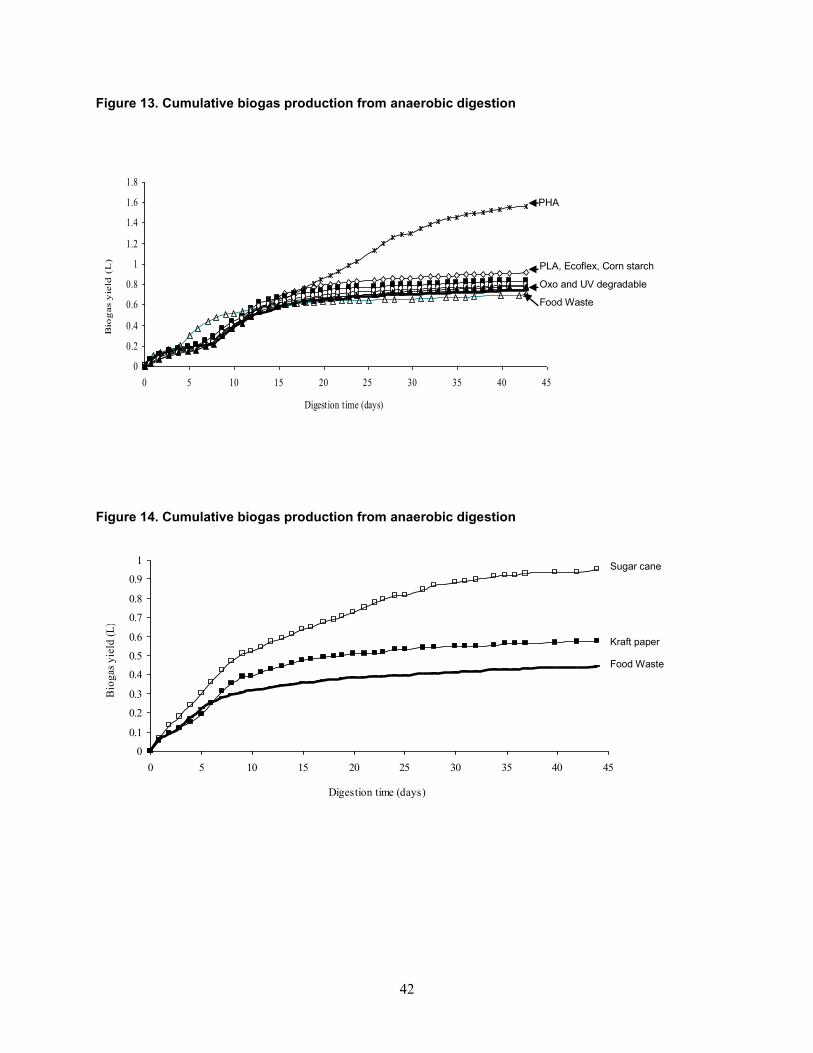
42
Figure 13. Cumulative biogas production from anaerobic digestion
Figure 14. Cumulative biogas production from anaerobic digestion
0
0.1
0.2
0.3
0.4
0.5
0.6
0.7
0.8
0.9
1
0 5 10 15 20 25 30 35 40 45
Digestion time (days)
Bio
gas
yie
ld (
L)
Paper Plates Food waste
Food Waste
Kraft paper
Sugar cane
0
0.2
0.4
0.6
0.8
1
1.2
1.4
1.6
1.8
0 5 10 15 20 25 30 35 40 45
Digestion time (days)
Bio
gas y
ield
(L
)
Bio bag Oxo bag Straws Yellow bag
Clear Eco flex Food waste Cups
PHA
PLA, Ecoflex, Corn starch
Oxo and UV degradable
Food Waste
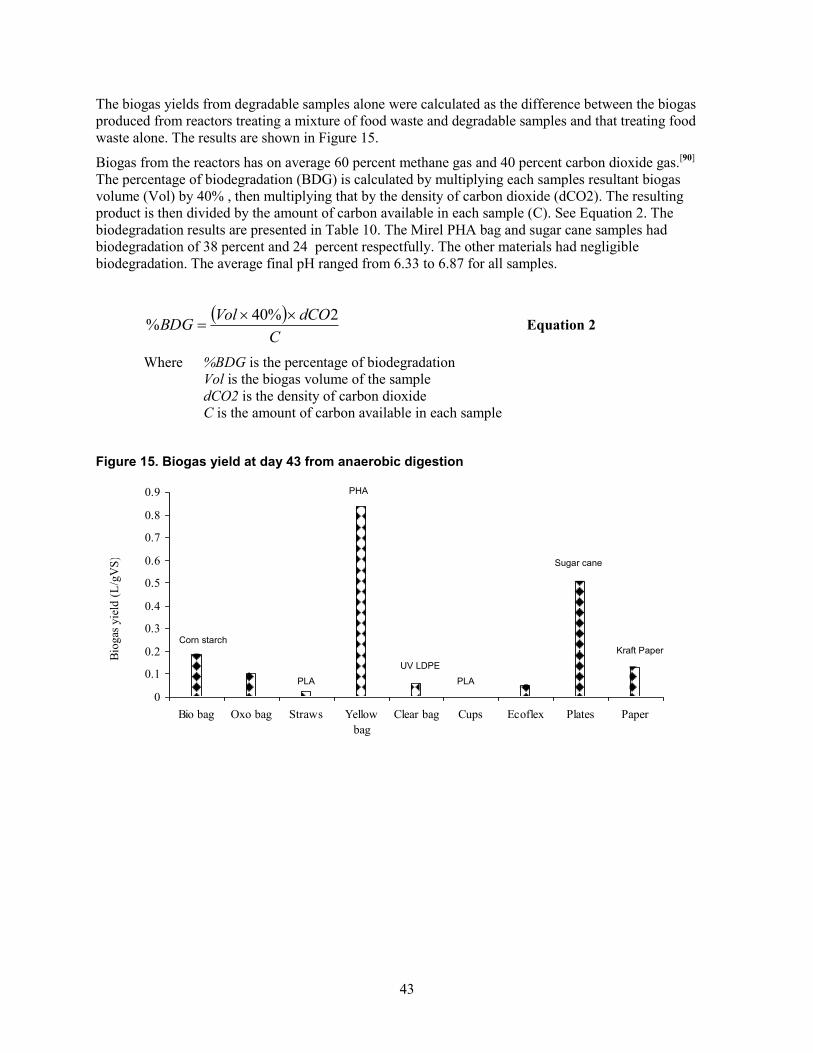
43
The biogas yields from degradable samples alone were calculated as the difference between the biogas
produced from reactors treating a mixture of food waste and degradable samples and that treating food
waste alone. The results are shown in Figure 15.
Biogas from the reactors has on average 60 percent methane gas and 40 percent carbon dioxide gas.[90]
The percentage of biodegradation (BDG) is calculated by multiplying each samples resultant biogas
volume (Vol) by 40% , then multiplying that by the density of carbon dioxide (dCO2). The resulting
product is then divided by the amount of carbon available in each sample (C). See Equation 2. The
biodegradation results are presented in Table 10. The Mirel PHA bag and sugar cane samples had
biodegradation of 38 percent and 24 percent respectfully. The other materials had negligible
biodegradation. The average final pH ranged from 6.33 to 6.87 for all samples.
C
dCOVolBDG
2%40%
Equation 2
Where %BDG is the percentage of biodegradation
Vol is the biogas volume of the sample
dCO2 is the density of carbon dioxide
C is the amount of carbon available in each sample
Figure 15. Biogas yield at day 43 from anaerobic digestion
0
0.1
0.2
0.3
0.4
0.5
0.6
0.7
0.8
0.9
Bio bag Oxo bag Straws Yellow
bag
Clear bag Cups Ecoflex Plates Paper
Bio
gas
yie
ld (
L/g
VS
)
Corn starch
PLA
PHA
PLA
UV LDPE
Sugar cane
Kraft Paper
44
Composting Environments
The biodegradable and oxodegradable materials were placed in four compost environments, including,
traditional windrow, in-vessel manure, in-vessel food waste, and in-vessel municipal solid waste. All of
the compost facilities are commercial operations and produce compost for the public.
City of Chico Municipal Compost Facility
The City of Chico municipal compost facility is located on a 10-acre site that produces 500,000 cubic
yards of compost each year via aerobic windrow compost. The compost is mixed using a windrow turner.
The turning machine straddles a windrow of approximately eight feet high by 13 feet across. Turners
drive through the windrow at a slow rate of forward movement. A steel drum with paddles turns the
compost rapidly. As the turner moves through the windrow, fresh air (oxygen) is injected into the
compost by the drum/paddle assembly and waste gases produced by harmful bacteria are removed. The
oxygen feeds the beneficial composting bacteria and thus speeds the eventual composting process. This
process is then extended by windrow dynamics.[91]
The facility accepts green yard waste, which includes
lawn clippings, leaves, wood, sticks, weeds, and pruning. Testing in commercial compost facilities allows
the compostable plastics to be exposed to active compost that has a high degree of enzyme activity and
high temperatures.
Materials and Procedures
The food waste and plastic products from the cafeteria experiment were placed in the compost with
oxodegradable plastic bags and Kraft paper on May 10, 2006. Also buried were contaminants including:
paper cups with polyethylene liners, paper plates, plastic cups, plastic water bottles and plastic trash bags.
Portions of the waste collected from the one week bio-plastics demonstration at Chico State University
cafeteria were sent to the municipal compost site. Approximately, 1.5 yd3 was sent to the compost facility
on a dirt pad. During the experiment, the compost was turned with a windrow turner.
During the experiment, the moisture content of the compost was between 35 and 55 percent and the
temperature of the compost ranged from 48C to 65C. The temperature of the outside air ranged from
35C to 43C. Pictures of the plastic fragments during this experiment are provided in Appendix C.
After 120 days, the compost pile was screened to remove the debris. The compost was tested for moisture
percentage, temperature, pH, compost maturity, and percent solids. The compost maturity index can be
defined as compost that is resistant to further decomposition and free of compounds, such as ammonia
and organic acids, that can be poisonous to plant growth. The disintegration of products was monitored
for sample fragments after 30, 60, 90 and 120 day test intervals.
Results
After 90 days, the PLA spoons, knives, and lids had completely disintegrated. The compostable plastics,
including, sugar cane, BioBag, PLA containers, PLA cups, and sugar cane plates had noticeable
biodegradation and were broken into fragments. The oxodegradable and UV-degradable plastics were
completely intact and did not show any signs of disintegration.
After 120 days, PLA forks, spoons, knives, and lids, sugar cane lids and plates were completely
biodegraded and no fragments were found. Small fragments of PLA cups, PLA container, and corn starch
trash bags were visible. The small PLA fragments resulted from the way in which the PLA container and
cup broke down and were turned by the auger machine. The fragments had a higher surface area than the
PLA forks, spoons, and straws. The higher surface area made the PLA cup and container fragments less
dense and susceptible to gathering on the surface of the compost pile rather than below the surface.
Biodegradable polymers, like PLA, will degrade very little when not in a hot compost environment.
45
Approximately, 750 PLA cups, 500 clamshell containers, and 15 trash bags were buried in the municipal
compost site. Approximately, four PLA cup and container fragments were found. The four fragments
would equal the mass of one cup for an overall PLA degradation rate of 99.92 percent.
The green Eco-safe oxodegradable bags were broken into pieces from the windrow turner, but did not
appear to degrade. The oxo-biodegradable plastic bags were full-sized and did not appear to experience
any degradation. The plastic waster bottles did not degrade nor did the polyethylene lined paper soft drink
cups.
University Farm In-vessel Compost Facility
The university farm uses cow manure and straw to create a compost material that is sold commercially.
The university farm environment represents a commercial compost facility with very active manure-based
compost that should provide a high degree of enzyme activity and nutrients for the compostable materials
to degrade. The University Farm at California State University Chico produces 250-tons of compost from
dairy manure and rice straw annually using conventional windrow methods. The nutrient composition, or
NPK, is 1.2 parts Nitrogen to 0.5 parts Phosphorous to 1.5 parts Potassium. The organic matter content is
approximately 30 percent and the pH is 8. The fecal coli forms count is 0, the E. coli is 0 counts, and
Salmonella is 0 counts. The heavy metals content of the compost was negative for arsenic, lead and
mercury. [92]
Materials and Procedures
The materials buried at the university farm compost site were food waste and biodegradable products
including: PLA cups, forks, spoons, knives, clamshell containers, lids, and straws, sugar cane plates, and
corn starch trash bags. Also buried were contaminants which included paper cups with polyethylene
liners, paper plates, plastic cups, plastic water bottles and plastic trash bags.
The food waste, plastic products, and compost were placed in the compost mound. The temperature and
moisture of the compost were measured and the ambient temperature and weather conditions were
recorded. Portions of the waste collected from the one week bio-plastics demonstration at Chico State
University cafeteria were sent to the farm compost site. Approximately, 0.5 yd3 was sent to the university
farm site and buried on May 9, 2006, under an in-vessel Ag-bag environment on a concrete surface pad.
After 30-days the in-vessel was removed and the compost was turned in a traditional windrow operation
for 90 days. The compost was tested for moisture percentage, pH, compost maturity, and percent solids.
The disintegration of products was monitored after 30, 60, 90 and 120 day test intervals.
During the experiment, the moisture content of the compost was between 35 and 55 percent and the
temperature of the compost ranged from 48C to 64C. The temperature of the outside air ranged from
35C to 43C. Pictures of the plastic fragments during this experiment are provided in Appendix D.
Results
After 120 days, the materials that completely degraded were similar to the green-yard waste compost
results and included PLA forks, spoons, knives, and lids, sugar cane lids and plates. Small fragments of
PLA cups and PLA container, and corn starch trash bags were visible. As in the green yard-waste
compost site, the small PLA fragments resulted from the way in which the PLA container and cup broke
down and were turned by the auger machine. Approximately, 250 PLA cups, 160 clamshell containers,
and six trash bags were buried in the municipal compost site. Approximately, three PLA cup and
container fragments were found. The three fragments would equal the mass of half of a cup for an overall
PLA degradation rate of 99.88 percent.
46
Vacaville In-vessel Food-waste Compost Facility
The facility is operated by Jepson Prairie Organics (JPO), a wholly owned subsidiary of Norcal Waste
Systems, Incorporated. The facility processes 80,000 tons of kitchen trimmings, plate scrapings, and other
food scraps from San Francisco restaurants, hotels, and food scraps gathered from the City residents. The
Jepson Prairie's facility transforms the food waste into 30,000 tons of organic compost a year.
Materials and Procedures
The food waste and plastic products from the cafeteria experiment were placed in the compost with
oxodegradable plastic bags and Kraft paper. Approximately, 4 yd3 was sent to the compost facility on a
dirt pad. Originally, the degradable samples were placed in the compost pile in their native form.
However, due to the large amount of debris in the compost pile, identification of the biodegradable and
degradable samples was difficult and the experiment was stopped.
Alternatively, the biodegradable and degradable samples were placed in a burlap sack along with
municipal solid waste (MSW) from the compost site and then buried in the in-vessel compost on June 13,
2006. The degradable and compostable samples were mixed with other MSW and placed on the dirt under
an 8-mil thick plastic bag for the in-vessel composting operation. The compostable samples included,
corn starch based BioBag, Mirel bag, Biotuf Ecoflex bag, Husky bag, PLA lids, sugar cane lids, and Kraft
paper. Also buried were polyethylene shrinkwrap, UV degradable plastic bag, and oxodegradable plastic
bag. Additionally, contaminants were buried including: paper cups with polyethylene liners, paper plates,
plastic cups, plastic water bottles and plastic trash bags.
After 30-days the in-vessel was removed and the compost was turned in a traditional windrow operation
for an additional 30 days. At the end of 60 days the compost was screened and the separated compost was
placed in a static pile for 60 to 120 days. The compost was turned with a windrow turner twice per week
to aerate the compost pile. The temperature and moisture of the compost in the bag were measured and
the ambient temperature and weather conditions were recorded.
After 60 days, the compost pile was screened to remove the debris. Due to partial tearing of the burlap
sacks, they were removed after 60 days and buried in a perforated plastic bag in a static pile. The compost
was tested for moisture percentage, temperature, pH, compost maturity, and percent solids. The
disintegration of products was monitored for sample fragments after 30, 60, 90 and 180-day test intervals.
During the experiment, the moisture content of the compost was between 30 and 55 percent and the
temperature of the compost ranged from 55C to 70C. The temperature of the outside air ranged from
-5C to 40C. Pictures of the plastic fragments during this experiment are provided in Appendix E.
Results
After 180 days, the materials that completely degraded included PLA lids, Mirel bags, Ecoflex bags,
Husky bags, and corn starch trash bags. Small fragments of sugar cane lids and Kraft paper were visible.
The sugar cane and Kraft paper fragments were very moist and disintegrated when picked up.
The Kraft paper and sugar cane fragments did not completely biodegrade as there was no mechanical
agitation while in the plastic sacks. If the materials were placed in the compost soil, higher degradation
would occur due to better interaction with the compost soil.
The oxo-biodegradable plastic bags, LDPE plastic bags, and UV-degradable plastic bag did not appear to
experience any degradation.
Mariposa County In-vessel MSW Compost Facility
This composting facility is located at the Mariposa landfill. The 50,000 ft2 facility can accept
approximately 40 tons of municipal solid waste (MSW) per day. The in-vessel composting process
47
utilizes the Engineered Compost System (ECS).[93]
The SV ComposterTM
features excellent control of
temperature and moisture in an enclosed room made from concrete and stainless steel. The MSW is
placed in the room and air is evenly distributed to the composting materials through perforated floor
covers. Moisture and water runoff is collected in the floor and drained to a sump. The water removal
helps reduce anaerobic conditions. The ECS in-vessel composting process has a PC-based system control
that measures the temperature, and pressure from several locations in the compost pile and compost
vessel. The MSW materials undergo a temperature regime that destroys pathogens in the first three days
and then maximizes composting over the next three weeks with proper aeration, drainage, and
temperature control. The in-vessel compost is typically heated to 60C for three days and then maintained
at 58C for 14 to 21 days. The composting process typically reduces the volume of the MSW by 30 to 60
percent.
Materials and Procedures
Biodegradable, compostable, controls, and oxodegradable samples were placed in burlap sacks along with
municipal solid waste (MSW) from the compost site and then buried in the in-vessel compost.
Approximately, 80 g of full-sized samples were mixed with approximately, 1 kg of MSW. As with the
Vacaville compost experiment, the samples included, corn starch based BioBag, Mirel bag, BioTuf
Ecoflex bag, Husky bag, PLA lids, sugar cane lids, and Kraft paper. Also buried were polyethylene
shrink-wrap, UV degradable plastic bag, and oxodegradable plastic bag. Debris included plastic water
bottles, plastic cups, paper cups, plastic straws, newspaper, glass bottles, metal lids, miscellaneous paper
products, and plastic bags.
The compostable and degradable plastics were buried on September 30, 2006. After 14 days the
experiment had to be restarted due to problems with the compost that resulted in low temperatures. Green
yard waste and manure were added to the vessel and the process was restarted on October 15, 2006. The
temperature and moisture of the compost were recorded by the process control unit. After 50 days the
materials were removed from the ECS vessel and placed on a concrete pad to cool and aerate. Biofilters
remove noxious gases from the compost. The experiment ended on December 3, 2006.
Typically, the compost pile is screened for recyclable materials, e.g., glass, metal, and plastic, and for
debris. The recyclable materials are recovered and the debris waste is sent to the landfill. The screened
compost is used as cover for the landfill. In our experiment, the compostable and biodegradable samples
were removed from the burlap sacks and placed in perforated plastic bags. Some of the burlap sacks had
holes in them. The samples and bags were relocated to the Vacaville compost site and placed in the static
pile for further composting for an additional 120 days.
During the experiment, the average top temperature was 56.4C, the average bottom temperature was
56.3C, the supply pressure was 1.5 in H2O, the air supply temperature was 28.2C, and the exhaust
temperature was 34.7C. Pictures of the plastic fragments during this experiment are provided in
Appendix F.
Results
After 180 days, the results were identical to the Vacaville in-vessel compost results. The materials that
completely degraded included PLA lids, Mirel bags, Ecoflex bags, Husky bags, and corn starch trash
bags. Small fragments of sugar cane lids and Kraft paper were visible. Similar to the Vacaville compost
results, the sugar cane and Kraft paper fragments were very moist and would disintegrate when picked up.
The Kraft paper and sugar cane fragments did not completely biodegrade due to the segregation in the
plastic sacks. If the materials were placed in the compost soil, higher degradation would occur due to
better interaction with the compost soil.
The oxo-biodegradable plastic bags, LDPE plastic bags and UV-degradable plastic bag did not appear to
experience any degradation.
48
Contamination Effects of Degradable Plastics on Recycled Plastics
Polyvinyl chloride (PVC) is a contaminant to polyethylene terephthalate (PET) and high density
polyethylene (HDPE). PVC concentrations as low as 200 ppm can significantly degrade PET during the
compounding extrusion process. PVC contamination can also cause discoloration of the PET, lower
intrinsic viscosity, and cause black streaks and specks in molded products.[94]
Also, PVC contamination
can lead to excessive corrosion of the processing equipment due to the evolution of hydrochloric acid
from the degraded PVC.[95]
LDPE can be contaminated with HDPE, which can cause severe processing
problems in plastic bag manufacturing. HDPE containers can be contaminated with PVC, PS, PP, and
glues from labels.
Contamination effects are minimized by improved sorting techniques and by regular testing of incoming
materials. Automated sorting methods efficiently and quickly sort the plastic using spectroscopic
techniques. Hundreds of identifications per second can help sort plastics with more than 99 percent
accuracy[96]
at throughput rates of 2,000 kg per hour.[97]
Post consumer resin (PCR) quality can be improved with a quality assurance protocol that provides
efficient, reliable and practical test methods for PCR.[98]
The testing includes melt index, density, and
moisture percent of PCR.[99]
Degradable plastics can negatively affect the quality and mechanical properties of recycled plastics if they
are mixed with the recycled plastics. The contamination of degradable, biodegradable, and
oxodegradable plastics can be treated as other contamination to plastics. The effects of the degradable
contamination can be evaluated by measuring physical properties and mechanical properties of the
plastics. In particular, PET contaminated with PLA, HDPE contaminated with PLA, LDPE contaminated
with oxodegradable plastic, and LDPE contaminated with corn-starch based biodegradable plastic can all
be evaluated. The effects are measured for melt index, density, moisture percentage, and voids and
bubbles in 1‖ film. The mechanical properties include tensile and impact properties.
Test Procedures
The effects of contamination were evaluated by mixing contaminants with the appropriate recycled plastic
material and then injection molding them into tensile and impact bars. The LDPE and HDPE post-
industrial recycled plastic material was provided by Bay Polymers. PLA was dry mixed with PET and
HDPE at 5 percent and 10 percent by weight concentrations. Unfortunately, injection molding of the PET
was not successful due to the very high melt index of the PET. HDPE was injection molded successfully.
Oxodegradable and biodegradable BioBag were first cut into small pieces and then placed in an infrared
oven where they softened. The plastic pieces were pressed into thin sheets and then chopped in a grinder
to create a master batch of 100 percent plastic pellets. The master batch plastic pellets were dry-mixed
with LDPE pellets and then injection molded.
The pellets were injection molded into tensile bars with an Arburg 320-A 55-ton injection-molding
machine. The LDPE and HDPE tensile bars were produced with the following conditions: rear
temperature of 200C, center zone temperature of 230C, front zone temperature of 240C, nozzle
temperature of 240C, injection pressure of 203 MPa, pack pressure of 105 MPa, cool time of 35 seconds,
injection time of one second, and pack time of one second. Thirty tensile-bar and impact bar samples
were molded for each material with a purge of Insta-purge between each material type.
Results
The moisture was very low in all of the plastic materials. The oxodegradable plastic had the same
moisture content as LDPE. PLA-HDPE and biodegradable BioBag-LDPE plastics had slightly higher
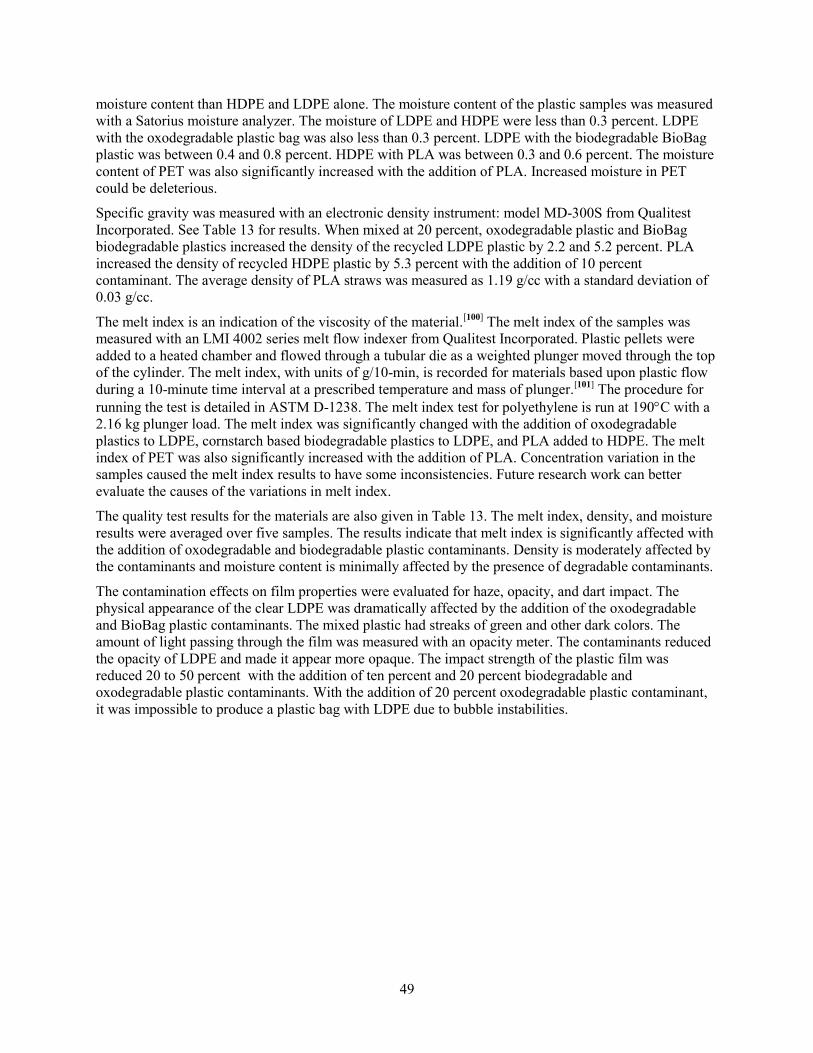
49
moisture content than HDPE and LDPE alone. The moisture content of the plastic samples was measured
with a Satorius moisture analyzer. The moisture of LDPE and HDPE were less than 0.3 percent. LDPE
with the oxodegradable plastic bag was also less than 0.3 percent. LDPE with the biodegradable BioBag
plastic was between 0.4 and 0.8 percent. HDPE with PLA was between 0.3 and 0.6 percent. The moisture
content of PET was also significantly increased with the addition of PLA. Increased moisture in PET
could be deleterious.
Specific gravity was measured with an electronic density instrument: model MD-300S from Qualitest
Incorporated. See Table 13 for results. When mixed at 20 percent, oxodegradable plastic and BioBag
biodegradable plastics increased the density of the recycled LDPE plastic by 2.2 and 5.2 percent. PLA
increased the density of recycled HDPE plastic by 5.3 percent with the addition of 10 percent
contaminant. The average density of PLA straws was measured as 1.19 g/cc with a standard deviation of
0.03 g/cc.
The melt index is an indication of the viscosity of the material.[100]
The melt index of the samples was
measured with an LMI 4002 series melt flow indexer from Qualitest Incorporated. Plastic pellets were
added to a heated chamber and flowed through a tubular die as a weighted plunger moved through the top
of the cylinder. The melt index, with units of g/10-min, is recorded for materials based upon plastic flow
during a 10-minute time interval at a prescribed temperature and mass of plunger.[101]
The procedure for
running the test is detailed in ASTM D-1238. The melt index test for polyethylene is run at 190C with a
2.16 kg plunger load. The melt index was significantly changed with the addition of oxodegradable
plastics to LDPE, cornstarch based biodegradable plastics to LDPE, and PLA added to HDPE. The melt
index of PET was also significantly increased with the addition of PLA. Concentration variation in the
samples caused the melt index results to have some inconsistencies. Future research work can better
evaluate the causes of the variations in melt index.
The quality test results for the materials are also given in Table 13. The melt index, density, and moisture
results were averaged over five samples. The results indicate that melt index is significantly affected with
the addition of oxodegradable and biodegradable plastic contaminants. Density is moderately affected by
the contaminants and moisture content is minimally affected by the presence of degradable contaminants.
The contamination effects on film properties were evaluated for haze, opacity, and dart impact. The
physical appearance of the clear LDPE was dramatically affected by the addition of the oxodegradable
and BioBag plastic contaminants. The mixed plastic had streaks of green and other dark colors. The
amount of light passing through the film was measured with an opacity meter. The contaminants reduced
the opacity of LDPE and made it appear more opaque. The impact strength of the plastic film was
reduced 20 to 50 percent with the addition of ten percent and 20 percent biodegradable and
oxodegradable plastic contaminants. With the addition of 20 percent oxodegradable plastic contaminant,
it was impossible to produce a plastic bag with LDPE due to bubble instabilities.
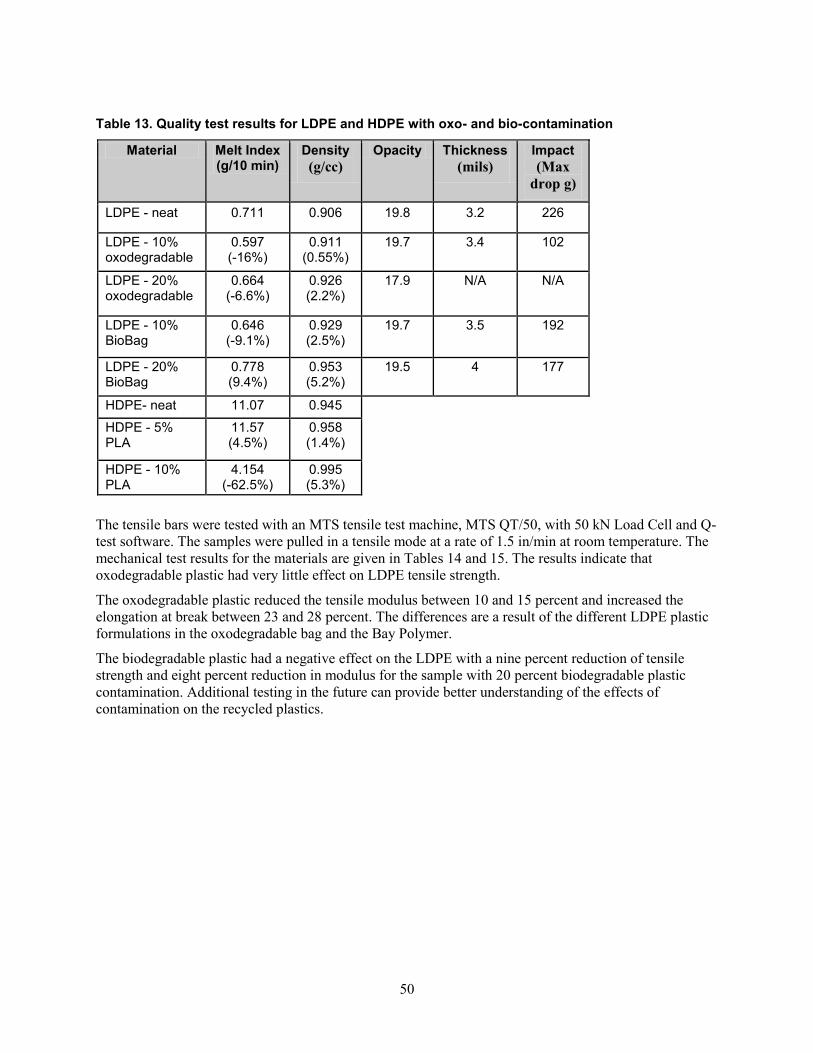
50
Table 13. Quality test results for LDPE and HDPE with oxo- and bio-contamination
Material Melt Index (g/10 min)
Density
(g/cc)
Opacity Thickness
(mils)
Impact
(Max
drop g)
LDPE - neat 0.711 0.906 19.8 3.2 226
LDPE - 10% oxodegradable
0.597 (-16%)
0.911 (0.55%)
19.7 3.4 102
LDPE - 20% oxodegradable
0.664 (-6.6%)
0.926 (2.2%)
17.9 N/A N/A
LDPE - 10% BioBag
0.646 (-9.1%)
0.929 (2.5%)
19.7 3.5 192
LDPE - 20% BioBag
0.778 (9.4%)
0.953 (5.2%)
19.5 4 177
HDPE- neat 11.07 0.945
HDPE - 5% PLA
11.57 (4.5%)
0.958 (1.4%)
HDPE - 10% PLA
4.154 (-62.5%)
0.995 (5.3%)
The tensile bars were tested with an MTS tensile test machine, MTS QT/50, with 50 kN Load Cell and Q-
test software. The samples were pulled in a tensile mode at a rate of 1.5 in/min at room temperature. The
mechanical test results for the materials are given in Tables 14 and 15. The results indicate that
oxodegradable plastic had very little effect on LDPE tensile strength.
The oxodegradable plastic reduced the tensile modulus between 10 and 15 percent and increased the
elongation at break between 23 and 28 percent. The differences are a result of the different LDPE plastic
formulations in the oxodegradable bag and the Bay Polymer.
The biodegradable plastic had a negative effect on the LDPE with a nine percent reduction of tensile
strength and eight percent reduction in modulus for the sample with 20 percent biodegradable plastic
contamination. Additional testing in the future can provide better understanding of the effects of
contamination on the recycled plastics.
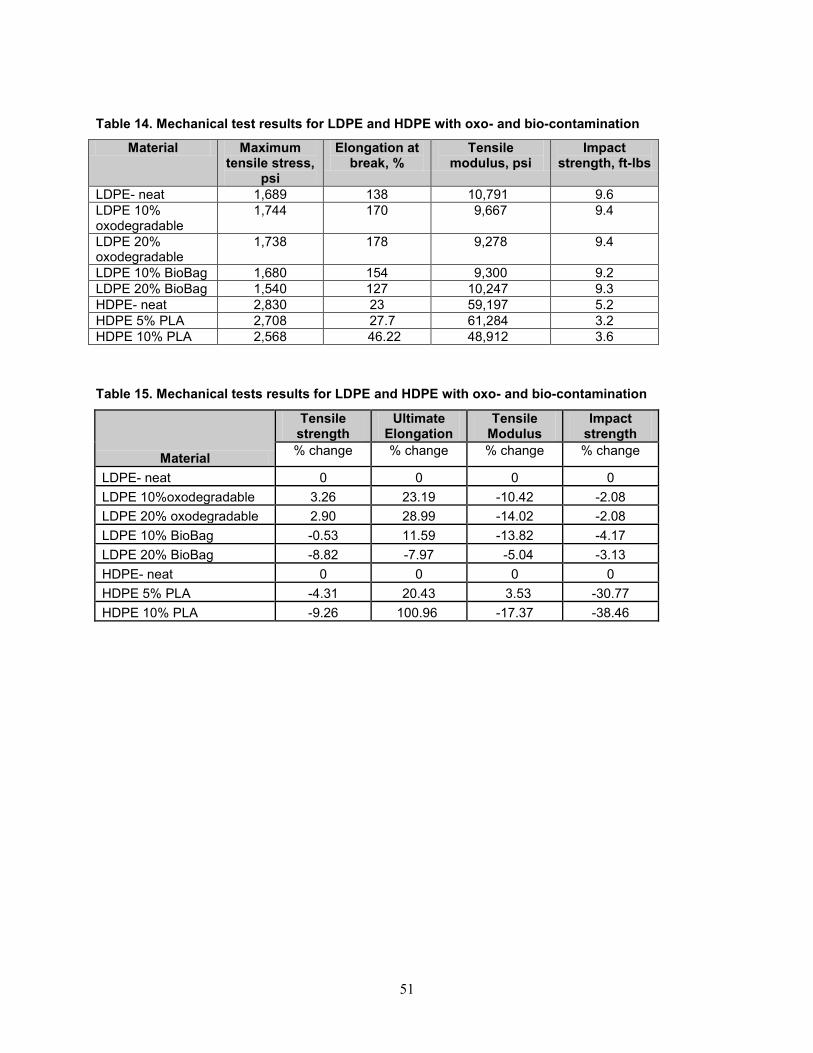
51
Table 14. Mechanical test results for LDPE and HDPE with oxo- and bio-contamination
Material Maximum tensile stress,
psi
Elongation at break, %
Tensile modulus, psi
Impact strength, ft-lbs
LDPE- neat 1,689 138 10,791 9.6
LDPE 10% oxodegradable
1,744 170 9,667 9.4
LDPE 20% oxodegradable
1,738 178 9,278 9.4
LDPE 10% BioBag 1,680 154 9,300 9.2
LDPE 20% BioBag 1,540 127 10,247 9.3
HDPE- neat 2,830 23 59,197 5.2
HDPE 5% PLA 2,708 27.7 61,284 3.2
HDPE 10% PLA 2,568 46.22 48,912 3.6
Table 15. Mechanical tests results for LDPE and HDPE with oxo- and bio-contamination
Material
Tensile strength
Ultimate Elongation
Tensile Modulus
Impact strength
% change % change % change % change
LDPE- neat 0 0 0 0
LDPE 10%oxodegradable 3.26 23.19 -10.42 -2.08
LDPE 20% oxodegradable 2.90 28.99 -14.02 -2.08
LDPE 10% BioBag -0.53 11.59 -13.82 -4.17
LDPE 20% BioBag -8.82 -7.97 -5.04 -3.13
HDPE- neat 0 0 0 0
HDPE 5% PLA -4.31 20.43 3.53 -30.77
HDPE 10% PLA -9.26 100.96 -17.37 -38.46
52
Conclusions and Recommendations
In developing state and local policy related to the environmentally beneficial uses of degradable plastics,
decision-makers should first consider the implications of any policy or program decision on the affected
waste diversion and disposal systems, and those that use it. This is because improvement in one area of a
system can sometimes adversely affect another part of the system. For example, it is clear that
compostable plastic products could significantly increase food scrap and greenwaste diversion because
food service ware could be composted along with food scraps, and the bags used to collect greenwaste
would not need to be separated before composting. However, degradable plastics could also contaminate
the existing plastic recycling stream if they are not properly collected and composted, thus reducing
plastic recycling opportunities. Further, while compostable bags meeting ASTM standards will degrade in
a compost environment (based on the experimental conditions of this study), most will not break down if
released as litter into the land or marine environments. Thus, it is important to understand that
biodegradable or compostable plastics are not a panacea for waste or litter reduction.
It is recommended that additional research be performed to:
Better understand the fate of degradable plastics in land and marine environments and to understand
the effect that degradation residues may have on wildlife, plants, and marine life.
To assess the environmental risks and fate of intermediate products of other biodegradable plastics in
composting environments.
Assess the life cycle costs incurred during the manufacturing, collection, and reprocessing of
compostable bags compared to the costs incurred managing conventional plastics through processing,
recycling, and disposal. Local governments need this information to make informed decisions on uses
for compostable bags.
Propose a law requiring the development of an identification code for compostable bags and
containers to help identify and separate compostable plastics from recyclable plastics. The presence
of degradable plastic material in regulated rigid plastic packaging containers and trash bags would
make compliance with present law very difficult and, as indicated above, would reduce plastic
recycling opportunities.
Evaluate other degradable plastics, including oxodegradable materials, in commercial compost
operations that utilize aerobic in-vessel composting.
Further investigate degradability in marine environments and life cycle assessments of the degradable
plastics.
Better understand the biodegradation of compostable and biodegradable polymers in the marine
environment.
Further evaluate the effects of contamination of the degradable plastics on recycled plastics.
Better evaluate the variations in melt index.
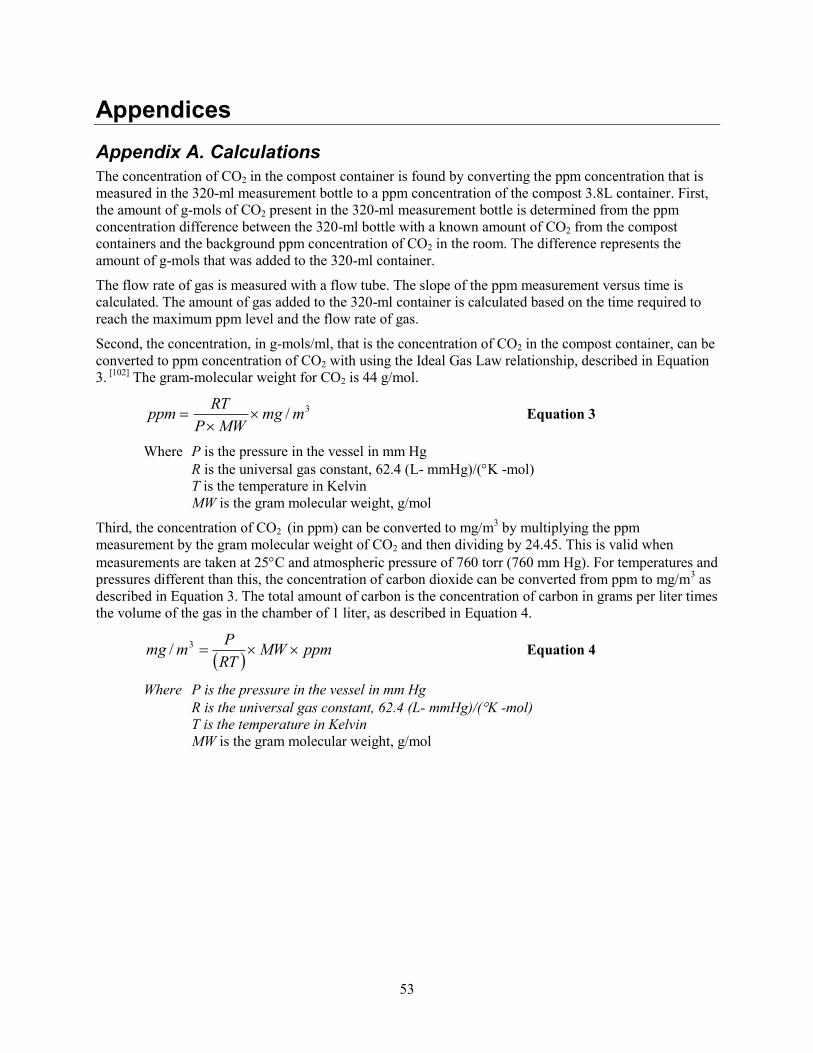
53
Appendices
Appendix A. Calculations
The concentration of CO2 in the compost container is found by converting the ppm concentration that is
measured in the 320-ml measurement bottle to a ppm concentration of the compost 3.8L container. First,
the amount of g-mols of CO2 present in the 320-ml measurement bottle is determined from the ppm
concentration difference between the 320-ml bottle with a known amount of CO2 from the compost
containers and the background ppm concentration of CO2 in the room. The difference represents the
amount of g-mols that was added to the 320-ml container.
The flow rate of gas is measured with a flow tube. The slope of the ppm measurement versus time is
calculated. The amount of gas added to the 320-ml container is calculated based on the time required to
reach the maximum ppm level and the flow rate of gas.
Second, the concentration, in g-mols/ml, that is the concentration of CO2 in the compost container, can be
converted to ppm concentration of CO2 with using the Ideal Gas Law relationship, described in Equation
3. [102]
The gram-molecular weight for CO2 is 44 g/mol.
3/ mmg
MWP
RTppm
Equation 3
Where P is the pressure in the vessel in mm Hg
R is the universal gas constant, 62.4 (L- mmHg)/(K -mol)
T is the temperature in Kelvin
MW is the gram molecular weight, g/mol
Third, the concentration of CO2 (in ppm) can be converted to mg/m3 by multiplying the ppm
measurement by the gram molecular weight of CO2 and then dividing by 24.45. This is valid when
measurements are taken at 25C and atmospheric pressure of 760 torr (760 mm Hg). For temperatures and
pressures different than this, the concentration of carbon dioxide can be converted from ppm to mg/m3 as
described in Equation 3. The total amount of carbon is the concentration of carbon in grams per liter times
the volume of the gas in the chamber of 1 liter, as described in Equation 4.
ppmMWRT
Pmmg 3/ Equation 4
Where P is the pressure in the vessel in mm Hg
R is the universal gas constant, 62.4 (L- mmHg)/(K -mol)
T is the temperature in Kelvin
MW is the gram molecular weight, g/mol
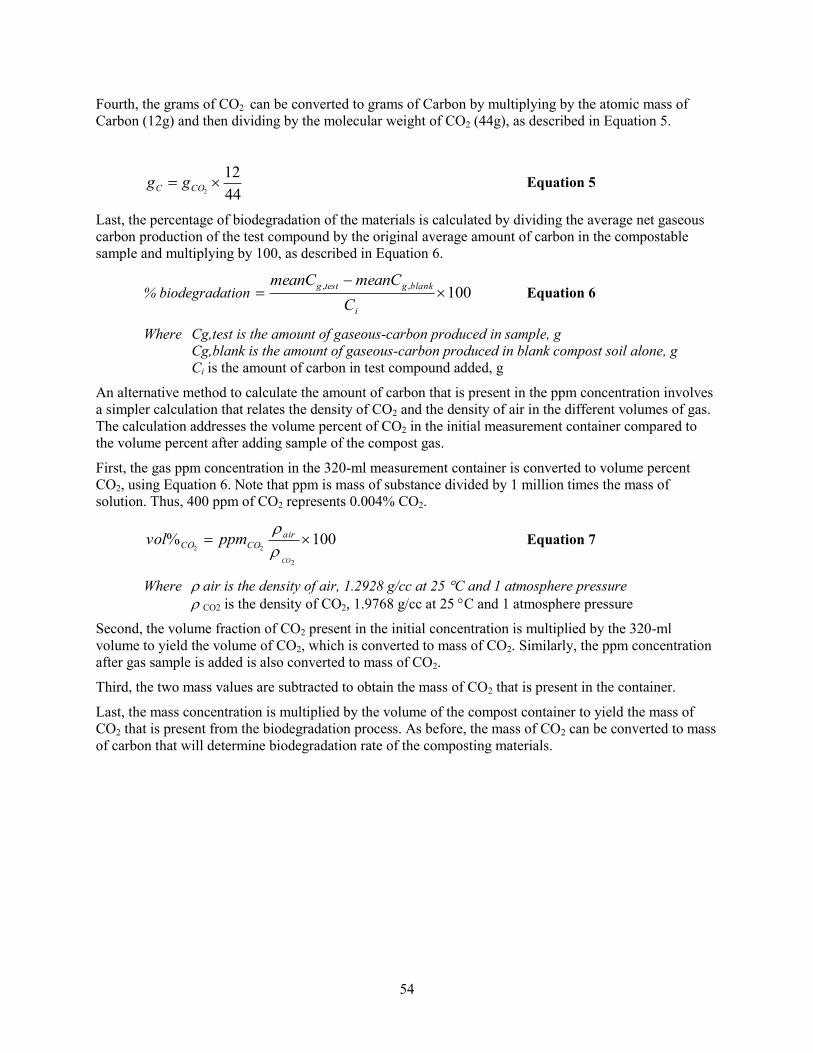
54
Fourth, the grams of CO2 can be converted to grams of Carbon by multiplying by the atomic mass of
Carbon (12g) and then dividing by the molecular weight of CO2 (44g), as described in Equation 5.
44
122 COC gg Equation 5
Last, the percentage of biodegradation of the materials is calculated by dividing the average net gaseous
carbon production of the test compound by the original average amount of carbon in the compostable
sample and multiplying by 100, as described in Equation 6.
% biodegradation 100,,
i
blankgtestg
C
meanCmeanC Equation 6
Where Cg,test is the amount of gaseous-carbon produced in sample, g
Cg,blank is the amount of gaseous-carbon produced in blank compost soil alone, g
Ci is the amount of carbon in test compound added, g
An alternative method to calculate the amount of carbon that is present in the ppm concentration involves
a simpler calculation that relates the density of CO2 and the density of air in the different volumes of gas.
The calculation addresses the volume percent of CO2 in the initial measurement container compared to
the volume percent after adding sample of the compost gas.
First, the gas ppm concentration in the 320-ml measurement container is converted to volume percent
CO2, using Equation 6. Note that ppm is mass of substance divided by 1 million times the mass of
solution. Thus, 400 ppm of CO2 represents 0.004% CO2.
100%
2
22
CO
air
COCO ppmvol
Equation 7
Where air is the density of air, 1.2928 g/cc at 25 C and 1 atmosphere pressure
CO2 is the density of CO2, 1.9768 g/cc at 25 C and 1 atmosphere pressure
Second, the volume fraction of CO2 present in the initial concentration is multiplied by the 320-ml
volume to yield the volume of CO2, which is converted to mass of CO2. Similarly, the ppm concentration
after gas sample is added is also converted to mass of CO2.
Third, the two mass values are subtracted to obtain the mass of CO2 that is present in the container.
Last, the mass concentration is multiplied by the volume of the compost container to yield the mass of
CO2 that is present from the biodegradation process. As before, the mass of CO2 can be converted to mass
of carbon that will determine biodegradation rate of the composting materials.
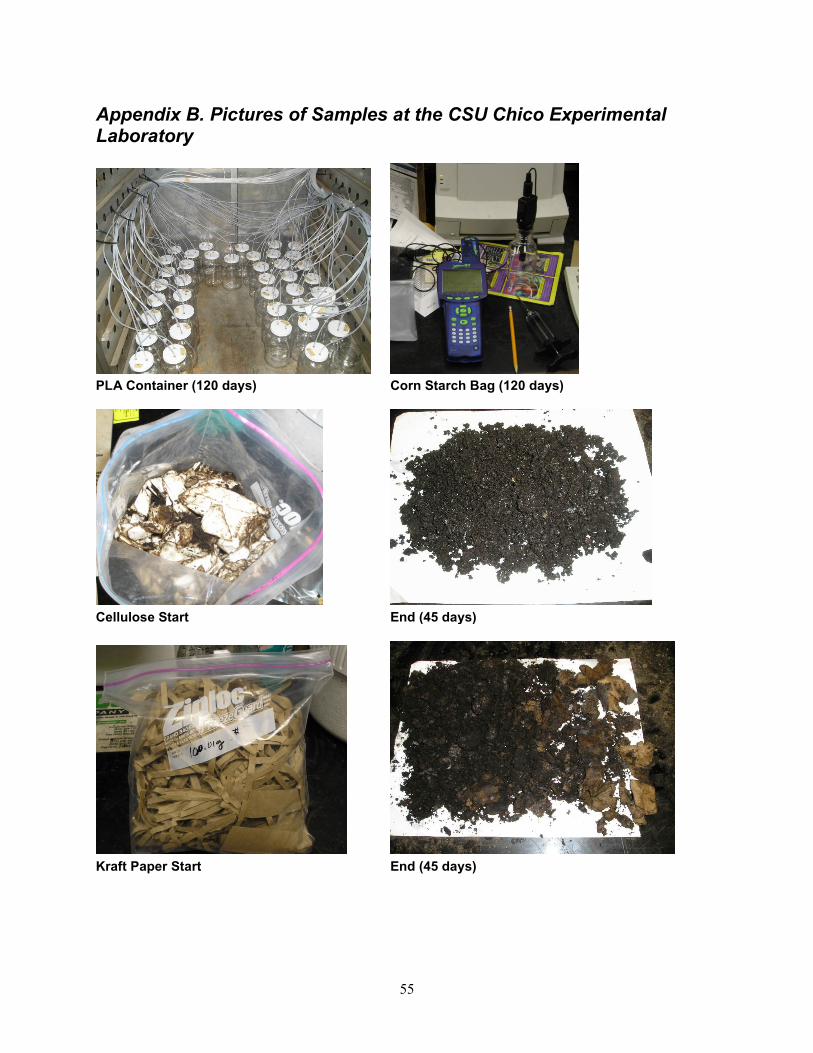
55
Appendix B. Pictures of Samples at the CSU Chico Experimental Laboratory
PLA Container (120 days)
Corn Starch Bag (120 days)
Cellulose Start
End (45 days)
Kraft Paper Start
End (45 days)
56
LDPE Bag Start
End (45 days)
BioBag Start
End (45 days)
PLA Start
End (45 days)
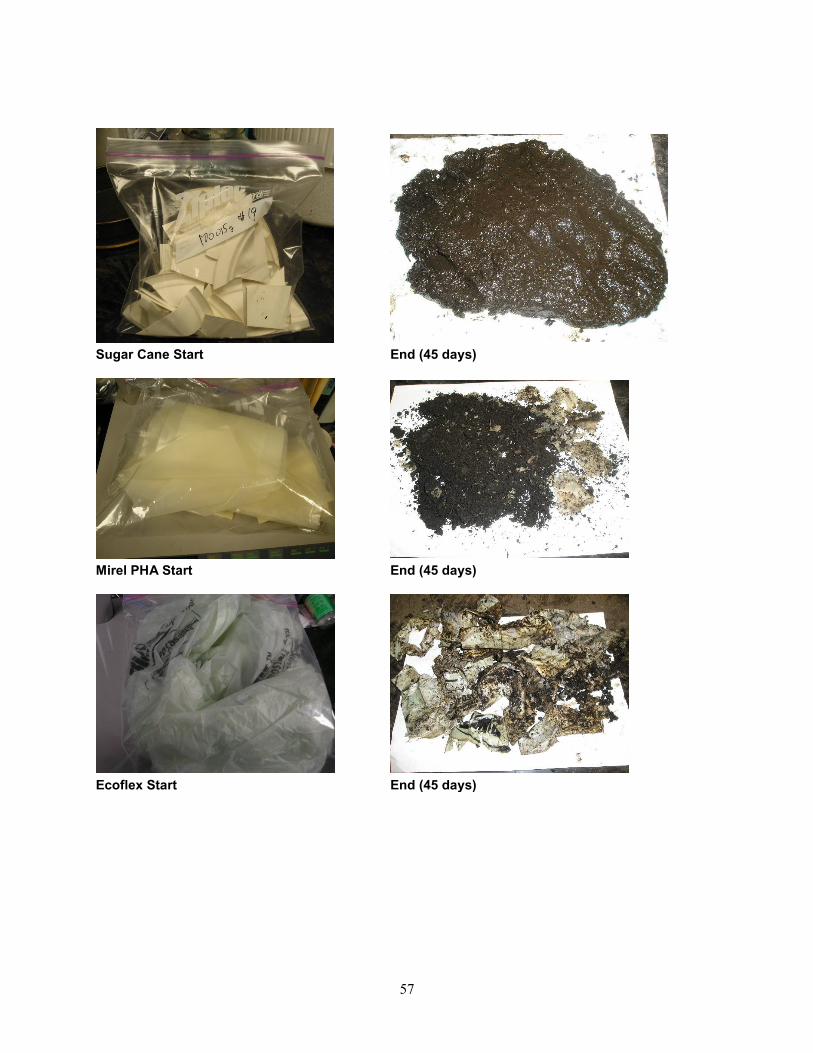
57
Sugar Cane Start
End (45 days)
Mirel PHA Start
End (45 days)
Ecoflex Start
End (45 days)
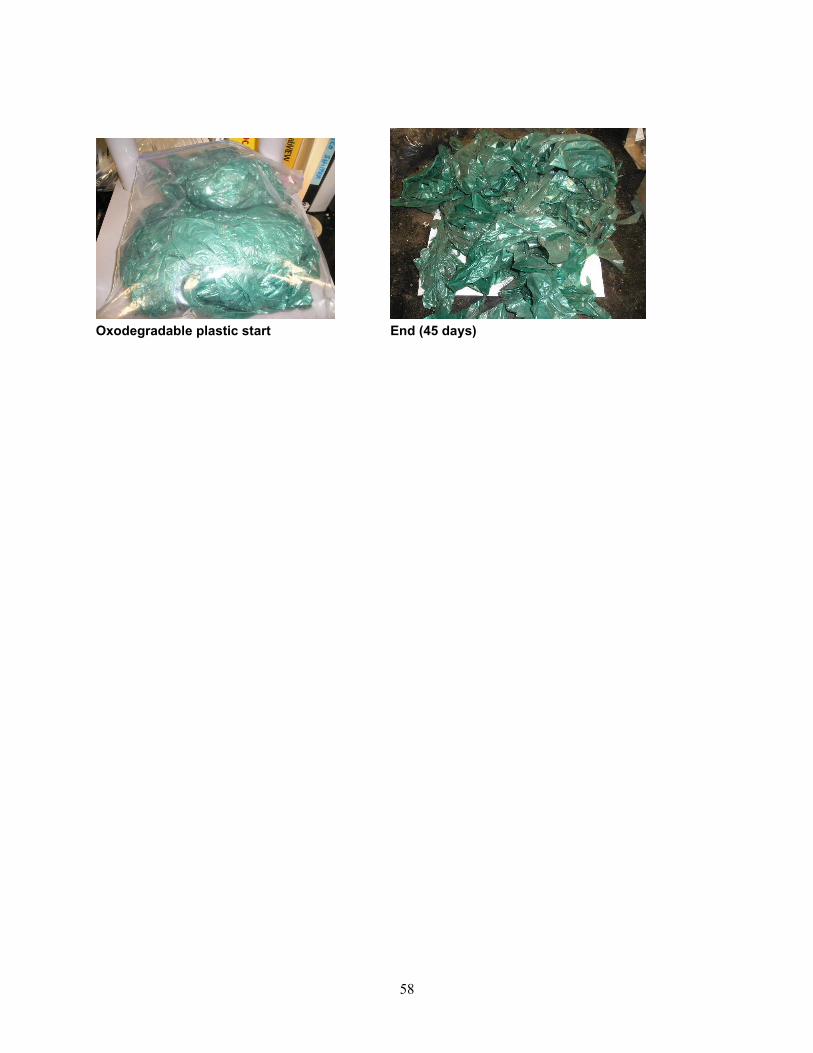
58
Oxodegradable plastic start
End (45 days)
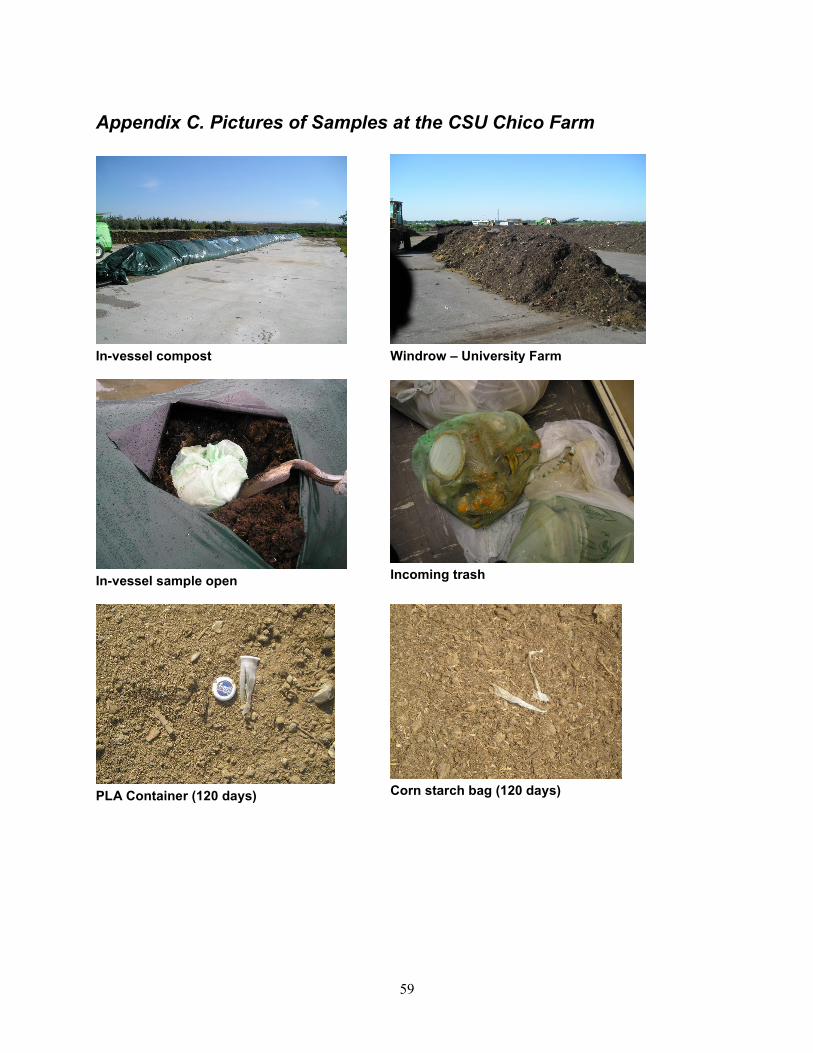
59
Appendix C. Pictures of Samples at the CSU Chico Farm
In-vessel compost
Windrow – University Farm
In-vessel sample open
Incoming trash
PLA Container (120 days)
Corn starch bag (120 days)
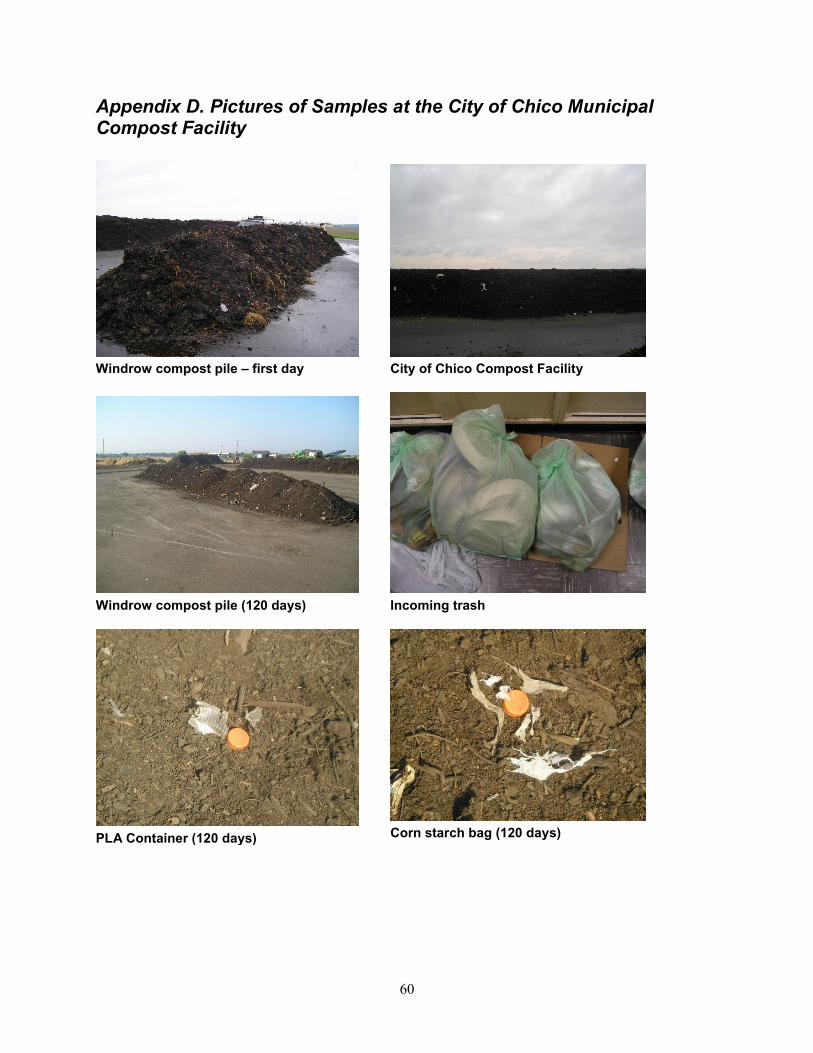
60
Appendix D. Pictures of Samples at the City of Chico Municipal Compost Facility
Windrow compost pile – first day
City of Chico Compost Facility
Windrow compost pile (120 days)
Incoming trash
PLA Container (120 days)
Corn starch bag (120 days)
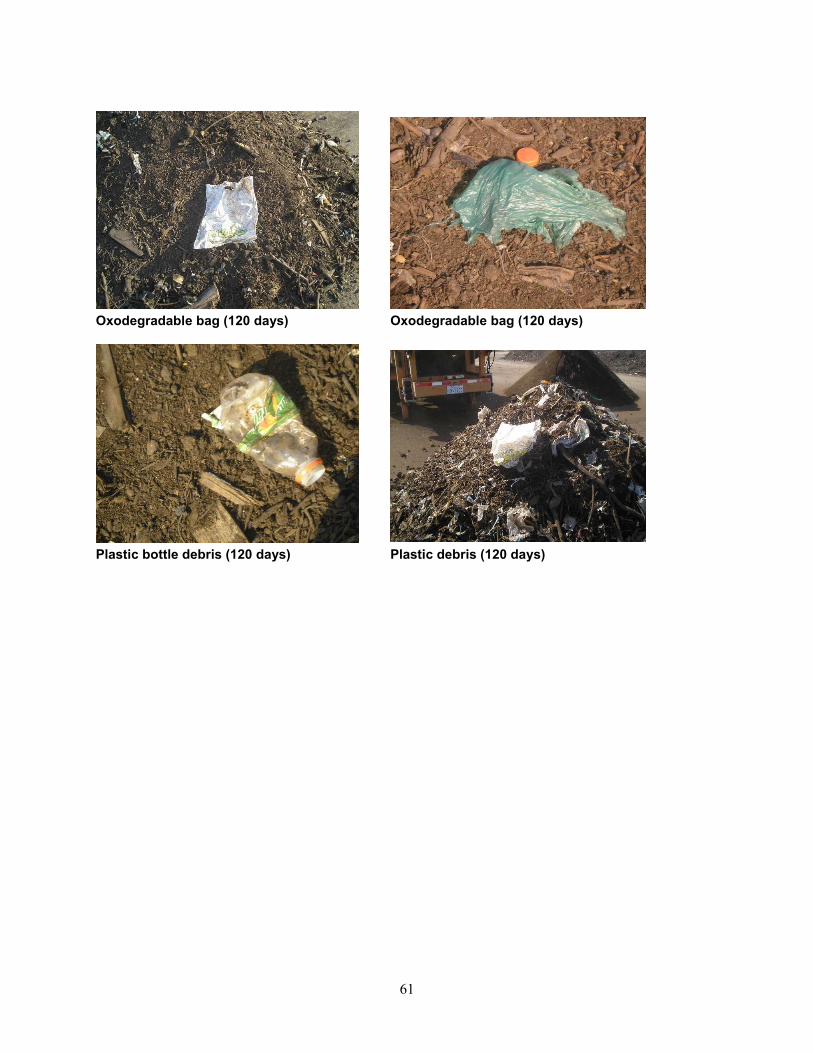
61
Oxodegradable bag (120 days)
Oxodegradable bag (120 days)
Plastic bottle debris (120 days)
Plastic debris (120 days)
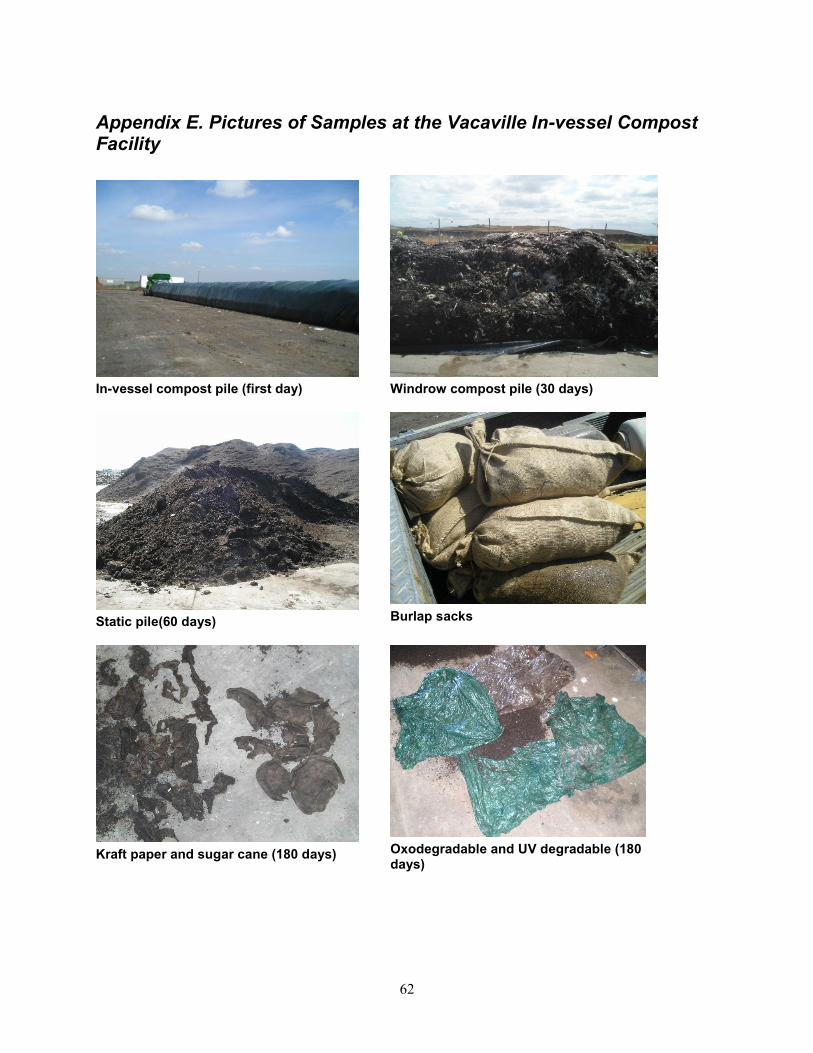
62
Appendix E. Pictures of Samples at the Vacaville In-vessel Compost Facility
In-vessel compost pile (first day)
Windrow compost pile (30 days)
Static pile(60 days)
Burlap sacks
Kraft paper and sugar cane (180 days)
Oxodegradable and UV degradable (180 days)
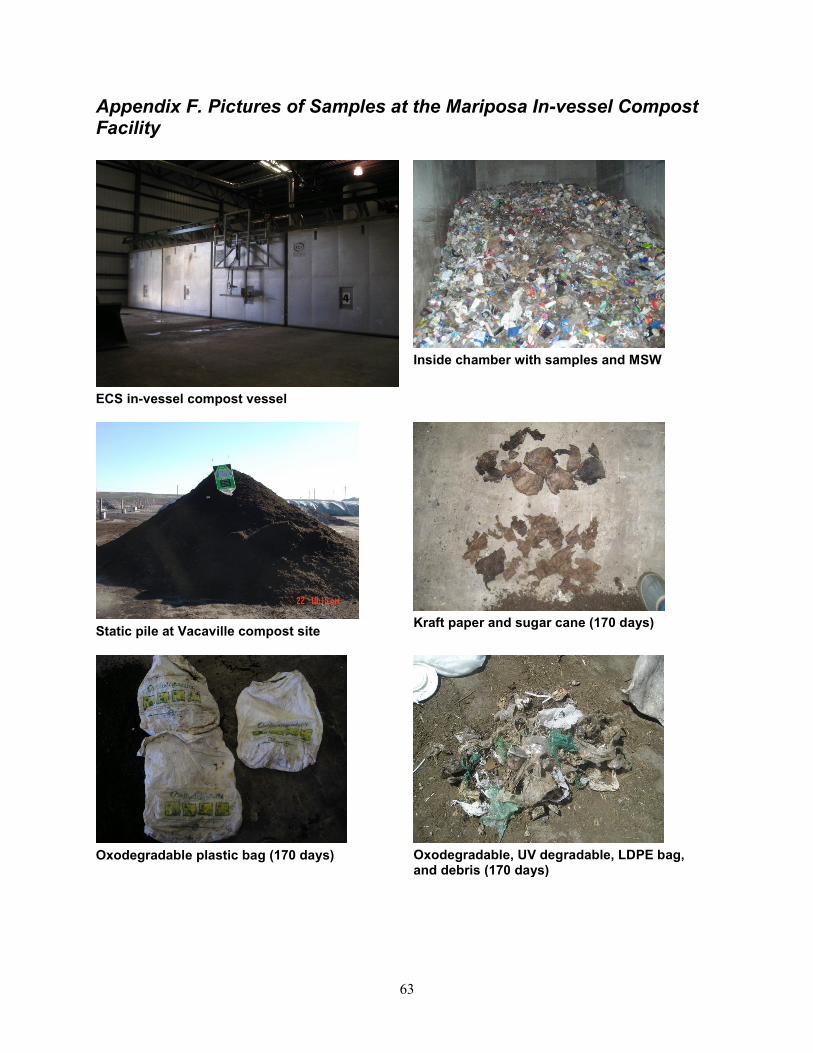
63
Appendix F. Pictures of Samples at the Mariposa In-vessel Compost Facility
ECS in-vessel compost vessel
Inside chamber with samples and MSW
Static pile at Vacaville compost site
Kraft paper and sugar cane (170 days)
Oxodegradable plastic bag (170 days)
Oxodegradable, UV degradable, LDPE bag, and debris (170 days)
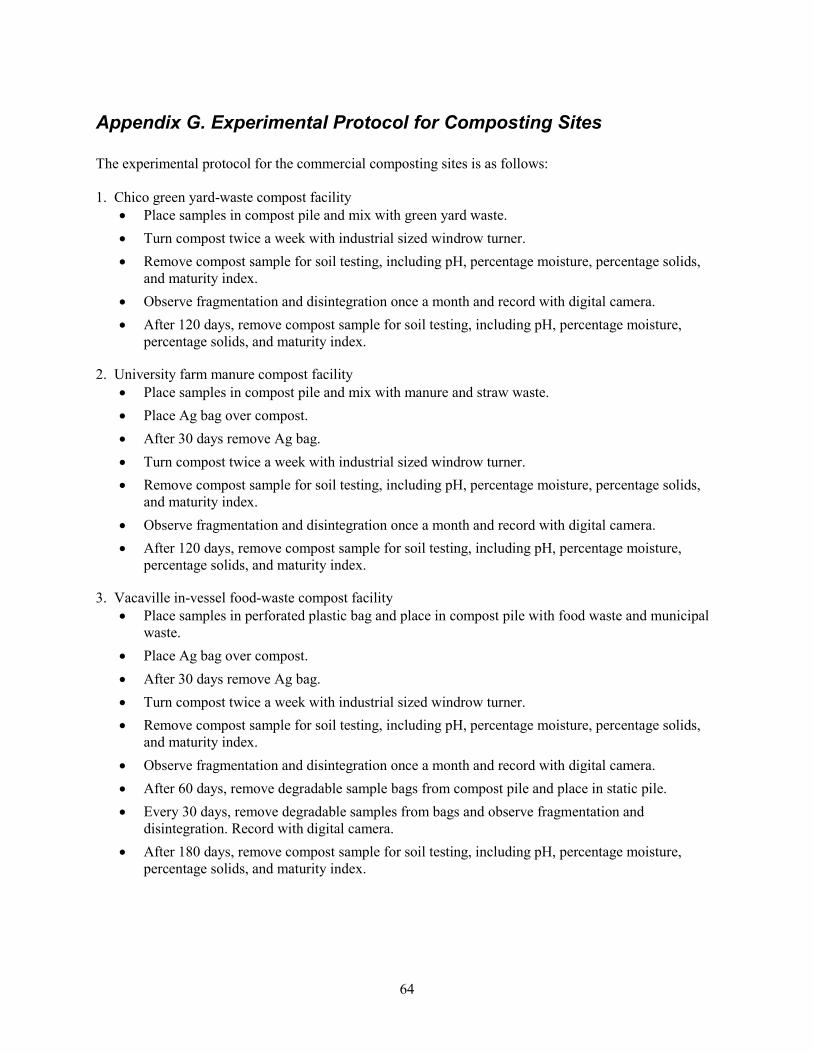
64
Appendix G. Experimental Protocol for Composting Sites
The experimental protocol for the commercial composting sites is as follows:
1. Chico green yard-waste compost facility
Place samples in compost pile and mix with green yard waste.
Turn compost twice a week with industrial sized windrow turner.
Remove compost sample for soil testing, including pH, percentage moisture, percentage solids,
and maturity index.
Observe fragmentation and disintegration once a month and record with digital camera.
After 120 days, remove compost sample for soil testing, including pH, percentage moisture,
percentage solids, and maturity index.
2. University farm manure compost facility
Place samples in compost pile and mix with manure and straw waste.
Place Ag bag over compost.
After 30 days remove Ag bag.
Turn compost twice a week with industrial sized windrow turner.
Remove compost sample for soil testing, including pH, percentage moisture, percentage solids,
and maturity index.
Observe fragmentation and disintegration once a month and record with digital camera.
After 120 days, remove compost sample for soil testing, including pH, percentage moisture,
percentage solids, and maturity index.
3. Vacaville in-vessel food-waste compost facility
Place samples in perforated plastic bag and place in compost pile with food waste and municipal
waste.
Place Ag bag over compost.
After 30 days remove Ag bag.
Turn compost twice a week with industrial sized windrow turner.
Remove compost sample for soil testing, including pH, percentage moisture, percentage solids,
and maturity index.
Observe fragmentation and disintegration once a month and record with digital camera.
After 60 days, remove degradable sample bags from compost pile and place in static pile.
Every 30 days, remove degradable samples from bags and observe fragmentation and
disintegration. Record with digital camera.
After 180 days, remove compost sample for soil testing, including pH, percentage moisture,
percentage solids, and maturity index.
65
4. Mariposa County in-vessel municipal solid waste (MSW) compost facility
Place samples in perforated plastic bag and place in compost pile with MSW in concrete
composting chamber from ECS.
After 30 to 45 days remove samples from ECS chamber.
Turn compost twice a week with industrial sized windrow turner.
Remove compost sample for soil testing, including pH, percentage moisture, percentage solids,
and maturity index.
Observe fragmentation and disintegration once a month and record with digital camera.
After 60 days, remove degradable sample bags from compost pile and place in static pile.
Every 30 days, remove degradable samples from bags and observe fragmentation and
disintegration. Record with digital camera.
After 170 days, remove compost sample for soil testing, including pH, percentage moisture,
percentage solids, and maturity index.
66
Source Reference Notes
[1] Shimao Masayuki. "Biodegradation of plastics." Current opinion in Biotechnology, 12:242-247
(2001) [2]
D. Coleman and D. Crossley, Fundamentals of Soil Ecology, Academic Press Limited, London,
UK (1996) [3]
C. Bastioli, Handbook of Biodegradable Polymers, Rapra Technology Limited, p 133 (2005) [4]
Steve Mojo, ―What you need to Know about California’s New Labeling Legislation,‖ Die Line,
California Film Extruders & Converters Association, pp 10-11 (December 2004) [5]
―BPI Logo Program‖, http://www.bpiworld.org/ (October 2005) [6]
R. Narayan and S. Mojo, ―Summary of ASTM D6400-99 Test Methods and Correlation to
Composting Trials‖, http://www.bpiworld.org/BPI-Public/News/Article.html (October 2005) [7]
―Most plastic grocery bags banned,‖ The Sacramento Bee, pg A4 (March 28, 2007) [8]
―Garbage/composting/recycling,‖ http://www.ci.hutchinson.mn.us/composting.htm (May 2007) [9]
C. Foster, ―Degradable Plastic Bags, A European Perspective,‖ Report to ExcelPlas, Department
of Environment and Heritage, Australia (July 2002)
http://www.deh.gov.au/settlements/publications/waste/degradables/impact/ (August 2005) [10]
―Biodegradable Polyesters: Packaging Goes Green,‖
<http://www.plasticstechnology.com/articles/200209fa3.html> (August 2005) [11]
Advanced BioPlastics Conference 2004, January 2005,
http://www.ibaw.org/ibaw.symposium.com/ [12]
Ibid. [13]
―Biodegradable Plastic: Developments and Environmental Impacts,‖ Australian Government,
Department of the Environment and Heritage,
http://www.deh.gov.au/industry/waste/biodegradable/ (October 2002) [14]
―ADM and Metabolix Announce First Commercial Plant for MIRELNatural Plastics,‖ <
http://www.admworld.com/naen/pressroom/newspopup.asp?id=378&name=Commercial_Plant_f
or_PHA_Announced (September 2006) [15]
―Eastman aims to raise profile of specialty plastics,‖
http://www.plasticsnews.com/k2001/news2.html?cat=34&id=1005150602 (September 2006) [16]
―Cereplast Boosts Production,‖
http://www.cereplast1.com/ce/index.php?option=com_content&task=view&id=59&Itemid=73
(September 2006) [17]
―Zerust selects BASF’s Ecoflex® polymer for compostable plastic leaf bags,‖
http://www.basf.com/corporate/news2006/012406_Zerust.htm (September 2006) [18]
Michael A. Verespej , ―Winning Technologies: Polylactide Polymers,‖ Industry Week (July 11,
2000) [19]
―NOVA SPA Reached Global Settlement on Patent Litigation,‖
http://www.materbi.com/ing/html/allegato.php?tipo=comunicato&id=35 (September 2006) [20]
Schimmel, K, et.al, ―Biodegradable Polymer Characterization Laboratory,‖ Proceedings of the
2004 American Society for Engineering Education Annual Conference, American Society of
Engineering Education, session 3613 (June 2004) [21]
―Welcome to EPI,‖, http://www.epi-global.com/en/Index-e.htm (March 2006) [22]
―Oxo-Biodegradable,‖ http://www.biodegradableplastics.net/products_pdq.html [23]
―Polystarch additives,‖ http://www.biodegradableplastics.net/products_pmp.html (March 2006)
67
[24] ―Decomposing Cutlery: Biocorp Makes its Mark in Biodegradable Plastics,‖
http://www.carbohydrateeconomy.org/ (March 2006) [25]
―Life Cycle Assessment (LCA),‖
http://www.scienceinthebox.com/en_UK/sustainability/definition_en.html (April 2007) [26]
C. Bastioli, Handbook of Biodegradable Polymers, Rapra Technology Limited (2005) p 432 [27]
Ibid. [28]
Ibid. [29]
―LCA of Mater-Bi bags,‖ http://www.materbi.com/ing/html/prodotto/cosematerbi/lca_edp.html# [30]
―Life Cycle Assessment of Natureworks PLA,‖ http://www.natureworksllc.com/Our-Values-and-
Views/Life-Cycle-Assessment.aspx
[31] P. Gruber and M. O'Brien, ―Polylactic NatureWorks™ PLA,‖ Biopolymers in 10 volumes,
Volume 4, Polyesters III Applications and Commercial Products, Edited by Doi, Y., Steinbuchel,
A., Wiley-VCH, Weinheim, ISBN 3-527-30225-5. pp 235-249 (January 2002)
[32] Nayaran R., Pettigrew C., ―ASTM Standards Help Define and Grow a New Biodegradable Plastic
Industry,‖ ASTM Standardization News (December, 1999) [33]
―D6400-04 Standard Specification for Compostable Plastics‖, http://www.astm.org/cgi-
bin/SoftCart.exe/DATABASE.CART/REDLINE_PAGES/D6400.htm?E+mystore (May 2005) [34]
Jakubowica, I., ―Evaluation of degradable polyethylene (PE),‖ Polymer Degradation and
Stability, V 80, N 1, pp 39-43, (2003) [35]
―BPI’s Compostable Logo effort is featured in the American Environmental Review Series,‖ April
23, 2003, http://chemical.press-world.com/v/9085/bpi-s-compostable-logo-effort-is-featured-in-
the-american-environmental-review-series.html (May 2005) [36]
―The Status of Degradable Plastics for Composting,‖ BioCycle: Journal of Composting
&Organics Recycling, p. 60 (March 2002) [37]
Ramani Narayan and Steve Mojo, ―Summary of ASTM D6400-99 Test Method and
Specifications,‖ n.d., http://www.bpiworld.org/Files/Article/ArtsJGyNe.pdf (May 2005) [38]
―City of Orilla Biodegradable Bag Study,‖ December 2003,
www.bpiworld.org/Files/Article/ArttJInBM.pdf (August 2005) [39]
J. Kaiser, ―Testing the performance and the disintegration of biodegradable bags for the collection
of organic wastes,‖ Macromoecular Symposia 165, p 115–122 (March 2001) [40]
C. Bastioli, Handbook of Biodegradable Polymers, Rapra Technology Limited p 170 (2005) [41]
UK’s first compostable packaging certification scheme announced,‖
http://www.bpiworld.org/Files/Article/ArtsJGyNe.pdf (April 2007) [42]
International organization for standardization (ISO),‖
http://www.iso.ch/iso/en/ISOOnline.frontpage (April 2007) [43]
―The impacts of degradable plastic bags in Australia,‖ Final Report to Department of the
Environment and Heritage, ExcelPlas Australia Centre for Design at RMIT, (September 11,
2003) [44]
Ibid. [45]
―Draft Australia Standards released for public comments,‖
http://www.deh.gov.au/settlements/publications/waste/degradables/newsletter/pubs/degradable-
issue2.pdf (March 2006) [46]
―Biodegradable Plastics Society,‖ http://www.bpsweb.net/english/english.htm (April 2007) [47]
―Making packaging greener—biodegradable plastics,‖ February 2002,
http://www.science.org.au/nova/061/061print.htm#box 1 (January 2005)
68
[48] ―Household Items and Food Service,‖ n.d.,
http://lepton.marz.com/ncga/comm_dev_center/product_detail.asp?product=Household+items+an
d+Foodservice&submit=Submit (January 2005) [49]
―NatureWorks PLA Cups,‖ n.d.,
http://www.brenmarco.com/supermarket/SUPERMARKET%20LARGE%20PAGES/weimoncup
s.htm (October 2005) [50]
―BioBag and the Environment,‖ n.d., http://www.biobagusa.com/mater_bi.htm (May 2005) [51]
―Plastic Litter and Waste Cleanup Costs Approach a Billion Dollars,‖
http://www.becnet.org/ENews/01sp_plastic.html, (March 2006) [52]
Ibid. [53]
―Household Items and Food Service‖,
http://lepton.marz.com/ncga/comm_dev_center/product_detail.asp?product=Household+items+an
d+Foodservice&submit=Submit (January 2005) [54]
―Degradable bags can last for years,‖ http://www.bpiworld.org/Files/Article/Art57nOfv.pdf
(March 2006) [55]
The impacts of degradable plastic bags in Australia, ExcelPlas Australia Centre for Design at
RMIT, (September 11, 2003) [56]
M. Booma et. al., Journal of Elastomers and Plastics, 26 104 (1994) [57]
E. Chiellini and R. Solaro, Advanced Materials, 8 305 (1996) [58]
S. Piccinini et. al., The Science of Composting, Blackie Academic Publishers, London, pp 1271-
1273 [59]
U. Witt et. al.,‖Biodegradation of aliphatic-aromatic copolyesters: evaluation of the final
biodegradability and ecotoxicological impact of biodegradation intermediates,‖Chemosphere 44
289-299 (2001) [60]
J. Greene ―Evaluation of the performance of rigid plastic packaging containers, bags, and food
service packaging in full scale commercial composting,‖ California Integrated Waste
Management Board Publications, http://www.ciwmb.ca.gov/Publications/default.asp?cat=12
(May 2007) [61]
J. Kaiser, ―Testing the performance and the disintegration of biodegradable bags for the collection
of organic wastes,‖ Macromoecular Symposia, 165, pp 115-122 (March 2001) [62]
Pagga, Udo., ―Bidegradability and compostability of polymeric materials in the context of
European packaging regulation,‖Polymer Degradation and Stability, 59 371-376 (1998) [63]
―Glossary of Terms for Degradable Plastics,‖ Government Department of Environment and
Heritage http://www.deh.gov.au/settlements/waste/degradables/glossary.htmlAustralian (August
2005) [64]
―Standard Guide for Assessing the Compostability of Environmentally Degradable Plastics,‖
ASTM Designation: D 6002 — 96 (Reapproved 2002)
http://www.mindfully.org/Plastic/Biodegrade/Compostability-Degradable-Plastics1mar02.htm
(August 2005) [65]
―Phytotoxicity Tests for Soil Amendments,‖ Woods End Research Laboratory, Inc.
http://www.woodsend.org/aaa/phytox.html (August 2005) [66]
―Safety data for sucrose,‖ http://physchem.ox.ac.uk/MSDS/SU/sucrose.html (April 2007) [67]
European Commission, ―Commission Working Group on the Classification and Labelling of
Dangerous Substances,‖ http://ecb.jrc.it/classlab/SummaryRecord/0894r3_sr_CMR1094.doc
(May 2007) [68]
―Organic Material In-vessel Composting,‖
http://www.p2pays.org/ref/20/19926/p2_opportunity_handbook/7_ii_a_3.html (March 2006) [69]
―Hot Rot Composting Systems,‖ http://www.hotrotsystems.com/ (March 2006) [70]
―Solvita® Test Kit,‖ http://www.solvita.com/aaa/solvita.html (December 2005).
69
[71] ―Stalk Market Info,‖ http://www.stalkmarket.net/infoSheet.htm (May2007)
[72] O. Chiparus, ―Bagasse fiber for the production of nonwoven materials,‖ Ph.D. Dissertation,
Louisiana State University, (May 2004) [73]
Fisherbrand Hollow Cathode Single-Element 2 in. dia. Lamps with Elements Aluminum to
Platinum,‖ n.d., https://www1.fishersci.com/Coupon?cid=1328&gid=181949 (December 2005) [74]
C. Bastioli, Handbook of Biodegradable Polymers, Rapra Technology Limited, p 34 (2005)
[75] Ibid.
[76] Ibid.
[77] A. Andrady, ―Weathering of Polyethylene (LDPE) and enhanced photodegradable polyethylene
in the marine environment,‖ Journal of Applied Polymer Science, 39, 363-370 (1990)
[78] ―Accelerate environmental exposure, laboratory testing, and recyclabiltiy study of
photo/biodegradable plastics,‖ Final report, Research Triangle Institute (1991)
[79] A. Andrady et. al. ―Effects on climate change and UV-B materials,‖ Photochem. Photbiol. Sci., 2,
68-71 (2003)
[80] C. Bastioli, Handbook of Biodegradable Polymers, Rapra Technology Limited , p 36 (2005)
[81] S. Iman et. al. ―Degradation of starch-poly(B-hydroxybutyrate-co-B-hydroxyvalerate) bioplastic
in tropical coastal waters,‖ Applied and Environmental Microbiology, 65, 2, 431 (1999)
[82] H. Tsuji and K Suzuyoshi, ―Environmental degradation of biodegradable polyesters 1. Poly(-
caprolactone), poly[(R)-3-hydroxybutyrate], and poly(L-lactide) films in controlled static
seawater, Polymer Degradation and Stability 75 (2) pp 347-355 (2002)
[83] P. Shin et. al., ―Environmental effects on polymeric matric systems,‖ Journal of Environmental
Polymer Degradation, 5, 1, 33 (1997)
[84] ―Briefing of the breakdown of organic matter by anaerobic organisms in environments lacking
oxygen,‖ Friends of the Earth FOE
http://www.foe.co.uk/resource/briefings/anaerobic_digestion.pdf (April 2007) [85]
L. X. Zhou, et. al. ―Sorption and Biodegradability of Sludge Bacterial Extracellular Polymers in
Soil and Their Influence on Soil Copper Behavior,‖ J. Environ. Qual. 33:154-162 (2004)
[86] Ishigaki, T. et. al. ―The degradability of biodegradable plastics in aerobic and anaerobic waste
landfill model reactors,‖ Chemosphere 54:225-233 (2004)
[87] Angelidaki, I. et. al. ―Thermophilic anaerobic digestion of source-sorted organic fraction of
household municipal solid waste: Start-up procedure for continuously stirred tank reactor.‖ Water
Research 40: 2621-2628 (2006)
[88] C. Cozzolino et. al. ―Industrial application of semi-dry digestion process of organic solid waste.‖
Proceedings of the International Symposium on Anaerobic Digestion of Solid Waste. Venice, pp
551–555 (1992)
70
[89] Ruihong Zhang et. al. ―Characterization of food waste as feedstock for anaerobic digestion.‖
Bioresource Technology, Volume 98, Issue 4, March 2007, Pages 929-935 (2007)
[90] Ibid.
[91] ―Compost windrow turner,‖ November 1, 2001,
http://en.wikipedia.org/wiki/Compost_windrow_turner (December 2005) [92]
―In-Vessel Composting Report (Rice Straw & Dairy Manure),‖ California State University,
Chico, n.d., http://www.csuchico.edu/agr/compost/arbstudy.html (December 2005) [93]
http://www.compostsystems.com [94]
R. Dvorak and E. Kosior, ―Development of a continuous thermals separation system for the
removal of PVC contamination in post-consumer PET flake,‖ SPE ANTEC Papers 2001, The
Society of Plastics Engineers (May 2001) [95]
J. Scheirs, Polymer Recycling: Science, Technology and Applications, Wiley Publishers (1998) [96]
D. Wienke, et. al., ―Adaptive resonance theory based neural network for supervised chemical
pattern recognition. Part 2: Classification of postconsumer plastics by remote NIR spectroscopy
using an InGaAs diode array,‖ Chemometrics and Intelligent Laboratory Systems 32 165-176
(1996) [97]
Robert Dvorak, et. al., ―Factors Influencing the Sorting Efficiency of Commingled Postconsumer
Bottles using an Automated Sorting System,‖ SPE ANTEC Proceedings, III (2000) [98]
J. Greene, ―Postconsumer Resin Quality Assurance and Testing Protocol,‖ California Integrated
Waste Management Board (CIWMB)Publications,
http://www.ciwmb.ca.gov/Publications/default.asp?pubid=1105 (March 2005)
[99] J. Greene, ―Postconsumer Resin (PCR) Quality Assurance and Testing Protocol: Proposed
Testing Protocol for PCR,‖ SPE GPEC 2006 Global Plastics Environmental Conference,
(February 2006) [100]
B. Nelson, ―Improving the Accuracy of On-Line Melt Index Measurements,‖ SPE ANTEC
Papers 1998, The Society of Plastics Engineers, p 260 (May 1998) [101]
J. Clay, ―Melt Index from a Single Pellet,” SPE ANTEC Papers 2001, The Society of Plastics
Engineers p 47 (May 2001) [102]
―Converting Occupational Exposure Limits from mg/m3 to ppm,‖ n.d.,
http://www.ccohs.ca/oshanswers/chemicals/convert.html (December 2005)