Performance Evaluation of a Passive Chilled Beam System ...
12
Purdue University Purdue e-Pubs International High Performance Buildings Conference School of Mechanical Engineering 2016 Performance Evaluation of a Passive Chilled Beam System and Comparison with a Conventional Air System Janghyun Kim Ray W. Herrick Laboratories, School of Mechanical Engineering, Purdue University, 140 S. Martin Jischke Dr., West Lafayee, IN 47907, USA, [email protected] James E. Braun [email protected] Athanasios Tzempelikos [email protected] W. Travis Horton [email protected] Follow this and additional works at: hp://docs.lib.purdue.edu/ihpbc is document has been made available through Purdue e-Pubs, a service of the Purdue University Libraries. Please contact [email protected] for additional information. Complete proceedings may be acquired in print and on CD-ROM directly from the Ray W. Herrick Laboratories at hps://engineering.purdue.edu/ Herrick/Events/orderlit.html Kim, Janghyun; Braun, James E.; Tzempelikos, Athanasios; and Horton, W. Travis, "Performance Evaluation of a Passive Chilled Beam System and Comparison with a Conventional Air System" (2016). International High Performance Buildings Conference. Paper 179. hp://docs.lib.purdue.edu/ihpbc/179
Transcript of Performance Evaluation of a Passive Chilled Beam System ...
Purdue UniversityPurdue e-PubsInternational High Performance BuildingsConference School of Mechanical Engineering
2016
Performance Evaluation of a Passive Chilled BeamSystem and Comparison with a Conventional AirSystemJanghyun KimRay W. Herrick Laboratories, School of Mechanical Engineering, Purdue University, 140 S. Martin Jischke Dr., West Lafayette,IN 47907, USA, [email protected]
James E. [email protected]
Athanasios [email protected]
W. Travis [email protected]
Follow this and additional works at: http://docs.lib.purdue.edu/ihpbc
This document has been made available through Purdue e-Pubs, a service of the Purdue University Libraries. Please contact [email protected] foradditional information.Complete proceedings may be acquired in print and on CD-ROM directly from the Ray W. Herrick Laboratories at https://engineering.purdue.edu/Herrick/Events/orderlit.html
Kim, Janghyun; Braun, James E.; Tzempelikos, Athanasios; and Horton, W. Travis, "Performance Evaluation of a Passive Chilled BeamSystem and Comparison with a Conventional Air System" (2016). International High Performance Buildings Conference. Paper 179.http://docs.lib.purdue.edu/ihpbc/179

3231, Page 1
4th International High Performance Buildings Conference at Purdue, July 11-14, 2016
Performance Evaluation of a Passive Chilled Beam System and Comparison with a
Conventional Air System
Janghyun KIM1*, James E. BRAUN1,2, Athanasios TZEMPELIKOS1,2, W. Travis HORTON1,2
1Ray W. Herrick Laboratories, School of Mechanical Engineering, Purdue University,
140 S. Martin Jischke Dr., West Lafayette, IN 47907, USA
[email protected], [email protected], [email protected], [email protected]
2School of Civil Engineering, Purdue University, 550 Stadium Mall Dr.,
West Lafayette, IN 47907, USA
* Corresponding Author
ABSTRACT
This study compares the performance of a system employing passive chilled beams with a conventional air system
in a typical open plan office setting. Both energy efficiency and thermal comfort are taken into account as
performance indicators. A typical single duct variable air volume system, widely used in large office buildings, was
considered as a conventional system; a combination of the air system and passive chilled beams was considered as a
typical passive chilled beam system. Measurements from full-scale experiments conducted in open plan offices
(Living Labs of the Center for High Performance Buildings at Purdue) are used to develop a data-driven passive
chilled beam model that can predict the total cooling capacity as well as surface temperatures under different
operating conditions. In simulating the performance of the two systems, the same operative temperature was used in
order to have a fair comparison. Additionally, the effect of radiation cooling of the passive chilled beam was
investigated. The overall results showed about maximum 10-21% total electrical energy savings (5-23% reduction in
chiller and 55% reduction in supply fan electrical energy) and thermal comfort improvement of 0.3-0.4 on a PMV-
scale (12-15% on a PPD scale) associated with the passive chilled beam system, depending on the system
configuration. The radiation cooling of the passive chilled beam is not significant, since the effective surface area for
radiant exchange with the room is much less than the surface area for convective heat transfer and temperature
differences are relatively low.
1. INTRODUCTION
Reducing energy consumption in buildings is an important part of reducing global energy usage and environmental
impact. It has been reported by the International Energy Agency (Energy technology perspectives 2010, 2012) that
the global energy demand in buildings will approximately double by 2050 due to the “rising number of residential
and commercial buildings ....”. More than two-thirds of existing buildings are expected to remain until 2050.
Therefore, significantly reducing energy use in the building sector requires retrofitting existing buildings with
advanced technologies. Furthermore, modeling of these technologies is a critical part of assessing their economics
towards realizing success in the marketplace.
Passive radiant cooling systems can lead to reduced cooling requirements, improved comfort, less fan energy and
downsized ductwork, compared to conventional all-air systems. Passive chilled beams, that typically use square
vertical fins along a water pipe and a horizontal perforated panel at the bottom to increase radiation effects, are a
promising technology. However, passive chilled beam modeling is challenging because (i) they have a complex
geometry and (ii) the primary heat transfer mechanisms of radiation and natural convection are strongly coupled to
the space characteristics and thermal conditions. The only available model, currently implemented in EnergyPlus
(Livchak & Lowell, 2012), is not only limited to calculation of the convective heat extraction rate (where it neglects
radiation heat transfer at the bottom surface of the chilled beam and the air circulation driven by the natural

3231, Page 2
4th International High Performance Buildings Conference at Purdue, July 11-14, 2016
convection), but it is also an iterative model that needs to compute the mean water temperature at each time step by
iteration. Experimental and simulation studies of passive chilled beams are both useful in evaluating their overall
performance. One of the benefits of passive chilled beams is that since they only provide sensible cooling they
operate at higher surface temperatures (above the dew point of the air) compared to conventional cooling systems
leading to improved energy efficiency for chillers. It is also possible to couple the radiant cooling system with
energy storage within the building thermal mass, to allow load shifting and reductions in peak load.
Energy modeling tools are important for designing building systems and for assessing new technologies such as
passive ceiling cooling systems (Kim, Tzempelikos, & Braun, 2015). To evaluate both thermal comfort and energy
saving aspects of passive chilled beams, models should consider both the chilled beam and its surroundings since the
performance of passive chilled beams are strongly coupled to the specific characteristics and conditions within the
spaces. There have not been enough studies that focus on the potential of energy savings and thermal comfort
improvement using passive chilled beam systems. Some studies have focused on radiant ceiling panel systems rather
than passive chilled beams (J. D. Feng, Bauman, & Schiavon, 2013; J. (Dove) Feng, Schiavon, & Bauman, 2013;
Imanari, Omori, & Bogaki, 1999; Mustakallio, Bolashikov, Kostov, Melikov, & Kosonen, 2016; Niu, Zhang, &
Zuo, 2002; Sastry & Rumsey, 2014; Stetiu, 1999); in the few studies on passive chilled beams, the focus has been on
the performance of the passive chilled beam itself (Fredriksson & Sandberg, 2009; Kosonen, Saarinen, Koskela, &
Hole, 2010; Nelson, Culp, Rimmer, & Tully, 2016) and not the overall system performance or comparison with
other system types. In this context, this paper presents a comparison of the performance of a passive chilled beam
system versus a conventional air system, based on system simulation for a thermal zone. Measurements from full-
scale experiments conducted in open plan offices (Living Labs of the Center for High Performance Buildings at
Purdue) are used to develop a data-driven passive chilled beam model that can predict the total cooling capacity as
well as the chilled surface temperature of a passive chilled beam under different operating conditions. The variable
air volume system model represents a conventional air system. The performance of the passive chilled beam and air
system is evaluated in terms of energy consumption in each part of the HVAC system and in terms of thermal
comfort, using the same operative temperature as a basis. The radiation cooling effect of passive chilled beams is
also taken into account to verify whether it is significant in terms of performance evaluation.
2. BUILDING ENERGY MODEL DESCRIPTION
The details and parameters of the simulation model are described in the following sections. The model was
implemented in TRNSYS software (A Transient System Simulation Program, Version 17, 2015).
2.1 Building Envelope Parameters and Climatic Data The building envelope model is developed based on construction drawings of one of the Living Lab offices in the
Center for High Performance Buildings at Purdue University (West Lafayette, Indiana) as shown in Figure 1. The
construction specifications of this envelope model are listed in Table 1. Typical Meteorological Year weather for
West Lafayette were used as inputs in the energy model. As shown in Figure 1, the thermal zone model is divided
into three separate zones, including a double façade feature, acting as a buffer zone between external and internal
windows, and a plenum space, where the return air is gathered and flows back to either the HVAC system or to the
passive chilled beams. The detailed radiation model is selected in TRNSYS to properly reflect features of this
thermal zone such as the double façade, the estimation of human comfort in the space and the radiation heat transfer
between indoor surfaces and passive chilled beam surfaces. The surface between the plenum and the office area is
partially covered with nine cloud surfaces as shown in the office photo in Figure 1. Passive chilled beams are
installed on these clouds, thus, when the passive chilled beam is in operation, the relatively warm air in the plenum
is pulled up between the passive chilled beams by natural convection, and the cooled air is pushed towards the office
area. To approximate the temperature difference between the office area and the plenum due to thermal stratification,
several assumptions were made as shown in Figure 2. First, the lighting gain in the space is applied in the plenum
rather than applying it in the office area. The only thermal coupling considered between the office zone and plenum
is due to forced convection. The total supply air flow rate from the diffusers is assumed to flow to the plenum but at
the temperature and humidity of the office area. Heat transfer from the office zone to the cloud bottom surfaces was
forced to be zero by setting the underside convection coefficient and solar absorption to zero. Solar heat gain to the
top surface from the south facing windows is considered along with convective heat transfer between the plenum
and clouds. However, the temperature within the clouds is considered to be uniform which was implemented by
utilizing a very high thermal conductivity. All the other necessary assumptions are shown in Figure 2.

3231, Page 3
4th International High Performance Buildings Conference at Purdue, July 11-14, 2016
Figure 1: Domain of interest in this study
Table 1: Specification of envelope components
Type Layer Description Thickness U-Value
m W/m2K
Roof Insulation 0.1
0.221 Concrete 0.038
Raised Floor Concrete 0.102
0.086 Air 0.3
External Wall
Gypsum Board 0.013
0.358 Insulation 0.105
Stucco 0.025
Internal Wall
Gypsum Board 0.016
0.136 Air 0.184
Gypsum Board 0.016
External Window Double Glazing, ID: 7041 0.0178 3.2
Internal Window Double Glazing, ID: 7002 0.0188 1.58
Cloud Virtual surface 0 5.76
Plenum south Steel panel and Insulation 0.08 0.598
Figure 2: Assumptions made in the thermal zone model
3231, Page 4
4th International High Performance Buildings Conference at Purdue, July 11-14, 2016
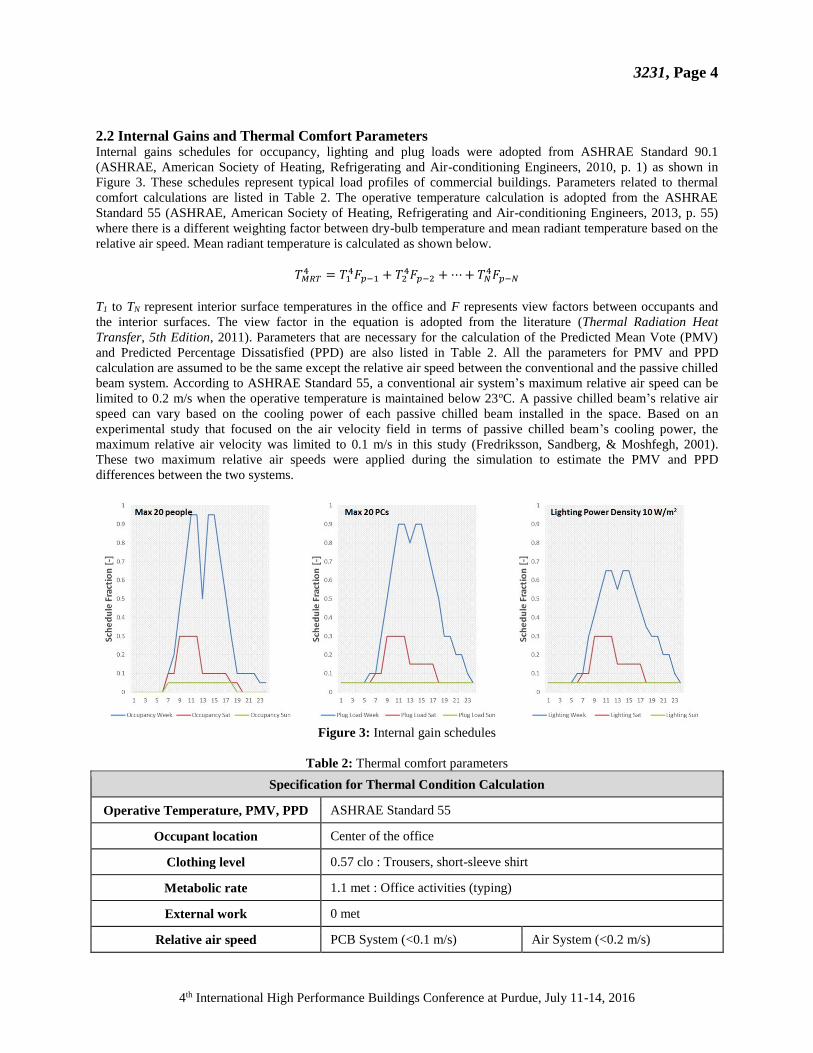
2.2 Internal Gains and Thermal Comfort Parameters Internal gains schedules for occupancy, lighting and plug loads were adopted from ASHRAE Standard 90.1
(ASHRAE, American Society of Heating, Refrigerating and Air-conditioning Engineers, 2010, p. 1) as shown in
Figure 3. These schedules represent typical load profiles of commercial buildings. Parameters related to thermal
comfort calculations are listed in Table 2. The operative temperature calculation is adopted from the ASHRAE
Standard 55 (ASHRAE, American Society of Heating, Refrigerating and Air-conditioning Engineers, 2013, p. 55)
where there is a different weighting factor between dry-bulb temperature and mean radiant temperature based on the
relative air speed. Mean radiant temperature is calculated as shown below.
𝑇𝑀𝑅𝑇4 = 𝑇1
4𝐹𝑝−1 + 𝑇24𝐹𝑝−2 +⋯+ 𝑇𝑁
4𝐹𝑝−𝑁
T1 to TN represent interior surface temperatures in the office and F represents view factors between occupants and
the interior surfaces. The view factor in the equation is adopted from the literature (Thermal Radiation Heat
Transfer, 5th Edition, 2011). Parameters that are necessary for the calculation of the Predicted Mean Vote (PMV)
and Predicted Percentage Dissatisfied (PPD) are also listed in Table 2. All the parameters for PMV and PPD
calculation are assumed to be the same except the relative air speed between the conventional and the passive chilled
beam system. According to ASHRAE Standard 55, a conventional air system’s maximum relative air speed can be
limited to 0.2 m/s when the operative temperature is maintained below 23oC. A passive chilled beam’s relative air
speed can vary based on the cooling power of each passive chilled beam installed in the space. Based on an
experimental study that focused on the air velocity field in terms of passive chilled beam’s cooling power, the
maximum relative air velocity was limited to 0.1 m/s in this study (Fredriksson, Sandberg, & Moshfegh, 2001).
These two maximum relative air speeds were applied during the simulation to estimate the PMV and PPD
differences between the two systems.
Figure 3: Internal gain schedules
Table 2: Thermal comfort parameters
Specification for Thermal Condition Calculation
Operative Temperature, PMV, PPD ASHRAE Standard 55
Occupant location Center of the office
Clothing level 0.57 clo : Trousers, short-sleeve shirt
Metabolic rate 1.1 met : Office activities (typing)
External work 0 met
Relative air speed PCB System (<0.1 m/s) Air System (<0.2 m/s)

3231, Page 5
4th International High Performance Buildings Conference at Purdue, July 11-14, 2016
Figure 4: HVAC system configurations
2.3 Configuration of HVAC Systems Figure 4 shows configurations of the conventional air system and two different passive chilled beam systems. There
are ways to improve the energy efficiency of the passive chilled beam system by configuring the system with
different methods, such as adding a dedicated chiller for passive chilled beams with relatively higher operating
temperature of chilled water, and implementing a dedicated outdoor air system with desiccant and enthalpy wheels
for efficient humidity control. In this study, the two different passive chilled beam system configurations are
considered depending on whether a separate chiller is used or not used for passive chilled beams. The differences
between these two cases will show the effect of using a chiller with higher chilled water operating temperatures.
2.3.1 Conventional Variable Air Volume System A typical single duct variable air volume (VAV) system, which is widely used in large office buildings (Thornton,
B.A. et al., 2011), is considered as the conventional system. As shown in Figure 4 (a), the system includes a cooling
coil, supply fan and an economizer. The return fan, preheating coil, reheating coil and VAV box were not included
in this study to simplify the approach for the consideration of a summer cooling season. The chilled water source for
the cooling coil is provided from an air-cooled electric chiller and a constant speed pump (pump 1) was used to
provide chilled water from the chiller to the cooling coil. A bypass cooling coil is used in this model to modulate the
amount of chilled water to the coil to maintain a supply air temperature setpoint.
The air-cooled chiller, fan, and pump models are incorporated in the building energy model. The air-cooled chiller
model is adopted from the TRNSYS library (Type 655). A normalized performance map was used to calculate the
power of the chiller from different conditions of rated capacity, rated COP, water mass flow rate, chilled water
leaving temperature and ambient air temperature. Performance characteristics of the fan and pump were estimated
from actual measurements. Supply flow rate and power consumption of the fan and the pump were directly coupled
by using a 2nd order polynomial. Performance characteristics of these components are shown in Figure 5. The same
fan and pump models are used in the passive chilled beam system as well.
A minimum outdoor air requirement suggested from the ASHRAE Standard 90.1 (ASHRAE, American Society of
Heating, Refrigerating and Air-conditioning Engineers, 2010, p. 1) is applied in both systems. For the conventional
air system, the minimum outdoor air requirement is 173 CFM and an economizer control opens up the outdoor air
damper when the outdoor conditions allow free cooling.
Figure 5: Performance fitting of fan, pump and chiller

3231, Page 6
4th International High Performance Buildings Conference at Purdue, July 11-14, 2016
2.3.2 Passive Chilled Beam System The configurations of passive chilled beam systems considered in this study are shown in Figure 4 (b) and (c). The
parallel air system in these configurations always provides the minimum outdoor air requirement and primarily
handles ventilation load (sensible and latent) requirements along with small latent load requirements associated with
the space. The primary space sensible load requirements are met by the passive chilled beams. In Figure 4 (b), a
separate water loop for passive chilled beams is coupled to the air system's cooling coil water loop with a bypass
heat exchanger. The use of the heat exchanger allows variation of the pump speed (Pump 2) at the passive chilled
beam's water loop to meet the sensible load requirement while the bypass valve can modulate the valve position to
maintain water supply temperature to passive chilled beams. In Figure 4 (c), a separate chiller is connected to
passive chilled beams. Chilled water is provided to each passive chilled beam unit individually, providing the same
inlet temperature to each unit, as it is usually applied in practical design. The economizer in the passive chilled beam
system is turned off to simulate a 100% dedicated outdoor air system. Thus, the return damper in the economizer is
completely closed at all times as shown in Figure 4 (b) and (c) and the minimum outdoor air requirement is only
drawn from the outdoor air inlet.
Figure 6 shows the passive chilled beam model that is used in this study. This model is an extension of a previous
model (Kim, Braun, & Tzempelikos, 2015). Actual field measurements from the Living Lab were used to estimate
the total cooling capacity and chilled surface temperature of the passive chilled beam under different operating
conditions in developing this model. The model estimates the total cooling capacity as a function of water supply
flow rate, water supply temperature and air temperature in the plenum. The accuracy of the total cooling capacity
predictions is depicted in the upper left graph in Figure 6. The chilled surface temperature of the passive chilled
beam is assumed to be between the air temperature in the plenum and the water supply temperature to the passive
chilled beam. Thus, it is estimated with the air temperature in the plenum, water supply temperature, water supply
flow rate and area-weighted uncooled surface temperature (AUST). The accuracy of the chilled surface temperature
predictions is illustrated in the lower left graph in Figure 6. The total cooling capacity is the sum of convection and
radiation cooling rates. The predicted surface temperature of the passive chilled beam is used with a simplified
radiation heat transfer rate calculation shown in Figure 6 in order to estimate the fraction of convective and radiative
cooling provided by the chilled beams. The actual passive chilled beam installed in the Living Lab has 0.52m2
effective surface area per each unit and this value was used to calculate the total effective surface area for the entire
passive chilled beams according to the number of units installed.
Although the TYPE 56 thermal zone model in TRNSYS provides an easier way to calculate the mean radiant
temperature, operative temperature and PMV, it is impossible to reflect the effect of chilled surface in the space to
calculate these parameters. It also has to be noted that the resultant indoor surface temperatures take this effect into
account, since the radiation cooling power of passive chilled beams is directly included in the energy balance
equation in TYPE 56. Due to this limitation in the software, an external calculation of the mean radiant temperature,
operative temperature and PMV is done at each time step and used as references in the simulation.
Figure 6: Passive chilled beam model
3231, Page 7
4th International High Performance Buildings Conference at Purdue, July 11-14, 2016
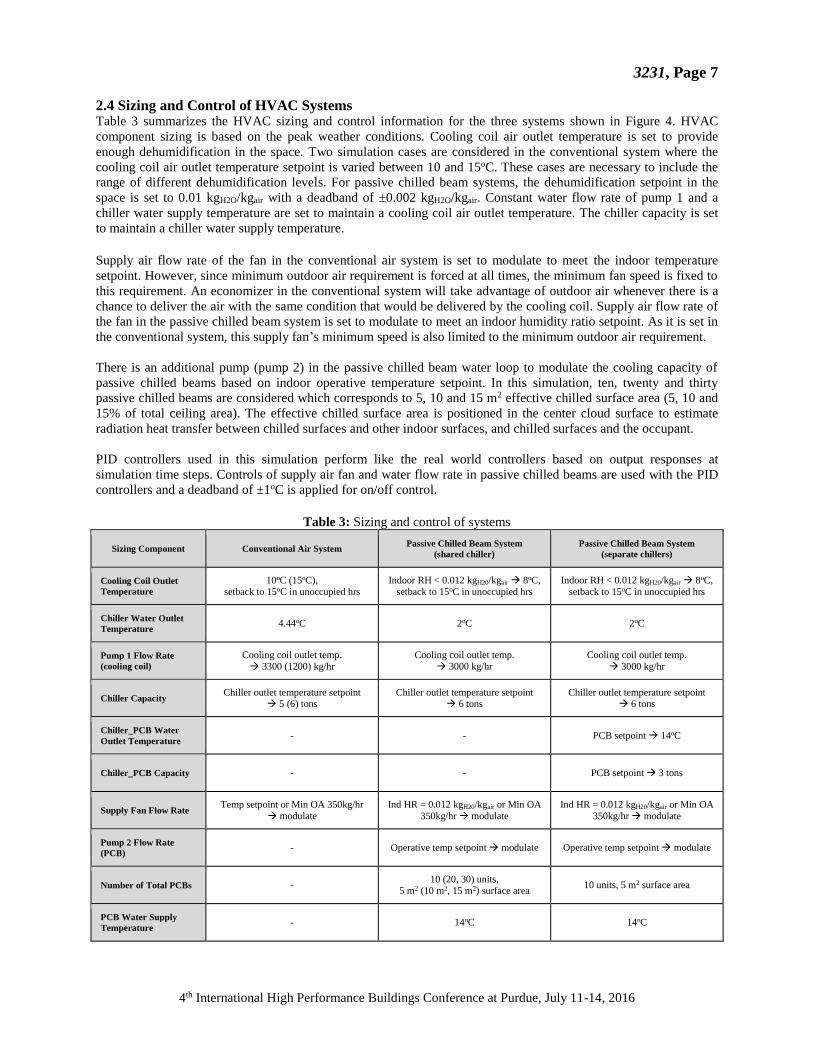
2.4 Sizing and Control of HVAC Systems Table 3 summarizes the HVAC sizing and control information for the three systems shown in Figure 4. HVAC
component sizing is based on the peak weather conditions. Cooling coil air outlet temperature is set to provide
enough dehumidification in the space. Two simulation cases are considered in the conventional system where the
cooling coil air outlet temperature setpoint is varied between 10 and 15oC. These cases are necessary to include the
range of different dehumidification levels. For passive chilled beam systems, the dehumidification setpoint in the
space is set to 0.01 kgH2O/kgair with a deadband of ±0.002 kgH2O/kgair. Constant water flow rate of pump 1 and a
chiller water supply temperature are set to maintain a cooling coil air outlet temperature. The chiller capacity is set
to maintain a chiller water supply temperature.
Supply air flow rate of the fan in the conventional air system is set to modulate to meet the indoor temperature
setpoint. However, since minimum outdoor air requirement is forced at all times, the minimum fan speed is fixed to
this requirement. An economizer in the conventional system will take advantage of outdoor air whenever there is a
chance to deliver the air with the same condition that would be delivered by the cooling coil. Supply air flow rate of
the fan in the passive chilled beam system is set to modulate to meet an indoor humidity ratio setpoint. As it is set in
the conventional system, this supply fan’s minimum speed is also limited to the minimum outdoor air requirement.
There is an additional pump (pump 2) in the passive chilled beam water loop to modulate the cooling capacity of
passive chilled beams based on indoor operative temperature setpoint. In this simulation, ten, twenty and thirty
passive chilled beams are considered which corresponds to 5, 10 and 15 m2 effective chilled surface area (5, 10 and
15% of total ceiling area). The effective chilled surface area is positioned in the center cloud surface to estimate
radiation heat transfer between chilled surfaces and other indoor surfaces, and chilled surfaces and the occupant.
PID controllers used in this simulation perform like the real world controllers based on output responses at
simulation time steps. Controls of supply air fan and water flow rate in passive chilled beams are used with the PID
controllers and a deadband of ±1oC is applied for on/off control.
Table 3: Sizing and control of systems
Sizing Component Conventional Air System Passive Chilled Beam System
(shared chiller)
Passive Chilled Beam System
(separate chillers)
Cooling Coil Outlet
Temperature
10oC (15oC),
setback to 15oC in unoccupied hrs
Indoor RH < 0.012 kgH20/kgair 8oC,
setback to 15oC in unoccupied hrs
Indoor RH < 0.012 kgH20/kgair 8oC,
setback to 15oC in unoccupied hrs
Chiller Water Outlet
Temperature 4.44oC 2oC 2oC
Pump 1 Flow Rate
(cooling coil)
Cooling coil outlet temp.
3300 (1200) kg/hr
Cooling coil outlet temp.
3000 kg/hr
Cooling coil outlet temp.
3000 kg/hr
Chiller Capacity Chiller outlet temperature setpoint
5 (6) tons Chiller outlet temperature setpoint
6 tons Chiller outlet temperature setpoint
6 tons
Chiller_PCB Water
Outlet Temperature - - PCB setpoint 14oC
Chiller_PCB Capacity - - PCB setpoint 3 tons
Supply Fan Flow Rate Temp setpoint or Min OA 350kg/hr
modulate
Ind HR = 0.012 kgH20/kgair or Min OA
350kg/hr modulate
Ind HR = 0.012 kgH20/kgair or Min OA
350kg/hr modulate
Pump 2 Flow Rate
(PCB) - Operative temp setpoint modulate Operative temp setpoint modulate
Number of Total PCBs - 10 (20, 30) units,
5 m2 (10 m2, 15 m2) surface area 10 units, 5 m2 surface area
PCB Water Supply
Temperature - 14oC 14oC

3231, Page 8
4th International High Performance Buildings Conference at Purdue, July 11-14, 2016
Figure 7: Comparison criterion for both systems
3. BASIS OF PERFORMANCE COMPARISON
The components described in the previous section are incorporated in TRNSYS to conduct transient simulations of
both the conventional air system and the passive chilled beam system over the cooling season. Since both
convection and radiation cooling are considered in the passive chilled beam system, it is important to set a basis of a
fair comparison between both systems. Energy and comfort should be compared based on the same the thermal
condition in the space. The operative temperature, which accounts for both dry-bulb temperature and mean radiant
temperature, is used in these simulations as an office temperature setpoint in order to achieve similar thermal
comfort conditions. Figure 7 shows the process of simulation sequence and the entire simulation cases for energy
savings and thermal comfort improvement comparisons. The air system is first simulated with a typical dry-bulb air
temperature setpoint (22.5oC), and based on post-processing, the average operative temperature (22.7oC) was found
during the simulation period. This operative temperature was used as the setpoint for the simulation of the passive
chilled beam system. A 0.6-min time step for twelve days in July weather data was used in the simulations.
The right hand side table in Figure 7 shows all simulation cases considered in this study. Case 0, 1, 2, 3-1 and 4 are
useful to verify the “energy savings” potential of passive chilled beams where two different passive chilled beam
system configurations are included in this scenario. Case 0, 1, 2, 3-1, 3-2 and 3-3 are useful in verifying the “thermal
comfort” improvement potential of passive chilled beams where four different radiation cooling levels are
considered in this scenario. Case 2 uses total cooling capacity as the convection cooling capacity and the chilled
surface temperature effect of passive chilled beams is completely removed from the calculation. Case 3-1 to 3-3
represents the case where 10, 20 and 30 passive chilled beams (5, 10 and 15% effective chilled surface area) are
installed in the space.
4. RESULTS Figure 8 shows the average thermal conditions for every case during the entire simulation period but only in
occupied hours (9am to 5pm). The dry-bulb temperature in the conventional system in the office area is maintained
at 22.5oC for most of the time during the working hours as shown in the graph in the middle. After the average
operative temperature was found to be 22.7oC, simulations for the passive chilled beam system were performed
based on this operative temperature setpoint. The thermal conditions in terms of the operative temperature setpoint
are achieved in the passive chilled beam simulations as shown in the left hand side graph in Figure 8. Since the
passive chilled beam system with radiation effect (Case 3 and 4) has an additional chilled surface of passive chilled
beams which can reduce the mean radiant temperature in the space, the average mean radiant temperature in these
cases are slightly lower (≤22.9oC) than the other simulation cases as shown in the right hand side graph in Figure 8.
And this also results in relatively higher average dry-bulb temperature (≥22.5oC) for those cases.

3231, Page 9
4th International High Performance Buildings Conference at Purdue, July 11-14, 2016
Figure 8: Thermal conditions in office area during simulation period (9am to 5pm)
4.1 Energy Savings Potential Figure 9 shows the total power consumption for different cases, relative energy savings from the chiller and fan
against case 0 and the sensible and latent loads of the cooling coil and passive chilled beams in each case. Compared
to case 0, the passive chilled beam system can save 10-12% of total energy (5-6% from the chiller and 60-76% from
the fan) with shared chiller configuration (Figure 4 (b)) while using separate chillers (Figure 4 (c)) can increase this
savings to 23% (25% from the chiller and 60-76% from the fan). The passive chilled beam system is not favorable
in terms of energy savings compared to case 1. This is mostly because of more efficient use of the economizer by
increasing the cooling coil outlet temperature to 15oC. It has to be noted again that case 0 and 1 represent the
minimum and maximum dehumidification levels in the office space.
There are several useful observations from these results. First is the effect of decoupling of sensible and latent load.
Supply air fan changes its role from handling sensible load to latent load in the passive chilled beam system. Since
latent load is typically much smaller than sensible load, supply fan energy savings is always guaranteed. As it is also
covered in a previous study (Kim, Braun, & Tzempelikos, 2014), a conventional system which is operated based on
the sensible load requirement can dehumidify the space excessively in some cases. This excessive dehumidification
usually stands out when the climatic condition is “dry” during the cooling season. In this study where the climate is
relatively “humid”, savings from the latent load reduction were insignificant. The last graph in Figure 9 shows the
sensible and latent loads for the cooling coil and passive chilled beams between cases during the entire simulation
period. Case 1 shows less latent load than all the other cases. This is where the economizer takes advantage of the
situation. Since the cooling coil air outlet temperature has been increased to 15oC, the economizer recovers more
favorable energy from the return air stream and can reduce the latent load on the cooling coil. Although a smaller
size pump can be used in case 1, increased cooling coil air outlet temperature results in greater fan use. As shown in
Figure 9, using a dedicated chiller for passive chilled beams can increase energy savings on chiller by 11%. This is
the advantage of using a chiller with higher operating temperature (14oC rather than 4.44oC), which makes the
chiller run at higher efficiency. Differences in radiation cooling do not affect the energy consumption estimates.
Figure 9: Energy savings of passive chilled beam system
3231, Page 10
4th International High Performance Buildings Conference at Purdue, July 11-14, 2016
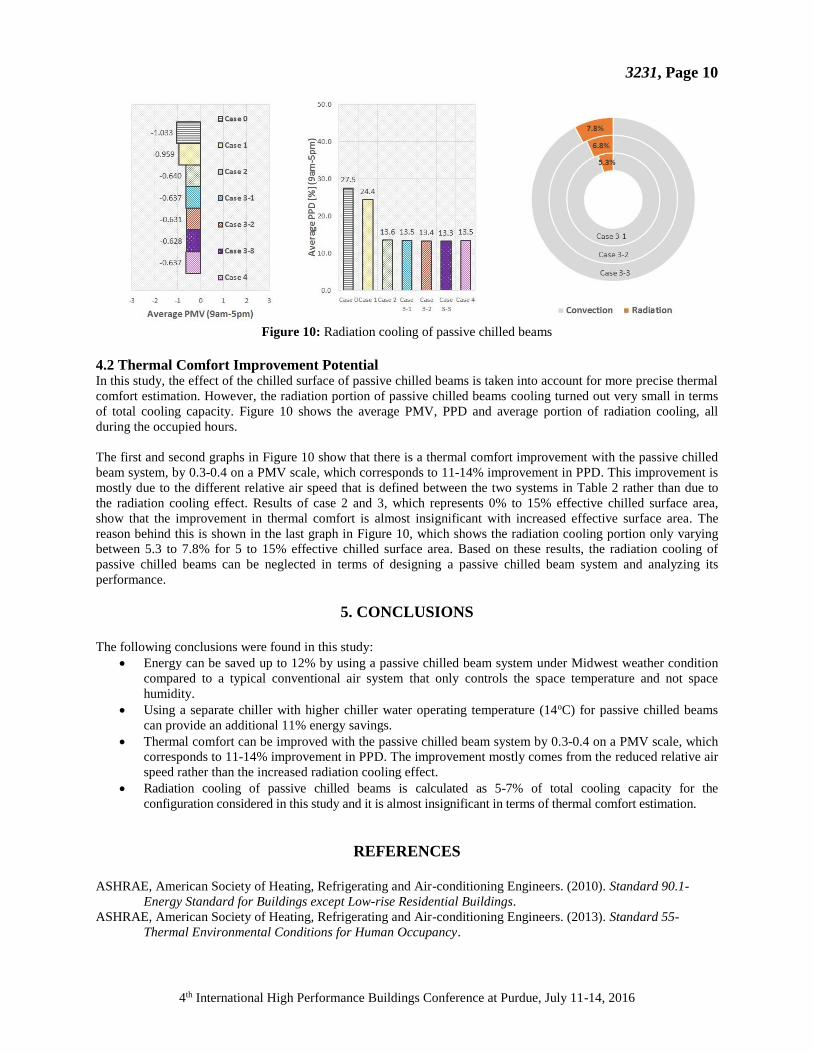
Figure 10: Radiation cooling of passive chilled beams
4.2 Thermal Comfort Improvement Potential In this study, the effect of the chilled surface of passive chilled beams is taken into account for more precise thermal
comfort estimation. However, the radiation portion of passive chilled beams cooling turned out very small in terms
of total cooling capacity. Figure 10 shows the average PMV, PPD and average portion of radiation cooling, all
during the occupied hours.
The first and second graphs in Figure 10 show that there is a thermal comfort improvement with the passive chilled
beam system, by 0.3-0.4 on a PMV scale, which corresponds to 11-14% improvement in PPD. This improvement is
mostly due to the different relative air speed that is defined between the two systems in Table 2 rather than due to
the radiation cooling effect. Results of case 2 and 3, which represents 0% to 15% effective chilled surface area,
show that the improvement in thermal comfort is almost insignificant with increased effective surface area. The
reason behind this is shown in the last graph in Figure 10, which shows the radiation cooling portion only varying
between 5.3 to 7.8% for 5 to 15% effective chilled surface area. Based on these results, the radiation cooling of
passive chilled beams can be neglected in terms of designing a passive chilled beam system and analyzing its
performance.
5. CONCLUSIONS
The following conclusions were found in this study:
Energy can be saved up to 12% by using a passive chilled beam system under Midwest weather condition
compared to a typical conventional air system that only controls the space temperature and not space
humidity.
Using a separate chiller with higher chiller water operating temperature (14oC) for passive chilled beams
can provide an additional 11% energy savings.
Thermal comfort can be improved with the passive chilled beam system by 0.3-0.4 on a PMV scale, which
corresponds to 11-14% improvement in PPD. The improvement mostly comes from the reduced relative air
speed rather than the increased radiation cooling effect.
Radiation cooling of passive chilled beams is calculated as 5-7% of total cooling capacity for the
configuration considered in this study and it is almost insignificant in terms of thermal comfort estimation.
REFERENCES
ASHRAE, American Society of Heating, Refrigerating and Air-conditioning Engineers. (2010). Standard 90.1-
Energy Standard for Buildings except Low-rise Residential Buildings.
ASHRAE, American Society of Heating, Refrigerating and Air-conditioning Engineers. (2013). Standard 55-
Thermal Environmental Conditions for Human Occupancy.

3231, Page 11
4th International High Performance Buildings Conference at Purdue, July 11-14, 2016
A Transient System Simulation Program, Version 17. (2015). TRNSYS (Version 17). University of Wisconsin.
Retrieved from http://sel.me.wisc.edu/trnsys/
Energy technology perspectives 2012, Pathways to a Clean Energy System. (2012) (SECOND EDITION). Paris:
International Energy Agency (IEA).
Feng, J. D., Bauman, F., & Schiavon, S. (2013). Experimental comparison of zone cooling load between radiant and
air systems. Energy and Buildings. Retrieved from https://escholarship.org/uc/item/9dq6p2j7#page-1
Feng, J. (Dove), Schiavon, S., & Bauman, F. (2013). Cooling load differences between radiant and air systems.
Energy and Buildings, 65, 310–321. http://doi.org/10.1016/j.enbuild.2013.06.009
Fredriksson, J., & Sandberg, M. (2009). The effect of false ceiling on the cooling capacity of passive chilled beams.
Building and Environment, 44(7), 1426–1430. http://doi.org/10.1016/j.buildenv.2008.06.017
Fredriksson, J., Sandberg, M., & Moshfegh, B. (2001). Experimental investigation of the velocity field and airflow
pattern generated by cooling ceiling beams. Building and Environment, 36(7), 891–899.
Imanari, T., Omori, T., & Bogaki, K. (1999). Thermal comfort and energy consumption of the radiant ceiling panel
system.: Comparison with the conventional all-air system. Energy and Buildings, 30, 167–175.
http://doi.org/10.1016/S0378-7788(98)00084-X
Kim, J., Braun, J. E., & Tzempelikos, A. (2014). Energy Savings Potential of Passive Chilled Beam System as a
Retrofit Option for Commercial Buildings in Different Climates. Presented at the International High
Performance Buildings Conference. Retrieved from
http://docs.lib.purdue.edu/cgi/viewcontent.cgi?article=1106&context=ihpbc
Kim, J., Braun, J. E., & Tzempelikos, A. (2015). Characterizing the In-Situ Performance of Passive Chilled Beams.
ASHRAE Transactions, 121, 1N,2N,3N,4N,5N,6N,7N,8N.
Kim, J., Tzempelikos, A., & Braun, J. E. (2015). Review of modelling approaches for passive ceiling cooling
systems. Journal of Building Performance Simulation, 8(3), 145–172.
http://doi.org/10.1080/19401493.2014.899394
Kosonen, R., Saarinen, P., Koskela, H., & Hole, A. (2010). Impact of heat load location and strength on air flow
pattern with a passive chilled beam system. Energy and Buildings, 42(1), 34–42.
http://doi.org/10.1016/j.enbuild.2009.07.008
Livchak, A., & Lowell, C. (2012). Don’t turn active beams into expensive diffusers. ASHRAE Journal, 52–60.
Mustakallio, P., Bolashikov, Z., Kostov, K., Melikov, A., & Kosonen, R. (2016). Thermal environment in simulated
offices with convective and radiant cooling systems under cooling (summer) mode of operation. Building
and Environment, 100, 82–91. http://doi.org/10.1016/j.buildenv.2016.02.001
Nelson, I. C., Culp, C. H., Rimmer, J., & Tully, B. (2016). The effect of thermal load configuration on the
performance of passive chilled beams. Building and Environment, 96, 188–197.
http://doi.org/10.1016/j.buildenv.2015.11.017
Niu, J. L., Zhang, L. Z., & Zuo, H. G. (2002). Energy savings potential of chilled-ceiling combined with desiccant
cooling in hot and humid climates. Energy and Buildings, 34(5), 487–495. http://doi.org/10.1016/S0378-
7788(01)00132-3
Sastry, G., & Rumsey, P. (2014). VAV vs. Radiant, Side-by-Side Comparison. ASHRAE Journal, 16–24.
Stetiu, C. (1999). Energy and peak power savings potential of radiant cooling systems in US commercial buildings.
Energy and Buildings, 30(2), 127–138.
Thermal Radiation Heat Transfer, 5th Edition. (2011). Retrieved from https://www.crcpress.com/Thermal-
Radiation-Heat-Transfer-5th-Edition/Howell-Menguc-Siegel/9781439866689
Thornton, B.A. et al. (2011). Achieving the 30% Goal: Energy and Cost Savings Analysis of ASHRAE Standard
90.1-2010 (No. PNNL-20405). Pacific Northwest National Laboratory. Retrieved from
http://www.pnl.gov/main/publications/external/technical_reports/PNNL-20405.pdf
ACKNOWLEDGEMENT
The authors would like to acknowledge Donghun Kim and Jie Cai for their preliminary work on the Living Lab
envelope model and experimental data measurements.