PERFORMANCE ET COMPORTEMENT DES VEHICULES · Power and forces diagram ... Forces and moments are...
73
Vehicle Performance Pierre Duysinx Research Center in Sustainable Automotive Technologies of University of Liege Academic Year 2018-2019 1
Transcript of PERFORMANCE ET COMPORTEMENT DES VEHICULES · Power and forces diagram ... Forces and moments are...
Vehicle Performance
Pierre DuysinxResearch Center in Sustainable Automotive
Technologies of University of Liege
Academic Year 2018-2019
1

Lesson 2:Tractive efforts and road loads
2
Outline
◼ DESCRIPTION OF VEHICLE MOTION
◼ Longitudinal motion
◼ POWER AND TRACTIVE FORCE AT WHEELS
◼ Transmission efficiency
◼ Gear ratio
◼ Expression of power and forces at wheels
◼ Power and forces diagram
◼ VEHICLE RESISTANCE
◼ Aerodynamic
◼ Rolling resistance
◼ Grading resistance
◼ General expression of vehicle resistance forces
3

References
◼ T. Gillespie. « Fundamentals of vehicle Dynamics », 1992, Society of Automotive Engineers (SAE)
◼ R. Bosch. « Automotive Handbook ». 5th edition. 2002. Society of Automotive Engineers (SAE)
◼ J.Y. Wong. « Theory of Ground Vehicles ». John Wiley & sons. 1993 (2nd edition) 2001 (3rd edition).
◼ W.H. Hucho. « Aerodynamics of Road Vehicles ». 4th edition. SAE International. 1998.
◼ M. Eshani, Y. Gao & A. Emadi. Modern Electric, Hybrid Electric and Fuel Cell Vehicles. Fundamentals, Theory and Design. 2nd
Edition. CRC Press.
4

Assumptions and definitions
5

Assumptions
◼ The vehicle is made of several components or subsystems
◼ We consider the motion of the system as a whole
◼ During acceleration, braking, turn, the vehicle is considered as a rigid body motion and is characterized by its geometry, its mass and inertia properties
6

Reference frames
Local reference frame oxyz attached to the vehicle body -SAE (Gillespie, fig. 1.4)
XY Z
O
Inertial coordinate system OXYZ
7

Reference frames
◼ Inertial reference frame
◼ X direction of initial displacement or reference direction
◼ Y right side travel
◼ Z towards downward vertical direction
◼ Vehicle reference frame (SAE):
◼ x along motion direction and vehicle symmetry plane
◼ z along vertical direction pointing to the center of the earth
◼ y in the lateral direction on the right hand side of the driver towards the downward vertical direction
◼ o, origin at the center of mass
8
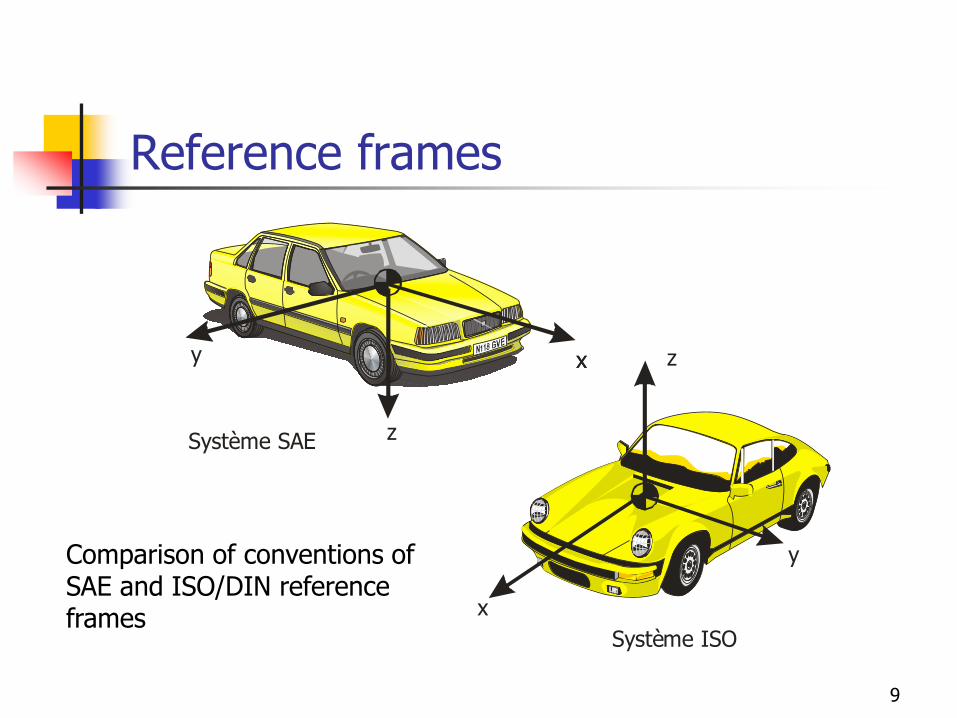
Reference frames
z
x
y x
Système SAE
Système ISO
x z
yComparison of conventions of SAE and ISO/DIN reference frames
9

Local velocity vectors
◼ Vehicle motion is often studied in car-body local systems◼ u forward speed (+ if in front)
◼ v side speed (+ to the right)
◼ w vertical speed (+ downward)
◼ p rotation speed about a axis (roll speed)
◼ q rotation speed about y (pitch)
◼ r rotation speed about z (yaw)
10

Forces
◼ Forces and moments are accounted positively when acting onto the vehicle and the positive direction with respect to the considered frame
◼ Corollary
◼ A positive Fx force is propelling the vehicle forward
◼ The reaction force of the ground onto the wheels is accounted negatively.
◼ Because of the inconveniency of this definition, the SAEJ670e « Vehicle Dynamics Terminology » is naming as normal force a force acting downward while vertical forces are referring to upward forces
11

Equilibrium of longitudinal motion
12
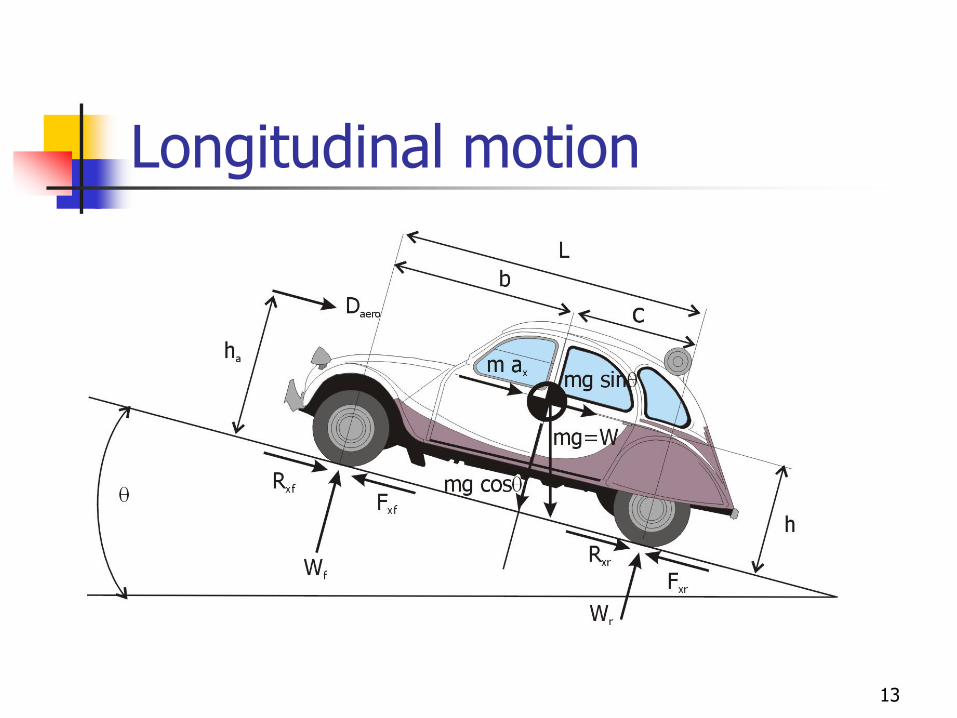
Longitudinal motion
13
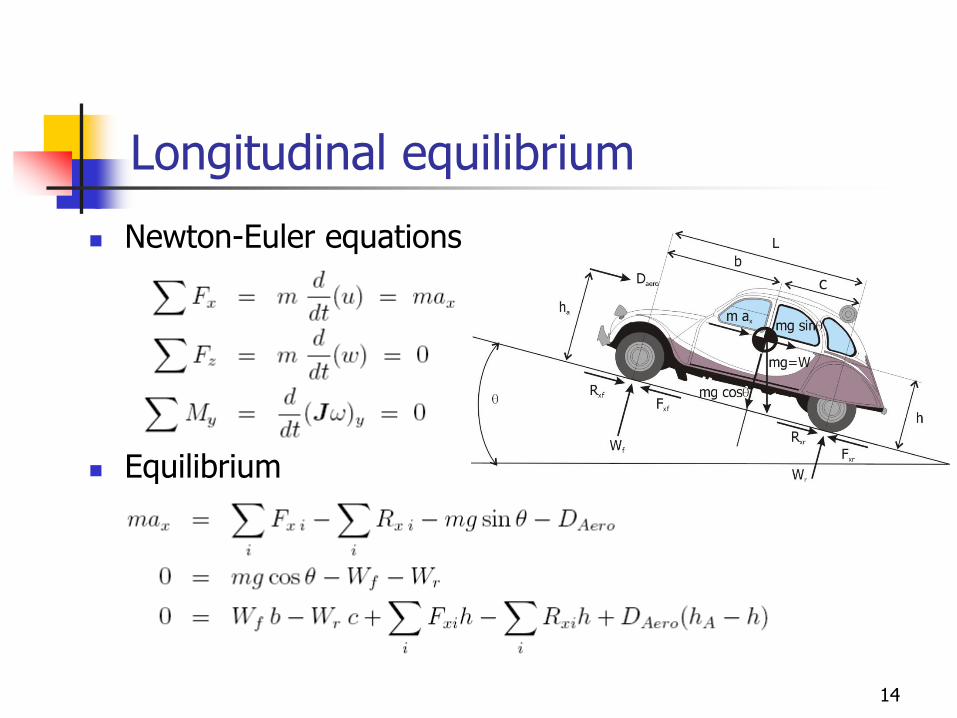
Longitudinal equilibrium
◼ Newton-Euler equations
◼ Equilibrium
14

Longitudinal equilibrium
◼ Equilibrium along forward x direction
◼ Equation of vehicle longitudinal motion
◼ In energy form
15

Propulsion system architecture
16
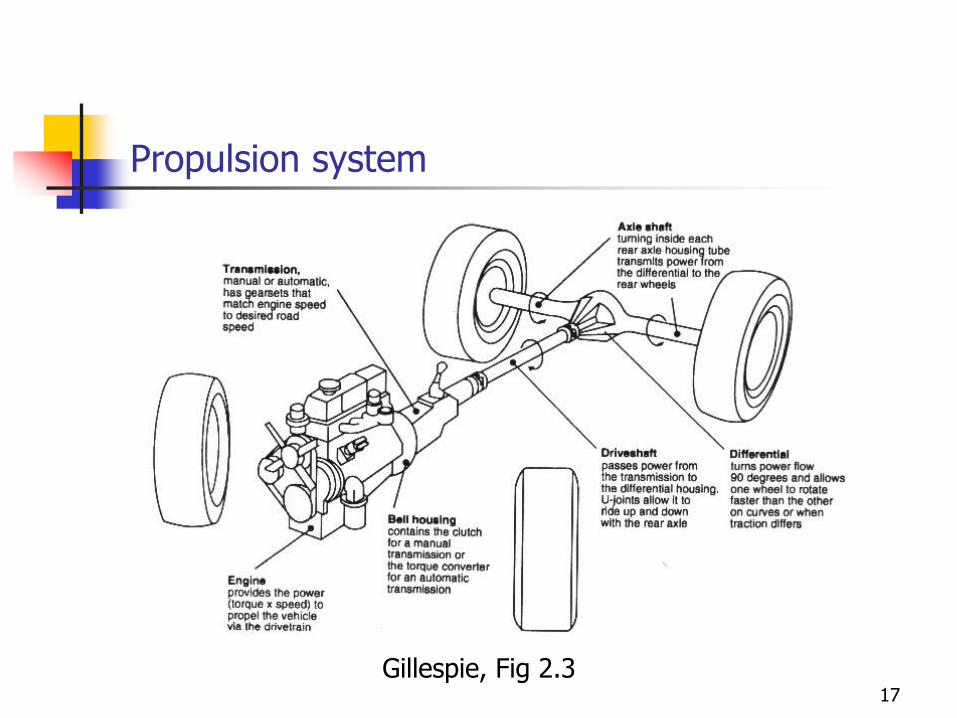
Propulsion system
Gillespie, Fig 2.317

Layout of transmission
Transversal mounting Longitudinal mounting18
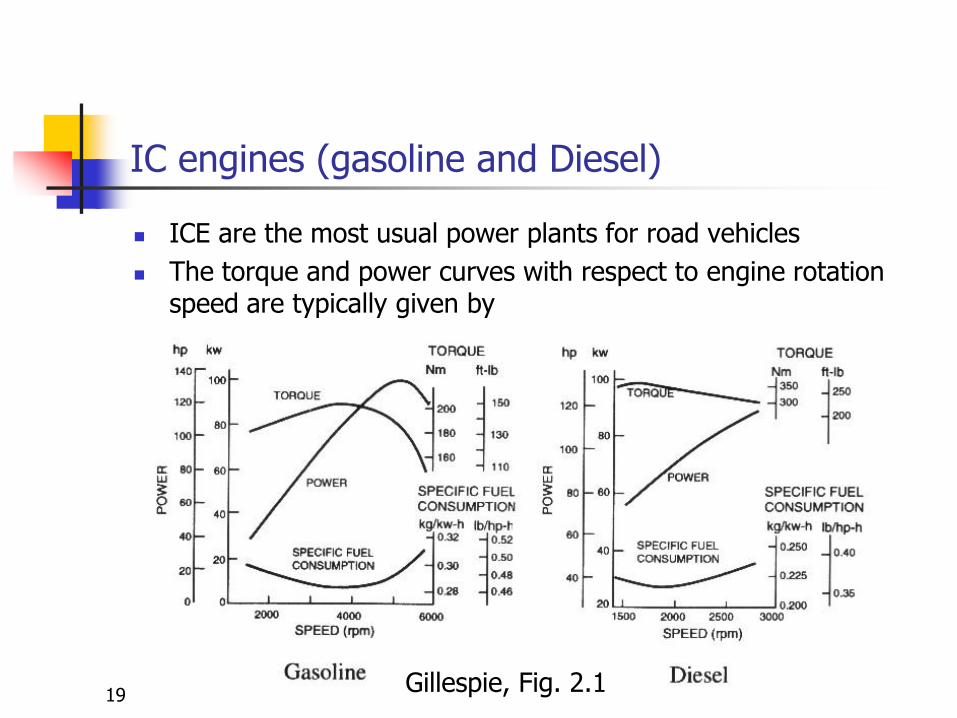
IC engines (gasoline and Diesel)
◼ ICE are the most usual power plants for road vehicles
◼ The torque and power curves with respect to engine rotation speed are typically given by
Gillespie, Fig. 2.119
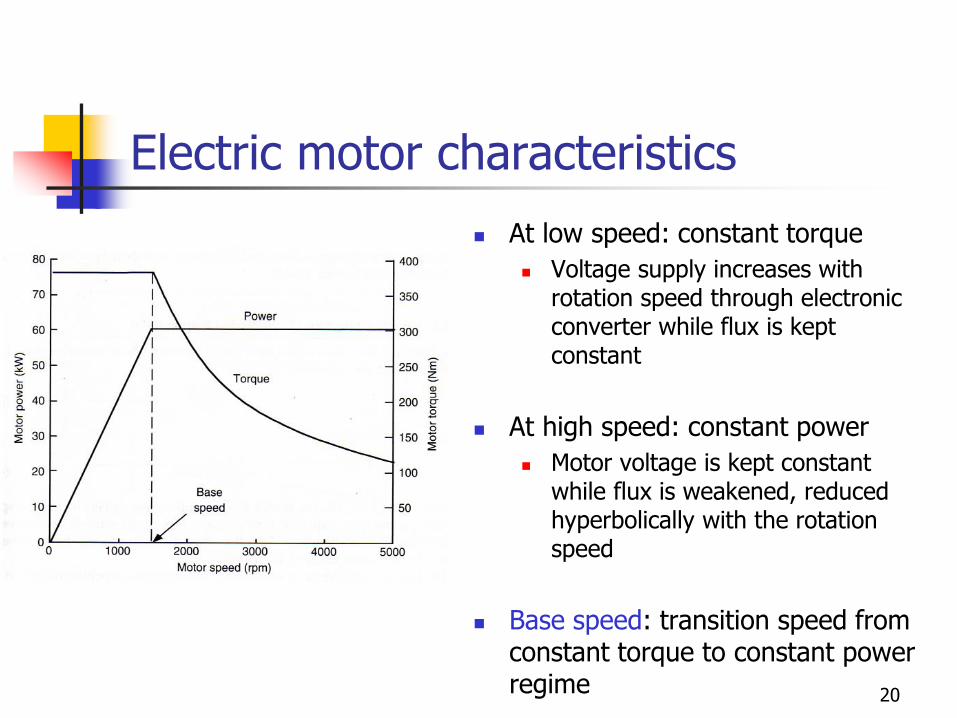
Electric motor characteristics
◼ At low speed: constant torque
◼ Voltage supply increases with rotation speed through electronic converter while flux is kept constant
◼ At high speed: constant power
◼ Motor voltage is kept constant while flux is weakened, reduced hyperbolically with the rotation speed
◼ Base speed: transition speed from constant torque to constant power regime 20

Friction Clutch
21
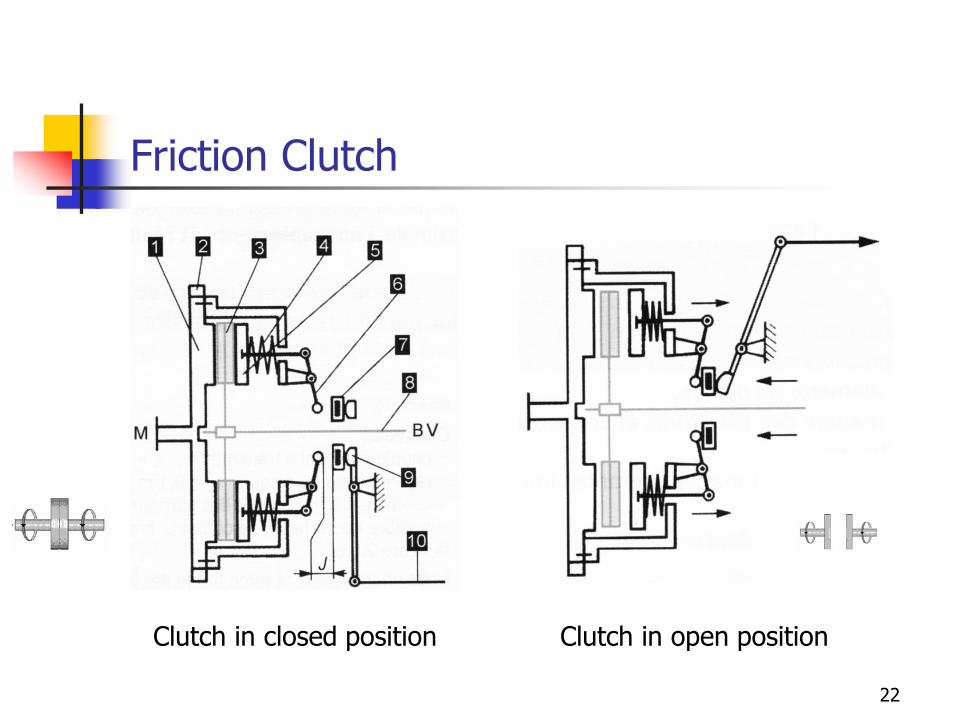
Friction Clutch
Clutch in closed position Clutch in open position
22

Torque converter (Hydraulic coupling)
23

Hydraulic coupling
◼ Principle: use the hydro kinetic energy of the fluid to transfer smoothly the power from the source to the load while amplifying the output torque
◼ The input wheel plays the role of a pump whereas the output wheel acts as a turbine
◼ One may add a fixed wheel (stator) to improve the efficiency
24

Friction and hydraulic clutches
◼ Clutch efficiency
◼ Friction clutch h=1
◼ Hydraulic coupler: h~0.9
25

Manual gear boxes
Gear box principles
Input shaft
Output shaft
Intermediateshaft
Direct transmission
26

The gear pairs
◼ Meshed gears behave like two rigid cylinders with equivalent pitch diameters d01 and d02 rolling on each other without any slippage
◼ If there is no slippage, on can write
◼ Thus the reduction ration i
◼ For external meshing, there is an inversion of rotation direction while for internal gear meshes, the gear rotation direction is preserved (like belt and pulleys or chains)
27
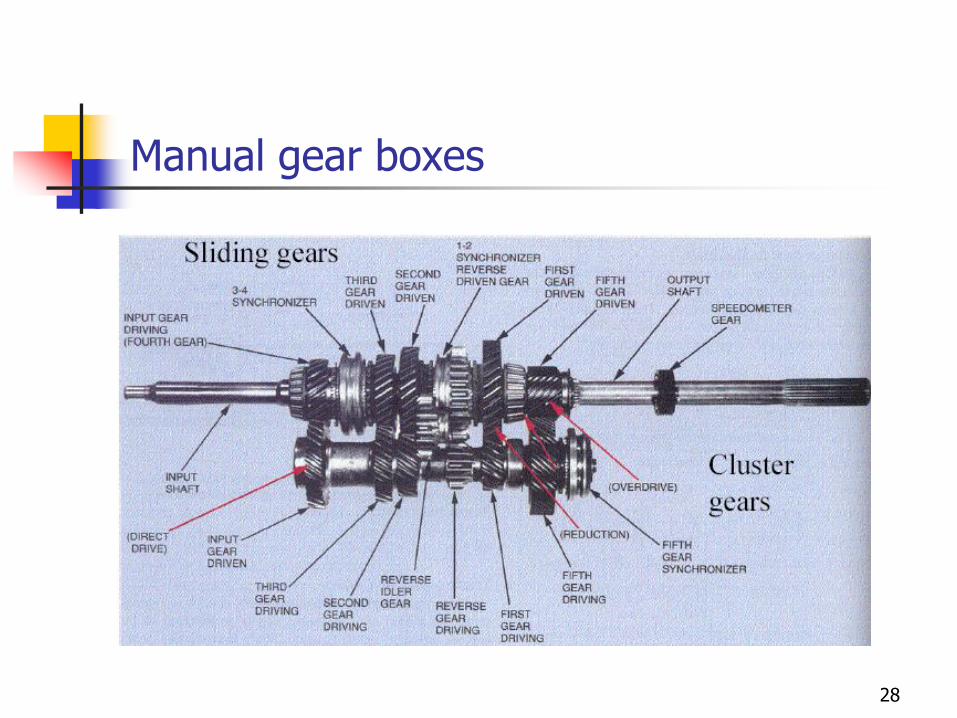
Manual gear boxes
28

Manual gear boxes
Neutral
1st 2nd
3rd
Reverse29

Manual gear boxes
Gear selection30
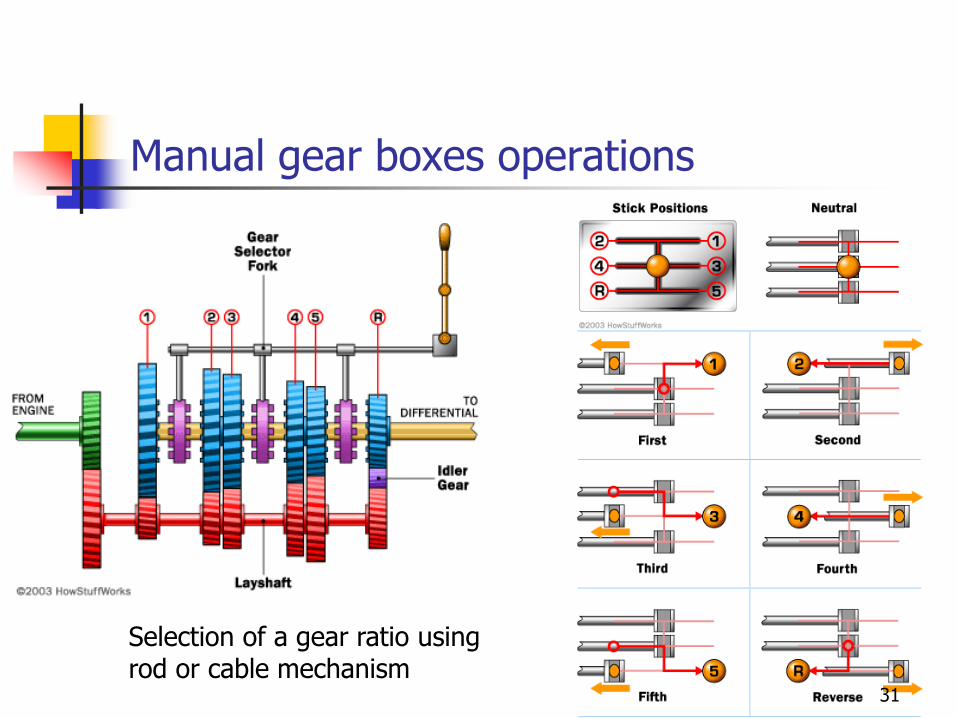
Manual gear boxes operations
Selection of a gear ratio using rod or cable mechanism
31
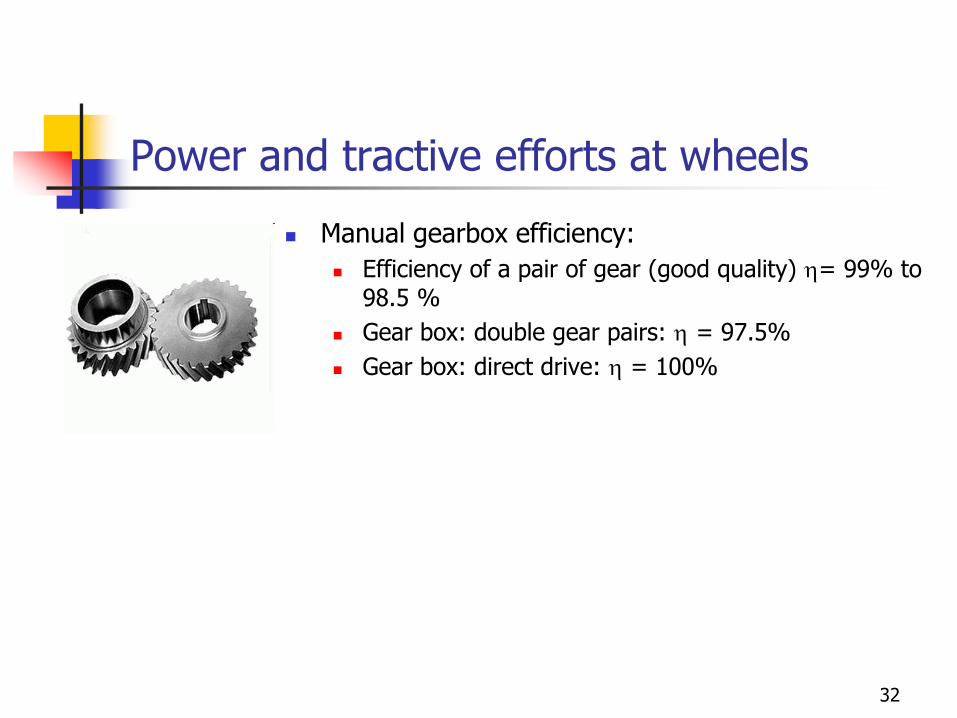
Power and tractive efforts at wheels
◼ Manual gearbox efficiency:
◼ Efficiency of a pair of gear (good quality) h= 99% to 98.5 %
◼ Gear box: double gear pairs: h = 97.5%
◼ Gear box: direct drive: h = 100%
32

CVT : Van Doorne System
Pulleys with variable radii
33
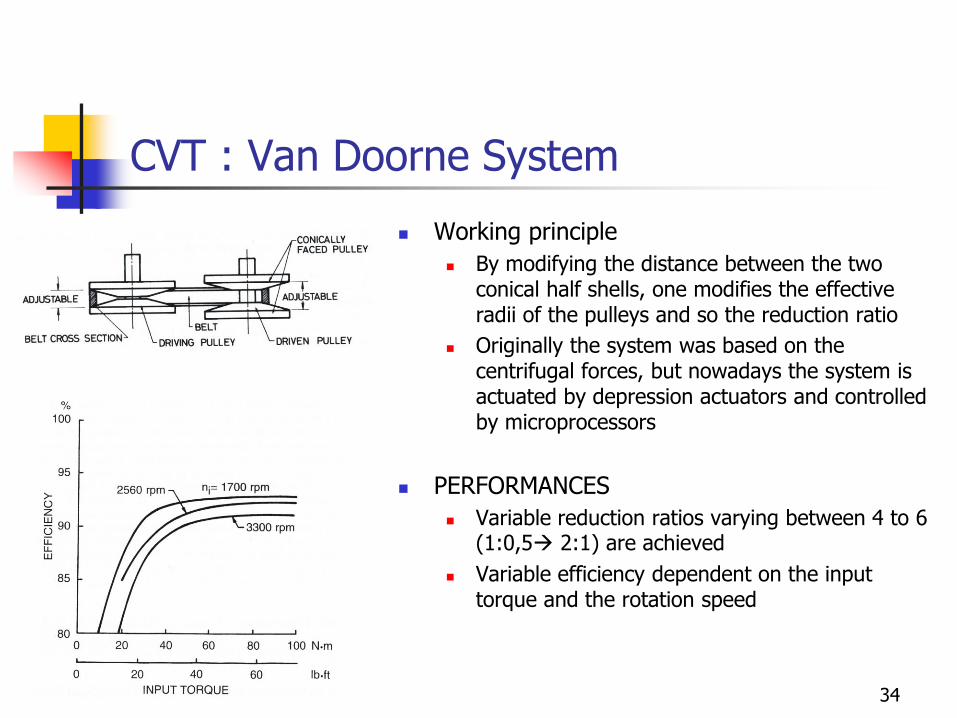
CVT : Van Doorne System
◼ Working principle
◼ By modifying the distance between the two conical half shells, one modifies the effective radii of the pulleys and so the reduction ratio
◼ Originally the system was based on the centrifugal forces, but nowadays the system is actuated by depression actuators and controlled by microprocessors
◼ PERFORMANCES
◼ Variable reduction ratios varying between 4 to 6 (1:0,5→ 2:1) are achieved
◼ Variable efficiency dependent on the input torque and the rotation speed
34
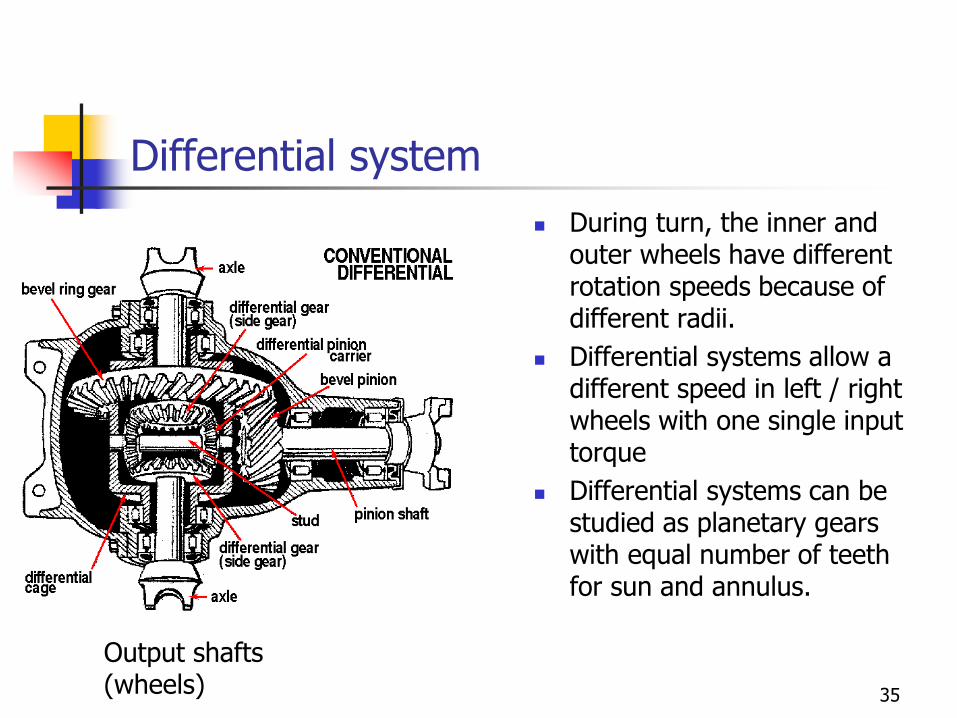
Differential system
◼ During turn, the inner and outer wheels have different rotation speeds because of different radii.
◼ Differential systems allow a different speed in left / right wheels with one single input torque
◼ Differential systems can be studied as planetary gears with equal number of teeth for sun and annulus.
Output shafts (wheels) 35

Differential system
◼ The differential is a component that allows splitting the input power between the two output shafts.
◼ For a front or rear axle, the power is divided between left and right wheels.
◼ When the vehicle is turning, differential allwos the two half shafts spinning a different rotation speeds

Differential system
DIFFERENTIALOPERATION PRINCIPLE
Input shaft (engine)
Output shafts
(wheel)s
37

Differential system
Working principle of differential system38

Differential system
◼ Efficiency of differential
◼ Longitudinal layout: 90° change of direction (bevel pair) + offset of the shaft (hypoid gear): h = 97,5 %
◼ Transversal layout: no bevel → good quality gear pair: h = 98,75%
39

Power train tractive effort
40

Power and tractive effort
POWER AT WHEELS
◼ The power that comes to the wheels is the engine power multiplied by the efficiency of the transmission efficiency h
◼ The driveline efficiency h :
◼ Clutch
◼ Gear box
◼ Differential and transfer box
◼ Kinematic joints
41

Power and tractive effort
Gear ratio Longitudinal layout
Transversal layout
Friction clutch Normal 1. 0,975. 0,975 = 0,95
1. 0,975 0,985 = 0,96
Direct 1. 1. 0,975 = 0,975
x
Hydraulic coupling
Normal 0,88 0,975 0,975 = 0,86
0,88 0,975 0,985 = 0,865
Direct 0,88 1. 0,975 = 0,88
x
Global efficiency in various situations
42

Power and tractive effort
WHEEL TRACTIVE EFFORT
◼ Power at wheels and power at the plant
◼ Gear ratio i>1
◼ Displacement speed and rotation speed of the wheels
◼ Re: effective rolling radius of the tire
43

Power and tractive effort
TRACTIVE FORCE
◼ Relation between plant rotation speed and traveling speed
◼ Transmission length R/i
◼ Indicates the travelling speed for a given plant rotation speed.
◼ Generally given in km/h per rpm of the plant
◼ Example 30 km/h per 1000 tr/min
44
Power and tractive effort
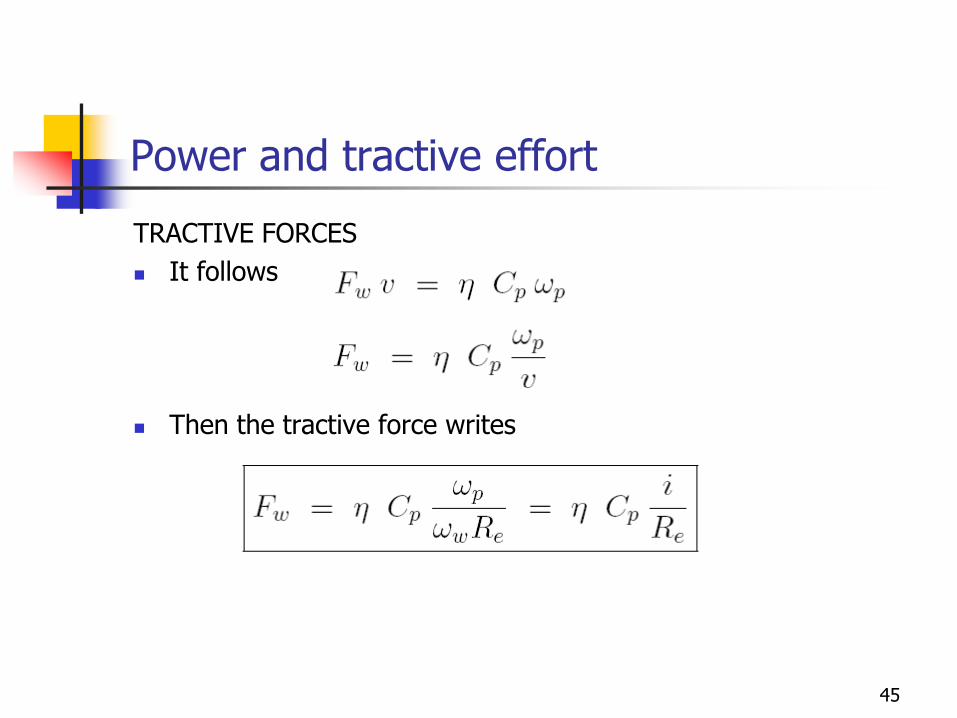
TRACTIVE FORCES
◼ It follows
◼ Then the tractive force writes
45
Tractive force vs vehicle speed
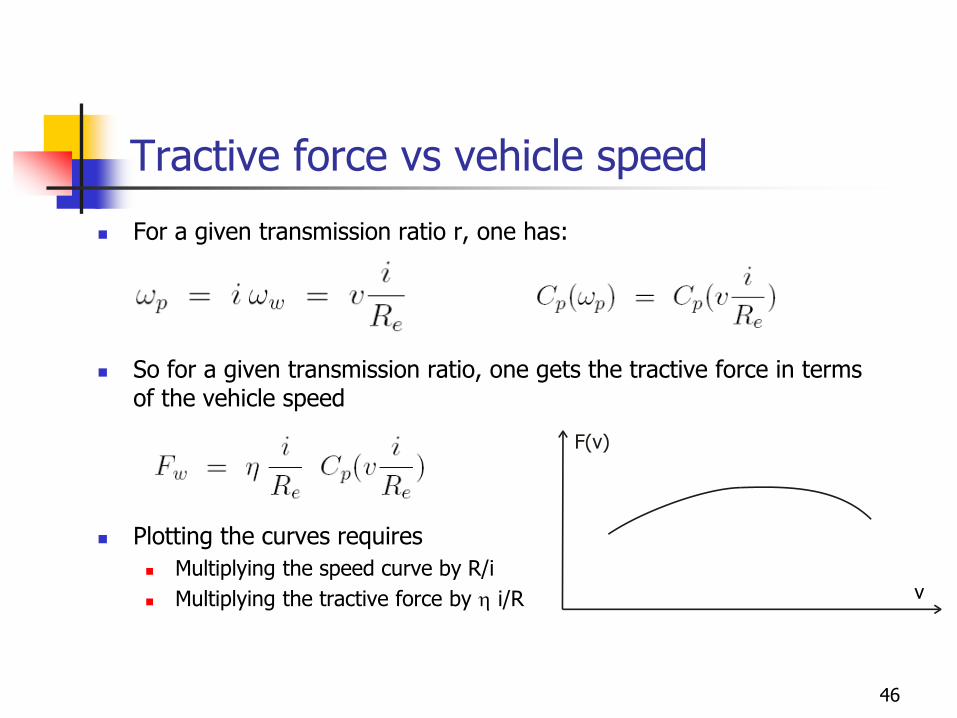
◼ For a given transmission ratio r, one has:
◼ So for a given transmission ratio, one gets the tractive force in terms of the vehicle speed
◼ Plotting the curves requires
◼ Multiplying the speed curve by R/i
◼ Multiplying the tractive force by h i/R v
46
Tractive force vs vehicle speed
v
I
II
III
IV
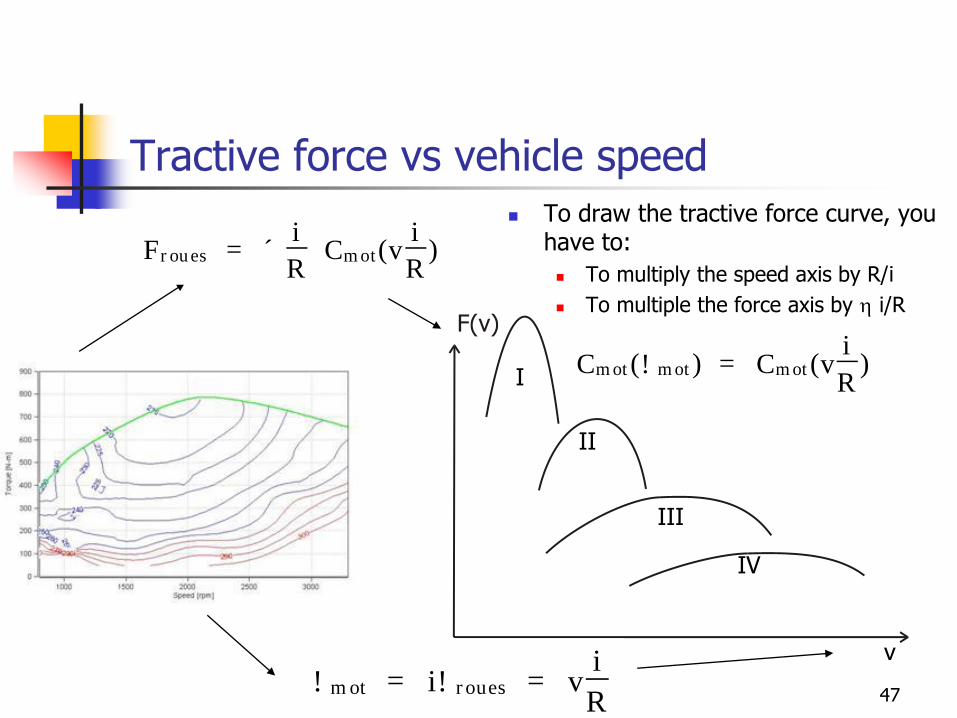
! m o t = i ! r o u e s = v
i
R
C m o t ( ! m o t ) = C m o t ( v
i
R
)
F r o u e s = ´
i
R
C m o t ( v
i
R
)
47
◼ To draw the tractive force curve, you have to:
◼ To multiply the speed axis by R/i
◼ To multiple the force axis by h i/R
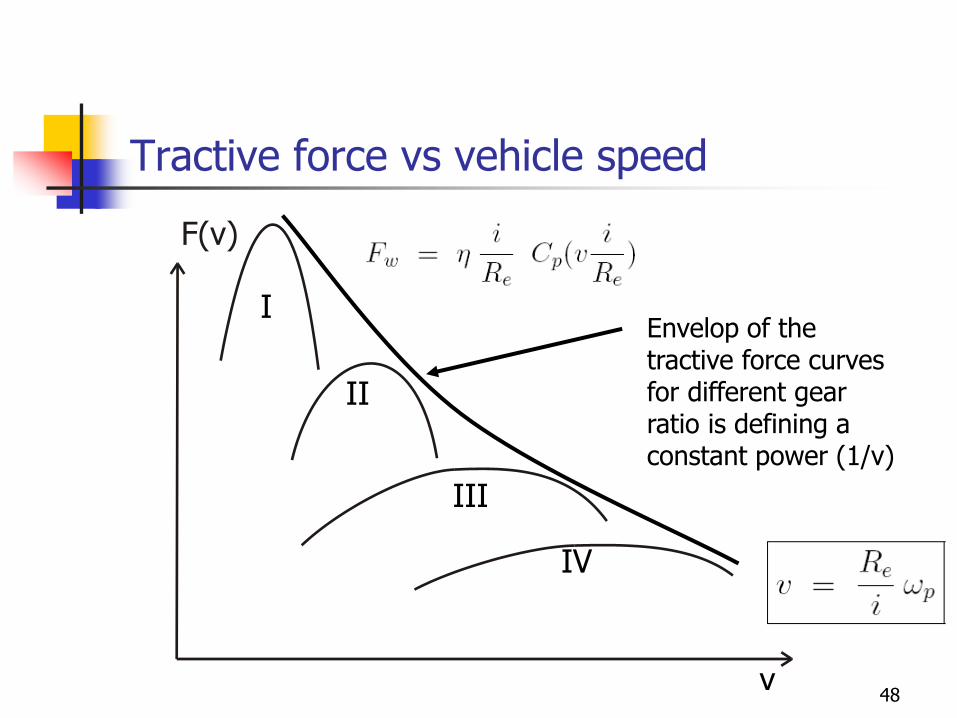
Tractive force vs vehicle speed
v
I
II
III
IV
Envelop of the tractive force curves for different gear ratio is defining a constant power (1/v)
48
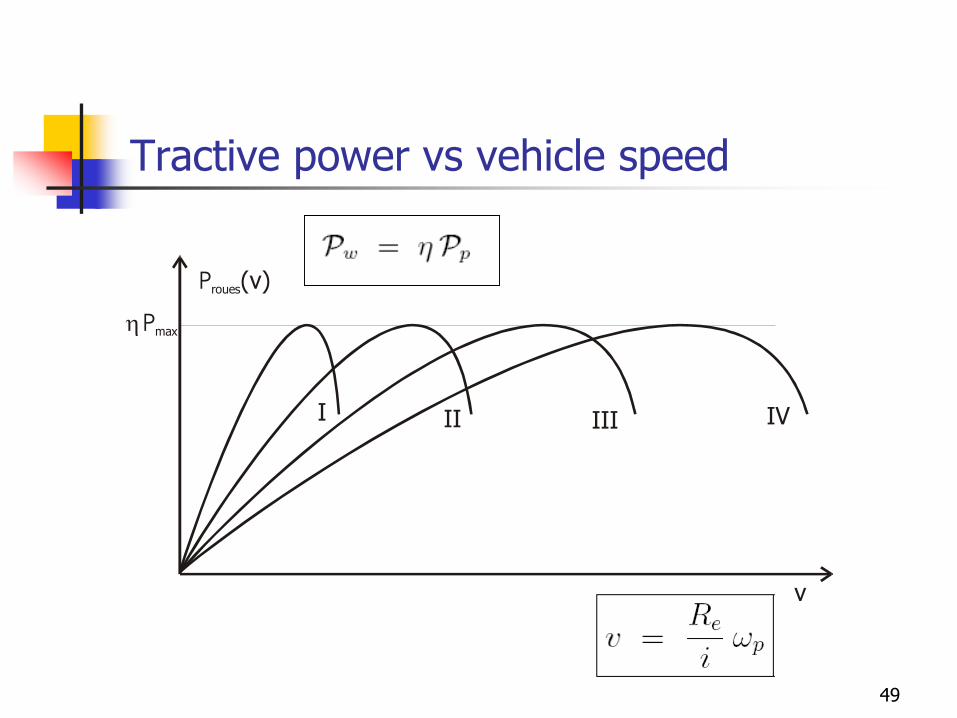
Tractive power vs vehicle speed
Proues(v)
v
h Pmax
I II III IV
49

Tractive force vs vehicle speed
Gillespie, Fig 2.5, 2.6
Effect of automatic transmission and hydraulic clutch
50

Vehicle resistance
51
Vehicle resistance
◼ The vehicle resistance forces include 3 types of forces
◼ Aerodynamic forces (drag force)
◼ Rolling resistance due to energy dissipation in tires, suspensions, shock absorbers, etc.
◼ Grading resistance due to the slope of the road
52

Aerodynamic forces and moments
◼ The air flow around the vehicle during its motion creates aerodynamic forces that can become important especially at high speed
◼ The vehicle is a so-called bluff body which generates a lot of vortices and turbulent flows, especially at the level of back of the roof.
◼ The air flow is very complex because of◼ The ground effect that affects deeply the flow◼ The wheel spinning that interact strongly with the vehicle air flow. ◼ The internal aerodynamic flow is necessary to cool the engine
compartment and the air conditioning of the cabin but it introduces a drag penalty
53

Aerodynamic forces and moments
◼ The aerodynamic forces have two major components:
◼ Shape drag : the shape of the vehicle modifies the air flow creating a pressure distributions giving rise to a net force pointing backward
Because of Mach and Reynolds numbers, the fluid flow is incompressible and non viscous (except in the boundary layers)
Large vortices are present because of the bluff body geometry and the boundary layers are not attached
◼ Skin friction : the viscosity effects, which take place in the boundary layers around the vehicle skin
54

Aerodynamic forces and moments
Air flow around a car (Gillespie, Fig4.1)
Stagnation pointp = pt
Low pressure / high speedHigh pressure /low speed
CsteVpp st =+= 22/1
55

Aerodynamic forces and moments
• Flow separation in presence of large adverse pressure gradient
Gillespie Fig 4.4
Low pressureHigh pressure
DragGillespie Fig 4.5
56

Aerodynamic forces and moments
22/1 V
ppc atm
p
−=
Gillespie Fig 4.6 : Pressure distribution along the central line of the car
High pressureFlow separation
57

Estimating the aerodynamic drag
◼ Drag force
◼ Estimating the frontal area
◼ Using CAD system
◼ Using Pixel counting
◼ Approximation : Paul Frere formula
58

Typical drag coefficient of automobiles
(Wong Table 3.1)
59

Main sources of the drag of passenger car
◼ 65% of drag comes from the body shape (front, back, floor, skin)
◼ Large potential of reduction, especially for the back of the car to control the separation flows
◼ Influence as well of
◼ Wheels (21%)
◼ Details (7%)
◼ Internal aerodynamics (6%)
Gillespie Fig 4.1160

Rolling resistance forces
◼ Under free rolling conditions, it is necessary to apply a torque to maintain the motion and counteract the rolling resistance moment.
◼ The rolling resistance is covering a large number of phenomena of different natures:◼ The energy dissipation in the tire due to the hysteresis of the
material due to alternate motion in the sidewalls and in the tread blocks
◼ Air drag inside and outside the tire
◼ The scrubbing of the tire on the ground
◼ The friction in the driveline
◼ The dissipation of energy in the shock absorber
◼ The misalignment of the tires, the longitudinal and lateral slip
◼ The deformation of the road surface
61
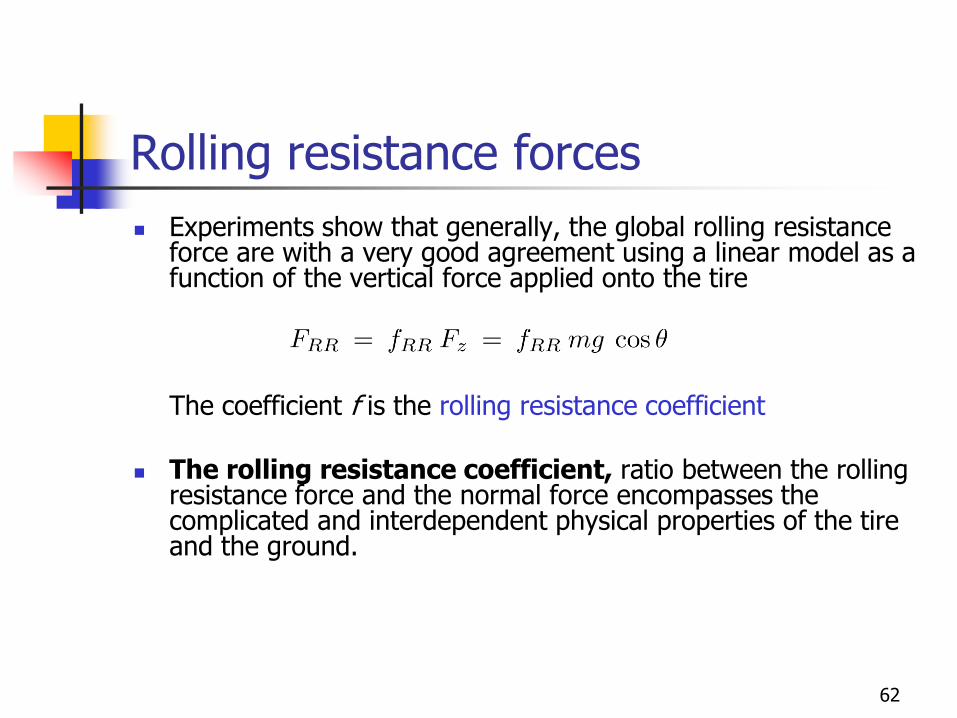
Rolling resistance forces
◼ Experiments show that generally, the global rolling resistance force are with a very good agreement using a linear model as a function of the vertical force applied onto the tire
The coefficient f is the rolling resistance coefficient
◼ The rolling resistance coefficient, ratio between the rolling resistance force and the normal force encompasses the complicated and interdependent physical properties of the tire and the ground.
62
Rolling resistance forces
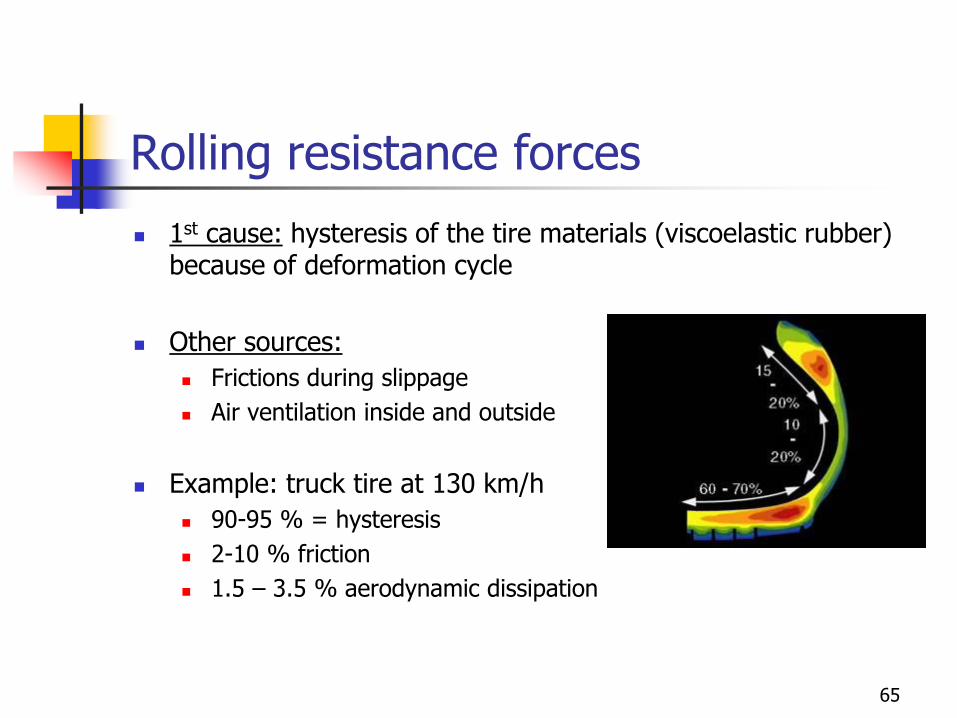
◼ 1st cause: hysteresis of the tire materials (viscoelastic rubber) because of deformation cycle
◼ Other sources:
◼ Frictions during slippage
◼ Air ventilation inside and outside
◼ Example: truck tire at 130 km/h
◼ 90-95 % = hysteresis
◼ 2-10 % friction
◼ 1.5 – 3.5 % aerodynamic dissipation
65

Rolling resistance forces
◼ The rolling resistance is influenced by the tire structure: the rolling resistance of bias tire is higher than radial tire
◼ The operating conditions mainly:
◼ The inflating pressure: the rolling resistance is reduced for a higher inflation pressure
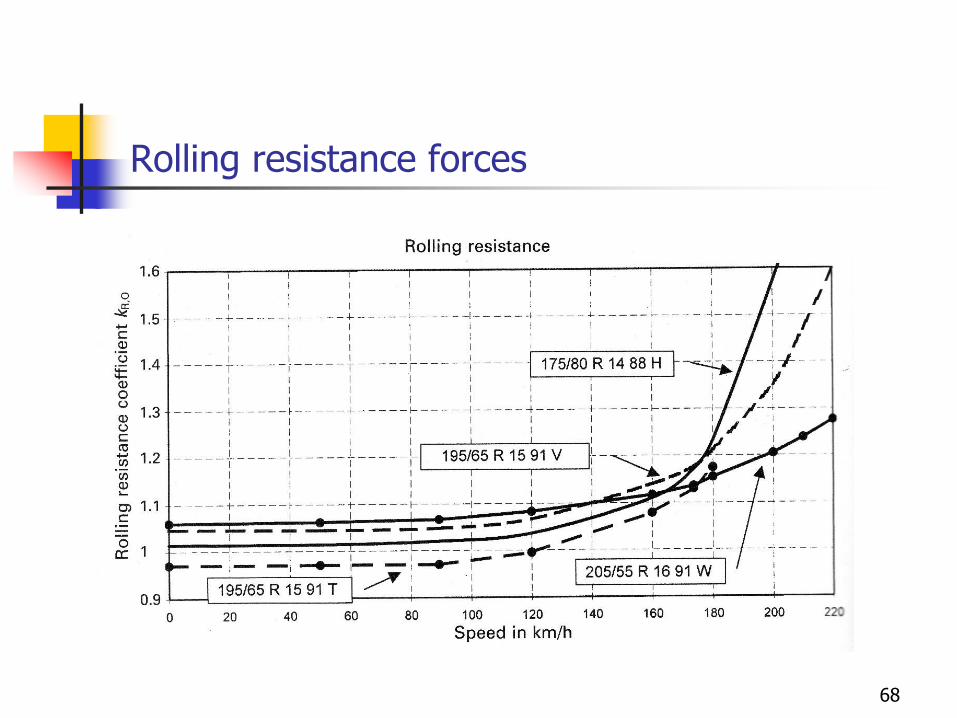
◼ The vehicle speed: one observes a slight increase with v at low speed. A dramatic increase after a critical speed because of the development of high-energy standing waves
◼ The longitudinal and lateral slip: the rolling resistance increases as the square of the side slip.
66

Rolling resistance forces
◼ The rolling resistance is much higher on soft and smooth ground because of the deformation work of the soil
◼ The rolling resistance is also higher on wet ground or in snow
67
Rolling resistance forces
68

Rolling resistance forces
69

Rolling resistance forces
70
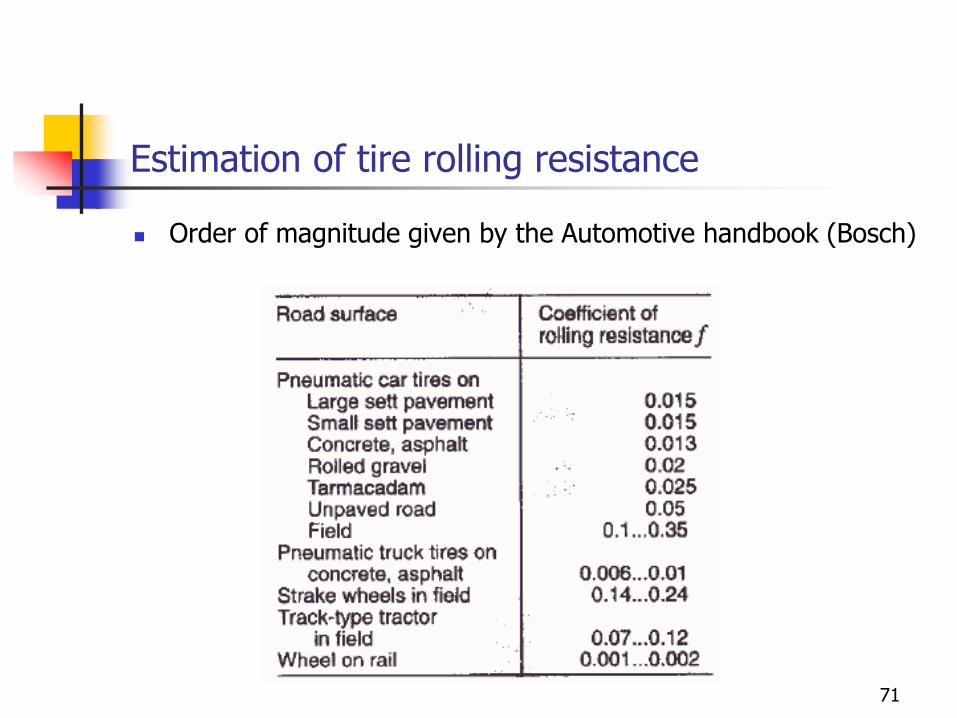
Estimation of tire rolling resistance
◼ Order of magnitude given by the Automotive handbook (Bosch)
71

Estimation of tire rolling resistance
◼ For instance Wong formula for radial tires:
◼ Influence of inflating pressure and normal load
◼ with V in m/s and p, the inflating pressure in bar
◼ Influence of inflating pressure and normal load
◼ with v in m/s and p, the inflating pressure in bar
72

Resistance force due to grading
◼ Expression of grading resistance
73
Expression of road load
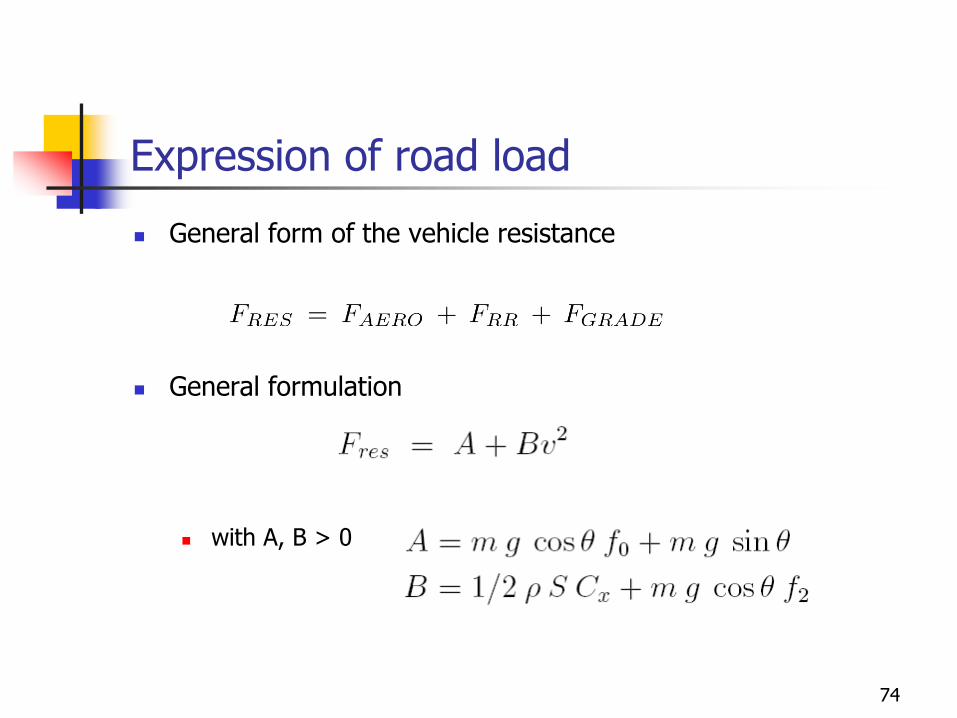
◼ General form of the vehicle resistance
◼ General formulation
◼ with A, B > 0
74

Evolution of road loads with vehicle speed
Wong, Fig 3.3
50 mph = 80 km/h
75