Performance enhancement of downstream vertical … enhancement of downstream vertical-axis wind...
18
Performance enhancement of downstream vertical-axis wind turbines Ian D. Brownstein, 1,a) Matthias Kinzel, 2 and John O. Dabiri 1,3 1 Mechanical Engineering, Stanford University, Stanford, California 94305, USA 2 Graduate Aerospace Laboratories, California Institute of Technology, Pasadena, California 91125, USA 3 Civil and Environmental Engineering, Stanford University, Stanford, California 94305, USA (Received 27 May 2016; accepted 15 September 2016; published online 4 October 2016) Increased power production is observed in downstream vertical-axis wind turbines (VAWTs) when positioned offset from the wake of upstream turbines. This effect is found to exist in both laboratory and field environments with pairs of co- and counter-rotating turbines, respectively. It is hypothesized that the observed produc- tion enhancement is due to flow acceleration adjacent to the upstream turbine due to bluff body blockage, which would increase the incident freestream velocity on appropriately positioned downstream turbines. A low-order model combining poten- tial flow and actuator disk theory captures this effect. Additional laboratory and field experiments further validate the predictive capabilities of the model. Finally, an evolutionary algorithm reveals patterns in optimized VAWT arrays with various numbers of turbines. A “truss-shaped” array is identified as a promising configura- tion to optimize energy extraction in VAWT wind farms by maximizing the perfor- mance enhancement of downstream turbines. Published by AIP Publishing. [http://dx.doi.org/10.1063/1.4964311] I. INTRODUCTION An industry and academic focus on large, utility-scale horizontal-axis wind turbines (HAWTs) has led to the development of HAWTs capable of efficiencies near the theoretical Betz limit of maximum wind energy extraction, 59.3%. 1 However, when HAWTs are arrayed in a wind farm, downstream turbines perform less efficiently than in isolation due to the incoming turbulent wake created by upstream turbines. 2 Studies have shown that a HAWT spacing on the order of 20 turbine rotor diameters, D, is needed to provide space for the flow to re-energize sufficiently for downstream turbines to achieve performance levels similar to those demonstrated in isolation. 2 Despite this, modern HAWT farms typically space turbines approximately 3–5 D in the cross-wind direction and 6–10 D in the streamwise direction. 3 A variety of solutions have recently been proposed to effectively manage the tradeoff between turbine efficiency and wind farm footprint. Instead of optimizing for individual turbine efficiency, optimization can focus on the total power production of turbine arrays. For example, an optimization study utilizing Large Eddy Simulation (LES) has suggested the optimal spacing of HAWTs to be 15 D on the basis of minimizing costs per square rotor diameter. 4 More recently, a row-offset arrangement was demonstrated to allow for a greater wake recovery due to the increased streamwise spacing within the array. 5 Moreover, by decreasing the power output of upstream turbines, the performance of downstream turbines and the power output of the array as a whole can be increased. 6–8 While these techniques can improve the energy produced by HAWT arrays, vertical-axis wind turbines (VAWTs) have been shown to facilitate additional strategies for performance a) Electronic mail: [email protected] 1941-7012/2016/8(5)/053306/18/$30.00 Published by AIP Publishing. 8, 053306-1 JOURNAL OF RENEWABLE AND SUSTAINABLE ENERGY 8, 053306 (2016) Reuse of AIP Publishing content is subject to the terms: https://publishing.aip.org/authors/rights-and-permissions. Downloaded to IP: 171.67.81.230 On: Tue, 04 Oct 2016 16:32:41
Transcript of Performance enhancement of downstream vertical … enhancement of downstream vertical-axis wind...

Performance enhancement of downstream vertical-axiswind turbines
Ian D. Brownstein,1,a) Matthias Kinzel,2 and John O. Dabiri1,3
1Mechanical Engineering, Stanford University, Stanford, California 94305, USA2Graduate Aerospace Laboratories, California Institute of Technology, Pasadena,California 91125, USA3Civil and Environmental Engineering, Stanford University, Stanford,California 94305, USA
(Received 27 May 2016; accepted 15 September 2016; published online 4 October 2016)
Increased power production is observed in downstream vertical-axis wind turbines
(VAWTs) when positioned offset from the wake of upstream turbines. This effect
is found to exist in both laboratory and field environments with pairs of co- and
counter-rotating turbines, respectively. It is hypothesized that the observed produc-
tion enhancement is due to flow acceleration adjacent to the upstream turbine due to
bluff body blockage, which would increase the incident freestream velocity on
appropriately positioned downstream turbines. A low-order model combining poten-
tial flow and actuator disk theory captures this effect. Additional laboratory and field
experiments further validate the predictive capabilities of the model. Finally, an
evolutionary algorithm reveals patterns in optimized VAWT arrays with various
numbers of turbines. A “truss-shaped” array is identified as a promising configura-
tion to optimize energy extraction in VAWT wind farms by maximizing the perfor-
mance enhancement of downstream turbines. Published by AIP Publishing.[http://dx.doi.org/10.1063/1.4964311]
I. INTRODUCTION
An industry and academic focus on large, utility-scale horizontal-axis wind turbines
(HAWTs) has led to the development of HAWTs capable of efficiencies near the theoretical
Betz limit of maximum wind energy extraction, 59.3%.1 However, when HAWTs are arrayed in
a wind farm, downstream turbines perform less efficiently than in isolation due to the incoming
turbulent wake created by upstream turbines.2 Studies have shown that a HAWT spacing on the
order of 20 turbine rotor diameters, D, is needed to provide space for the flow to re-energize
sufficiently for downstream turbines to achieve performance levels similar to those demonstrated
in isolation.2 Despite this, modern HAWT farms typically space turbines approximately 3–5 Din the cross-wind direction and 6–10 D in the streamwise direction.3
A variety of solutions have recently been proposed to effectively manage the tradeoff
between turbine efficiency and wind farm footprint. Instead of optimizing for individual turbine
efficiency, optimization can focus on the total power production of turbine arrays. For example,
an optimization study utilizing Large Eddy Simulation (LES) has suggested the optimal spacing
of HAWTs to be 15 D on the basis of minimizing costs per square rotor diameter.4 More
recently, a row-offset arrangement was demonstrated to allow for a greater wake recovery due
to the increased streamwise spacing within the array.5 Moreover, by decreasing the power
output of upstream turbines, the performance of downstream turbines and the power output of
the array as a whole can be increased.6–8
While these techniques can improve the energy produced by HAWT arrays, vertical-axis
wind turbines (VAWTs) have been shown to facilitate additional strategies for performance
a)Electronic mail: [email protected]
1941-7012/2016/8(5)/053306/18/$30.00 Published by AIP Publishing.8, 053306-1
JOURNAL OF RENEWABLE AND SUSTAINABLE ENERGY 8, 053306 (2016)
Reuse of AIP Publishing content is subject to the terms: https://publishing.aip.org/authors/rights-and-permissions. Downloaded to IP: 171.67.81.230 On: Tue, 04 Oct 2016
16:32:41

enhancement due to their performance in close proximity. It has been predicted that VAWTs
could produce over an order of magnitude more power per unit area of land than HAWTs due
in part to the close-spacing effects, despite individual turbine efficiencies that are 20%–30%
lower than HAWTs.9 In field tests, small VAWT arrays have achieved 8 times greater power
per unit area of land than HAWT arrays even prior to array optimization.10
A number of works have investigated the mechanisms underlying the observed higher
power output per unit area of land of VAWTs as compared to HAWTs. It has been shown in
field experiments that the energy deficit in the wake of VAWTs recovers in only 4–6 D,11 and
numerical simulations have shown that the spatial extent of this recovery decreases with the
increased rotational speed.12 This rapid recovery is potentially aided by both an induced down-
ward mean vertical flow behind each turbine, as observed in an analogous array of rotating
cylinders,13 and through the turbulent planform flux of energy into the array from above, an
effect seen in HAWT arrays,14 the wake of a single VAWT,15 and VAWT arrays.16
In this paper, we explore mean flow dynamics in VAWT arrays that complement the afore-
mentioned physics. Specifically, we observe and characterize the performance enhancement of
downstream turbines in close proximity to upstream turbines. This effect contributes to the achieve-
ment of higher power output per wind farm footprint and was demonstrated in the laboratory and
in the field using 15 W and 1.2 kW VAWT, respectively.
The Leaky-Rankine Body (LRB) model, a low-order potential flow model introduced by
Araya et al.,17 was evaluated for its potential to optimize VAWT arrays. Laboratory and field
experiments further validated the model by investigating its ability to accurately rank the per-
formance of arrays with the same number of turbines as well as ranking the performance of a
single array versus wind direction. Given the demonstrated predictive capability of the model,
an evolutionary algorithm (EA) was utilized that used the LRB model to compute its objective
function. This optimization process revealed patterns in the spatial configurations that produce
maximum array power output. Additionally, the implications of adding asymmetric elements to
the model are briefly discussed.
The remainder of this work is organized as follows: Section II describes laboratory and
field experiments as well as the computational models used, Section III describes the results of
the experiments and computations, and Section IV summarizes and discusses the contributions
of this work.
II. EXPERIMENTAL METHODS
A. Laboratory experiments
1. Facility and wind turbines
Laboratory studies were conducted in an open-circuit, subsonic wind tunnel. The flow in
this tunnel was provided by a 10� 10 grid of fans (Delta PFC1212DE-F00) located upstream
of a 38.1 mm thick honeycomb layer. Directly downstream of this layer is the test section,
which has a cross section measuring 1.30 m in width by 1.22 m in height, and is 1.88 m in
length. Three 15 W model scale VAWTs (Aleko WGV15) were studied in this facility. Each
turbine comprised a 5-bladed, lift-based rotor that rotated a 3-phase AC permanent magnet gen-
erator. The rotors were approximately 310 mm in diameter and span. The total height of each
turbine including a tower mounted below the rotor was 430 mm. The turbines had a nominal
cut-in speed of 2 m/s and a rated power of 10 W at 10 m/s. The turbines were oriented to rotate
clockwise when viewed from above.
2. Power measurements
To measure the power generated by each of the turbines, each of the three phases of the
generator was attached to individual channels on an oscilloscope (Tektronix TDS 2014B). To
increase accuracy, the generated power was obtained from the oscilloscope in two ways. First,
the absolute power of the turbines was measured by taking an average of the peak-to-peak volt-
age on all three phases of the turbines. Using a modified power law and the resistance of the
053306-2 Brownstein, Kinzel, and Dabiri J. Renewable Sustainable Energy 8, 053306 (2016)
Reuse of AIP Publishing content is subject to the terms: https://publishing.aip.org/authors/rights-and-permissions. Downloaded to IP: 171.67.81.230 On: Tue, 04 Oct 2016
16:32:41

oscilloscope, 50 X, the absolute turbine power was calculated. A second measure of power was
collected by monitoring the generator signal frequency. Since the peak-to-peak voltage is pro-
portional to the generator rotational rate in a permanent magnet generator, the frequency of the
AC signal squared is also proportional to the turbine power.18 Through initial experimentation,
it was found that these measurement techniques yielded consistent results with an r2 value of
0.99. The frequency-based measurement was selected as the preferred measurement technique
when only one measure of power was recorded. Power measurements were recorded for all
turbines at three instances per array configuration tested, with a minimum temporal spacing of
1 min between measurements.
3. Experimental procedure
In a first set of experiments, one turbine was positioned 1 D downstream of the tunnel inlet
along the center-line of the test section, while a second turbine was positioned 4 D downstream
of the inlet at 24 distinct positions between �1.5 D and 1.5 D from the tunnel centerline in
0.125 D increments. This array geometry is illustrated in Figure 1(a).
In a second set of experiments, arrays of three turbines were studied in all array combina-
tions of six possible turbine locations, Figure 1(b). These locations were 1 D and 4 D down-
stream of the tunnel inlet and spaced at �1.5 D, 0 D, and 1.5 D from the tunnel centerline.
In both experiments conducted in this facility, the nominal freestream flow speed was
Uo ¼ 8:0 m/s, corresponding to a Reynolds number based on the turbine diameter of ReD
� 1:6 � 105. The blockage ratio in this facility, based on the frontal projected area of a single
turbine rotor and tower, was approximately 6%. It is important to note that in various array
configurations studied, one or more turbines were placed near the tunnel walls, leading to possi-
ble impingement of the expanding VAWT wake. However, since only the relative output of the
turbines was analyzed and all of the turbine arrays being compared were affected by similar
blockage conditions, wall effects were not found to significantly impact the conclusions of this
study.
B. Field experiments
1. Field site and wind turbines
Meteorological and power measurements were collected from 2010 to 2013 at the Caltech
Field Laboratory for Optimized Wind Energy (FLOWE), located in the Antelope valley in
northern Los Angeles County, California, USA. The site terrain is a flat desert for at least
1.5 km in each direction. Several array configurations of two to 24 turbines were studied using
1.2 kW VAWT (Windspire Energy Inc.). Each of these three-bladed, lift-based VAWTs consists
of a rotor measuring 1.2 m in diameter. Two versions of this turbine were used. For the
FIG. 1. (a) Illustration of downstream turbine traverse experiment studied in the wind tunnel. (b) Illustration of the twenty
3-turbine configurations studied in the wind tunnel. In both illustrations, the flow is from the left and the boundaries of the
plots represent the extent of the tunnel, with X/D¼ 0 being where the flow enters the tunnel and X/D¼ 6.1 being the outlet
of the open circuit tunnel. The rotor diameter D is 310 mm.
053306-3 Brownstein, Kinzel, and Dabiri J. Renewable Sustainable Energy 8, 053306 (2016)
Reuse of AIP Publishing content is subject to the terms: https://publishing.aip.org/authors/rights-and-permissions. Downloaded to IP: 171.67.81.230 On: Tue, 04 Oct 2016
16:32:41

2-turbine studies, the rotor span was 4.1 m and was mounted in a 6 m tower; while in the large-
array studies, the rotor span was 6.1 m and was mounted in a 3 m tower. The turbines have
nominal cut-in and cut-out speeds of 4 m/s and 12 m/s, respectively, corresponding to
ReD � 3 � 105 � 1 � 106. At the cut-out speed, the rotors achieve their maximum rotation rate of
420 rpm which corresponds to a tip speed ratio of 2.2. The turbines are typically in operation
when the atmospheric boundary layer is not neutrally stable, so buoyancy effects contribute to
the turbulence levels of the flow.16
2. Meteorological and power measurements
Meteorological measurements were collected using a cup anemometer (Thies First Class)
and wind vane (Met One Model 024 A) mounted on top of 10 m tower adjacent to the VAWT
arrays. The accuracies of the anemometer and wind vane measurements were 63% and 65%,
respectively. Power output was monitored for each turbine using a WattNode Modbus (Model
WNC-3Y-208-MB) with nominal accuracy of 60:5%. The reference wind speed, Uo, wind
direction, h, and electrical power produced by the turbine, P, were recorded in synchronized 1-s
or 10-min averages using a datalogger (Campbell Scientific CR1000). After collection, meteoro-
logical and power measurements were binned by wind speed and direction. The specific averag-
ing scheme used in each dataset will be discussed alongside the results in Section III. The
power coefficients, Cp ¼ P= 12qAU3
o�
, were calculated for each turbine from these measure-
ments using the values of q ¼ 1:2 kg/m3 for the density of air and A¼ 4.9 m2 or 7.3 m2 for the
frontal area of the turbines, depending on the turbine geometry being studied.
3. Experimental procedure
Aerodynamic interactions between a pair of counter-rotating VAWTs were studied using
turbines on portable foundations at a spacing of 1.65 D as shown in Figure 2(a).
Meteorological and power measurements were recorded at 1 Hz. Power measurements were
binned in 10� bins and required over 15 min of data, i.e., 900 samples, in each bin to ensure
convergence of the reported means. As shown in Figure 3, the wind at FLOWE did not devi-
ate significantly from its dominant southwest direction, h ¼ 225�, during the 24 days of this
study. To increase the effective wind distribution incident on the array, the turbine pair was
studied twice. In these two experiments, the turbine pair had a different orientation with
respect to the cardinal directions, i.e., the turbines were oriented along a north-south axis for
12 days and then oriented along the east-west axis for a second 12 days. In post-processing,
the results were combined by rotating the reference frames of the two experiments to a com-
mon orientation with respect to the cardinal directions, i.e., a north-south axis. This allowed
for the study of a larger range of wind directions than would be possible with only one phys-
ical turbine arrangement.
In a separate set of experiments, large arrays of up to 24 VAWTs were studied using a
series of in-ground foundations laid out such that turbine pairs were located on a grid with 8 Dspacing between pair centers. The turbine pairs were separated by 1.65 D and were oriented
toward the dominant southwest wind direction, h ¼ 225�. One such 18-turbine array from this
series of experiments is shown in Figure 2(b) and a schematic of all of the possible turbine
positions is shown in Figure 2(c). 10-min averages of meteorological and power measurements
were recorded and are available at flowe.caltech.edu.
C. Computational studies
1. Leaky-Rankine body (LRB) model
The LRB model, described in detail by Araya et al.17 and summarized here, was used to
model VAWT array aerodynamics as a superposition of a uniform freestream and potential
flow sources and sinks. Each source-sink pair models an individual turbine and is thus referred
to as a LRB turbine. Mathematically, this flow field is described by the complex velocity, W(z),
053306-4 Brownstein, Kinzel, and Dabiri J. Renewable Sustainable Energy 8, 053306 (2016)
Reuse of AIP Publishing content is subject to the terms: https://publishing.aip.org/authors/rights-and-permissions. Downloaded to IP: 171.67.81.230 On: Tue, 04 Oct 2016
16:32:41

FIG. 2. (a) 2-Turbine array of VAWTs on portable foundations at FLOWE. (b) 18-Turbine array of VAWTs on in-ground
foundations at FLOWE. (c) Schematic of all possible turbine locations at the FLOWE wind farm. VAWTs are drawn to
scale with black circles. The axis dimensions are given in rotor diameters where D¼ 1.2 m.
FIG. 3. Wind rose depicting wind speed and direction distributions at FLOWE during the 24 days of the 2-turbine array
study in the summer of 2010.
053306-5 Brownstein, Kinzel, and Dabiri J. Renewable Sustainable Energy 8, 053306 (2016)
Reuse of AIP Publishing content is subject to the terms: https://publishing.aip.org/authors/rights-and-permissions. Downloaded to IP: 171.67.81.230 On: Tue, 04 Oct 2016
16:32:41

W zð Þ ¼ U1e�ia|fflfflfflffl{zfflfflfflffl}Freestream
þXN
i¼1
mso
2p z� zið Þ� msi
2p zþ zi � zsð Þ
� �|fflfflfflfflfflfflfflfflfflfflfflfflfflfflfflfflfflfflfflfflfflfflfflfflfflfflfflfflffl{zfflfflfflfflfflfflfflfflfflfflfflfflfflfflfflfflfflfflfflfflfflfflfflfflfflfflfflfflffl}
Array of N LRB Turbines
; (1)
where U1 is the magnitude of the freestream velocity, a is the direction of the freestream, N is
the number of turbines in the array, mso and msi are the source and sink strengths of the tur-
bines, respectively, zi is the nominal location of ith turbine, and zs is the downstream location
of each sink with respect to the corresponding source. The velocity vector at a given point in
the flow can be determined from the decomposition of W(z) into its real and imaginary parts,
i.e., UðzÞ ¼ <ðWÞx � =ðWÞy when x and y are Cartesian unit vectors. The description of indi-
vidual LRB turbines is similar to that of a Rankine body, but a LRB turbine is differentiated by
a sink strength that is greater than the source strength (mso<msi). This results in a non-zero
force required to hold the LRB turbine in place, which is analogous to the drag on a turbine.
Three parameters need to be determined to complete the description of the flow around each
LRB turbine: mso, msi, and ss, the source-sink spacing. Two of these parameters can be deter-
mined by applying actuator disk theory around a single turbine. This is done by specifying the
freestream flow speed, U1, the flow speed upstream of the turbine, U2, and the flow speed far
downstream, U4. The actuator disk theory relates U2 ¼ U1ð1� aÞ and U4 ¼ U1ð1� 2aÞ where
the induction factor a � ðU1 � U2Þ=U1 and can be determined from the turbine power coeffi-
cient Cp ¼ 4að1� aÞ2. Considering a single LRB turbine and defining U2 and U4 to be at distan-
ces ru and rw on the centerline from the LRB source, the linear system of equations results in
�aU1 ¼ �mso
2pruþ msi
2p ru þ ssð Þ�2aU1 ¼
mso
2prw� msi
2p rw � ssð Þ: (2)
As a result of these relations, the model is left with one free parameter. Using the method
of Araya et al., the free parameter was chosen to be the source-sink spacing, ss. This is deter-
mined by matching measured wind speeds along the centerline of a single turbine with model
results. Since the only two inputs needed to calibrate the LRB turbine are the power coefficient
and velocity measurements along the turbine centerline, turbine geometry is not explicitly
incorporated into the model but is instead implicitly considered in actuator disk theory via the
power coefficient, which determines the turbine induction factor.
The primary output of the LRB model is the performance metric of each turbine, PLRB, which
is used to determine relative performance of turbines or arrays. The metric is determined by calcu-
lating the cube of the flow magnitude incident to each turbine at the distance ru upstream of the
turbine as calculated by the LRB model, i.e., PLRB � U32. It is important to note that the model
breaks down when the turbine spacing is less than ru þ ss since the downstream turbine will be
sampling in singularities (i.e., the source and/or sink) of the upstream LRB turbines. Therefore, the
LRB model is not able to study turbine interactions at spacing smaller than this distance.
In a parameter sweep conducted by Araya et al., it was shown that the LRB model results
are relatively insensitive to the input parameters, ru, rw, and the free parameter ss. Therefore,
for the majority of the modeling work in the current study, the same parameters as selected by
Araya et al. were used for both the model and commercial turbines examined, i.e.,
ru=D ¼ 3; rw=D ¼ 10, and ss=D ¼ 1:44. The one exception to this was in the laboratory experi-
ments, wherein a smaller value of ru=D ¼ 1:125 was used to avoid sampling the singularities of
the adjacent turbines. This value was chosen to preserve the ratio between the turbine spacing
and the upstream flow measurement distance, ru.
2. Evolutionary algorithm (EA)
An EA was used to find VAWT configurations that maximize power output for a given
number of turbines, N, in a finite domain. Between two and 14 turbines were optimized in a 36
053306-6 Brownstein, Kinzel, and Dabiri J. Renewable Sustainable Energy 8, 053306 (2016)
Reuse of AIP Publishing content is subject to the terms: https://publishing.aip.org/authors/rights-and-permissions. Downloaded to IP: 171.67.81.230 On: Tue, 04 Oct 2016
16:32:41
D� 36 D rectangular area. Each turbine array configuration was defined as a vector of length
2 N representing x� and y� coordinates of the N turbines. The objective of the EA was to max-
imize the mean LRB performance metric for the array, i.e.,PN
i¼1 PLRBi=N. As is typical in EAs,
this value is referred to as the fitness of the array.
The EA was written based on the procedure described by Duda et al.19 The algorithm was
initialized with 200 N-turbine arrays where the x� and y� coordinates of each turbine were
randomly selected. Each array in this population was required to have a minimum 6 D spacing
between turbines, i.e., LRB turbines. This spacing was enforced both to ensure turbines would
not physically overlap and to avoid sampling incident velocities near the singularities of
upstream LRB turbines when calculating the performance metric. If an array failed to satisfy
this restriction, a new array was generated until a valid array was produced.
Mutation of array vectors was the only mechanism used to evolve the population of
VAWT configurations toward a local maximum fitness solution. The array mutated in each iter-
ation was chosen through a two-step process. First, the highest fitness member of the population
was given a 25% chance of being selected. If the highest fitness member was not selected in
this step, a virtual roulette wheel was used to select which array in the population was to be
mutated. The percentage of the wheel that represented each array was based on a Boltzmann
distribution.
The number of times that the selected array was mutated was based on a randomly gener-
ated integer between 1 and 2 N. This allowed for the possibility for the array to be completely
reconfigured by mutation. In each mutation, a randomly selected x� or y� coordinate in the
array was assigned a new randomly generated value within the bounds of the parameter space.
This process was run over 105 iterations. After each mutation, the performance of the new
array was calculated and compared to the worst array in the population. If the new array had a
higher performance, it replaced the worst array in the population, driving the fitness of the popu-
lation upward. The local maximum LRB performance achieved for each N-turbine optimization
was demonstrated to be robust by performing the computation with multiple initial populations
and consistently achieving a similar result.
III. RESULTS
A. Downstream turbine enhancement
Figure 4(a) shows the ratio of the power produced by the downstream traversing turbine,
PDT, to the upstream stationary turbine, PUT, in the 2-turbine wind tunnel experiment. When
the downstream turbine is within cross-flow positions of �1.25 D and .5 D, there is a region of
decreased performance. This decrease is attributable to the downstream turbine position in the
wake of the upstream turbine. The asymmetry in the deficit region is offset toward negative
cross-flow position values, which correspond to the side of the wake associated with the
upstream turbine blades retreating upstream. Previous work has shown that this side of VAWT
wakes is associated with a larger velocity deficit.15,20 Hence, the asymmetry in the downstream
turbine performance is caused by the asymmetry in the wake behind the upstream turbine.
Intriguingly, outside of this asymmetric region of decreased downstream turbine perfor-
mance, the downstream turbine performs better than the upstream turbine, i.e., PDT
PUT> 1. This
production enhancement also appears asymmetrically, with a peak downstream turbine perfor-
mance enhancement of 10% at positive cross-flow position values and a monotonically increas-
ing downstream turbine performance enhancement up to 20% at negative cross flow position
values.
Downstream turbine performance enhancement was also observed in the field study of two
counter-rotating VAWTs. Figure 4(b) shows the ratio of the power produced by the downstream
turbine over the upstream turbine, PDT=PUT , over a range of wind directions. The number of
samples in each of the 10� bins in Figure 4(b) is shown in Figure 4(c).
It can be seen in Figure 4(b) that the downstream turbine, whether the northern or southern
turbine, performs better than the upstream turbine over a range of wind directions. Similar to
the laboratory study, the performance enhancement appears asymmetrically with a peak
053306-7 Brownstein, Kinzel, and Dabiri J. Renewable Sustainable Energy 8, 053306 (2016)
Reuse of AIP Publishing content is subject to the terms: https://publishing.aip.org/authors/rights-and-permissions. Downloaded to IP: 171.67.81.230 On: Tue, 04 Oct 2016
16:32:41

downstream turbine performance enhancement of 10.9% when the wind approaches from the
southwest, h ¼ 225�, and 5.4% when the wind approaches from near the southeast, at h ¼ 165�.The only regions which do not observe downstream performance enhancement are (i) in the
range of 180� < h < 200� and (ii) when h ¼ 270�, i.e., when the wind came from the west. In
the former exception, the downstream turbine observes a decreased performance. This is likely
due to the influence of the upstream turbine wake, similar to what was observed in the travers-
ing turbine experiment conducted in the wind tunnel, Figure 4(a). In the latter exception, there
is no well-defined downstream turbine and the turbines are observed to perform equally.
While the power measurements presented here cannot directly explain the mechanism
responsible for the downstream turbine performance enhancement, we hypothesize that this
enhancement is due to flow acceleration around the upstream turbine leading to an increase in
the effective freestream incident to the downstream turbine. The presence of such accelerations
is hinted by the LRB calculations of Araya et al.17 and is a common feature of bluff-body
flows. These accelerations have been shown to extend significantly downstream in the flow
around cylinders of similar aspect ratio to the VAWTs in this study.21 Additionally, accelera-
tions near the rotor are also observed in numerous experimental and numerical studies of a
single VAWT20,22,23 and in arrays of VAWT.12 It is important to note in the single turbine
cases, the magnitude and extent of these accelerations do not necessarily reflect the regions of
acceleration expected around full-scale VAWTs due to blockage effects in experimental and
modeled conditions. The issue of blockage is demonstrated by Dossena et al., in which a
VAWT was studied in a tunnel with and without the presence of the side walls. In this study,
the magnitude and extent of the increased flow region around the sides of the turbine decreases
when the side walls are removed.22
FIG. 4. (a) Laboratory measurements and LRB predictions of the ratio of the power produced by the downstream turbine
over the upstream turbine, PDT=PUT , versus downstream turbine cross-flow position. The y-axis dimensions are given in
rotor diameters where D¼ 310 mm. (b) Performance of downstream turbine divided by the performance of the upstream
turbine versus incoming flow wind direction from the 2-turbine field experiment. (c) Wind rose depicting the number of
samples in each wind direction bin from the 2-turbine field experiment. Dashed line represents the minimum threshold
specified for data to be reported in (b), i.e., 900 samples. Wind speed legend is the same as in Figure 3. In both (b) and (c),
North is defined to be at h ¼ 0� and h increases in the clockwise direction.
053306-8 Brownstein, Kinzel, and Dabiri J. Renewable Sustainable Energy 8, 053306 (2016)
Reuse of AIP Publishing content is subject to the terms: https://publishing.aip.org/authors/rights-and-permissions. Downloaded to IP: 171.67.81.230 On: Tue, 04 Oct 2016
16:32:41

Even if the magnitude and extent of the region of accelerated flow around VAWT are limited,
their existence indicates significant opportunity for increased power production of downstream tur-
bines. This is because the power that a wind turbine produces is proportional to the cube of the
incoming flow speed. Hence, even modest increases in the flow speed due to accelerations around
the upstream turbine could have significant effects on the power produced by the downstream tur-
bine. For example, in the current work, the downstream turbines in both laboratory and field
experiments demonstrated power production up to 20% higher than the upstream turbine. This
would require only a modest increase in incoming flow speed of approximately 6%.
Interestingly, in both the laboratory and field studies of VAWT pairs there is an asymmetry
in the magnitude of the enhancement achieved depending on the side of the upstream turbine
on which the downstream turbine is positioned. Both sets of results indicate that the accelera-
tions adjacent to the upstream turbine are larger on the side of the upstream turbine with blades
moving upstream.
Of note, since downstream turbine performance enhancement is attributed to small changes
in the incident flow speed, the effect of the walls in the wind tunnel experiment cannot be
neglected altogether. The traversing turbine was in close proximity to the tunnel walls at the
maximum excursions from the centerline. While enhancement is achieved on both sides of the
traverse, the unbounded increase observed on the negative side is possibly due in part to wall
effects, e.g., flow confinement between the rotor and the wall and/or the influence of side wall
boundary layer. Comparison with the field measurements suggests that although the downstream
enhancement may have been quantitatively overestimated in the laboratory experiments, the
underlying physical phenomenon is not an artifact. The wall effect might also be exploited
when VAWTs are installed in urban environments near existing structures.
B. LRB validation
The LRB model was demonstrated by Araya et al. to effectively rank the relative perfor-
mance of individual turbines within a large VAWT array.17 Indeed, the downstream turbine
performance enhancement is well captured by the LRB model predictions, as demonstrated by
comparison with measured results of the wind tunnel turbine traverse experiment, as shown in
Figure 4(a). Specifically, the LRB model captures both the extent of the downstream turbine
power enhancement on both sides of the traverse as well as the decrease in performance
between the enhanced regions. Notably, the standard LRB model has no asymmetric elements,
so the model predicts symmetric performance on both sides of the traverse. A modification to
the LRB model that introduces an asymmetry will be discussed briefly in Section III D. Despite
this limitation in the standard LRB model, the ability of the model to capture downstream tur-
bine performance enhancement makes it potentially useful for discovering optimal arrays that
could exploit this effect. To that end, Section III B 1 will further validate the LRB model using
data from the laboratory and the field before discussing the problem of VAWT array
optimization.
1. Ranking arrays
The ability of the LRB model to rank arrays with the same number of turbines was investi-
gated using the 3-turbine experiment in the wind tunnel. A comparison between the experimen-
tal measurements and LRB predictions, shown in Figure 5(a), demonstrates a strong correlation
(r2¼ 0.94) between the predicted array power output of the LRB model and the measured array
power output in the tunnel. Additionally, Figure 5(b) shows that the model correctly ranked the
performance of 16 out of the 20 tested arrays and was able to correctly rank the highest-
performing array. For reference, configuration numbers are defined in Figure 1(b). Incidentally,
it was found that by slightly reducing the upstream flow measurement distance in the LRB
model, it was possible to correctly predict the performance of 17 out of the 20 tested arrays by
decreasing the performance of configuration 6.
Several factors may have contributed to the incorrect ordering of configurations 5, 6, 13,
and 14: wall effects, overestimation of the width of the upstream VAWT wakes as discussed by
053306-9 Brownstein, Kinzel, and Dabiri J. Renewable Sustainable Energy 8, 053306 (2016)
Reuse of AIP Publishing content is subject to the terms: https://publishing.aip.org/authors/rights-and-permissions. Downloaded to IP: 171.67.81.230 On: Tue, 04 Oct 2016
16:32:41

Araya et al.,17 and the lack of asymmetry in the LRB model. Specifically, the misordering of
configurations 5 and 13 by the LRB model is likely due to the lack of asymmetry in the model.
In these configurations, one of the downstream turbines is located on the side of the wake that
experienced less velocity deficit due to asymmetry observed in the wake of an actual VAWT.
Because of this, it could be anticipated and is observed in the experimental measurements that
configurations 5 and 13 would perform better than their symmetric equivalents, configurations 2
and 7, where the downstream turbine is located on the side of the wake that experiences a
greater velocity deficit. Instead, due to its symmetric nature, the LRB model predicted configu-
rations 5 and 13 to perform equally to configurations 2 and 7.
2. Ranking array performance by wind direction
The ability of the LRB model to rank the performance of a given array versus wind direc-
tion was investigated using field data from arrays of 4 to 24 turbines. Five base configurations
were examined in the field, but in some cases, sub-configurations were studied due to inactive
turbines. Inactive turbines were assumed to have negligible effect on the power output of other
turbines in the array.24 The configurations used in this comparison are shown in Figures
6(a)–6(f) and were chosen because they contained large wind direction ranges to provide mean-
ingful comparisons with the LRB predictions, long operational periods to allow for statistical
convergence, and/ or nontrivial performance dependence on the wind direction to demonstrate
that the LRB model can capture complex dynamics.
Figures 6(a)–6(f) show the normalized power coefficients, Cp;array, of the arrays binned into
1� intervals and normalized LRB performance metrics,PN
i¼1 PLRBi=N, versus wind direction.
The Cp;array was defined as the average power coefficient of the individual turbines in the array,
Cp, normalized by the nominal power coefficient of the turbines used based on the isolated
turbine performance, Cp;nominal ¼ :12 (i.e., based on the performance of an isolated turbine and
reference wind speed measurements). Mathematically,
Cp;array ¼1
N
XN
i¼1
Cp;i
Cp;nominal: (3)
Since the LRB performance metric is a relative measure of performance, the array perfor-
mance values predicted by the LRB model were normalized uniformly to best compare with
the normalized array Cp values from field measurements.
In Figures 6(a) and 6(d)–6(f), the array Cp values are based on 1093 h, 679 h, 451 h, and
108 h of measurements, respectively, and were composed of an average of at least five 10-min
averaged measurements per data point. In Figures 6(b) and 6(c), the array Cp values are based
on 14 h and 55 h of measurements, respectively, so all of the 10-min averaged measurements
were reported individually due to the relatively limited data available for these latter
FIG. 5. (a) Experimental array power output versus LRB prediction of array power output. Both datasets are normalized by
their highest performing configuration. (b) LRB predicted performance and experimentally measured performance of the
20 arrays versus configuration number. The configuration numbers were sorted such that the measured performances are
increasing from left to right.
053306-10 Brownstein, Kinzel, and Dabiri J. Renewable Sustainable Energy 8, 053306 (2016)
Reuse of AIP Publishing content is subject to the terms: https://publishing.aip.org/authors/rights-and-permissions. Downloaded to IP: 171.67.81.230 On: Tue, 04 Oct 2016
16:32:41
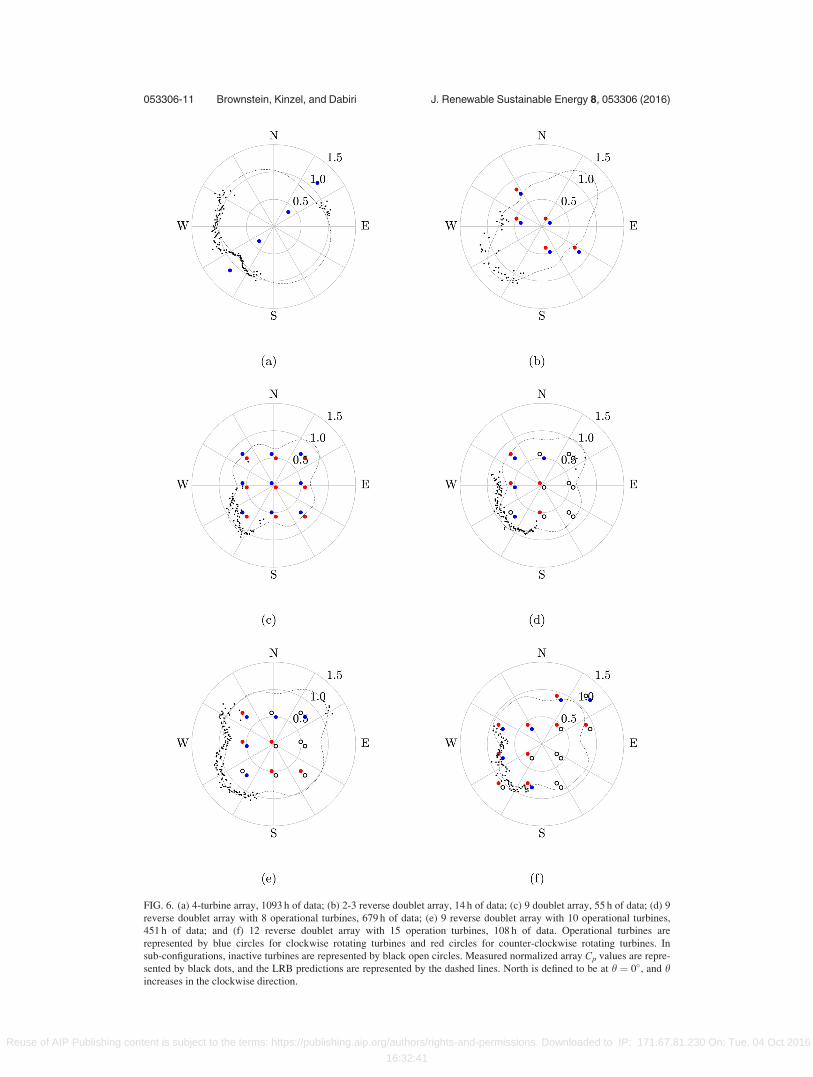
FIG. 6. (a) 4-turbine array, 1093 h of data; (b) 2-3 reverse doublet array, 14 h of data; (c) 9 doublet array, 55 h of data; (d) 9
reverse doublet array with 8 operational turbines, 679 h of data; (e) 9 reverse doublet array with 10 operational turbines,
451 h of data; and (f) 12 reverse doublet array with 15 operation turbines, 108 h of data. Operational turbines are
represented by blue circles for clockwise rotating turbines and red circles for counter-clockwise rotating turbines. In
sub-configurations, inactive turbines are represented by black open circles. Measured normalized array Cp values are repre-
sented by black dots, and the LRB predictions are represented by the dashed lines. North is defined to be at h ¼ 0�, and hincreases in the clockwise direction.
053306-11 Brownstein, Kinzel, and Dabiri J. Renewable Sustainable Energy 8, 053306 (2016)
Reuse of AIP Publishing content is subject to the terms: https://publishing.aip.org/authors/rights-and-permissions. Downloaded to IP: 171.67.81.230 On: Tue, 04 Oct 2016
16:32:41

configurations. Figures 7(a)–7(f) show the distribution of samples with wind direction in
Figures 6(a)–6(f), respectively.
In all the six array configurations studied, the LRB model effectively captured the varia-
tions in power coefficient measured in the field. In Figures 6(b) and 6(c), the LRB model
FIG. 7. Wind rose depicting the number of samples in each 1� wind direction bin for the (a) 4-turbine array, (b) 2-3 reverse
doublet array, (c) 9 doublet array, (d) 9 reverse doublet array with 8 operational turbines, (e) 9 reverse doublet array with
10 operational turbines, (f) and 12 reverse doublet array with 15 operation turbines. Wind speed legend is the same as in
Figure 3. North is defined to be at h ¼ 0� and h increases in the clockwise direction.
053306-12 Brownstein, Kinzel, and Dabiri J. Renewable Sustainable Energy 8, 053306 (2016)
Reuse of AIP Publishing content is subject to the terms: https://publishing.aip.org/authors/rights-and-permissions. Downloaded to IP: 171.67.81.230 On: Tue, 04 Oct 2016
16:32:41

captured large variations in performance versus wind direction. Additionally, in sub-
configurations chosen for their complexity due to the large number of inactive turbines, i.e., in
Figures 6(d)–6(f), the LRB model captured much subtler variations.
Two notable deviations between the measured array Cp and the LRB predictions were
observed. First, although the LRB model was able to capture the decrease in array performance
when the four turbines are aligned in Figure 6(a), the field data demonstrated a much narrower
region over which this decreased performance persists. This is consistent with previous observa-
tions that the LRB model overestimates the size of turbine wakes17 and is due to the unidirec-
tional nature of the sinks in the LRB model. Additionally, in the case of Figures 6(c), a strong
asymmetry was observed in the range of h ¼ 225�615�, which was not captured by the LRB
predictions. This is not surprising since, as previously discussed, this iteration of the LRB
model is not capable of capturing asymmetric flow features.
C. Evolutionary algorithm (EA)
A set of representative results of the EA for various numbers of turbines are shown in
Figures 8(a)–8(d). For smaller numbers of turbines, the algorithm consistently approached solu-
tions comprising a string of V-shaped arrays. The solution with the highest predicted perfor-
mance typically obtained the same geometry for its base V-shapes: an isosceles triangle of one
upstream turbine and two downstream turbines aligned with the flow such that the upstream
FIG. 8. Optimal array configurations from the EA using (a) 3-turbine, (b) 9-turbine, (c) 11-turbine, and (d) 12-turbine array.
The plot boundaries represent the extent of the domain in which the turbines were confined. The flow approaches the
domain from the left.
053306-13 Brownstein, Kinzel, and Dabiri J. Renewable Sustainable Energy 8, 053306 (2016)
Reuse of AIP Publishing content is subject to the terms: https://publishing.aip.org/authors/rights-and-permissions. Downloaded to IP: 171.67.81.230 On: Tue, 04 Oct 2016
16:32:41

turbine is at the vertex, the legs have lengths, R, of approximately 6 D, and the vertex half-
angle, b, of approximately 40�.To investigate why this base V-shape consistently appeared in the EA results, a 2-turbine
test array, i.e., half of the repeated isosceles triangle, with varying R and b was investigated in
the LRB model, as illustrated in Figure 9(a). The LRB prediction of the ratio of the power pro-
duced by the downstream turbine over the upstream turbine, PDT=PUT , is shown in Figure 9(b).
As previously noted, to prevent LRB elements from sampling velocities in the source or sink of
other LRB elements a 6 D minimum spacing between LRB elements is enforced in the EA.
The model predicts a decrease in downstream turbine enhancement with an increase in the dis-
tance R, so the imposed minimum 6 D spacing obtains the highest performance values. This
trend is consistent with physical intuition, as more closely spaced arrays would better utilize
downstream turbine power enhancement due to the fact that the flow accelerations around the
upstream turbine would be stronger closer to that turbine.
The peak performance enhancement for the downstream turbine in the 2-turbine test array
was achieved when R ¼ 6D and b ¼ 40�. This is consistent with the observed EA convergence
toward R � 6 D and b � 40�. These parameters enable the array to take the fullest advantage
of the downstream turbine performance enhancement.
From this test case, it becomes apparent that the EA is primarily leveraging the performance
enhancement of downstream turbines to find optimally performing arrays. By stacking these
base V-shapes together, this effect is replicated across the array. These stacks of V-shapes, or
“truss arrays,” are best exemplified by the best-performing 9-turbine array shown in Figure 8(b).
Notably, these “optimal” array solutions typically maintain only two rows of turbines until the
space constraints force the array to take on additional rows. This can be seen in the arrays with
larger numbers of turbines, e.g., Figures 8(c) and 8(d).
FIG. 9. (a) Illustration of the 2-turbine array investigated in the LRB. The flow approaches the domain from the left. LRB
predictions of the ratio of the power produced by the downstream turbine over the upstream turbine, PDT=PUT , versus tur-
bine spacing, R, and half-angle, b, for (b) the symmetric LRB model and (c) the asymmetric LRB model.
053306-14 Brownstein, Kinzel, and Dabiri J. Renewable Sustainable Energy 8, 053306 (2016)
Reuse of AIP Publishing content is subject to the terms: https://publishing.aip.org/authors/rights-and-permissions. Downloaded to IP: 171.67.81.230 On: Tue, 04 Oct 2016
16:32:41

It is apparent in Figures 8(a)–8(d) that as the number of turbines increases, the EA results
do not converge as rapidly to the “ideal” truss array configuration, defined as a two-row array
composed of stacked isosceles triangles with leg lengths of R ¼ 6D and the vertex half-angles
of b ¼ 40�. A corresponding drop-off in the predicted performance from the EA with an
increase in the number of turbines in array is shown Figure 10. Of note, these results are nor-
malized by the LRB predicted performance of a linear array, i.e., an array of VAWT positioned
along a single line perpendicular to the incoming flow direction with the 6 D spacing between
turbines. Additionally, the domain constraints used in the optimization were not enforced
so that it is possible to calculate the normalized predicted performance of the larger arrays.
Figure 10 shows that the EA results follow the ideal truss array for small numbers of turbines
before diverging with the increased number of turbines, likely due to the fixed run times, 105
iterations, and the increased pressure from spatial constraints. It is hypothesized that with suffi-
ciently long convergence times, all of these arrays would converge on the ideal truss array,
adding additional rows only as required by the domain constraints. As turbines are added to the
truss array, the predicted performance asymptotes to approximately 30% higher than that of an
equivalent array of isolated turbines.
D. Effect of asymmetry
While the LRB model discussed above idealizes the flow around a VAWT as symmetric,
the asymmetry observed in laboratory and field VAWT can impact the implementation of any
optimization. There are a number of ways to explore the effect of wake asymmetry. For exam-
ple, a potential flow vortex could be added to the model at the location of the source, similar to
the model used by Whittlesey et al.25 Another approach would be to deflect the source-sink
axis with respect to the freestream. While both approaches add an additional free parameter to
the model that would need to be determined from experiments, i.e., the vortex strength or the
wake deflection angle, the latter approach will be explored briefly here.
The experimental data from Figure 4(a) indicates that if two turbines were to be placed
behind the upstream turbine, they would be placed at different distances from the centerline so
that both downstream turbines could maximize their downstream performance enhancement.
This implies that, unlike the ideal truss array—which is built on a string of isosceles triangles
aligned with the freestream flow—an implementation of the truss array would be built on a
more complex base triangle.
To test this hypothesis, asymmetry was added to the LRB model in the form of a pre-
scribed wake deflection angle between the source-sink axis and the freestream. Insufficient data
was collected in prior field or laboratory experiments to simultaneously calibrate both free
parameters, the source-sink spacing, ss, and the wake deflection angle, d. Instead, all previously
used model parameters were held constant from the field studies, i.e., ru¼ 3, rw¼ 10, and
ss ¼ 1:44, and the asymmetry angle was chosen to be d ¼ �11:75�. This value was chosen
FIG. 10. LRB predicted performance of the ideal truss array (R¼ 6, b ¼ 40�), and the EA predicted best performing arrays
versus the number of turbines in the array. All performance values are normalized by the equivalent linear array.
053306-15 Brownstein, Kinzel, and Dabiri J. Renewable Sustainable Energy 8, 053306 (2016)
Reuse of AIP Publishing content is subject to the terms: https://publishing.aip.org/authors/rights-and-permissions. Downloaded to IP: 171.67.81.230 On: Tue, 04 Oct 2016
16:32:41
since it maximizes the linear correlation between the measured and asymmetric LRB predic-
tions for the traversing turbine laboratory experiment. A comparison between the experimental
data, standard LRB predictions, and asymmetric LRB predictions is shown in Figure 4(a). The
correlation between the standard LRB predictions and experimental results is r2 ¼ 0:59 while,
with the addition of asymmetry, the correlation improves to r2 ¼ 0:94.
The results from this modification of the EA results are shown in Figures 11(a) and 11(b).
Similar to the symmetric solution, the optimal 3-turbine array is an isosceles triangle in which
the legs are of length R ¼ 6D, the minimum spacing enforced by the EA. Unlike the symmetric
solution, this isosceles triangle is not aligned with the freestream. To provide insight into where
this misalignment comes from, the 2-turbine test case illustrated in Figure 9(a) is revisited with
the asymmetric LRB model. Figure 9(c) indicates that the peak downstream performance
enhancement is no longer symmetric, as is the case in Figure 9(b), but instead there are two
peak performance angles, b1 � 34� and b2 � 44� at R ¼ 6D. In fact, these correspond with the
geometry of the EA results in Figures 11(a).
As with the symmetric case, this optimal 3-turbine solution is the base unit for larger arrays.
The result of the patterning is that the asymmetric truss array sweeps downstream at an angle c,
depicted in Figure 11(b). Geometrically, it can be determined that for this type of truss array
c ¼ b1 � b2
2: (4)
IV. CONCLUSIONS
Laboratory and field measurements were used to demonstrate the performance enhancement
of downstream VAWTs compared to their upstream counterparts. This performance enhance-
ment was found to exist with pairs of both co-rotating and counter-rotating turbines. Flow
acceleration around upstream turbines is proposed as the primary flow mechanism behind this
enhancement, increasing the incident flow speed on the downstream rotors. Along with turbu-
lent phenomena that help to energize the flow in VAWT arrays, this mean flow mechanism can
contribute to the higher performance of VAWT arrays compared to individual VAWT in
isolation.
Additionally, this effect was found to be captured by the low-order Leaky Rankine Body
model developed by Araya et al.17 Further validation of the model demonstrated its ability to
rank various 3-turbine arrays and its ability to rank the performance of larger arrays in the field
FIG. 11. Optimal array configurations from the asymmetric EA using (a) 3-turbine and (b) 7-turbine arrays. The plot
boundaries represent the extent of the domain in which the turbines were confined. The flow approaches the domain from
the left.
053306-16 Brownstein, Kinzel, and Dabiri J. Renewable Sustainable Energy 8, 053306 (2016)
Reuse of AIP Publishing content is subject to the terms: https://publishing.aip.org/authors/rights-and-permissions. Downloaded to IP: 171.67.81.230 On: Tue, 04 Oct 2016
16:32:41
over a range of naturally occurring wind directions. For example, the model correctly ranked
16 out of 20 tested 3-turbine arrays and correctly predicted the best-performing array. When
used in an evolutionary algorithm, the LRB model predicted the truss array as the optimal array
arrangement to maximize the energy captured. The primary mechanism the model leveraged to
obtain these energy gains is the performance enhancement of downstream turbines caused by
the flow acceleration along the wake of the upstream turbines. When spatial constraints forced
additional rows onto the optimization result, the performance was notably lower than the ideal,
i.e., two row, truss array. This is because there will be less energy to extract deeper in the array
and any gains from utilizing the performance enhancement of downstream turbines are there-
fore expected to have diminished magnitude deeper into an array. Based on the asymptotic limit
of the LRB model prediction of the ideal truss array performance, it is extrapolated that a suffi-
ciently long wind farm utilizing this type of configuration would be able to extract up to
approximately 30% more energy from the wind.
Finally, asymmetry was introduced to the LRB model to give insight into how the asym-
metry of the wake of actual VAWT would impact the implementation of the truss array. It was
found for an array of turbines with a single rotational sense that the evolutionary algorithm con-
verged on a truss array composed of isosceles triangles, similar to the symmetric case, but the
truss is not aligned with the freestream. The misalignment angle was due to the downstream
turbines maximizing their capture of performance enhancement from the upstream turbines.
While these results indicate significant potential for arrays with the proposed truss arrange-
ment, it is important to note the limitations of the LRB model and how they may affect imple-
mentation of the presented results in real-world wind farm environments. First, the observed
convergence toward two rows of turbines may be due to the over-sized wakes modeled with
the LRB. The narrower wakes observed in field experiments may allow for optimal array con-
figurations to utilize more than two rows of turbines in practice. Additionally, the geometry of
the truss array, defined by the minimum separation distance and the angle between the upstream
turbine and its two associated downstream turbines, will be specific to the turbines used and the
wind distribution at a given site. The ideal separation distance and angle for maximum down-
stream turbine enhancement for a given turbine model at a given site will need to be deter-
mined individually for optimal implementation of the truss array. Finally, the ideal separation
distance between turbines will probably be much smaller than the 6D predicted by the LRB
model optimization. This distance is preferred in the model since it is the smallest distance the
LRB model can handle before the influence of the potential flow singularities dominates.
Additional optimization work will be needed to investigate the dynamic effects of placing
turbines in close proximity that the LRB model cannot capture. Higher-order effects such as the
manipulation of vortex shedding, which has been found to be significant for counter-rotating
cylinders26 and in stationary cylinders in close proximity,27 should be further investigated in
the context of VAWT wind farm design.
It may be possible to leverage the effects revealed here with other forms of fluid energy
extraction, such as HAWT, as flow acceleration due to blockage effects is not limited to
VAWT, and this appears to be the primary driver of the downstream performance
enhancement.
ACKNOWLEDGMENTS
The authors gratefully acknowledge the funding from the Gordon and Betty Moore Foundation
through Grant No. 2645, the National Science Foundation Energy for Sustainability program
through Grant No. CBET-0725164, and the Office of Naval Research through Grant No.
N000141211047.
1J. Johansen, H. A. Madsen, M. Gaunaa, C. Bak, and N. Srensen, “Design of a wind turbine rotor for maximum aerody-namic efficiency,” Wind Energy 12, 261–273 (2009).
2E. Hau, Wind Turbines (Springer, Verlag, Berlin, Heidelberg, 2006).3B. Srensen, Renewable Energy: Its Physics, Engineering, Use, Environmental Impacts, Economy, and Planning Aspects(Elsevier, London, 2004).
053306-17 Brownstein, Kinzel, and Dabiri J. Renewable Sustainable Energy 8, 053306 (2016)
Reuse of AIP Publishing content is subject to the terms: https://publishing.aip.org/authors/rights-and-permissions. Downloaded to IP: 171.67.81.230 On: Tue, 04 Oct 2016
16:32:41

4M. Meyers and C. Meneveau, “Optimal turbine spacing in fully developed wind farm boundary layers,” Wind Energy 15,305–317 (2012).
5N. Hamilton, M. Melius, and R. B. Cal, “Wind turbine boundary layer arrays for Cartesian and staggered configurations-Part I, flow field and power measurements,” Wind Energy 18(2), 277–295 (2015).
6K. Johnson and N. Thomas, “Wind farm control: Addressing the aerodynamic interaction among wind turbines,” inAmerican Control Conference Proceedings, St. Louis, MO (IEEE, 2009), pp. 2104–2109.
7D. Madjidian, K. Martensson, and A. Rantzer, “A distributed power coordination scheme for fatigue load reduction inwind farms,” in American Control Conference Proceedings, San Francisco (IEEE, 2011), 5219–5224.
8J. Aho, A. Buckspan, J. Laks, P. Fleming, Y. Jeong, F. Dunne, M. Churchfield, L. Pao, and K. Johnson, “A tutorial ofwind turbine control for supporting grid frequency through active power control,” in American Control ConferenceProceedings, Montreal, QC (IEEE, 2012), pp. 3120–3131.
9J. O. Dabiri, “Potential order-of-magnitude enhancement of wind farm power density via counter-rotating vertical-axiswind turbine arrays,” J. Renewable Sustainable Energy 3, 043104 (2011).
10J. O. Dabiri, “Emergent aerodynamics in wind farms,” Phys. Today 67(10), 66–67 (2014).11M. Kinzel, Q. Mulligan, and J. O. Dabiri, “Energy exchange in an array of vertical-axis wind turbines,” J. Turbul. 13(38),
1–13 (2012).12J. Bremseth and K. Duraisamy, “Computational analysis of vertical axis wind turbine arrays,” Theor. Comput. Fluid Dyn.
30, 387–401 (2016).13A. E. Craig, J. O. Dabiri, and J. R. Koseff, “A kinematic description of the key flow characteristics in an array of finite-
height rotating cylinders,” J. Fluids Eng. 138(7), 071208 (2016).14R. B. Cal, L. Lebron, L. Castillo, H. S. Kang, and C. Meneveau, “Experimental study of the horizontally averaged flow
structure in a model wind-turbine array boundary layer,” J. Renewable Sustainable Energy 2, 013106 (2010).15V. Rolin and F. Porte-Agel, “Wind-tunnel study of the wake behind a vertical axis wind turbine in a boundary layer flow
using stereoscopic particle image velocimetry,” J. Phys.: Conf. Ser. 625, 012012 (2015).16M. Kinzel, D. B. Araya, and J. O. Dabiri, “Turbulence in vertical-axis wind turbine canopies,” Phys. Fluids 27, 115102
(2015).17D. B. Araya, A. E. Craig, M. Kinzel, and J. O. Dabiri, “Low-order modeling of wind farm aerodynamics using Leaky
Rankine bodies,” J. Renewable Sustainable Energy 6, 063118 (2014).18A. Von Meier, Electric Power Systems: A Conceptual Introduction (John Wiley & Sons, 2006).19R. O. Duda, P. E. Hart, and D. G. Stork, Pattern Classification, 2nd Ed. (Wiley, 2001).20D. B. Araya and J. O. Dabiri, “Transition to bluff body dynamics in the wake of vertical-axis wind turbines,” in American
Physical Society 68th Annual DFD Meeting, Boston, MA (2015).21G. Palau-Salvador, T. Stoesser, J. Fr€ohlich, M. Kappler, and W. Rodi, “Large Eddy simulations and experiments of flow
around finite-height cylinders,” Flow Turbul. Combust. 84, 239–275 (2010).22V. Dossena, G. Persico, B. Paradiso, L. Battisti, S. Dell’Anna, A. Brighenti, and E. Benini, “An experimental study of the
aerodynamics and performance of a vertical axis wind turbine in a confined and unconfined environment,” ASME J.Energy Res. Technol. 137(5), 051207 (2015).
23S. Shamsoddin and F. Porte-Agel, “Large Eddy simulation of vertical axis wind turbine wakes,” Energies 7, 890–912(2014).
24H. E. Neustadter and D. A. Spera, “Method for evaluating wind turbine wake effects on wind farm performance,” J. Sol.Eng. 107, 240–243 (1985).
25R. W. Whittlesey, S. C. Liska, and J. O. Dabiri, “Fish schooling as a basis for vertical-axis wind turbine farm design,”Bioinspiration Biomimetics 5, 035005 (2010).
26A. S. Chan, P. A. Dewey, A. Jameson, C. Liang, and A. J. Smits, “Vortex suppression and drag reduction in the wake ofCouter-rotating cylinders,” J. Fluid Mech. 679, 343–382 (2011).
27D. Sumner, “Two circular cylinders in cross-flow: A review,” J. Fluids Struct. 26(6), 849–899 (2010).
053306-18 Brownstein, Kinzel, and Dabiri J. Renewable Sustainable Energy 8, 053306 (2016)
Reuse of AIP Publishing content is subject to the terms: https://publishing.aip.org/authors/rights-and-permissions. Downloaded to IP: 171.67.81.230 On: Tue, 04 Oct 2016
16:32:41