Performance-Economic and Energy Loss Analysis of 80 KWp ... · Solar radiations were collected from...
18
Circuits and Systems, 2016, 7, 662-679 Published Online May 2016 in SciRes. http://www.scirp.org/journal/cs http://dx.doi.org/10.4236/cs.2016.76056 How to cite this paper: Kumar, S.S. and Nagarajan, C. (2016) Performance-Economic and Energy Loss Analysis of 80 KWp Grid Connected Roof Top Transformer Less Photovoltaic Power Plant. Circuits and Systems, 7, 662-679. http://dx.doi.org/10.4236/cs.2016.76056 Performance-Economic and Energy Loss Analysis of 80 KWp Grid Connected Roof Top Transformer Less Photovoltaic Power Plant S. Sathish Kumar 1 , C. Nagarajan 2 1 Anna University, GRT Institute of Engineering and Technology, Thiruthani, India 2 Muthayammal Engineering College, Rasipuram, India Received 16 February 2016; accepted 7 May 2016; published 11 May 2016 Copyright © 2016 by authors and Scientific Research Publishing Inc. This work is licensed under the Creative Commons Attribution International License (CC BY). http://creativecommons.org/licenses/by/4.0/ Abstract In India most part receives 4 - 7 kWh of solar radiation per square meter per day with 200 - 250 sunny days in a year. Tamilnadu state also receives the highest annual radiation in India. In this paper, the grid connected photovoltaic plant has a peak power of 80 KWp supplies electricity re- quirement of GRT IET campus during day time (7 hrs) and reduces load demand and generates useful data for future implementation of such PV plant projects in the Tamilnadu region. Photo- voltaic plant was installed in April 2015, monitored during 6 months, and the performance ratio and the various power losses (power electronics, temperature, soiling, internal, network, grid availability and interconnection) were calculated. The PV plant supplied 64,182.86 KWh to the grid from April to September 2015, ranging from 11,510.900 to 10,200.9 kWh. The final yield ranged from 143.886 (h/d) to 127.51 (y/d), reference yield ranged from 201.6 (h/d) to 155.31 (h/d) and performance ratio ranged from 71.3% to 82.1%, for a duration of six months, it had given a performance ratio of 83.82%, system efficiency was 4.16% and the capacity factor of GRT IET Campus for six months was 18.26%. Payback period in years = 9 years 4 months, energy sav- ing per year = 204,400 KWh, cost reduction per year = 1,737,400, Indian rupee = 26,197.30 USD and total CO2 reductions per year = 102,200 tons CO2/year. Keywords Photo Voltaic, Dual MPPT, Grid Connection, Performance Analysis, Energy Loss Analysis, Economic Analysis, CO2 Reduction, Carbon Credit 1. Introduction In India roof top grid connected solar photovoltaic power plant installations have been increased day by day due
Transcript of Performance-Economic and Energy Loss Analysis of 80 KWp ... · Solar radiations were collected from...

Circuits and Systems, 2016, 7, 662-679 Published Online May 2016 in SciRes. http://www.scirp.org/journal/cs http://dx.doi.org/10.4236/cs.2016.76056
How to cite this paper: Kumar, S.S. and Nagarajan, C. (2016) Performance-Economic and Energy Loss Analysis of 80 KWp Grid Connected Roof Top Transformer Less Photovoltaic Power Plant. Circuits and Systems, 7, 662-679. http://dx.doi.org/10.4236/cs.2016.76056
Performance-Economic and Energy Loss Analysis of 80 KWp Grid Connected Roof Top Transformer Less Photovoltaic Power Plant S. Sathish Kumar1, C. Nagarajan2 1Anna University, GRT Institute of Engineering and Technology, Thiruthani, India 2Muthayammal Engineering College, Rasipuram, India
Received 16 February 2016; accepted 7 May 2016; published 11 May 2016
Copyright © 2016 by authors and Scientific Research Publishing Inc. This work is licensed under the Creative Commons Attribution International License (CC BY). http://creativecommons.org/licenses/by/4.0/
Abstract In India most part receives 4 - 7 kWh of solar radiation per square meter per day with 200 - 250 sunny days in a year. Tamilnadu state also receives the highest annual radiation in India. In this paper, the grid connected photovoltaic plant has a peak power of 80 KWp supplies electricity re-quirement of GRT IET campus during day time (7 hrs) and reduces load demand and generates useful data for future implementation of such PV plant projects in the Tamilnadu region. Photo-voltaic plant was installed in April 2015, monitored during 6 months, and the performance ratio and the various power losses (power electronics, temperature, soiling, internal, network, grid availability and interconnection) were calculated. The PV plant supplied 64,182.86 KWh to the grid from April to September 2015, ranging from 11,510.900 to 10,200.9 kWh. The final yield ranged from 143.886 (h/d) to 127.51 (y/d), reference yield ranged from 201.6 (h/d) to 155.31 (h/d) and performance ratio ranged from 71.3% to 82.1%, for a duration of six months, it had given a performance ratio of 83.82%, system efficiency was 4.16% and the capacity factor of GRT IET Campus for six months was 18.26%. Payback period in years = 9 years 4 months, energy sav-ing per year = 204,400 KWh, cost reduction per year = 1,737,400, Indian rupee = 26,197.30 USD and total CO2 reductions per year = 102,200 tons CO2/year.
Keywords Photo Voltaic, Dual MPPT, Grid Connection, Performance Analysis, Energy Loss Analysis, Economic Analysis, CO2 Reduction, Carbon Credit
1. Introduction In India roof top grid connected solar photovoltaic power plant installations have been increased day by day due
S. S. Kumar, C. Nagarajan
663
to launch of Jawaharlal Nehru National Solar Mission (JNNSM) by the Ministry of New and Renewable Energy India. The main idea of the Jawaharlal Nehru National Solar Mission is to achieve 20 GWp solar power genera-tion capacity by 2020. In India 30% contribution of renewable energy sources is the main energy supply and by conventional methods the electricity generation in India is increasing continuously [1].
The role of renewable energy sources in India’s main energy supply is about 30%. By conventional and re-newable resources, the development of electricity generation in India is increasing continuously. Renewable energy increases the grid capacity by almost 4 times from year 2002 onwards. In April 2002, the installed capac-ity based on renewable energy was 3497 MW (Mega Watt) which was 3% of the country’s total installed capac-ity. It has become 40,799 MW on 30 Nov. 2014, which is about 16% of the total installed capacity according to IEA report.
The energy from sun can be utilized directly or indirectly in the form of solar energy. Solar energy plays an important role in reducing the harmful gases for environment produced during the electricity generation. Solar energy has three different technologies: solar photovoltaic produces solar power electricity, and solar cooling and heating. Based on IEA report before 2050, around 11% of the global energy demand could be satisfied by the solar energy.
International energy agency IEA report informs by solar photovoltaic technology could stop 100 Giga tons of CO2 emissions in the period of 2008-2050. Solar energy reduces grid transmission lines propagation cost, does not affect the cultivated land. International Energy Agency (IEA)’s report informs that before 2050 around 11% of the global energy demand could be fulfilled by the solar energy [2].
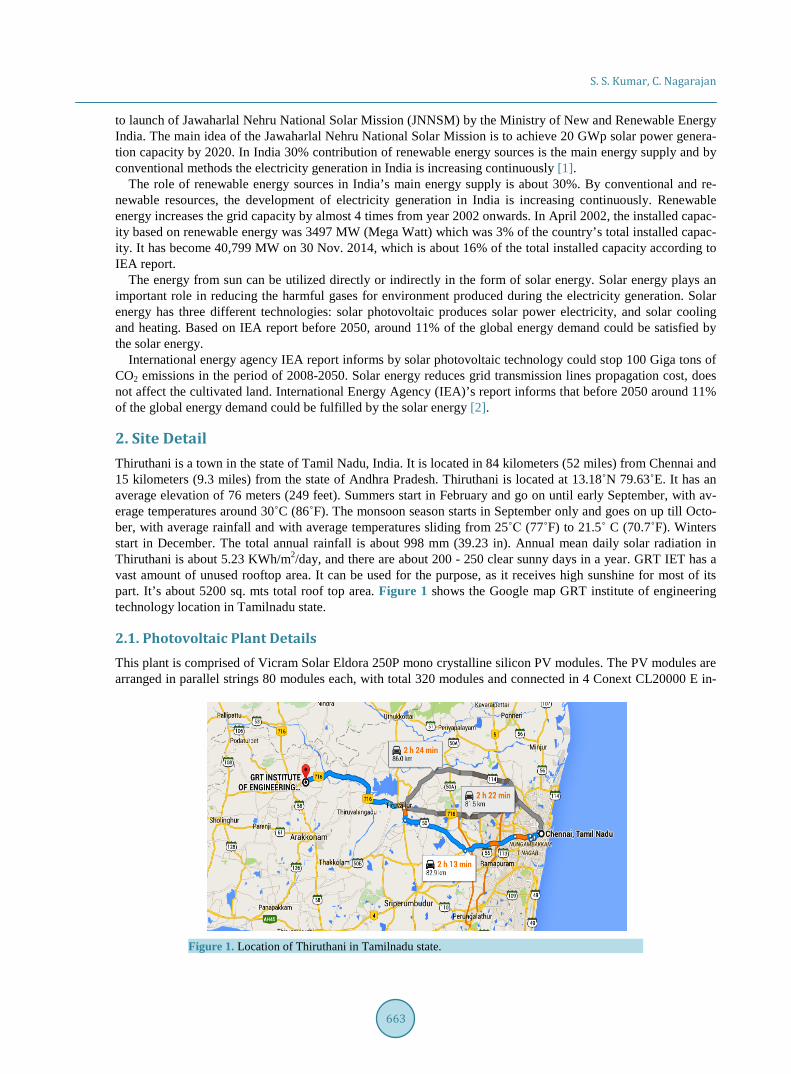
2. Site Detail Thiruthani is a town in the state of Tamil Nadu, India. It is located in 84 kilometers (52 miles) from Chennai and 15 kilometers (9.3 miles) from the state of Andhra Pradesh. Thiruthani is located at 13.18˚N 79.63˚E. It has an average elevation of 76 meters (249 feet). Summers start in February and go on until early September, with av-erage temperatures around 30˚C (86˚F). The monsoon season starts in September only and goes on up till Octo-ber, with average rainfall and with average temperatures sliding from 25˚C (77˚F) to 21.5˚ C (70.7˚F). Winters start in December. The total annual rainfall is about 998 mm (39.23 in). Annual mean daily solar radiation in Thiruthani is about 5.23 KWh/m2/day, and there are about 200 - 250 clear sunny days in a year. GRT IET has a vast amount of unused rooftop area. It can be used for the purpose, as it receives high sunshine for most of its part. It’s about 5200 sq. mts total roof top area. Figure 1 shows the Google map GRT institute of engineering technology location in Tamilnadu state.
2.1. Photovoltaic Plant Details This plant is comprised of Vicram Solar Eldora 250P mono crystalline silicon PV modules. The PV modules are arranged in parallel strings 80 modules each, with total 320 modules and connected in 4 Conext CL20000 E in-
Figure 1. Location of Thiruthani in Tamilnadu state.
S. S. Kumar, C. Nagarajan
664
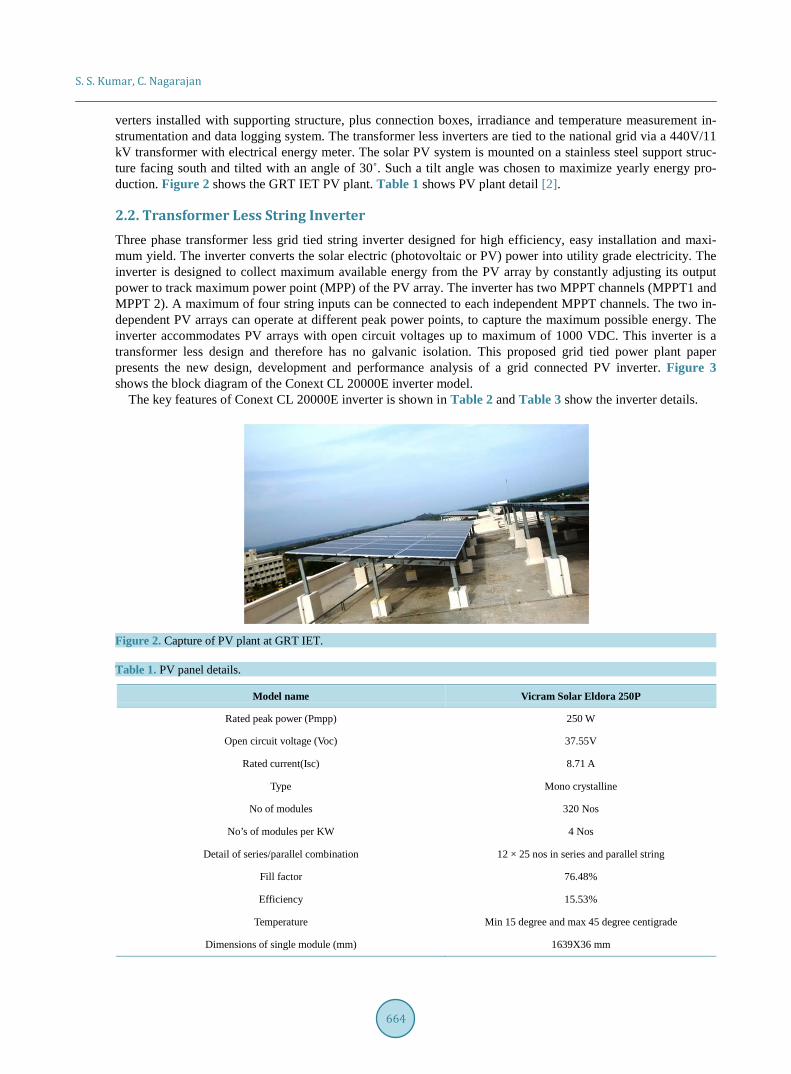
verters installed with supporting structure, plus connection boxes, irradiance and temperature measurement in- strumentation and data logging system. The transformer less inverters are tied to the national grid via a 440V/11 kV transformer with electrical energy meter. The solar PV system is mounted on a stainless steel support struc-ture facing south and tilted with an angle of 30˚. Such a tilt angle was chosen to maximize yearly energy pro-duction. Figure 2 shows the GRT IET PV plant. Table 1 shows PV plant detail [2].
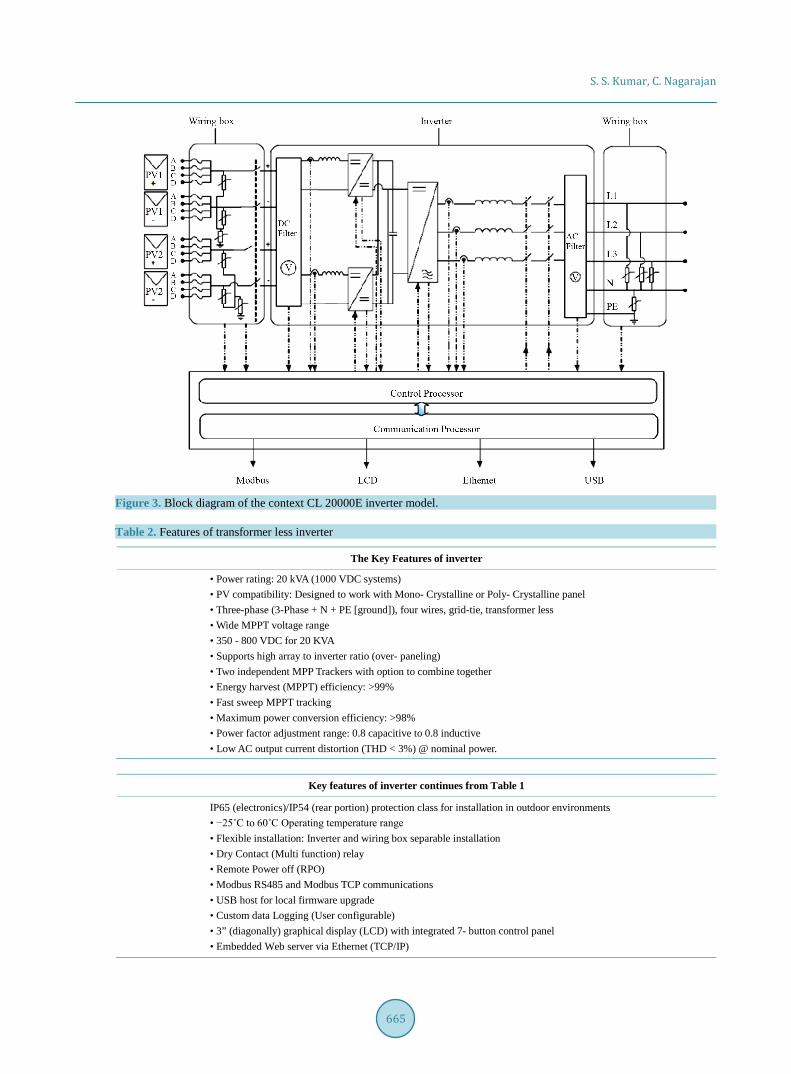
2.2. Transformer Less String Inverter Three phase transformer less grid tied string inverter designed for high efficiency, easy installation and maxi-mum yield. The inverter converts the solar electric (photovoltaic or PV) power into utility grade electricity. The inverter is designed to collect maximum available energy from the PV array by constantly adjusting its output power to track maximum power point (MPP) of the PV array. The inverter has two MPPT channels (MPPT1 and MPPT 2). A maximum of four string inputs can be connected to each independent MPPT channels. The two in-dependent PV arrays can operate at different peak power points, to capture the maximum possible energy. The inverter accommodates PV arrays with open circuit voltages up to maximum of 1000 VDC. This inverter is a transformer less design and therefore has no galvanic isolation. This proposed grid tied power plant paper presents the new design, development and performance analysis of a grid connected PV inverter. Figure 3 shows the block diagram of the Conext CL 20000E inverter model.
The key features of Conext CL 20000E inverter is shown in Table 2 and Table 3 show the inverter details.
Figure 2. Capture of PV plant at GRT IET.
Table 1. PV panel details.
Model name Vicram Solar Eldora 250P
Rated peak power (Pmpp) 250 W
Open circuit voltage (Voc) 37.55V
Rated current(Isc) 8.71 A
Type Mono crystalline
No of modules 320 Nos
No’s of modules per KW 4 Nos
Detail of series/parallel combination 12 × 25 nos in series and parallel string
Fill factor 76.48%
Efficiency 15.53%
Temperature Min 15 degree and max 45 degree centigrade
Dimensions of single module (mm) 1639X36 mm
S. S. Kumar, C. Nagarajan
665
Figure 3. Block diagram of the context CL 20000E inverter model.
Table 2. Features of transformer less inverter
The Key Features of inverter
• Power rating: 20 kVA (1000 VDC systems) • PV compatibility: Designed to work with Mono- Crystalline or Poly- Crystalline panel • Three-phase (3-Phase + N + PE [ground]), four wires, grid-tie, transformer less • Wide MPPT voltage range • 350 - 800 VDC for 20 KVA • Supports high array to inverter ratio (over- paneling) • Two independent MPP Trackers with option to combine together • Energy harvest (MPPT) efficiency: >99% • Fast sweep MPPT tracking • Maximum power conversion efficiency: >98% • Power factor adjustment range: 0.8 capacitive to 0.8 inductive • Low AC output current distortion (THD < 3%) @ nominal power.
Key features of inverter continues from Table 1
IP65 (electronics)/IP54 (rear portion) protection class for installation in outdoor environments • −25˚C to 60˚C Operating temperature range • Flexible installation: Inverter and wiring box separable installation • Dry Contact (Multi function) relay • Remote Power off (RPO) • Modbus RS485 and Modbus TCP communications • USB host for local firmware upgrade • Custom data Logging (User configurable) • 3” (diagonally) graphical display (LCD) with integrated 7- button control panel • Embedded Web server via Ethernet (TCP/IP)

S. S. Kumar, C. Nagarajan
666
Table 3. Inverter details.
Device name Conext CL20000 E
Electrical specifications
Input DC
Full power MPPT voltage range 350 - 800 V
Operating voltage range at nominal AC voltage 250 - 1000 V
Max. input voltage, open circuit 1000 V
Number of MPPT/strings per MPPT 2
Max. DC input current per MPPT 31.0 A
Max. array short circuit current per MPPT 40.0 A
Nominal DC input power 21.5 KW
Max. DC input power per MPPT 12.9 Kw
Output (AC)
Rated output power (PF = 1) 20.0 kW
Max. apparent power 20.0 kVA
Nominal output voltage 230/400 V
AC voltage range 184 - 276 V/319 - 478 V
Frequency 50/60 Hz
Frequency range (adjustable) 50 +/− 3 Hz, 60 +/− 3Hz
Max. output current 30.0 A
Nominal continuous output current 29.0 A
Total harmonic distortion <3%
Power factor (adjustable) 0.8 lead to 0.8 lag
Efficiency Peak 98.3%
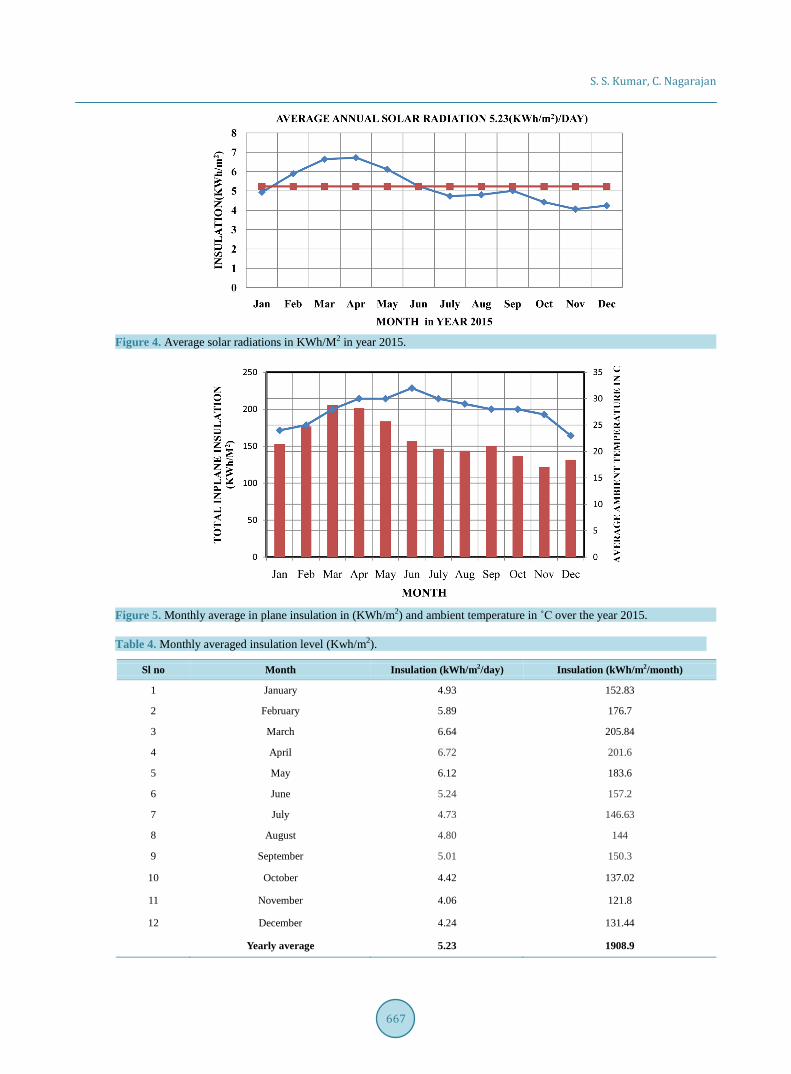
3. Solar Radiation and Insulation Analysis Solar radiations were collected from the different places in plant to estimate the solar radiation the incident global irradiance of array plane in plant cell, the ambient temperature of PV cell, the DC output power of each array and the AC output power of PV plant of GRT IET were measured for every 5 min and stored in the custom data logging system and also embedded Web server via Ethernet. The monthly AC output energy generated at the grid was stored in internal custom data logging system. Figure 4 shows the monthly averaged solar radian and Figure 5 shows the total in-plane insulation together with the monthly ambient temperature averaged over the daytime hours in the year 2015. The highest value of total in-plane insulation was in March with 205.886 kWh/m2 and the lowest in November was 121.88 kWh/m2. The annual insulation was 1908.96 kWh/m2, and the mean ambient temperature was 33.10˚C [3].
The average insulation data for Thiruthani is presented in the Table 4 below. Since the peak power output of solar modules is delivered at STC of 1000 W/m2 insulation, the actual power output depends upon the insulation at the place.
3.1. Performance Evaluation Methodology As per IEC standards the following main parameters are evaluated to find the PV system performance:
S. S. Kumar, C. Nagarajan
667
Figure 4. Average solar radiations in KWh/M2 in year 2015.
Figure 5. Monthly average in plane insulation in (KWh/m2) and ambient temperature in ˚C over the year 2015.
Table 4. Monthly averaged insulation level (Kwh/m2).
Sl no Month Insulation (kWh/m2/day) Insulation (kWh/m2/month)
1 January 4.93 152.83
2 February 5.89 176.7
3 March 6.64 205.84
4 April 6.72 201.6
5 May 6.12 183.6
6 June 5.24 157.2
7 July 4.73 146.63
8 August 4.80 144
9 September 5.01 150.3
10 October 4.42 137.02
11 November 4.06 121.8
12 December 4.24 131.44
Yearly average 5.23 1908.9
S. S. Kumar, C. Nagarajan
668
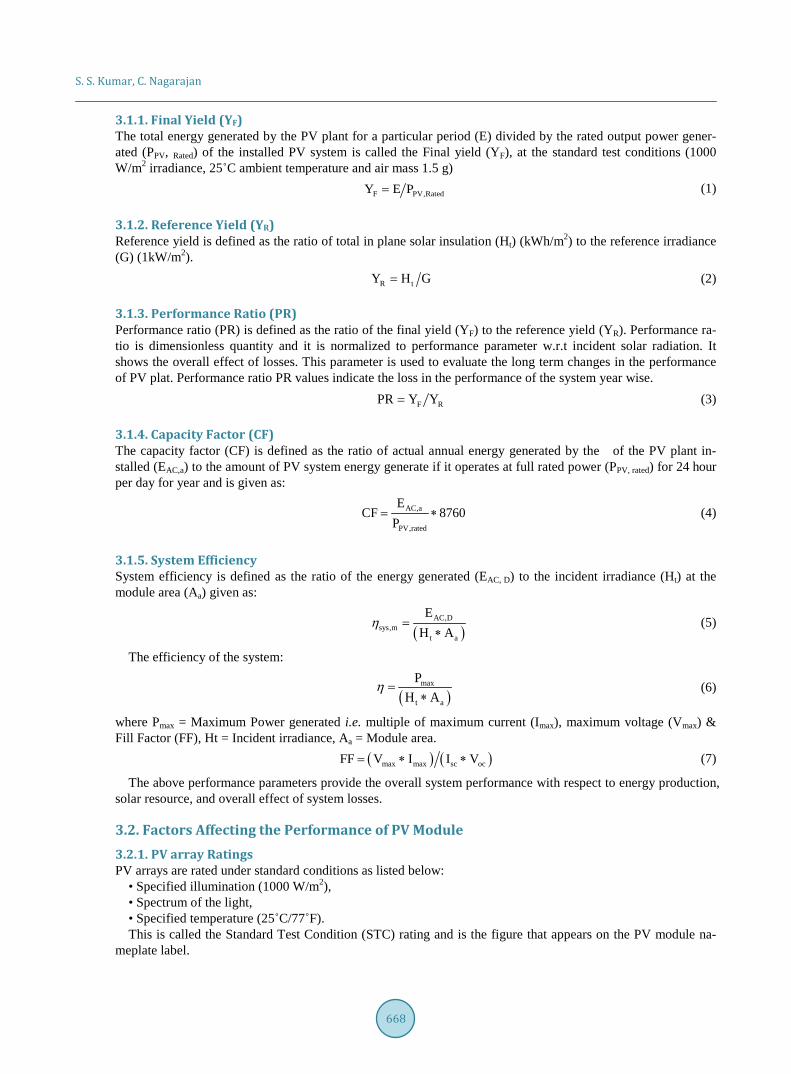
3.1.1. Final Yield (YF) The total energy generated by the PV plant for a particular period (E) divided by the rated output power gener-ated (PPV, Rated) of the installed PV system is called the Final yield (YF), at the standard test conditions (1000 W/m2 irradiance, 25˚C ambient temperature and air mass 1.5 g)
F PV,RatedY E P= (1)
3.1.2. Reference Yield (YR) Reference yield is defined as the ratio of total in plane solar insulation (Ht) (kWh/m2) to the reference irradiance (G) (1kW/m2).
R tY H G= (2)
3.1.3. Performance Ratio (PR) Performance ratio (PR) is defined as the ratio of the final yield (YF) to the reference yield (YR). Performance ra-tio is dimensionless quantity and it is normalized to performance parameter w.r.t incident solar radiation. It shows the overall effect of losses. This parameter is used to evaluate the long term changes in the performance of PV plat. Performance ratio PR values indicate the loss in the performance of the system year wise.
F RPR Y Y= (3)
3.1.4. Capacity Factor (CF) The capacity factor (CF) is defined as the ratio of actual annual energy generated by the of the PV plant in-stalled (EAC,a) to the amount of PV system energy generate if it operates at full rated power (PPV, rated) for 24 hour per day for year and is given as:
AC,a
PV,rated
ECF 8760
P= ∗ (4)
3.1.5. System Efficiency System efficiency is defined as the ratio of the energy generated (EAC, D) to the incident irradiance (Ht) at the module area (Aa) given as:
( )AC,D
sys,mt a
EH A
η =∗
(5)
The efficiency of the system:
( )max
t a
PH A
η =∗
(6)
where Pmax = Maximum Power generated i.e. multiple of maximum current (Imax), maximum voltage (Vmax) & Fill Factor (FF), Ht = Incident irradiance, Aa = Module area.
( ) ( )max max sc ocFF V I I V∗= ∗ (7)
The above performance parameters provide the overall system performance with respect to energy production, solar resource, and overall effect of system losses.
3.2. Factors Affecting the Performance of PV Module 3.2.1. PV array Ratings PV arrays are rated under standard conditions as listed below:
• Specified illumination (1000 W/m2), • Spectrum of the light, • Specified temperature (25˚C/77˚F). This is called the Standard Test Condition (STC) rating and is the figure that appears on the PV module na-
meplate label.

S. S. Kumar, C. Nagarajan
669
3.2.2. Expected Performance Due to several unavoidable environmental factors, a PV array produces only around 60% to 70% of its peak STC-rated output for a well designed and installed PV system on a typical day.
3.2.3. Temperature and Reduced Output The PV array temperature affects the output of the entire system. As the temperature of the array surface rises, its energy output decreases. The arrays mounted on roof also collect the heat generated by the roof surface (or trapped under the array) and will produce less output than pole-mounted arrays, which allow greater air circula-tion behind the panels.
3.2.4. Partial Shade The shading of even only a single module of the array reduces the output of the entire system. For example, the shadow is caused by a utility wire or tree branch on a portion of the array’s surface. Partial shading reduces the total output.
3.2.5. Other Factors Other factors that contribute to system losses are:
• Dust or dirt on the array, • Smog or Fog, • Mismatched PV array modules, with slight inconsistence in performance from one module to another, • Wire losses, • Utility grid voltage.
3.2.6. Performing General Maintenance The simple routines ensure long years of service and optimal performance of the inverter and PV system.
• Keeping the unit away from dust and debris, • Cleaning the PV array under non-illuminated conditions whenever it is visibly dirty, • Periodically inspecting the system to make sure that all the wiring and supports are securely in place, • Maintaining a log of system performance readings so that PV plant performance becomes analyzed periodi-
cally.
4. Total Output The average Energy generated from photovoltaic power plant are tabulated on daily basis and here the average 6 month energy output is calculated by multiplying average monthly energy output with total number of days for 6 month. Kilo watt-Hour (kWh) means 1000 watts consumed for a period of 1 hour and kWh is a unit of energy [1 kWh = 3600 kJ].
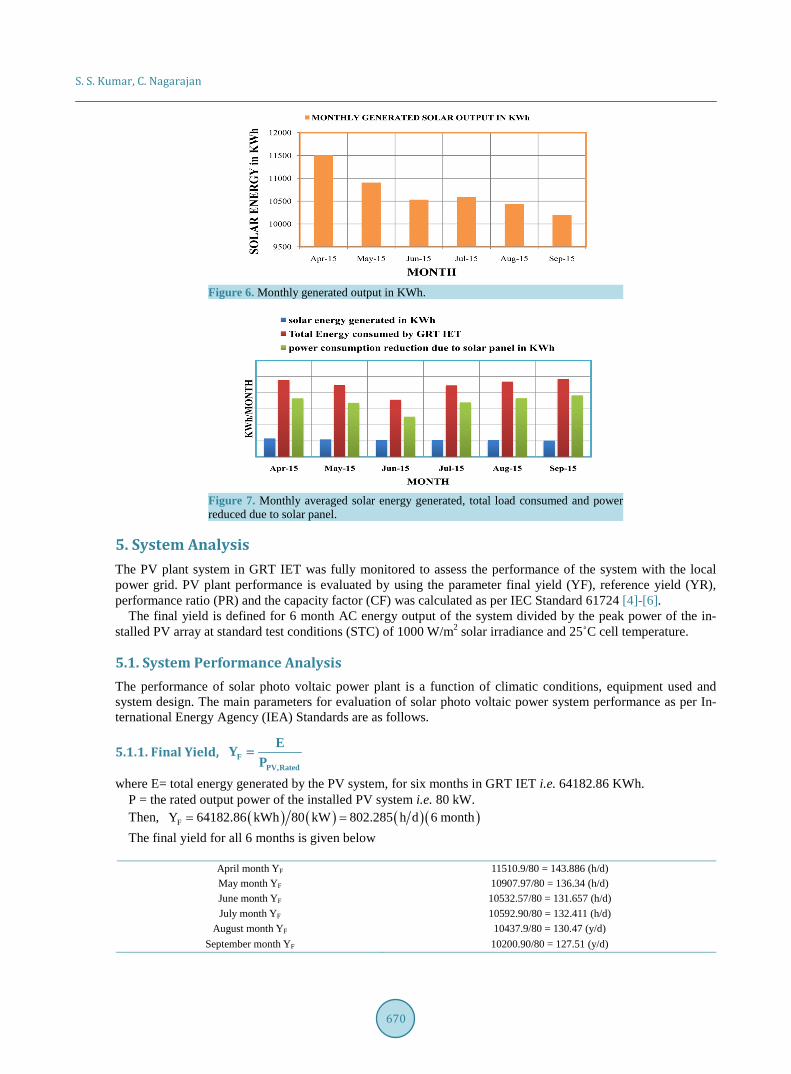
Table 5 shows the Monthly Generated Output in kWh. Figure 6 shows the Simulink model of Monthly gen-erated output in kWh. Figure 7 shows the monthly averaged solar energy generated, total load consumed and power reduced due to solar panel in plant.
Table 5. Monthly generated output in KWh.
Month Solar panel monthly output generated in KWh
Total load consumed GRT IET in KWh
Load consumption reduced by solar panel in KWh
April 2015 11,510.9 47,941.9 36,431
May 2015 10,907.69 44,688.69 33,781
June 2015 10,532.57 35,682.57 25,150
July 2015 10,592.9 44,592.0 34,000
August 2015 10,437.9 46,967.9 36,530
September 2015 10,200.9 48,568.30 38,367.40
Total 64,182.86 26,8441.36 204,259.40
S. S. Kumar, C. Nagarajan
670
Figure 6. Monthly generated output in KWh.
Figure 7. Monthly averaged solar energy generated, total load consumed and power reduced due to solar panel.
5. System Analysis The PV plant system in GRT IET was fully monitored to assess the performance of the system with the local power grid. PV plant performance is evaluated by using the parameter final yield (YF), reference yield (YR), performance ratio (PR) and the capacity factor (CF) was calculated as per IEC Standard 61724 [4]-[6].
The final yield is defined for 6 month AC energy output of the system divided by the peak power of the in-stalled PV array at standard test conditions (STC) of 1000 W/m2 solar irradiance and 25˚C cell temperature.
5.1. System Performance Analysis The performance of solar photo voltaic power plant is a function of climatic conditions, equipment used and system design. The main parameters for evaluation of solar photo voltaic power system performance as per In-ternational Energy Agency (IEA) Standards are as follows.
5.1.1. Final Yield, FPV,Rated
EYP
=
where E= total energy generated by the PV system, for six months in GRT IET i.e. 64182.86 KWh. P = the rated output power of the installed PV system i.e. 80 kW. Then, ( ) ( ) ( ) ( )FY 64182.86 kWh 80 kW 802.285 h d 6 month= = The final yield for all 6 months is given below
April month YF 11510.9/80 = 143.886 (h/d) May month YF 10907.97/80 = 136.34 (h/d) June month YF 10532.57/80 = 131.657 (h/d) July month YF 10592.90/80 = 132.411 (h/d)
August month YF 10437.9/80 = 130.47 (y/d) September month YF 10200.90/80 = 127.51 (y/d)
S. S. Kumar, C. Nagarajan
671
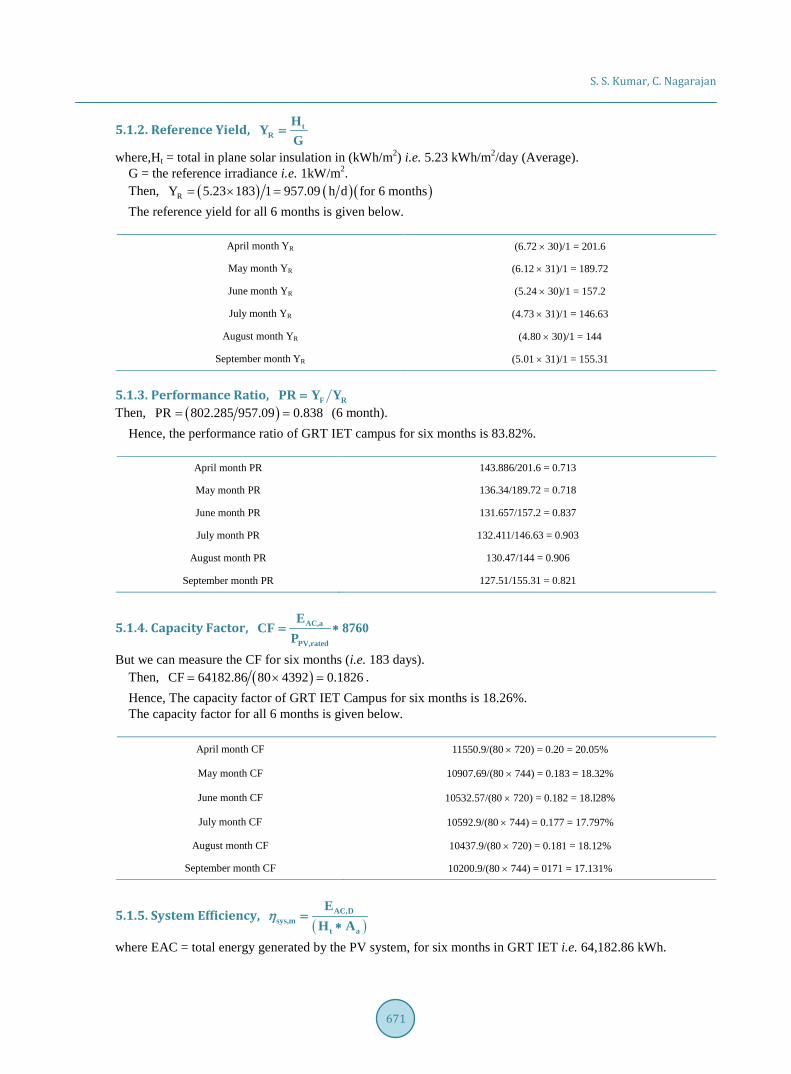
5.1.2. Reference Yield, tR
HY
G=
where,Ht = total in plane solar insulation in (kWh/m2) i.e. 5.23 kWh/m2/day (Average). G = the reference irradiance i.e. 1kW/m2. Then, ( ) ( ) ( )RY 5.23 183 1 957.09 h d for 6 months= × = The reference yield for all 6 months is given below.
April month YR (6.72 × 30)/1 = 201.6
May month YR (6.12 × 31)/1 = 189.72
June month YR (5.24 × 30)/1 = 157.2
July month YR (4.73 × 31)/1 = 146.63
August month YR (4.80 × 30)/1 = 144
September month YR (5.01 × 31)/1 = 155.31
5.1.3. Performance Ratio, F RPR Y Y= Then, ( )PR 802.285 957.09 0.838= = (6 month).
Hence, the performance ratio of GRT IET campus for six months is 83.82%.
April month PR 143.886/201.6 = 0.713
May month PR 136.34/189.72 = 0.718
June month PR 131.657/157.2 = 0.837
July month PR 132.411/146.63 = 0.903
August month PR 130.47/144 = 0.906
September month PR 127.51/155.31 = 0.821
5.1.4. Capacity Factor, AC,a
PV,rated
ECF 8760
P= ∗
But we can measure the CF for six months (i.e. 183 days). Then, ( )CF 64182.86 80 4392 0.1826= × = . Hence, The capacity factor of GRT IET Campus for six months is 18.26%. The capacity factor for all 6 months is given below.
April month CF 11550.9/(80 × 720) = 0.20 = 20.05%
May month CF 10907.69/(80 × 744) = 0.183 = 18.32%
June month CF 10532.57/(80 × 720) = 0.182 = 18.l28%
July month CF 10592.9/(80 × 744) = 0.177 = 17.797%
August month CF 10437.9/(80 × 720) = 0.181 = 18.12%
September month CF 10200.9/(80 × 744) = 0171 = 17.131%
5.1.5. System Efficiency, ( )
AC,Dsys,m
t a
EH A
=∗
η
where EAC = total energy generated by the PV system, for six months in GRT IET i.e. 64,182.86 kWh.
S. S. Kumar, C. Nagarajan
672
Ht = total in plane solar insulation in (kWh/m2) i.e. 5.23 kWh/m2/day = 9547.09 kWh/m2. Aa = Module area in (m2) i.e. 1609 m2. Then,
( )sys,m 64182.86 957.09 1609 0.0416 4.16%η = × = =
The System efficiency for all 6 months is given below.
April month ηsys 11510.9/(201.6 × 1609) = 0.0354 = 3.54%
May month ηsys 10907.97/(189.72 × 1609) = 0.0329 = 3.29%
June month ηsys 10532.57/(157.2 × 1609) = 0.0416 = 4.16%
July month ηsys 10592.90/(146.63 × 1609) = 0.0448 = 4.448%
August month ηsys 10437.9/ (144 × 1609) = 0.0448 = 4.48%
September month ηsys 10200.90/ (155.31 × 1609) = 0.0408 = 4.08%
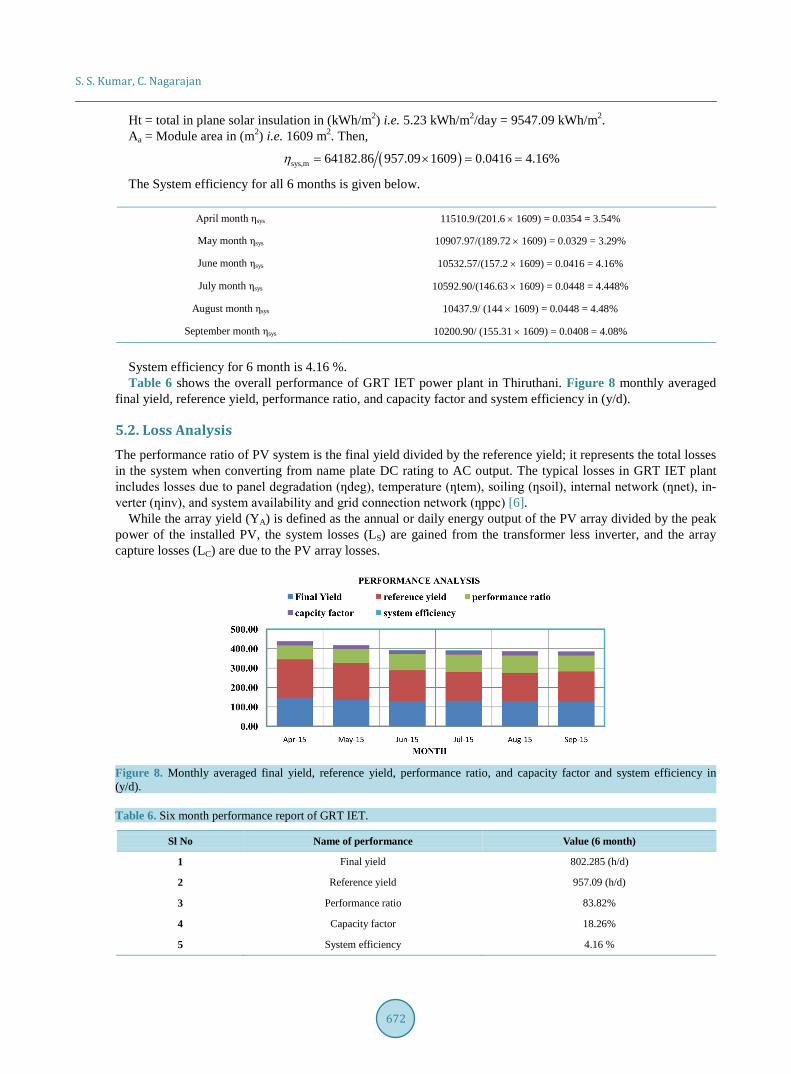
System efficiency for 6 month is 4.16 %. Table 6 shows the overall performance of GRT IET power plant in Thiruthani. Figure 8 monthly averaged
final yield, reference yield, performance ratio, and capacity factor and system efficiency in (y/d).
5.2. Loss Analysis The performance ratio of PV system is the final yield divided by the reference yield; it represents the total losses in the system when converting from name plate DC rating to AC output. The typical losses in GRT IET plant includes losses due to panel degradation (ƞdeg), temperature (ƞtem), soiling (ƞsoil), internal network (ƞnet), in-verter (ƞinv), and system availability and grid connection network (ƞppc) [6].
While the array yield (YA) is defined as the annual or daily energy output of the PV array divided by the peak power of the installed PV, the system losses (LS) are gained from the transformer less inverter, and the array capture losses (LC) are due to the PV array losses.
Figure 8. Monthly averaged final yield, reference yield, performance ratio, and capacity factor and system efficiency in (y/d).
Table 6. Six month performance report of GRT IET.
Sl No Name of performance Value (6 month)
1 Final yield 802.285 (h/d)
2 Reference yield 957.09 (h/d)
3 Performance ratio 83.82%
4 Capacity factor 18.26%
5 System efficiency 4.16 %

S. S. Kumar, C. Nagarajan
673
AA
R
EYP
= (8)
RC
A
YLY
= (9)
AS
F
YLY
= (10)
5.2.1. Monthly Array Yield Loss AA
R
EYP
=
Monthly array loss ( )AA
R
EY 64182.86 444 144.55 h dP
= = = (6 month).
The monthly array yield loss for all 6 months is given below.
April month YA 11,510.90/444 = 25.925 (h/d)
May month YA 10,907.97/382 = 28.55 (h/d)
June month YA 10,532.57/378 = 27.86 (h/d)
July month YA 10,592.90/413 = 25.648 (h/d)
August month YA 10,437.9/340 = 30.699 (h/d)
September month YA 10,200.90/329.06 = 31.0012 (h/d)
5.2.2. Monthly Array Capture Losses RC
A
YLY
=
Monthly array capture losses ( ) ( )R
A
Y 957.09 4.55 812.53 h d 6monthY
= = .
The monthly array capture loss for all 6 months is given below.
April month Lc 201.6 - 25.925 = 175.65 (h/d)
May month Lc 189.72 - 28.55 = 161.17 (h/d)
June month Lc 157.2 - 27.86 = 129.34 (h/d)
July month Lc 146.63 - 25.648 = 120.98 (h/d)
August month Lc 144 - 30.699 = 113.301 (h/d)
September month Lc 155.31 - 31.0012 = 124.309 (h/d)
5.2.3. Monthly System Losses AS
F
YLY
=
Monthly system losses ( ) ( )SL 144.55 802.285 0.181 h d 6month= = . The monthly system loss for all 6 months is given below.
April month LS 25.925/143.886 = 0.18 (h/d)
May month LS 28.55/136.34 = 0.2090.18 (h/d)
June month LS 27.86/131.657 = 0.2110.18 (h/d)
July month LS 25.648/132.411 = 0.1930.18 (h/d)
August month LS 30.699/130.47 = 0.2350.18 (h/d)
September month LS 31.0012/127.51 = 0.243018 (h/d)
S. S. Kumar, C. Nagarajan
674
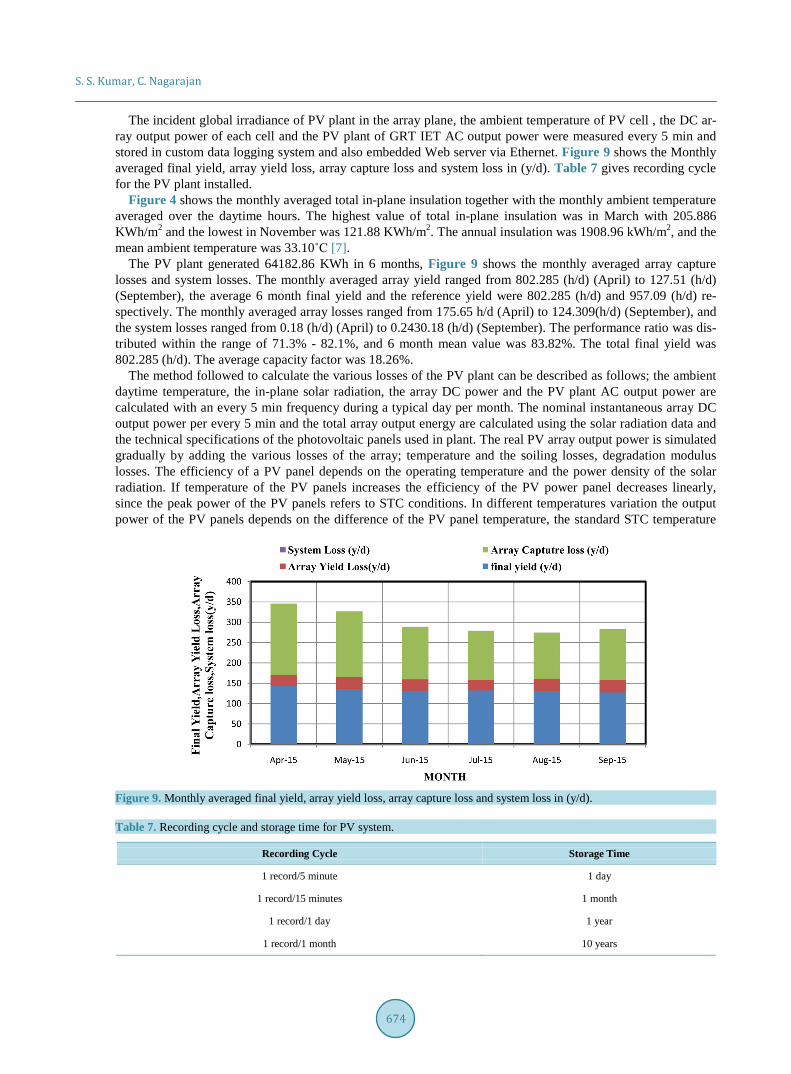
The incident global irradiance of PV plant in the array plane, the ambient temperature of PV cell , the DC ar-ray output power of each cell and the PV plant of GRT IET AC output power were measured every 5 min and stored in custom data logging system and also embedded Web server via Ethernet. Figure 9 shows the Monthly averaged final yield, array yield loss, array capture loss and system loss in (y/d). Table 7 gives recording cycle for the PV plant installed.
Figure 4 shows the monthly averaged total in-plane insulation together with the monthly ambient temperature averaged over the daytime hours. The highest value of total in-plane insulation was in March with 205.886 KWh/m2 and the lowest in November was 121.88 KWh/m2. The annual insulation was 1908.96 kWh/m2, and the mean ambient temperature was 33.10˚C [7].
The PV plant generated 64182.86 KWh in 6 months, Figure 9 shows the monthly averaged array capture losses and system losses. The monthly averaged array yield ranged from 802.285 (h/d) (April) to 127.51 (h/d) (September), the average 6 month final yield and the reference yield were 802.285 (h/d) and 957.09 (h/d) re-spectively. The monthly averaged array losses ranged from 175.65 h/d (April) to 124.309(h/d) (September), and the system losses ranged from 0.18 (h/d) (April) to 0.2430.18 (h/d) (September). The performance ratio was dis-tributed within the range of 71.3% - 82.1%, and 6 month mean value was 83.82%. The total final yield was 802.285 (h/d). The average capacity factor was 18.26%.
The method followed to calculate the various losses of the PV plant can be described as follows; the ambient daytime temperature, the in-plane solar radiation, the array DC power and the PV plant AC output power are calculated with an every 5 min frequency during a typical day per month. The nominal instantaneous array DC output power per every 5 min and the total array output energy are calculated using the solar radiation data and the technical specifications of the photovoltaic panels used in plant. The real PV array output power is simulated gradually by adding the various losses of the array; temperature and the soiling losses, degradation modulus losses. The efficiency of a PV panel depends on the operating temperature and the power density of the solar radiation. If temperature of the PV panels increases the efficiency of the PV power panel decreases linearly, since the peak power of the PV panels refers to STC conditions. In different temperatures variation the output power of the PV panels depends on the difference of the PV panel temperature, the standard STC temperature
Figure 9. Monthly averaged final yield, array yield loss, array capture loss and system loss in (y/d).
Table 7. Recording cycle and storage time for PV system.
Recording Cycle Storage Time
1 record/5 minute 1 day
1 record/15 minutes 1 month
1 record/1 day 1 year
1 record/1 month 10 years
S. S. Kumar, C. Nagarajan
675
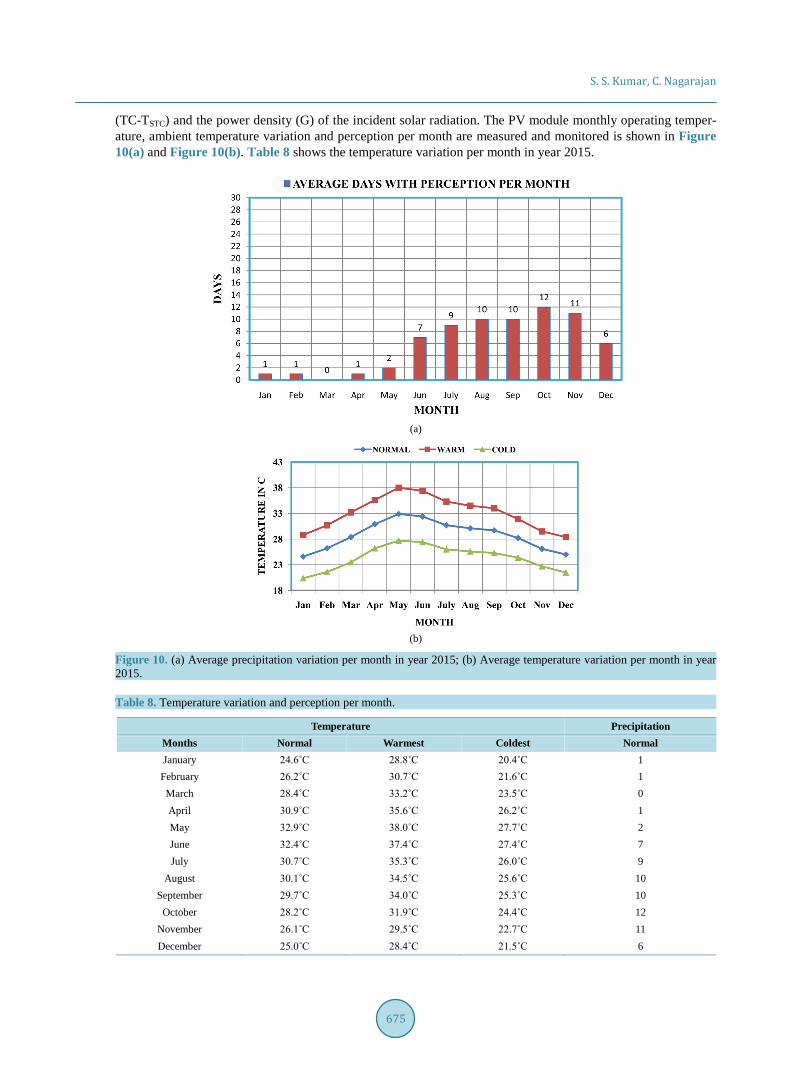
(TC-TSTC) and the power density (G) of the incident solar radiation. The PV module monthly operating temper-ature, ambient temperature variation and perception per month are measured and monitored is shown in Figure 10(a) and Figure 10(b). Table 8 shows the temperature variation per month in year 2015.
(a)
(b)
Figure 10. (a) Average precipitation variation per month in year 2015; (b) Average temperature variation per month in year 2015.
Table 8. Temperature variation and perception per month.
Temperature Precipitation Months Normal Warmest Coldest Normal January 24.6˚C 28.8˚C 20.4˚C 1
February 26.2˚C 30.7˚C 21.6˚C 1 March 28.4˚C 33.2˚C 23.5˚C 0 April 30.9˚C 35.6˚C 26.2˚C 1 May 32.9˚C 38.0˚C 27.7˚C 2 June 32.4˚C 37.4˚C 27.4˚C 7 July 30.7˚C 35.3˚C 26.0˚C 9
August 30.1˚C 34.5˚C 25.6˚C 10 September 29.7˚C 34.0˚C 25.3˚C 10
October 28.2˚C 31.9˚C 24.4˚C 12 November 26.1˚C 29.5˚C 22.7˚C 11 December 25.0˚C 28.4˚C 21.5˚C 6
S. S. Kumar, C. Nagarajan
676
In summer the monthly average hourly PV module temperature varied within 37.4˚C to 28.4˚C, and the am-bient temperature ranged between 34.5˚C and 30.7˚C. In winter, the average hourly PV module temperature ranged between 31.9˚C and 28.4˚C. The temperature losses coefficient (ƞtem) can be calculated as
( )ctem 1 T 25η β= + − (11)
where β is the temperature factor of the PV module. The PV cell temperature (TC) is correlated with the air tem-perature (Ta) as follows
( ) ( )c a NOCT a NOCTNOCT
G GT T T 20 T T 20G 800
= + − = + − (12)
where nominal temperature NOCT (45˚C) is the operational cell temperature and G is the power density at the particular time. The coefficients of temperature losses were calculated with every 5 min frequency and the an-nual losses were calculated and summed to 7.12%.
The PV panel’s continuous operation normally covered with a fine layer of dust and dirt, decreasing the amount of light fall on each PV cell. The amount of power loss due to soiling (ƞsoil) depends on the type of dust, last rainfall and the cleaning maintenance schedule of the PV module in plant. In GRT IET power plant the monthly coefficients were empirically estimated based on the rainfall data of the site. The soiling losses were calculated 5% - 6% during the winter and 7% - 8% during the summer period in the year, resulting in annual losses at 6.5% in 2015.
A 5% mismatch of power loss due temperature and soiling losses with the real recorded output power was observed in our plant. This mismatch can be considered with PV panel degradation losses (ƞdeg) due to ageing of plant; this is in full agreement with experimental studies and manufacturers declarations and warranties, whereas the initial power declarations lie at 5% with a lifetime maximum of 20%.
[ ] [ ]PV r P 2kWP kW P kW Gm
= ⋅ (13)
The transformer less inverter conversion losses were calculated with a 5 min frequency by subtracting the ar-ray DC output power from the AC output power and by normalizing the DC wiring and interconnection losses (ƞnet = 6%) and Finally, the monthly availability and national grid connections losses (ƞppc) were calculated as the ratio of the sold energy to the grid divided by the AC overall output energy of the plant are shown in Figure 7.
The availability and grid connection losses (ƞPPC) range from 0.3 (April, May) to 19.9% (September), with an annual average of 4.54%. The losses are very low (<1%) in March, April, may and June and there is an increase from august, September.
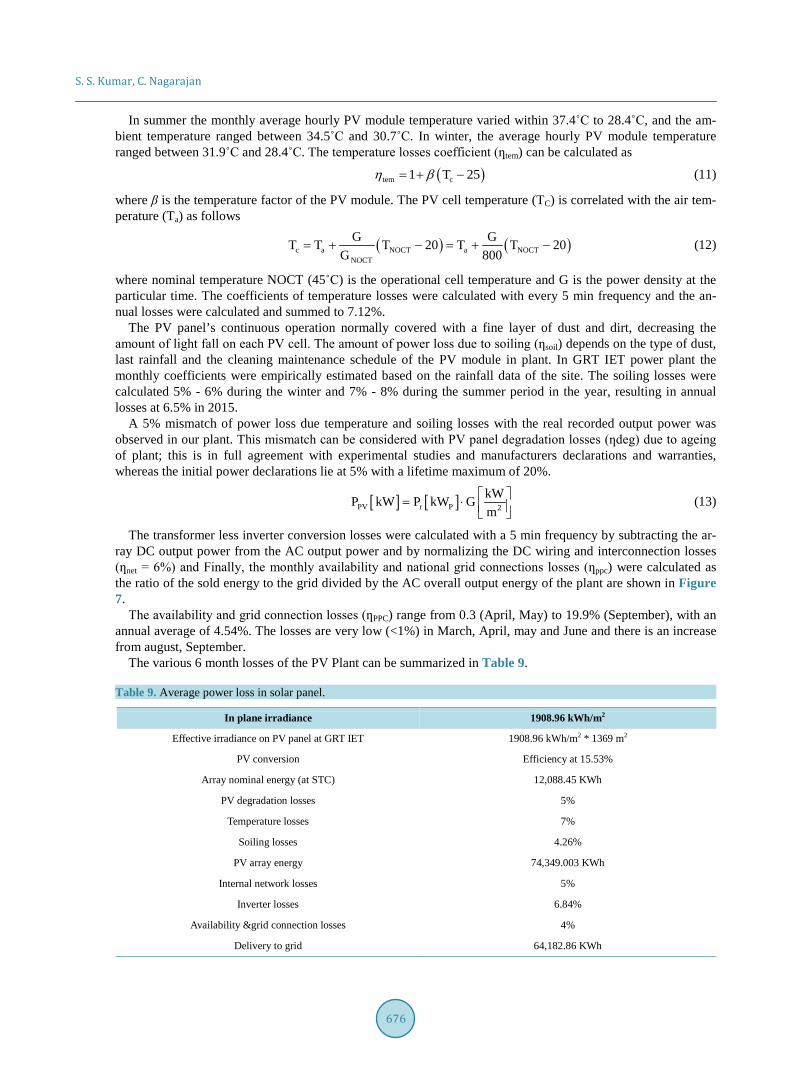
The various 6 month losses of the PV Plant can be summarized in Table 9.
Table 9. Average power loss in solar panel.
In plane irradiance 1908.96 kWh/m2
Effective irradiance on PV panel at GRT IET 1908.96 kWh/m2 * 1369 m2
PV conversion Efficiency at 15.53%
Array nominal energy (at STC) 12,088.45 KWh
PV degradation losses 5%
Temperature losses 7%
Soiling losses 4.26%
PV array energy 74,349.003 KWh
Internal network losses 5%
Inverter losses 6.84%
Availability &grid connection losses 4%
Delivery to grid 64,182.86 KWh
S. S. Kumar, C. Nagarajan
677
6. Economic Analysis Four methods are considered for financial analysis of the power project via (i) pre-tax scenario, (ii) post-tax scenario, (iii) pre-tax with equity and (iv) post-tax with equity for both on-site and off-site options. The financial analysis of plant is considered for 25 years of plant life. In pre-tax scenario financial performances for the project work are determined without considering the tax and duties. For post-tax scenario 0% tax is taken for first 10 years and 4% afterwards is specified for the solar power plant in Tamilnadu. Also, 7% depreciation is considered for first ten years and 1.33% afterwards. The cost analysis is based upon the following factors [8].
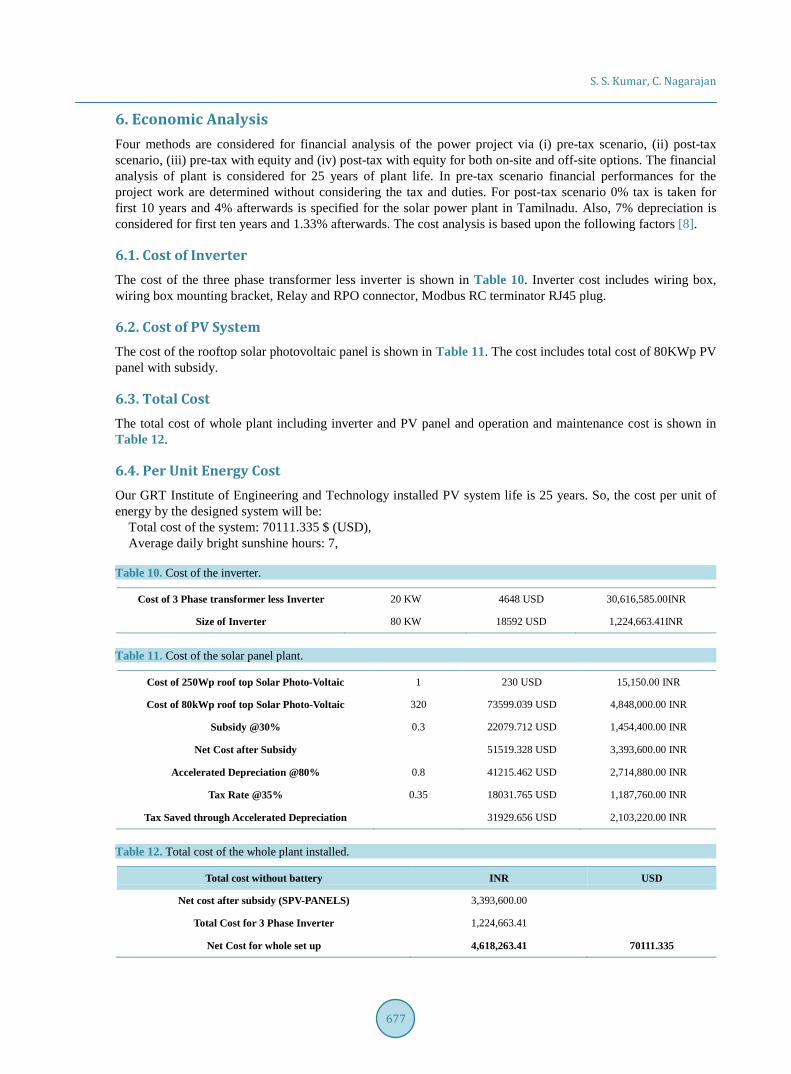
6.1. Cost of Inverter The cost of the three phase transformer less inverter is shown in Table 10. Inverter cost includes wiring box, wiring box mounting bracket, Relay and RPO connector, Modbus RC terminator RJ45 plug.
6.2. Cost of PV System The cost of the rooftop solar photovoltaic panel is shown in Table 11. The cost includes total cost of 80KWp PV panel with subsidy.
6.3. Total Cost The total cost of whole plant including inverter and PV panel and operation and maintenance cost is shown in Table 12.
6.4. Per Unit Energy Cost Our GRT Institute of Engineering and Technology installed PV system life is 25 years. So, the cost per unit of energy by the designed system will be:
Total cost of the system: 70111.335 $ (USD), Average daily bright sunshine hours: 7,
Table 10. Cost of the inverter.
Cost of 3 Phase transformer less Inverter 20 KW 4648 USD 30,616,585.00INR
Size of Inverter 80 KW 18592 USD 1,224,663.41INR
Table 11. Cost of the solar panel plant.
Cost of 250Wp roof top Solar Photo-Voltaic 1 230 USD 15,150.00 INR
Cost of 80kWp roof top Solar Photo-Voltaic 320 73599.039 USD 4,848,000.00 INR
Subsidy @30% 0.3 22079.712 USD 1,454,400.00 INR
Net Cost after Subsidy 51519.328 USD 3,393,600.00 INR
Accelerated Depreciation @80% 0.8 41215.462 USD 2,714,880.00 INR
Tax Rate @35% 0.35 18031.765 USD 1,187,760.00 INR
Tax Saved through Accelerated Depreciation 31929.656 USD 2,103,220.00 INR
Table 12. Total cost of the whole plant installed.
Total cost without battery INR USD
Net cost after subsidy (SPV-PANELS) 3,393,600.00
Total Cost for 3 Phase Inverter 1,224,663.41
Net Cost for whole set up 4,618,263.41 70111.335

S. S. Kumar, C. Nagarajan
678
Estimated capacity of the designed system in kW: 80, Avg. energy produced per day in kWh: 80*7 = 560 W, Energy produced in 25 years in kWh: 560*25*365 = 5,110,000 KWh, Cost per unit = 8.5 rupees (0.103 USD), Total cost reduced by solar energy in 25 year = 4, 34, 35,000 Indian rupees = 654,932.48 USD.
6.5. Environmental Impacts of Solar Power 6.5.1. Benefits under Carbon Credit Carbon separation can provide a country with both monetary and non monetary benefits. Currently carbon cre-dits are valued at approximately € 30 per metric ton. Even if a country generates 100,000 metric tons of carbon credits in year it can generate an additional € 3 million which is a quite significant amount especially for a debt ridden country like India.
Currently, there are only about 225 projects in India which are moving towards taking advantage of this car-bon credit concept to the current global requirement of 350 - 500 million tones of additional carbon credits.
6.5.2. Environmental Impacts Before developing of any new technology we need to consider the following impact on environment.
1) Land use Solar systems can be minimized by placing them at lower-quality locations such as brown fields, abandoned
mining land and transmission corridors. Smaller scale solar PV panels can be built on homes or commercial buildings, also have minimal land use impact.
2) Water use Solar Photo voltaic cell does not use water for generating electricity. 3) Hazardous materials The photo voltaic cell manufacturing industries uses a number of hazardous materials. most of them are used to
clean and purify the semiconductor surface, These chemicals are similar to used in the general semiconductor industry, include 1,1,1-trichloroethane, acetone ,hydro chloric acid, sulfuric acid, nitric acid, and hydrogen fluo-ride.
6.6. Latest Technology Development 6.6.1. Advances in Solar Cell Technology The new technology is in solar cell by Light-Sensitive Nano particles and Gallium Arsenide. Light-Sensitive Nano particles increase radiant light absorption in Panels up to eight percent more efficient at converting sun-light. Gallium Arsenide model of PV cell uses a sensor-driven window blind that can track sun light along with “light-pipes” that guide the light into the system
6.6.2. Molten Salt Storage By using Molten Salt Storage Technology solar plants can operate at temperatures over 500 degrees Celsius, it results in a much higher power output. Due to Molten Salt Storage Technology costs to store solar power will be reduced significantly and companies will finally use solar power plants as base load plants.
6.6.3. Solar Panel with Built-In Battery Solar Panel with Built-In Battery technology is rechargeable battery is built into the solar panel itself, rather than operating as two standalone systems. By combing the two methods into one system costs will be reduced by 25% compared to existing products.
6.7. Advances in Solar Cell Manufacturing Magnesium Chloride-Thin Film Technology Thin film technology is the next generation of solar panels with narrow coatings of cadmium telluride in solar cells. This technology promises to be a much cheaper and more efficient way to commit the photovoltaic process. Magnesium chloride is found from seawater, an abundant resource, which makes the resource very low cost, as well as non-toxic, due to thin film technology increase in efficiency of solar cells from 2% to up to 15%.

S. S. Kumar, C. Nagarajan
679
6.8. New Solar Applications Roads with Solar Panels Solar panels on Roads are used to reduce large amounts of electricity to the grid. This solar panel on road will help to reduce the major barrier to industrial scale already solar roadways have been used in Netherlands.
6.9. Solar Plants on the Water Another method to erect solar plants on the water, since over 70% of the Earth’s surface is covered in water.
6.10. Space-Based Satellites From sunlight Space-based satellites capture and convert the microwave energy into electrical energy. These types of space-based satellite technologies surely capture nearly ninety percent of sunlight. India, China and Ja-pan are investing heavily in space based technologies right now.
7. Conclusions The performance analysis of a grid connected PV system in Tamilnadu Thiruthani GRT IET has been investi-gated.
The following conclusions can be drawn: - Average 6 month PV plant energy output in 2015 is 64,182.86 KWh. - Average 6 month performance ratio of the plant is 83.2%. - The average 6 month capacity factor is 18.26%. - Energy saving per year = 204,400 KWh. - Payback period in years = 9 years 4 months. - Cost reduction per year =17,37,400 INR = 26,197.30 USD.
Total CO2 Reductions per year = 102,200 tons. CO2 shows the solar PV system installed in GRT IET Campus is eco-friendly and good for environment.
References [1] (2010) Jawaharlal Nehru National Solar Mission. Guidelines for Selection of New Grid Connected Solar Power
Projects. www.mnre.gov.in [2] Ministry of Power, Government of India, Central Electricity Authority.
http://www.cea.nic.in/reports/monthly/xecutive_rep/Nov14.pdf [3] Besarati, S.M., Padilla, R.V., Goswami, D.Y. and Stefanakos, E. (2013) The Potential of Harnessing Solar Radiation in
Iran: Generating Solar Maps and Viability Study of PV Power Plants. Renewable Energy, 53, 193-199. http://dx.doi.org/10.1016/j.renene.2012.11.012
[4] (1998) Photovoltaic System Performance Monitoring—Guidelines for Measurement, Data Exchange and Analysis. IEC Standard 61724. Geneva.
[5] Sharma, V. and Chandel, S.S. (2013) Performance Analysis of a 190 kWp Grid Interactive Solar Photovoltaic Power Plant India. Energy, 55, 476-485. http://dx.doi.org/10.1016/j.energy.2013.03.075
[6] Decker, B. and Jahn, U. (1997) Performance of 170 Grid Connected PV Plants in Northern Germany—Analysis of Yields and Optimization Potentials. Solar Energy, 59, 127-133. http://dx.doi.org/10.1016/S0038-092X(96)00132-6
[7] Sidrach-de-Cardona, M. and Lopez, L.M. (1999) Performance Analysis of a Grid-Connected Photovoltaic System. Energy, 24, 93-102. http://dx.doi.org/10.1016/S0360-5442(98)00084-X
[8] Development of Financial Model of Bankable Feasibility Analysis of a 1 MW Rooftop Solar PV Project in India. A Project Report by Abhishek Chaudary-Under NPTI (National Power Training Institute)-for Lahmeyer International.