Performance criteria for EQA schemes need for harmonization - Jones.pdf · 01/12/14 1 Performance...
34
01/12/14 1 Performance criteria for EQA Performance criteria for EQA schemes schemes – need for need for harmonization harmonization Graham Jones Department of Chemical Pathology St Vincent’s Hospital, Sydney Milan November 2014 The Role of External Quality Assurance The Role of External Quality Assurance • Confirm assay performance • Identify poor assay performance – Confirm correction of poor performance • Main Issues – Accuracy (precision + bias) – Precision – Bias (Compared to what?) • Other: – Analytical specificity, interferences – Reporting: units, reference intervals – Interpretation: case comments
Transcript of Performance criteria for EQA schemes need for harmonization - Jones.pdf · 01/12/14 1 Performance...

01/12/14
1
Performance criteria for EQA Performance criteria for EQA
schemes schemes –– need forneed for
harmonizationharmonization
Graham Jones
Department of Chemical Pathology
St Vincent’s Hospital, Sydney
Milan November 2014
The Role of External Quality AssuranceThe Role of External Quality Assurance
• Confirm assay performance
• Identify poor assay performance
– Confirm correction of poor performance
• Main Issues
– Accuracy (precision + bias)
– Precision
– Bias (Compared to what?)
• Other:
– Analytical specificity, interferences
– Reporting: units, reference intervals
– Interpretation: case comments
01/12/14
2
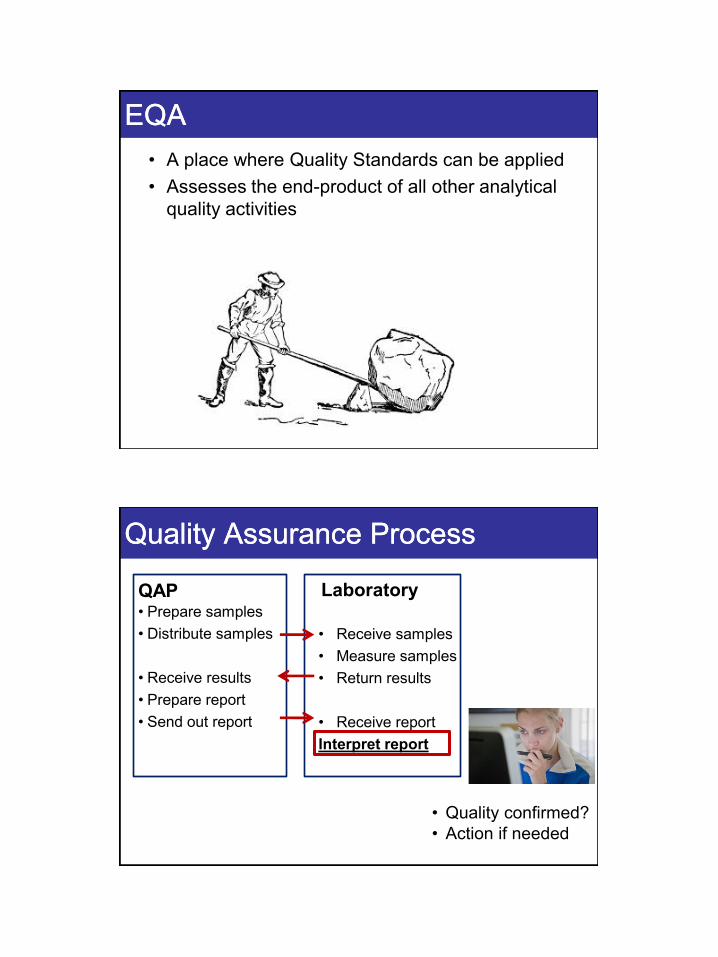
EQAEQA
• A place where Quality Standards can be applied
• Assesses the end-product of all other analytical
quality activities
Quality Assurance ProcessQuality Assurance Process
QAP • Prepare samples
• Distribute samples
• Receive results
• Prepare report
• Send out report
Laboratory
• Receive samples
• Measure samples
• Return results
• Receive report
Interpret report
• Quality confirmed?
• Action if needed
01/12/14
3
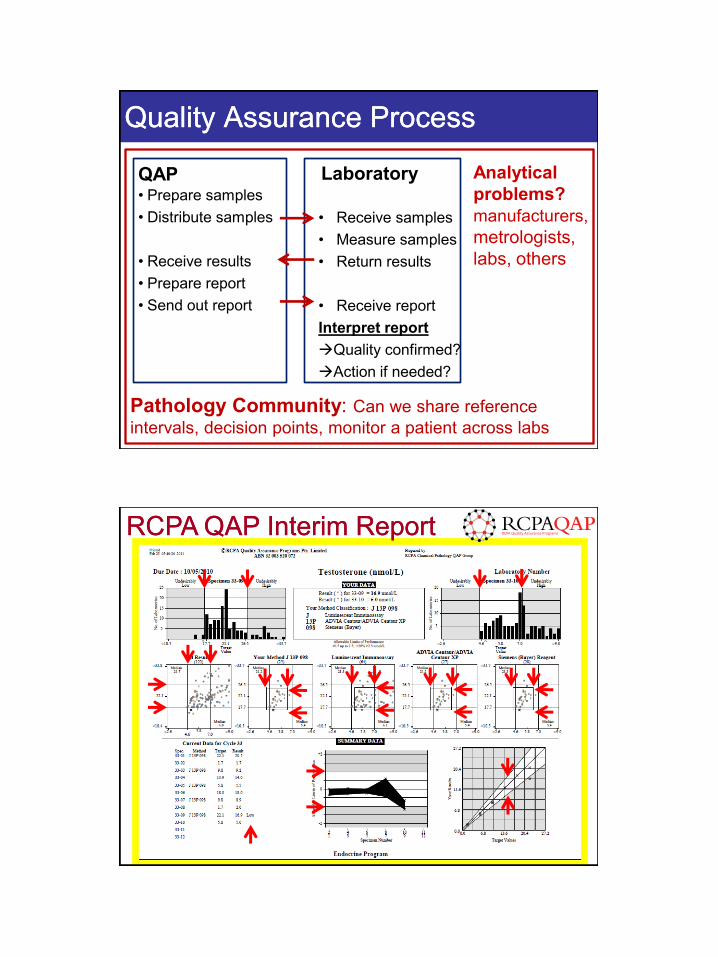
Quality Assurance ProcessQuality Assurance Process
QAP • Prepare samples
• Distribute samples
• Receive results
• Prepare report
• Send out report
Laboratory
• Receive samples
• Measure samples
• Return results
• Receive report
Interpret report
Quality confirmed?
Action if needed?
Pathology Community: Can we share reference
intervals, decision points, monitor a patient across labs
Analytical
problems?
manufacturers,
metrologists,
labs, others
RCPA QAP Interim ReportRCPA QAP Interim Report

01/12/14
4
EQA ReportsEQA Reports
Interim Report
• After each set of measurements
• Small number of samples (1,2,5)
• May include previous data
• Often analysed as single results
End-of-Cycle / Summary Report
• summary of a period
• Larger number of samples
• Statistical analysis (bias, precision)
based on multiple results
Interpreting Interpreting SingleSingle RResultsesults
• A single result includes effects of both bias and
imprecision
• Bias and imprecision effects cannot be separated
• Quality standards assess “total error”
• Applies to multiple samples, if they are analysed
separately
• Most Interim Reports / some summary reports

01/12/14
5
Interpreting Interpreting MultipleMultiple RResultsesults
• From multiple results: bias and imprecision
can be separately identified
• Based in summary statistics
• More results better information
• Only applies to multiple samples
• Most Summary Reports / some interim reports
Interpreting Interpreting SingleSingle RResultsesults
• My focus today is on Quality Standards for
interpreting Single results
• Bias and imprecision assessment are vital, but
take time to gather quality data
• Bias and imprecision also need quality standards
01/12/14
6
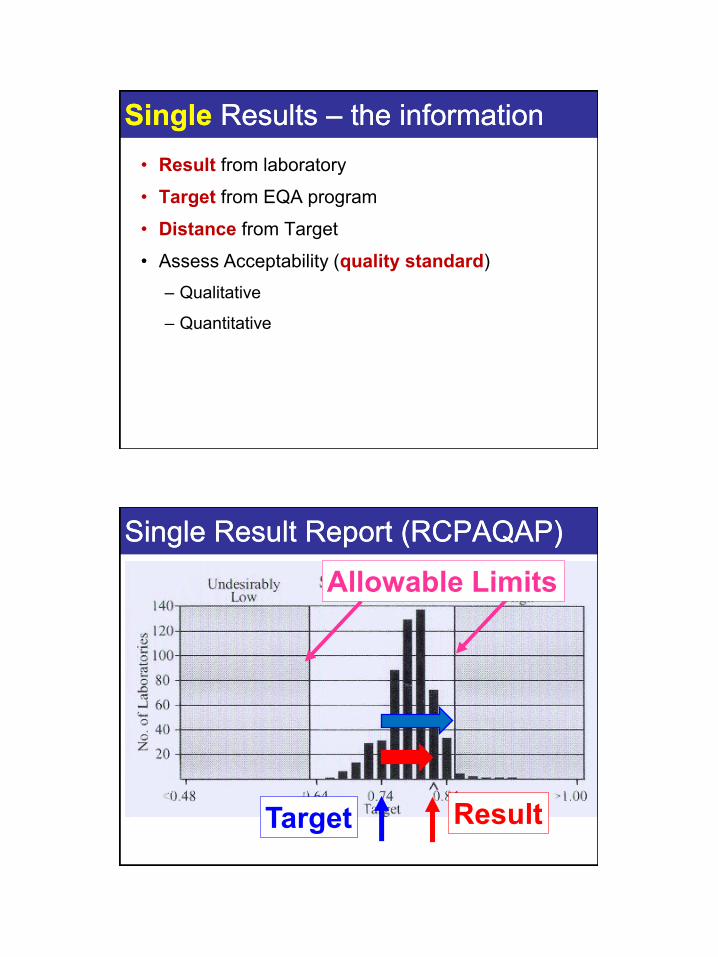
SingleSingle Results Results –– the informationthe information
• Result from laboratory
• Target from EQA program
• Distance from Target
• Assess Acceptability (quality standard)
– Qualitative
– Quantitative
Single Result Report (RCPAQAP)Single Result Report (RCPAQAP)
Result Target
Allowable Limits

01/12/14
7
Interpret ReportInterpret Report
• “All aspects of pathology are determined by
comparison” (Per Hyltoft Petersen, Sydney, 2005)
• In this setting: Compare with a Quality Standard
TargetsTargets
• These indicate the “correct” result
• Two main types
– Overall analyte target
• Reference Method / Material
• Median
• Assumes commutability of material in
methods
– Laboratory-specific target
• Based on method / instrument / reagents etc
01/12/14
8
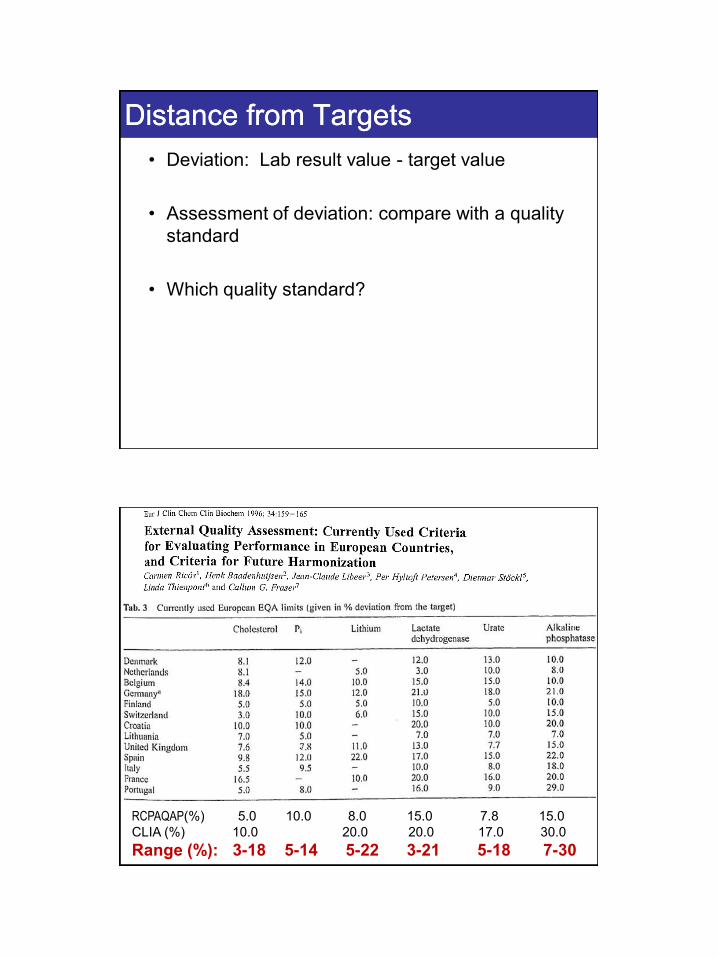
Distance from TargetsDistance from Targets
• Deviation: Lab result value - target value
• Assessment of deviation: compare with a quality
standard
• Which quality standard?
RCPAQAP(%) 5.0 10.0 8.0 15.0 7.8 15.0
CLIA (%) 10.0 20.0 20.0 17.0 30.0
Range (%): 3-18 5-14 5-22 3-21 5-18 7-30

01/12/14
9
http://www.datainnovations.co
m/products/ep-
evaluator/allowable-total-
error-table
http://www.dgrhoads.com/db20
04/ae2004.php?B1=Chemistry
+A-
C&find=&start=1&NOLINKS=
www.rhodes.com
Quality Limits Quality Limits -- the way forwardthe way forward
• Framework – What are we trying to find out with
the limits?
• What Limits?
• In Practice?

01/12/14
10
FrameworkFramework
• What are we trying to find out with the limits?
EQA Quality StandardsEQA Quality Standards
What type of standard?
• Minimum standard
– All should pass (except bad labs)
• Expected standard
– Most should pass
– Aim to improve those which don’t
• Aspirational standard
– Some will not pass
– May need better methods
Tighter
Standard
Looser
Standard

01/12/14
11
EQA Quality StandardsEQA Quality Standards
Response to failures?
• Affects registration
– USA (CLIA), Germany (RiliBAK)
• Requires mandatory investigation
– Canada?
• Should be followed up – effort
depends on severity
– Australia (NATA RCPA)
• Some failures are expected
Tighter
Standard
Looser
Standard
Accuracy Quality StandardsAccuracy Quality Standards
What does it mean to meet the
standard?
• There may still be benefits from
assay improvement
• Most assays are satisfactory
• No further effort is needed on this
analyte
Tighter
Standard
Looser
Standard
01/12/14
12
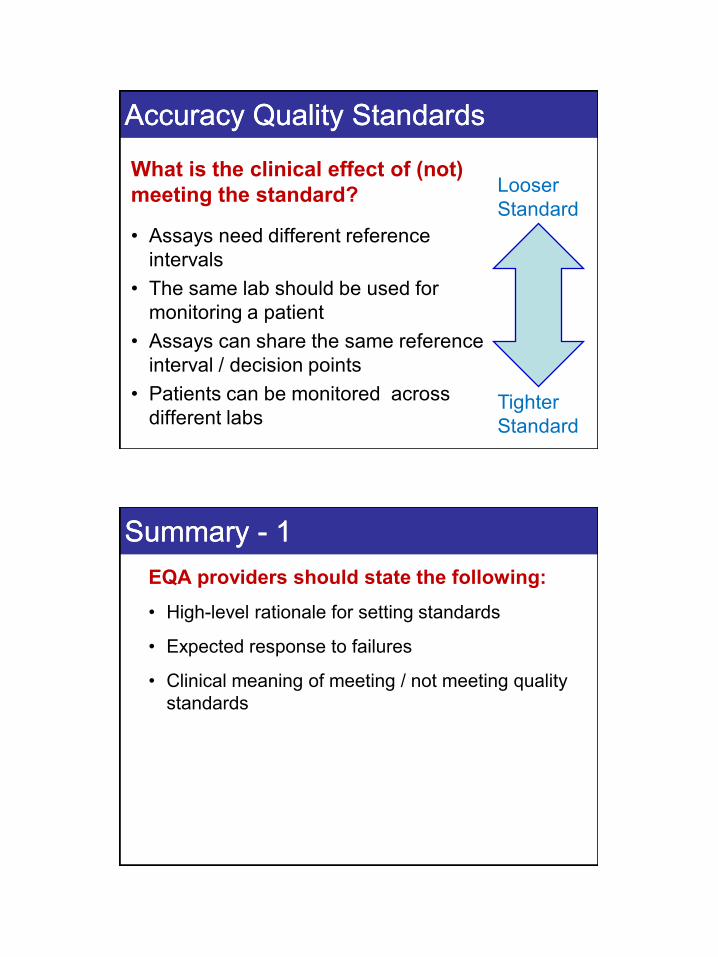
Accuracy Quality StandardsAccuracy Quality Standards
What is the clinical effect of (not)
meeting the standard?
• Assays need different reference
intervals
• The same lab should be used for
monitoring a patient
• Assays can share the same reference
interval / decision points
• Patients can be monitored across
different labs Tighter
Standard
Looser
Standard
Summary Summary -- 11
EQA providers should state the following:
• High-level rationale for setting standards
• Expected response to failures
• Clinical meaning of meeting / not meeting quality
standards

01/12/14
13
What Limits?What Limits?
• How do we set the limits?
Now exists an internationally agreed hierarchy of preferred
methods for establishing performance goals

01/12/14
14
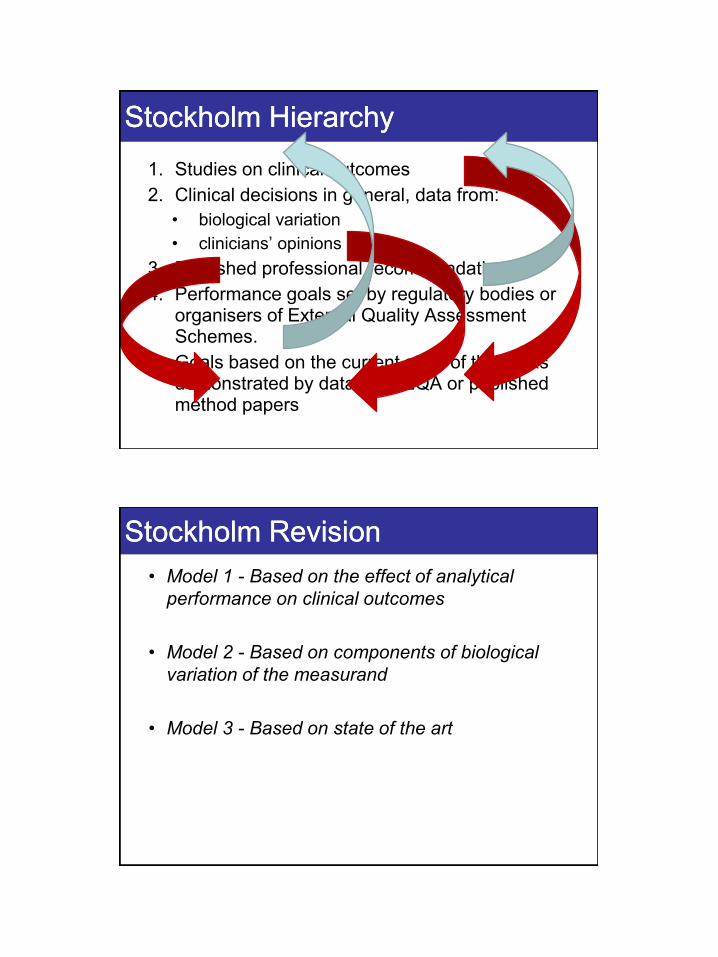
Stockholm HierarchyStockholm Hierarchy
1. Studies on clinical outcomes
2. Clinical decisions in general, data from:
• biological variation
• clinicians’ opinions
3. Published professional recommendations
4. Performance goals set by regulatory bodies or organisers of External Quality Assessment Schemes.
5. Goals based on the current state of the art as demonstrated by data from EQA or published method papers
An old saying:An old saying:
• If you have seen one implementation of the
Stockholm Hierarchy…
… you have have seen one implementation of
the Stockholm Hierarchy
01/12/14
15
Stockholm HierarchyStockholm Hierarchy
1. Studies on clinical outcomes
2. Clinical decisions in general, data from:
• biological variation
• clinicians’ opinions
3. Published professional recommendations
4. Performance goals set by regulatory bodies or organisers of External Quality Assessment Schemes.
5. Goals based on the current state of the art as demonstrated by data from EQA or published method papers
Stockholm RevisionStockholm Revision
• Model 1 - Based on the effect of analytical
performance on clinical outcomes
• Model 2 - Based on components of biological
variation of the measurand
• Model 3 - Based on state of the art
01/12/14
16
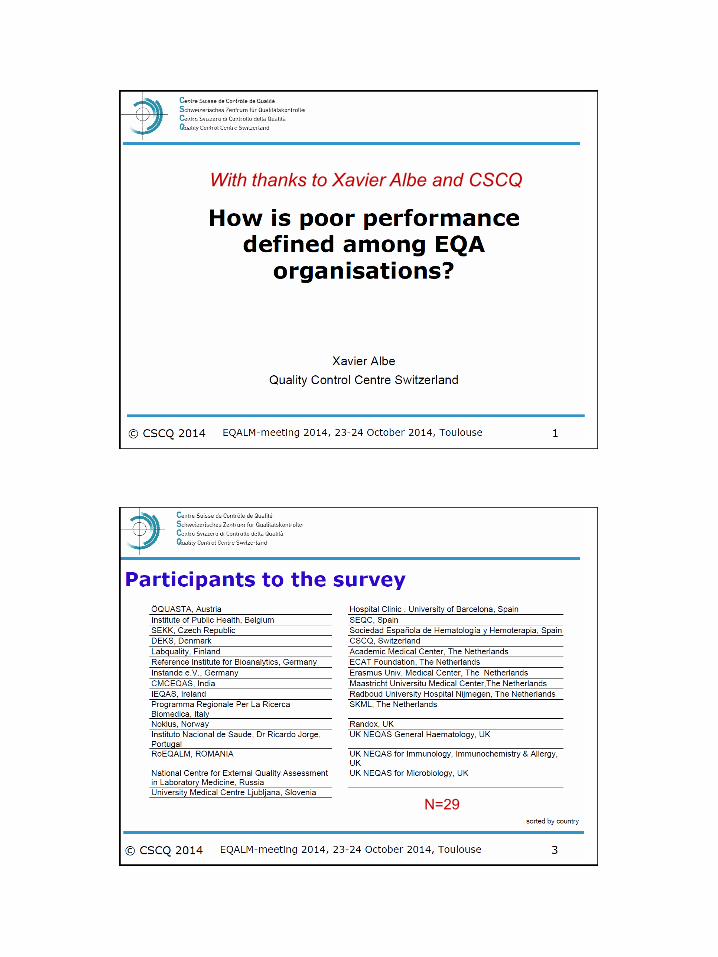
With thanks to Xavier Albe and CSCQ
N=29
01/12/14
17
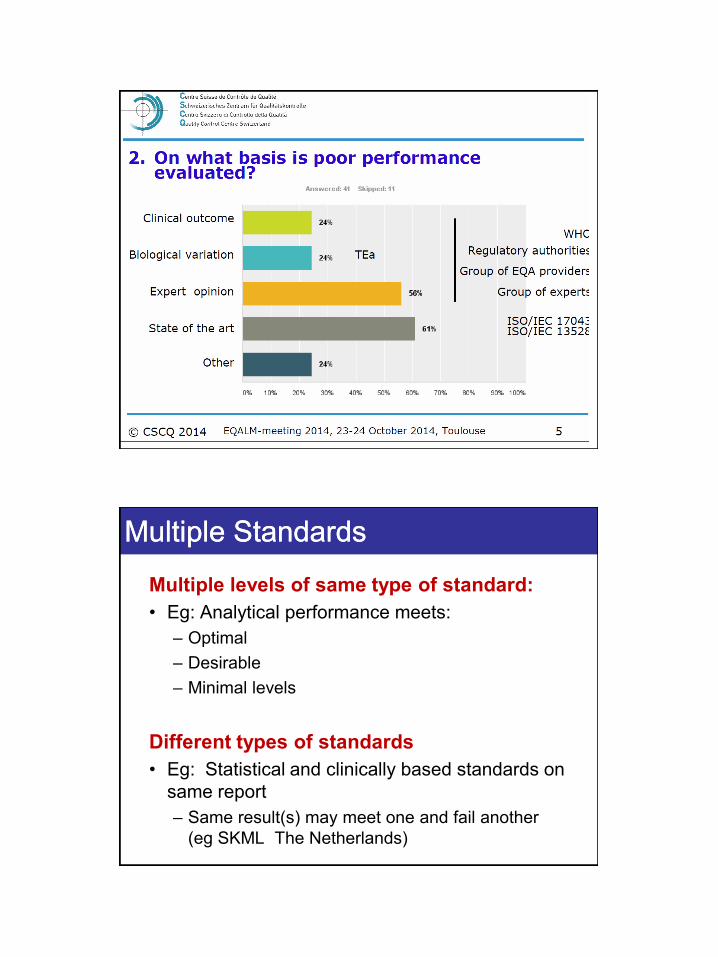
Multiple StandardsMultiple Standards
Multiple levels of same type of standard:
• Eg: Analytical performance meets:
– Optimal
– Desirable
– Minimal levels
Different types of standards
• Eg: Statistical and clinically based standards on
same report
– Same result(s) may meet one and fail another
(eg SKML The Netherlands)

01/12/14
18
Applying the Stockholm CriteriaApplying the Stockholm Criteria
Done by People in Organisations
• Using background principles
• Using information
• Common Information (eg Ricos Database)
• Specific information (local EQA data*)
Reference Interval VariationReference Interval Variation
• EVEN given the same data, laboratory
scientists WILL interpret it differently.
• Add in variability of data
reviewed
• Variation in Reference intervals:
– Always seen
– AN EXPECTED OUTCOME!

01/12/14
19
Level 5 Level 5 –– State of the ArtState of the Art
Statistical analysis (State of the art)Statistical analysis (State of the art)
• Commonly Used
• Compare results against other submitted results
• Target: Usually middle of group
• Limits: typically +/- 2 or 3 SD
• Severity assessment: z-score (or similar)

01/12/14
20
Level 5 - State of the Art
Statistical AnalysisStatistical Analysis
• Compares lab with other similar labs
• Alerts to possible analytical / work
practice problem.
• (clinical meaning uncertain)

01/12/14
21
Statistical Issues Statistical Issues -- StandardisationStandardisation
• Outlier exclusion
• Use with other limits
• Limit at 2SD, 3SD or other
• Small method groups
• Identification of method groups
Higher Level Quality Standards (1Higher Level Quality Standards (1--4)4)
• How are they set?
• Using Stockholm Criteria
• Different levels for different analytes
• Using one level of the Stockholm criteria
• (in practice: Biological Variation)

01/12/14
22
Revision of ALP Revision of ALP -- RCPAQAPRCPAQAP
• Use highest suitable level on the hierarchy
(in practice – biological variation)
• Do not set unachievable goals
(state of the art)
• Aim to improve laboratory performance
Clinical Biochemist Reviews 2012;33:133-9

01/12/14
23
RCPA ALPRCPA ALP
We are producing:
• An agreed definition
• An agreed set of criteria
• An agreed process
• Testing of proposed changes
To produce defensible, robust quality standards
Revision of ALPRevision of ALP
ALP are applied to Total Error
Used in interim reports
Single results include bias and imprecision
Will use categories of CV:
1,2,3,4,5,6,8,10,12,15,20,25,30%
Round to nearest category
Change between absolute and percentage
based on precision profile

01/12/14
24
ProcessProcess
• Aim to use tightest limits possible
• Within limitations of State of the art
(can be achieved by ~80% of labs)
• Analyte-specific criteria
Ranking of criteria:
• Based on within-subject biological variation
– Optimal, Desirable, Minimal
• Based on within and between subject BV
– Optimal, Desirable, Minimal
CRITERIA ANALYTE: Aspartate Transaminase
Current ALP +/- 8 to 60 , 15% Reporting Interval 1 (22-388)
Reference Interval 10-40 IU/L Decision Limit 40 IU/L
Discuss:
Clinical Need Data Used both for diagnosis and monitoring.
Discus. No relevance to lower limit
Biological Variation Data CVi = 11.9%, CVg = 17.9%
Discus. Desirable imprecision is 6.0% and optimal imprecision is 3.0%
Profession Defined Data Professional median 15%
Discus.
Current Performance Data
Discus. Labs can achieve
Other (eg existing practice
or Publications)
Data
Discus.
CONCLUSIONS ALP: +/- 5 to 40, 12% (desirable imprecision)
Discus.

01/12/14
25
Meaning of ALPMeaning of ALP
Basis
“Total Error” – Can share reference interval
“Imprecision” – Can Monitor patient across labs Level
“Optimal” – no need to improve
“Desirable” – satisfactory
“Minimal” – just satisfactory
DefinitionDefinition
• The Allowable Limit of Performance (ALP) is the
analytical range around a central value
• It provides a simple tool to allow a rapid,
standardised assessment of QAP results in both
numerical and graphical report formats.
• A result outside the ALP should alert the
laboratory that that their assay may produce
results that are at risk of detrimentally affecting
clinical decision making.
01/12/14
26
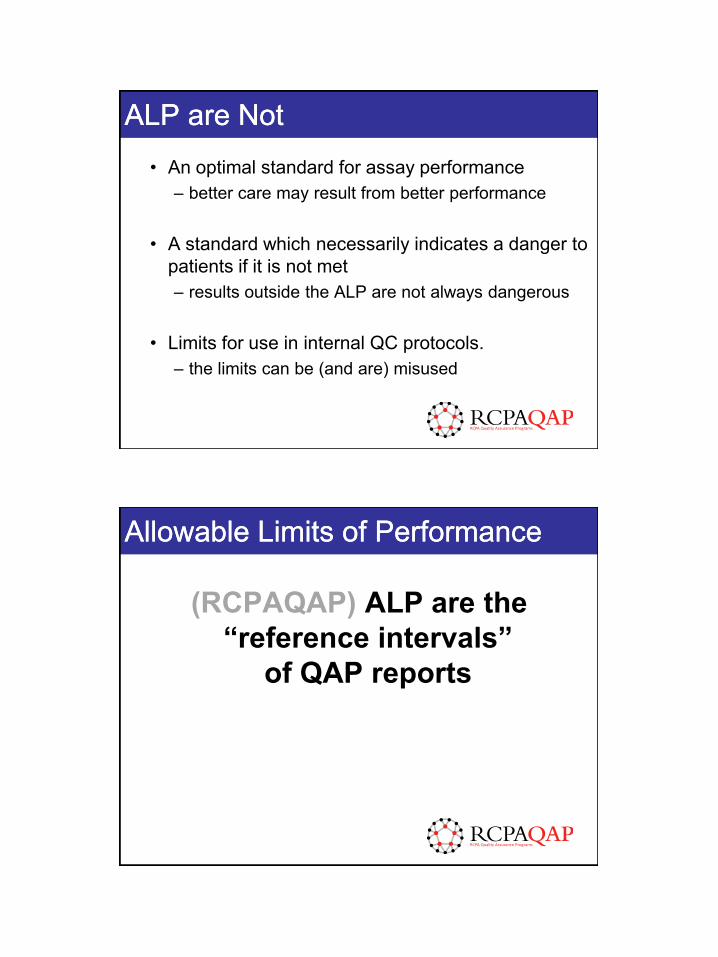
ALP are NotALP are Not
• An optimal standard for assay performance
– better care may result from better performance
• A standard which necessarily indicates a danger to
patients if it is not met
– results outside the ALP are not always dangerous
• Limits for use in internal QC protocols.
– the limits can be (and are) misused
Allowable Limits of PerformanceAllowable Limits of Performance
(RCPAQAP) ALP are the
“reference intervals”
of QAP reports

01/12/14
27
Application Application -- Common Reference IntervalsCommon Reference Intervals
• AACB, RCPA
Creatinine
40
60
80
100
120
140
160
40 60 80 100 120 140 160
Average (umol/L)
Ob
tain
ed
(u
mo
l/L
) ADVIA 2400
Architect
AU2700
DxC
Integra
Modular
RxL
Vitros
+/- 5 umol/L (minimal bias criteria)
Creatinine - Australia
2011 survey, 7 methods, 21 labs
Thanks to Gus Koerbin and AACB Harmonisation Group

01/12/14
28
ApplicationApplication
• Using QAP limits for quality planning
• Calculate sigma value and plan QC
• Recently reviewed “QC Update”
September 2014 AAAB Adelaide
(Thanks to BioRad)
• Some limits too tight for this process

01/12/14
29
Other ProgramsOther Programs
SKML SKML –– The NetherlandsThe Netherlands
• Statistical
• Total Error
• Graphical + scoring
• Concentration
dependent

01/12/14
30
UK - 2010
Lab Lab v Industryv Industry
01/12/14
31
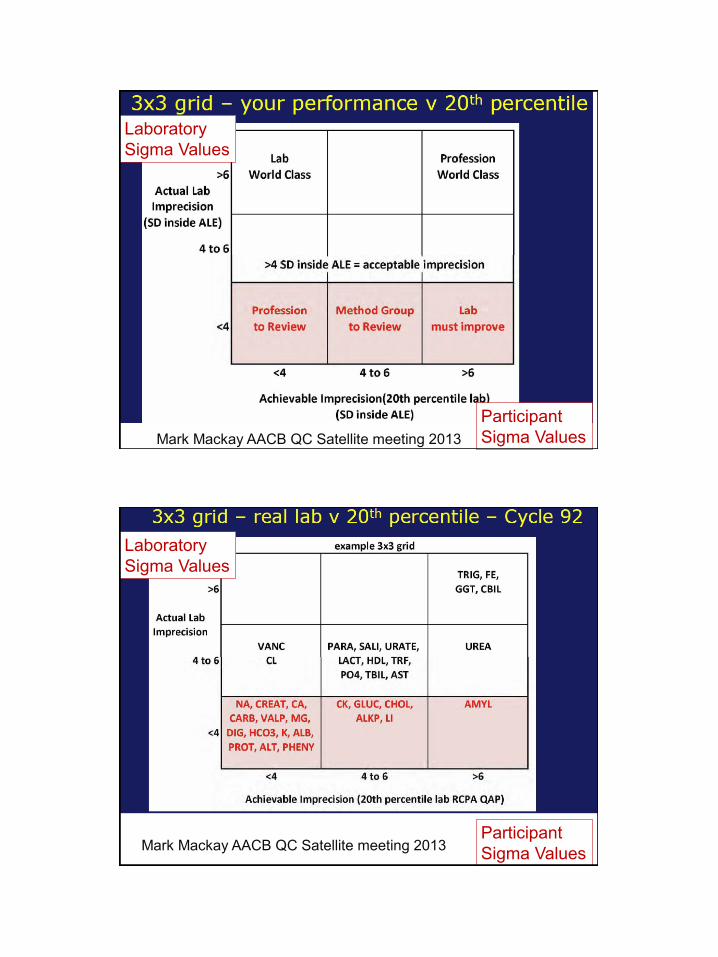
Mark Mackay AACB QC Satellite meeting 2013
Laboratory
Sigma Values
Participant
Sigma Values
Mark Mackay AACB QC Satellite meeting 2013
Laboratory
Sigma Values
Participant
Sigma Values
01/12/14
32
0
5
10
15
20
25
30
0 5 10 15 20 25 30
CVwi Westgard (%)
CV
wi
Syd
Path
(%
)
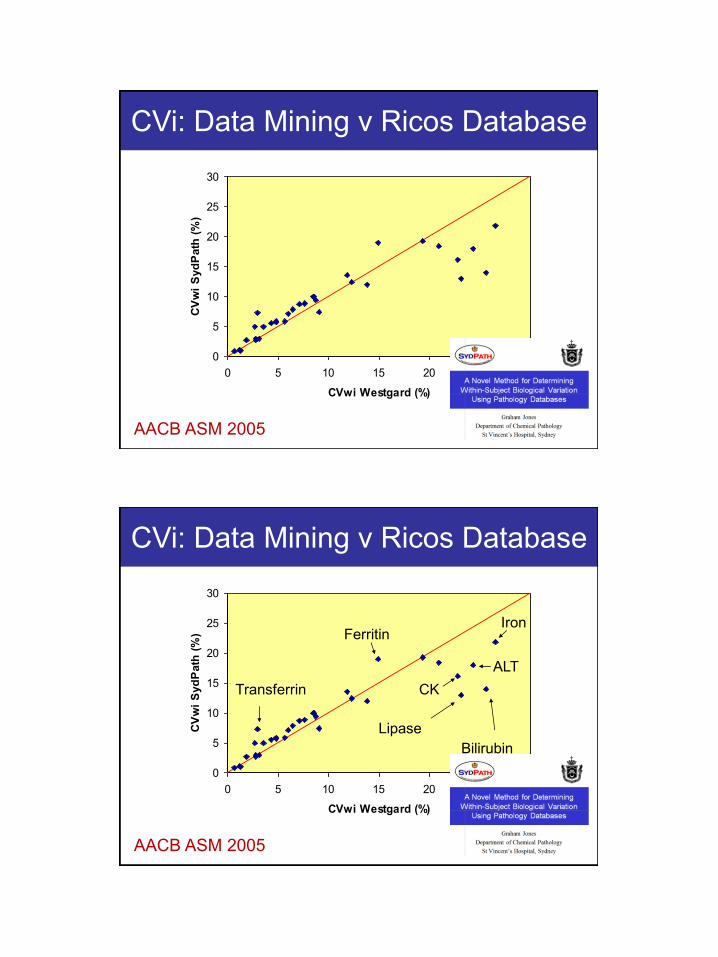
CVi: Data Mining v Ricos Database
AACB ASM 2005
0
5
10
15
20
25
30
0 5 10 15 20 25 30
CVwi Westgard (%)
CV
wi
Syd
Path
(%
)
Transferrin
Bilirubin
Lipase
ALT
Iron
CK
Ferritin
CVi: Data Mining v Ricos Database
AACB ASM 2005
01/12/14
33
ConclusionsConclusions
• Harmonised EQA Quality Standards?
• No (or at least not yet)
• Will only happen with collaborative effort
Harmonised quality standardsHarmonised quality standards
All EQA programs should:
• State the nature of the standards
• State the expected response to standards
• State how they were determined
• State what the effect of compliance means
EQA programs may
• Provide more than one type of standard
• Provide more than one level of standard of the
same type

01/12/14
34
Thank youThank you