
Performance, Cost and Amdahl's Lawadiaz/ArqComp/03-Performance.pdf · Laboratorio de Tecnologías...
37
Laboratorio de Tecnologías de Información Arquitectura de Computadoras Performance- 1 Performance, Cost and Performance, Cost and Amdahl Amdahl ’ ’ s Law s Law Arquitectura de Computadoras Arquitectura de Computadoras Arturo D Arturo D í í az P az P é é rez rez Centro de Investigaci Centro de Investigaci ó ó n y de Estudios Avanzados del IPN n y de Estudios Avanzados del IPN Laboratorio de Tecnolog Laboratorio de Tecnolog í í as de Informaci as de Informaci ó ó n n [email protected] [email protected]
Transcript of Performance, Cost and Amdahl's Lawadiaz/ArqComp/03-Performance.pdf · Laboratorio de Tecnologías...

Laboratorio deTecnologías de Información
Arquitectura de Computadoras Performance- 1
Performance, Cost andPerformance, Cost and AmdahlAmdahl’’s Laws Law
Arquitectura de ComputadorasArquitectura de ComputadorasArturo DArturo Dííaz Paz Péérezrez
Centro de InvestigaciCentro de Investigacióón y de Estudios Avanzados del IPNn y de Estudios Avanzados del IPNLaboratorio de TecnologLaboratorio de Tecnologíías de Informacias de Informacióónn
[email protected]@cinvestav.mx

Laboratorio deTecnologías de Información
Arquitectura de Computadoras Performance- 2
PerformancePerformance
♦
Purchasing perspective ■
given a collection of machines, which has the
» best performance ?» least cost ?» best performance / cost ?
♦
Design perspective■
faced with design options, which has the
» best performance improvement ?» least cost ?» best performance / cost ?
♦
Both require■
basis for comparison
■
metric for evaluation♦
Our goal is to understand cost & performance implications of architectural choices

Laboratorio deTecnologías de Información
Arquitectura de Computadoras Performance- 3
Two notions of Two notions of ““performanceperformance””
° Time to do the task (Execution Time)–
execution time, response time,
latency
° Tasks per day, hour, week, sec, ns. .. (Performance)–
throughput, bandwidth
Response time and throughput often are in opposition
Plane
Boeing 747
Concorde
Speed
610 mph
1350 mph
DC to Paris
6.5 hours
3 hours
Passengers
470
132
Throughput (pmph)
286,700
178,200
Which has higher performance?

Laboratorio deTecnologías de Información
Arquitectura de Computadoras Performance- 4
What is Performance ?What is Performance ?
♦
KEY: A measure of Speed (Rate)■
Car: miles driven per hour
■
Car wash: cars washed per day■
Auto plant: cars built per year
♦
Two metrics:■
Latency (response or execution time)
» time to start to finish of a task■
Throughput (bandwidth)
» rate of task completion= rate of task initiation= 1 / (time between task completions)
♦
Deterministic vs. average
Laboratorio deTecnologías de Información
Arquitectura de Computadoras Performance- 5
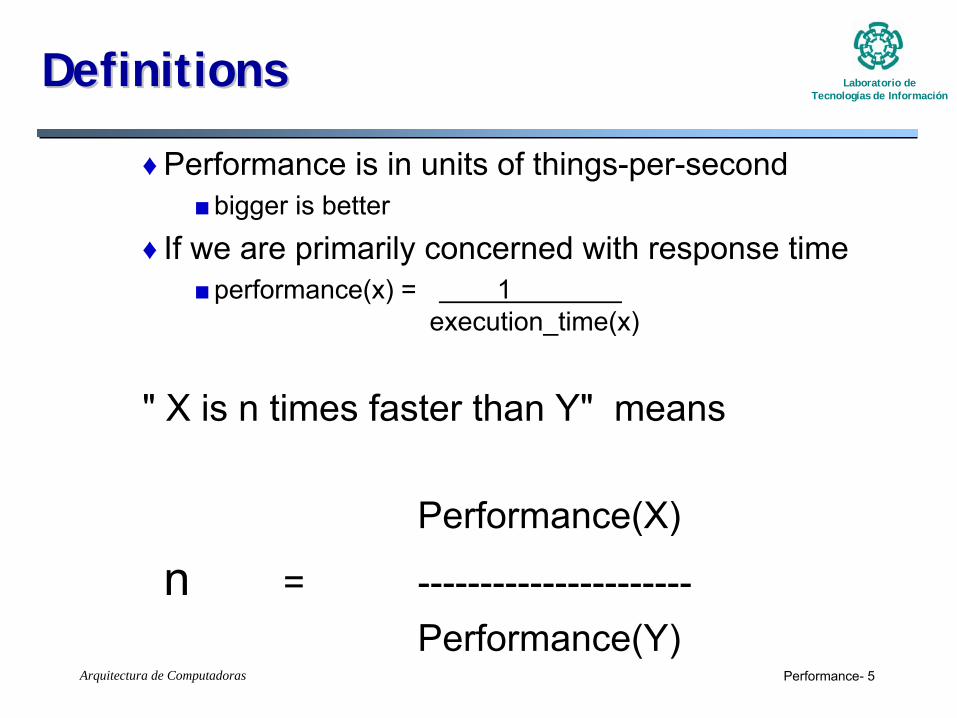
DefinitionsDefinitions
♦
Performance is in units of things-per-second■bigger is better
♦
If we are primarily concerned with response time■performance(x) = 1
execution_time(x)
" X is n times faster than Y" means
Performance(X)
n =
----------------------Performance(Y)

Laboratorio deTecnologías de Información
Arquitectura de Computadoras Performance- 6
ExampleExample
♦
Time of Concorde vs. Boeing 747?Concord is 1350 mph / 610 mph = 2.2 times faster
= 6.5 hours / 3 hours
♦
Throughput of Concorde vs. Boeing 747 ?Concord is 178,200 pmph
/ 286,700 pmph
= 0.62 “times faster”
Boeing is 286,700 pmph
/ 178,200 pmph
= 1.60 “times faster”
♦
Boeing is 1.6 times (“60%”) faster in terms of throughput♦
Concord is 2.2 times (“120%”) faster in terms of flying time
We will focus primarily on execution time for a single jobLots of instructions in a program => Instruction throughput important!

Laboratorio deTecnologías de Información
Arquitectura de Computadoras Performance- 7
RelativeRelative PerformancePerformance
♦
Definition: X is
n % faster
than
Y if
♦
Example: X = 1 minute, Y = 2 minutes
Thus, X is
100 % faster
than
Y♦
Example: Car
wash
that
starts
one
car
per minute and
holds
four
cars.■
Latency
= four
minutes per car
■
Throughput
= one
car
per minute■
Throughput
> 1/Latency
due
to
overlap
■
Key
idea: pipelining
execution rateexecution rate
execution timeexecution time
X
Y
Y
X= = +1
100n
2 minute1 minute = +1 100
100

Laboratorio deTecnologías de Información
Arquitectura de Computadoras Performance- 8
Basis of EvaluationBasis of Evaluation
Actual Target Workload
Full Application Benchmarks
Small “Kernel”
Benchmarks
Microbenchmarks
Pros Cons
• representative• very specific• non-portable• difficult to run, ormeasure• hard to identify cause
• portable• widely used•
improvements
useful in reality
•
easy to run, early in design cycle
•
identify peak capability and potential bottlenecks
•less representative
• easy to “fool”
•
“peak”
may be a long way from application performance
Laboratorio deTecnologías de Información
Arquitectura de Computadoras Performance- 9
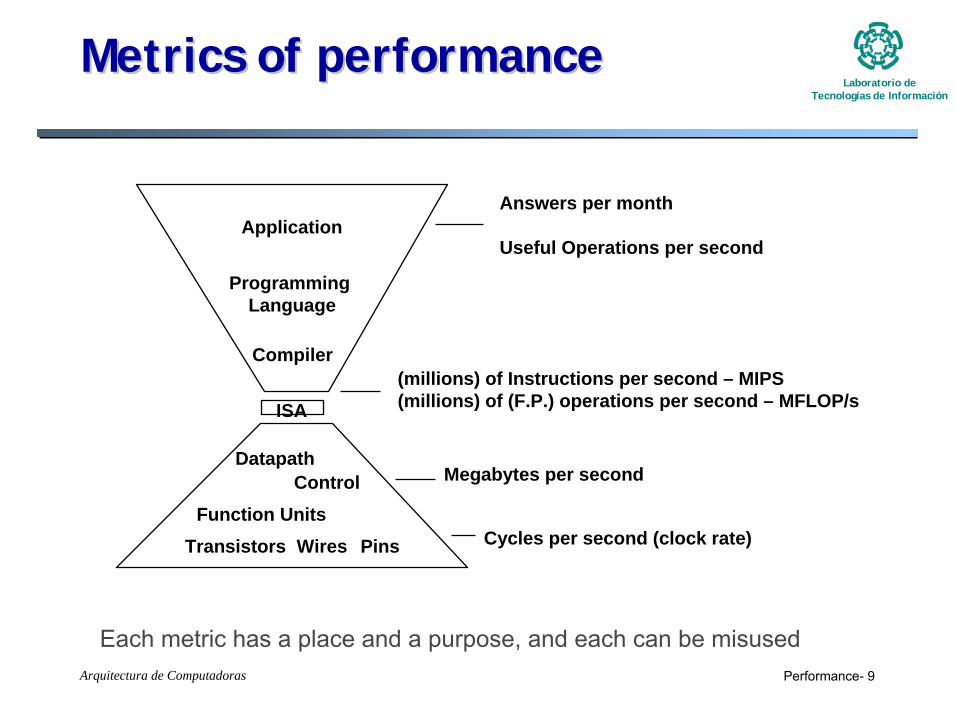
Metrics of performanceMetrics of performance
Compiler
Programming Language
Application
DatapathControl
Transistors Wires Pins
ISA
Function Units
(millions) of Instructions per second – MIPS(millions) of (F.P.) operations per second – MFLOP/s
Cycles per second (clock rate)
Megabytes per second
Answers per month
Useful Operations per second
Each metric has a place and a purpose, and each can be misused

Laboratorio deTecnologías de Información
Arquitectura de Computadoras Performance- 10
Aspects of CPU PerformanceAspects of CPU Performance
CPU time = Seconds = Instructions x Cycles x SecondsProgram Program Instruction Cycle
CPU time = Seconds = Instructions x Cycles x SecondsProgram Program Instruction Cycle
instr
count
CPI
clock rateProgram
Compiler
Instr. Set
Organization
Technology

Laboratorio deTecnologías de Información
Arquitectura de Computadoras Performance- 11
Aspects of CPU PerformanceAspects of CPU Performance
CPU time = Seconds = Instructions x Cycles x SecondsProgram Program Instruction Cycle
CPU time = Seconds = Instructions x Cycles x SecondsProgram Program Instruction Cycle
instr
count
CPI
clock rateProgram X
Compiler
X
X
Instr. Set
X
X
X
Organization
X
X
Technology
X

Laboratorio deTecnologías de Información
Arquitectura de Computadoras Performance- 12
CPI: CPI: ““Average Average cyclescycles per per instructioninstruction””
♦
CPI = Instruction
Count
/ (CPU Time * Clock
Rate)= Instruction
Count
/ Cycles
♦
CPU Time = Cycle
Time *
♦
CPU Time =
♦
where
♦
Invest resources where time is spent !
CPI Iii
n
i=∑
1*
CPI Fii
n
i=∑
1*
FI
ii=
Instruction Count

Laboratorio deTecnologías de Información
Arquitectura de Computadoras Performance- 13
Controversial Controversial ExampleExample
♦
Some have argued:■
CISC CPU Time = P x 8 x T = 8PT
■
RISC CPU Time = 2P x 2 x T = 4PT■
RISC CPU Time = (CISC CPU Time)/2
♦
DISCLAIMER:■
The truth is much, much more complex
CPU time InstructionProgram
CyclesInstruction
SecondsCycle
= × ×

Laboratorio deTecnologías de Información
Arquitectura de Computadoras Performance- 14
Speedup due to enhancement E:ExTime
w/o E Performance w/ E
Speedup(E) = --------------------
= ---------------------ExTime
w/ E Performance w/o E
Suppose that enhancement E accelerates a fraction F of the task
by a factor S and the remainder of the task is unaffected then,
ExTime(with
E) =
((1-F) + F/S) X ExTime(without
E)
Speedup(with E) =
1 (1-F) + F/S
Amdahl's LawAmdahl's Law

Laboratorio deTecnologías de Información
Arquitectura de Computadoras Performance- 15
AmdahlAmdahl’’ss LawLaw
♦
Let
♦
Consider
an
enhancement
x that
speedups
fraction
fx of
a task
by Sx
♦
Amdahl’s
Law
gives:
Speedupnew rateold rate
old latencynew latency
= =
Speedupold latencynew latency
= [( - old latencyold latency + (f old latency
overall
x
=
+ ×− × ×
11
f ff S
x x
x x
) ]( ) / )
Speedup + (foverall
x=
−1
1( ) / )f Sx x

Laboratorio deTecnologías de Información
Arquitectura de Computadoras Performance- 16
AmdahlAmdahl’’ss LawLaw, , cont.cont.
♦
Example: fx = 95 % and
Sx = 1.10
♦
Example: fx = 5% and
Sx = 10
♦
Example: fx = 5% and
Sx→ ∞
Speedup + ( .overall = −
=1
1 0 95 0 95 1101094
( . ) / . ).
Speedup + ( .overall = −
=1
1 0 0 5 0 05 101047
( . . ) / ).
Speedup + ( .overall = − ∞
=1
1 0 05 0 051052
( . ) / ).

Laboratorio deTecnologías de Información
Arquitectura de Computadoras Performance- 17
AmdahlAmdahl’’ss LawLaw CorollaryCorollary
Since
Sx implies
For
real speedups:
Example:
→ ∞
Speedup + (foverall
x→
− ∞1
1( ) / )f x
Speedupoverall < −1
1( )fx
fx 11( )− fx
1 % 1.012 % 1.025 % 1.05
10 % 1.1120 % 1.2550 % 2.00

Laboratorio deTecnologías de Información
Arquitectura de Computadoras Performance- 18
Standard Standard ExampleExample: Load/Store : Load/Store MachineMachine
♦
Suppose
we
could
make
stores
execute
in 1 cycle, by slowing
down the
cycle
time by 15 %
■
Should
we
make
this
optimization
?
♦
Old
CPI = 0.43 + 0.21 + (0.12 + 0.24)x2 = 1.36♦
New
CPI = 0.43 + 0.21 + 0.12 + 0.24x2 = 1.24
♦
Conclusion: Don’t
make
the
change
Operation Frequency Cycle CountALU Ops 43 % 1Loads 21 % 1Stores 12 % 2Branches 24 % 2
New CPU timeOld CPU time
P New CPI . TP Old CPI T
=× ×× ×
=115
105.

Laboratorio deTecnologías de Información
Arquitectura de Computadoras Performance- 19
Example (RISC processor)Example (RISC processor)
Typical Mix
Base Machine (Reg / Reg)Op Freq Cycles CPI(i) % TimeALU 50% 1 .5 23%Load 20% 5 1.0 45%Store 10% 3 .3 14%Branch 20% 2 .4 18%
2.2
How much faster would the machine be if a better data cachereduce the average load time to 2 cycles?
How does this compare with using branch prediction to shave a cycle off the branch time?
What if two ALU instructions could be executed at once?

Laboratorio deTecnologías de Información
Arquitectura de Computadoras Performance- 20
Evaluating Instruction Sets?Evaluating Instruction Sets?Design-time
metrics:
°
Can it be implemented, in how long, at what cost?
°
Can it be programmed? Ease of compilation?
Static Metrics:
°
How many bytes does the program occupy in memory?
Dynamic Metrics:
°
How many instructions are executed?
°
How many bytes does the processor fetch to execute the program?
°
How many clocks are required per instruction?
°
How "lean" a clock is practical?
Best Metric: Time to execute the program!
NOTE: this depends on instructions set, processor organization, andcompilation techniques.
CPI
Inst. Count Cycle Time
Laboratorio deTecnologías de Información
Arquitectura de Computadoras Performance- 21
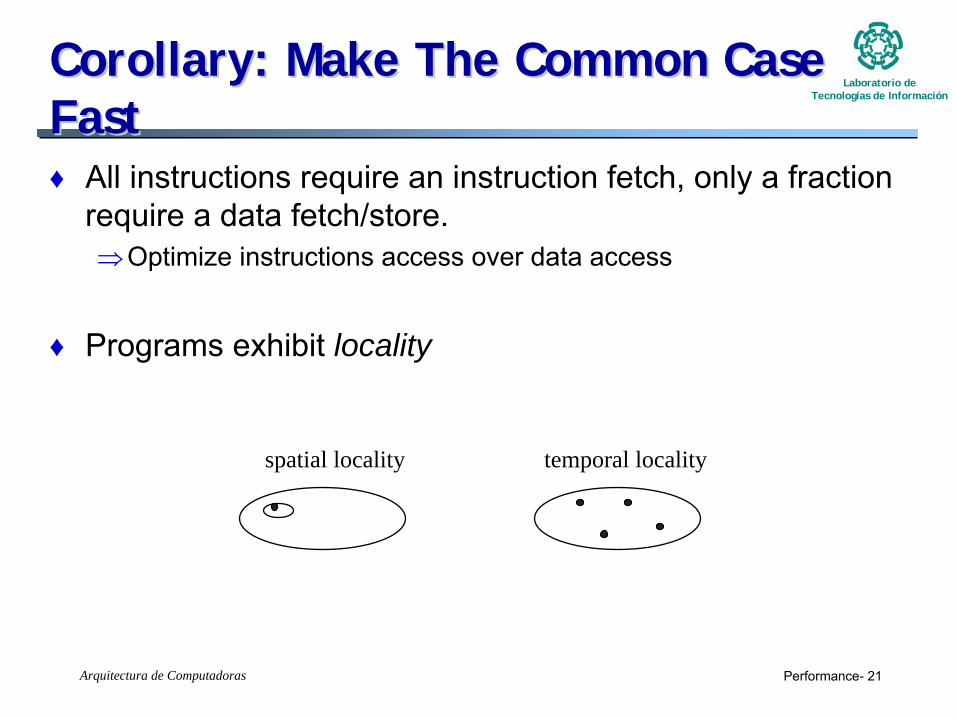
CorollaryCorollary: : MakeMake TheThe CommonCommon Case Case FastFast♦
All
instructions
require
an
instruction
fetch, only
a fraction
require
a data fetch/store.⇒Optimize
instructions
access
over
data access
♦
Programs
exhibit
locality
spatial locality temporal locality

Laboratorio deTecnologías de Información
Arquitectura de Computadoras Performance- 22
CorollaryCorollary: : MakeMake TheThe CommonCommon Case Case FastFast♦
Access to
small
memories
is
faster
⇒provide
a storage hierarchy such
that
the
most
frequent
accesses are the
smallest
(closest) memories
Memory Disk/Tape
CacheRegs.
Laboratorio deTecnologías de Información
Arquitectura de Computadoras Performance- 23
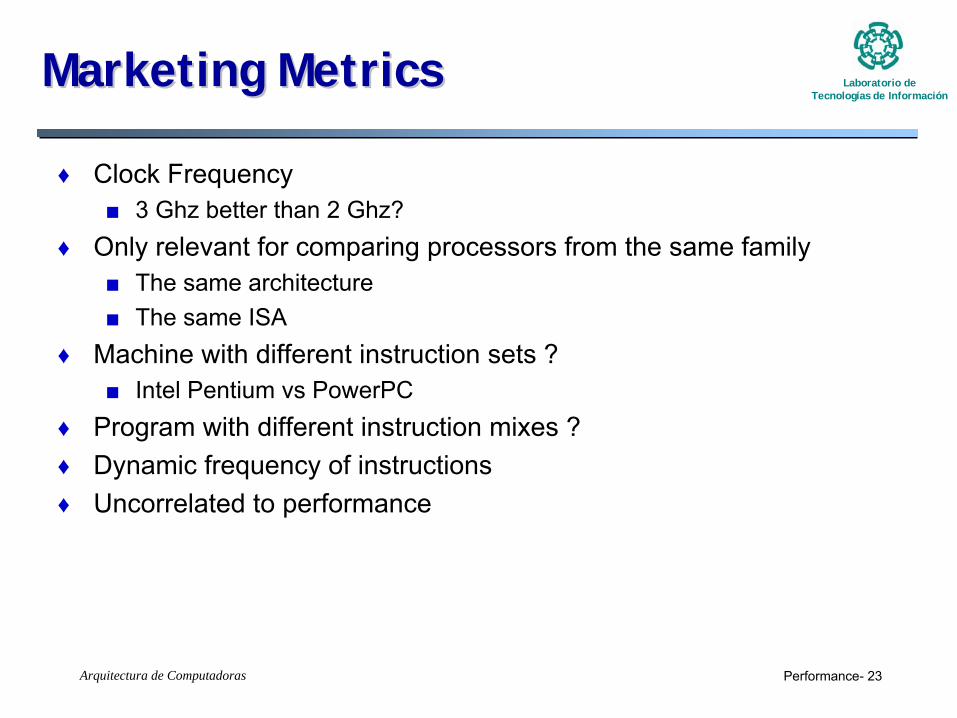
Marketing Marketing MetricsMetrics
♦
Clock Frequency■
3 Ghz better than 2 Ghz?
♦
Only relevant for comparing processors from the same family■
The same architecture
■
The same ISA♦
Machine with different instruction sets ?■
Intel Pentium vs
PowerPC
♦
Program with different instruction mixes ?♦
Dynamic frequency of instructions
♦
Uncorrelated to performance
Laboratorio deTecnologías de Información
Arquitectura de Computadoras Performance- 24
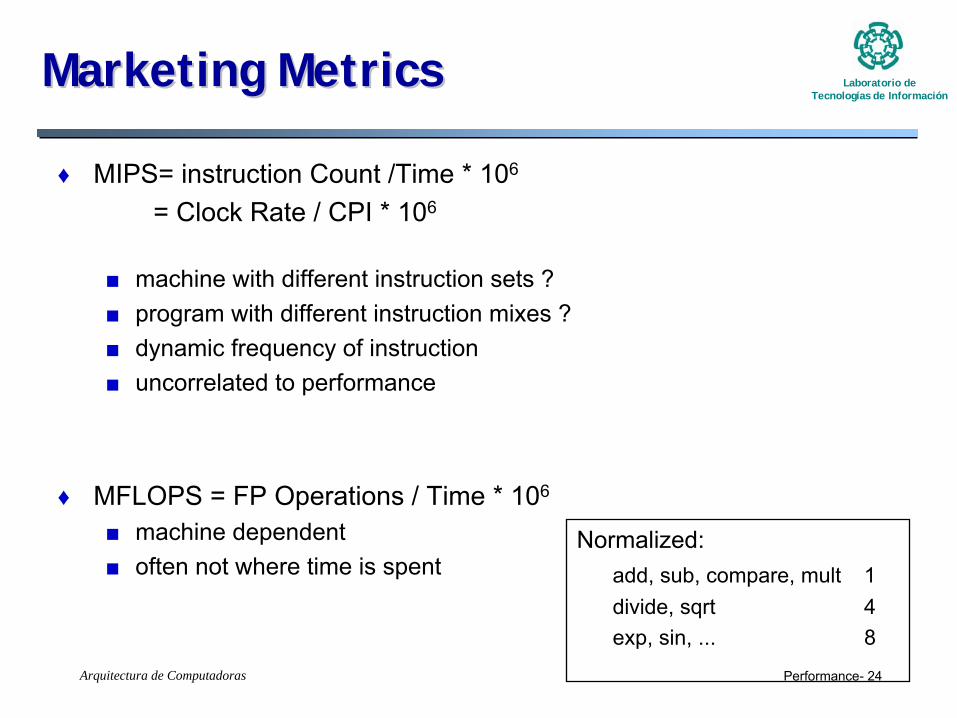
Marketing Marketing MetricsMetrics
♦
MIPS= instruction
Count
/Time * 106
= Clock
Rate
/ CPI * 106
■
machine
with
different
instruction
sets
?■
program
with
different
instruction
mixes
?
■
dynamic
frequency
of
instruction■
uncorrelated
to
performance
♦
MFLOPS = FP Operations
/ Time * 106
■
machine
dependent■
often
not
where
time is
spent
Normalized:add, sub, compare, mult
1divide, sqrt
4exp, sin, ...
8

Laboratorio deTecnologías de Información
Arquitectura de Computadoras Performance- 25
NormalizedNormalized MFLOPSMFLOPS
♦
Not
all
machines implement
the
same
FP operations■
Cray-1 does
not
implement
Divide
■
Motorola
68882 does
SQRT, SIN, and
COS
♦
Not
all
FP operations
are the
same■
ADD is
much
faster
than
Divide
♦
Normalized
MFLOPS■
Assign
a “canonical number
of
FP operations”
to
a
programNormalized MFLOPS =
Canonical FP operationstime 106×

Laboratorio deTecnologías de Información
Arquitectura de Computadoras Performance- 26
Metrics of performanceMetrics of performance
Compiler
Programming Language
Application
DatapathControl
Transistors Wires Pins
ISA
Function Units
(millions) of Instructions per second – MIPS(millions) of (F.P.) operations per second – MFLOP/s
Cycles per second (clock rate)
Megabytes per second
Answers per month
Useful Operations per second
Each metric has a place and a purpose, and each can be misused

Laboratorio deTecnologías de Información
Arquitectura de Computadoras Performance- 27
BenchmarksBenchmarks
♦
Real Programs■
Representative of real workload
■
The only accurate way to characterize performance■
e.g., gcc, spice, ...
♦
Kernels■
“Representative”
program fragments
■
Time critical excerpts of real programs. ■
e.g., Livermore loops
♦
Toy Benchmarks■
10-100 lines
■
e. g. Sieve, Puzzle, Towers♦
Synthetic Benchmarks■
attempt to match average frequencies of real workloads
■
e.g. Whetstone, dhrystone

Laboratorio deTecnologías de Información
Arquitectura de Computadoras Performance- 28
BenchmarkingBenchmarking
♦
Reproducible results■
must control outside factors
♦
Important factors■
Program input
■
Version of program■
Version of compiler
■
Optimization level■
Version of operating system
■
Amount of memory■
Number and type of disks
■
Version of CPU■
Cache configuration

Laboratorio deTecnologías de Información
Arquitectura de Computadoras Performance- 29
Benchmarking: SPECBenchmarking: SPEC
♦
Limitations of de facto Benchmarks♦
Dhrystone■
Synthetic integer benchmark
■
Heavy string emphasis■
Optimization compilers cause MAJOR problems
♦
Whetsone■
Synthetic floating-point benchmark
■
Designed to thwart optimization
♦
Linpack■
Floating-point kernel
■
DAXPY()
= A(I)
= B(I)
+ C *
D(I)

Laboratorio deTecnologías de Información
Arquitectura de Computadoras Performance- 30
SPEC95SPEC95
♦
Standard Performance Evaluation Corporation♦
Eighteen application benchmarks (with inputs) reflecting a technical computing workload
♦
Eight integer■
go, m88ksim, gcc, compress, li, ijpeg, perl, vortex
♦
Ten floating-point intensive■
tomcatv, swim, su2cor, hydro2d, mgrid, applu, turb3d, apsi, fppp, wave5
♦
Must run with standard compiler flags■
eliminate special undocumented incantations that may not even generate working code for real programs

Laboratorio deTecnologías de Información
Arquitectura de Computadoras Performance- 31
Benchmarking: SPEC200Benchmarking: SPEC200
Integer
Gzip CompressionVpr FPGA circuit placement
and routingGcc C programming language
compilerMcf Combinatorial
optimizationCrafty Game playing: chessParser Word processingEon Computer visualizationPerlbmk Perl programming
languageGap Group theoryVortex Object oriented databaseBzip2 Compression
Floating Point
Wupwise Physics: quantum chromadinamicsSwim Shallow water modellingMgrid Multigrid solver: 3D potential fieldApplu Partial differential equationsMesa 3D Graphics libraryGalgel Computational fluid dynamicsArt Image recognition neural networksEquaqke Seismic wave propagation
simulationFacerec Image processing: face
recognitionAmmp Computational chemistryLucas Number theory/primality testingFma3d Finite-element crash simulationSixtrack Nuclear physics accelerator designApsi Meteorology: pollutant distribution

Laboratorio deTecnologías de Información
Arquitectura de Computadoras Performance- 32
SummarizingSummarizing ResultsResults: A : A CounterCounter-- ExampleExample
A car
goes
30 MPH for
the
first
then
miles and
90 MPH for
the second
ten miles. What
the
car’s
average speed
over
the
twenty
miles?
Wrong
answer:Avg Speed = MPH + MPH MPH30 90
2 60=
Correct
answer:
Avg Speed = ancetotal time
= miles + miles( miles / MPH) + ( miles / MPH)
= miles( / ) hour + ( / ) hour MPH
total dist
10 1010 30 10 90
201 3 1 9 45=
Laboratorio deTecnologías de Información
Arquitectura de Computadoras Performance- 33
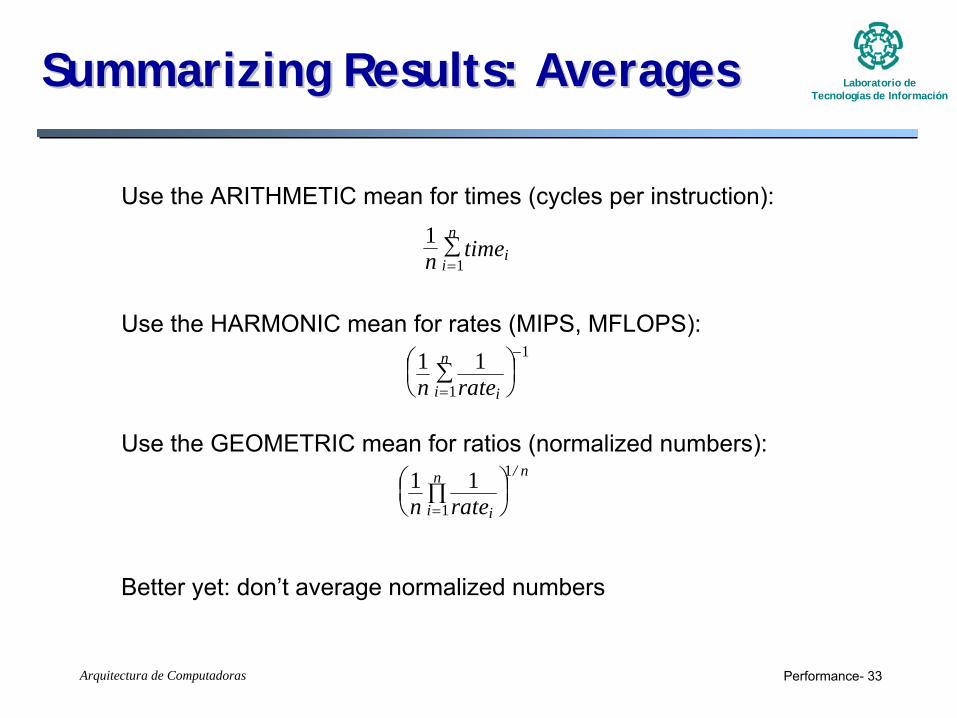
SummarizingSummarizing ResultsResults: : AveragesAverages
Use the
ARITHMETIC mean for
times (cycles
per instruction):
Use the
HARMONIC mean for
rates
(MIPS, MFLOPS):
Use the
GEOMETRIC mean for
ratios (normalized
numbers):
Better
yet: don’t
average normalized
numbers
11n timei
i
n
=∑
1 11
1
n rateii
n
=
−
∑⎛⎝⎜ ⎞
⎠⎟
1 11
1
n rateii
n n
=∏⎛
⎝⎜ ⎞
⎠⎟
/

Laboratorio deTecnologías de Información
Arquitectura de Computadoras Performance- 34
Summarizing Results: A Measure of Summarizing Results: A Measure of TimeTime♦
Property 1:A single-number performance measure for a set of benchmarks expressed in units of time should be directly proportional to the total (weighted) time consumed by the benchmarks.
♦
Property 2:A single-number performance measure for a set of benchmarks expressed as a rate should be indirectly proportional to the total (weighted) time consumed by the benchmarks.

Laboratorio deTecnologías de Información
Arquitectura de Computadoras Performance- 35
SummarizingSummarizing ResultsResults: : WhichWhich Mean ?Mean ?
Ti = Execution
time for
Benchmark
iFi = FP Operations
for
Benchmark
i
Ri = Fi / Ti = Rate
of
Benchmark
i
Average Time:
A mean n Tii
n− = ∑
=
11
Average Rate:A mean n Ri
i
n− = ∑
=
11
Violates
Property
2: Not
proportional
to
inverse
of
time. Use Harmonic mean:
H mean n R nFTii
n i
ii
n− = ∑⎛
⎝⎜ ⎞
⎠⎟ = ∑⎛
⎝⎜ ⎞
⎠⎟
=
−
=
−1 1 11
1
1
1
Laboratorio deTecnologías de Información
Arquitectura de Computadoras Performance- 36
Homework 2Homework 2
♦
Choose a program to evaluate performance of a PC■
It can be for Linux or Windows
♦
Choose performance metrics for:■
Speed of CPU
■
Speed of Main memory■
Speed of graphics applications
■
Speed of hard disk ♦
Run performance program in two different computers■
Your assigned PC at the lab
■
Your home computer♦
Compare results for two computers and stand if one is faster than the other according each metrics
♦
Three pages long report■
Describe the performance program (one page)
■
Describe performance tests and metrics (one page)■
Describe characteristics of both computers, compare results and make conclusions (one page)

Laboratorio deTecnologías de Información
Arquitectura de Computadoras Performance- 37
HomeworkHomework 22
Computer
A Computer
B Comparison
CPU speed
Memory
speed
Graphics
speed
HD speed
Due date: September 19th, 2008.


![d ICASE Report No. 92-59 ICASE - NASA · is independent of the number of processors. Based on this model, Ware [17] summarized Amdahl's [1] arguments to define a speedup formula which](https://static.fdocuments.in/doc/165x107/5ea3202adfef565e9f39e312/d-icase-report-no-92-59-icase-nasa-is-independent-of-the-number-of-processors.jpg)
