Performance Contracting, Measurement and Public Service ...
185
PERFORMANCE CONTRACTING, MEASUREMENT AND PUBLIC SERVICE DELIVERY IN KENYA NDUBAI ETHAN RICHARD A RESEARCH THESIS SUBMITTED IN PARTIAL FULFILLMENT OF THE REQUIREMENTS FOR THE AWARD OF THE DEGREE OF DOCTOR OF PHILOSOPHY IN BUSINESS ADMINISTRATION, SCHOOL OF BUSINESS, UNIVERSITY OF NAIROBI. 2016
Transcript of Performance Contracting, Measurement and Public Service ...

PERFORMANCE CONTRACTING MEASUREMENT AND PUBLIC SERVICE
DELIVERY IN KENYA
NDUBAI ETHAN RICHARD
A RESEARCH THESIS SUBMITTED IN PARTIAL FULFILLMENT OF THE
REQUIREMENTS FOR THE AWARD OF THE DEGREE OF DOCTOR OF
PHILOSOPHY IN BUSINESS ADMINISTRATION SCHOOL OF BUSINESS
UNIVERSITY OF NAIROBI
2016
ii
DECLARATION
iii
DEDICATION
This study is wholly dedicated to my lovely wife Winnie and adorable daughters Lisa and
Tyna who bore the brunt of low and at times altogether lack of attention in the course of
carrying out and documenting the research
iv
ACKNOWLEDGEMENTS
My foremost acknowledgement is to the Almighty God who helped me to overcome
seemingly insurmountable obstacles to complete this study to the satisfaction of my
supervisors The timely completion of the study including any discernible quality
premium is wholly attributable to my supervisors Prof Isaac Meroka Mbeche and Prof
Ganesh P Pokhariyal These distinguished scholars were consistently resolute in
impelling completion of the study and nose ndash hard insistent on quality and relevance of
substance Professor Aosa along with staff faculty and colleagues in the School of
Business gave valuable encouragement at every stage in the preparation of the report I
owe them considerable gratitude for their individual and collective assistance
v
TABLE OF CONTENTS
DECLARATION ii
DEDICATION iii
ACKNOWLEDGEMENTS iv
LIST OF TABLES ix
LIST OF FIGURES x
ABSTRACT xi
ABBREVIATIONS AND ACRONYMS xii
CHAPTER ONE INTRODUCTION 1
11 Background of the Study 1
111 Performance Contracting 4
112 Background to Public Sector Reforms in Kenya 8
113 Performance Measurement 11
114 Public Service Delivery 15
115 Determinants of Performance 18
116 The Public Sector in Kenya 20
12 The Research Problem 22
13 Research Objectives 27
14 Value of the Study 28
15 Chapter Summary 29
CHAPTER TWO LITERATURE REVIEW 30
21 Introduction 30
22 Theoretical Perspective 30
221 Theory of Performance 31
222 Theory of Organizational Performance Management (OPM) 32
223 Theory of Change 34
224 Resource-Based Theory of Competitive Advantage38
225 Theoretical Foundations of Performance Improvement 39
23 Performance Contracting and Measurement 43
vi
231 Reasons for Measuring Public Sector Performance55
24 Performance Contracting and Other Public Sector Performance Measurement and
Improvement Systems 64
241 Public Service Delivery 65
242 The Public Service in Kenya74
243 Customer Satisfaction 75
25 Examples of Countries Implementing PMMIS77
251 Indian Experience 78
252 South Korean Experience 79
253 Public Service Agreements in the United Kingdom 80
254 Government Performance Results Act (GPRA) in the United States of
America 81
255 Performance Contracting in Kenya 82
26 Previous Related Studies85
27 Conceptual Framework 87
28 Hypotheses 92
29 Chapter Summary 92
CHAPTER THREE RESEARCH METHODOLOGY 93
31 Introduction 93
32 Research Philosophy 93
33 Research Design95
34 Population and Data Collection 96
35 Data Analysis 98
36 Chapter Summary 101
CHAPTER FOUR DATA ANALYSIS AND DISCUSSION OF FINDINGS 102
41 Introduction 102
42 Pretesting for Multiple Regression Assumptions 102
421 Tests of Normality 103
422 Tests of Linearity 104
vii
423 Test of Homogeneity of Variances 106
424 Multicolinearity Test 107
43 Descriptive Analysis of the Study Variables 107
44 Performance Measurement and Customer Satisfaction 110
45 Intervening Effect of Political Stability on the Relationship between Performance
Measurement (Improvement) and Customer Satisfaction 114
46 Moderating Effect of Global Competitiveness on the Relationship between
Performance Measurement and Customer Satisfaction 116
47 Joint Effect of Performance Measurement Political Stability and Global
Competitiveness on Customer Satisfaction 118
48 Summary of Tests of Hypotheses 120
49 Discussion of the Findings 121
410 Chapter Summary 123
CHAPTER FIVE SUMMARY CONCLUSIONS AND
RECOMMENDATIONS 124
51 Introduction 124
52 Summary of the Findings 125
53 Conclusion 127
54 Implications of the Study Findings 127
541 Implications for Public Policy Formulation and Implementation 128
542 Implications for the Customer 128
543 Implications for the Academic Community 131
55 Limitations of the Study134
56 Suggestions for Further Research 135
REFERENCES 137
APPENDICES 159
Appendix I Types of Performance Contracts 159
Appendix II Model Performance Contract Framework 160
viii
Appendix III Performance Contract Matrix 163
Appendix IV Citizenslsquo Service Delivery Charter 164
Appendix V Development Expenditure as Percent of Total Expenditure 165
Appendix VI Development Expenditure vs GDP Growth at Market Prices 166
Appendix VII GDP Trend 167
Appendix VIII Economic Growth (percent 2001-2010) 168
Appendix IX Public Service Aggregate Performance 169
Appendix X Economic Performance for selected Countries 170
Append XI Previous Related Studies 171
ix
LIST OF TABLES
Table 21 Steps in Developing a Performance Measurement System 46
Table 22 Assignment of Weights Over Study Period 54
Table 23 Assignment of Weights after Study Period54
Table 24 Performance Grading Scores 83
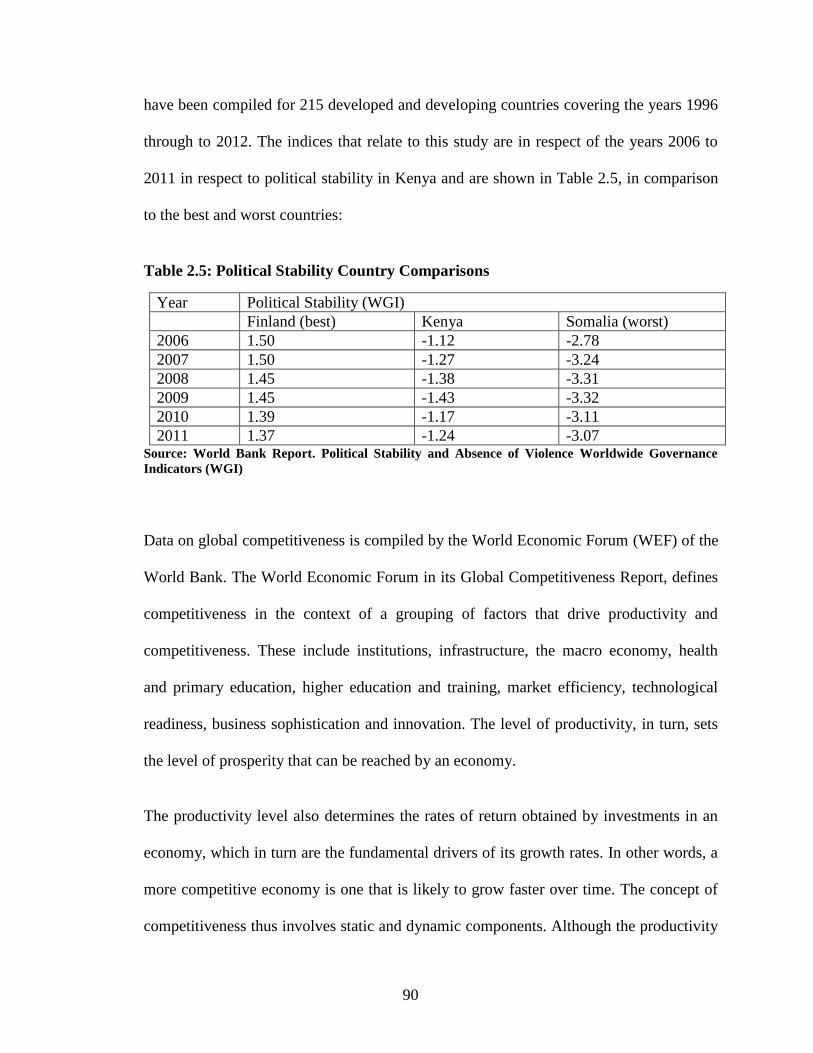
Table 25 Political Stability Country Comparisons 90
Table 31 Distribution of MDAs in 2011 97
Table 32 Summary of Analytical Model 100
Table 41 Test of Homogeneity of Variances 106
Table 42 Multicolinearity Coefficientsa 107
Table 43 Shows the Descriptive Statistics of the Study Variables 108
Table 44 Correlation Analysis of the Study Variables 109
Table 45 Relationship between Performance Measurement and Customer
Satisfaction 111
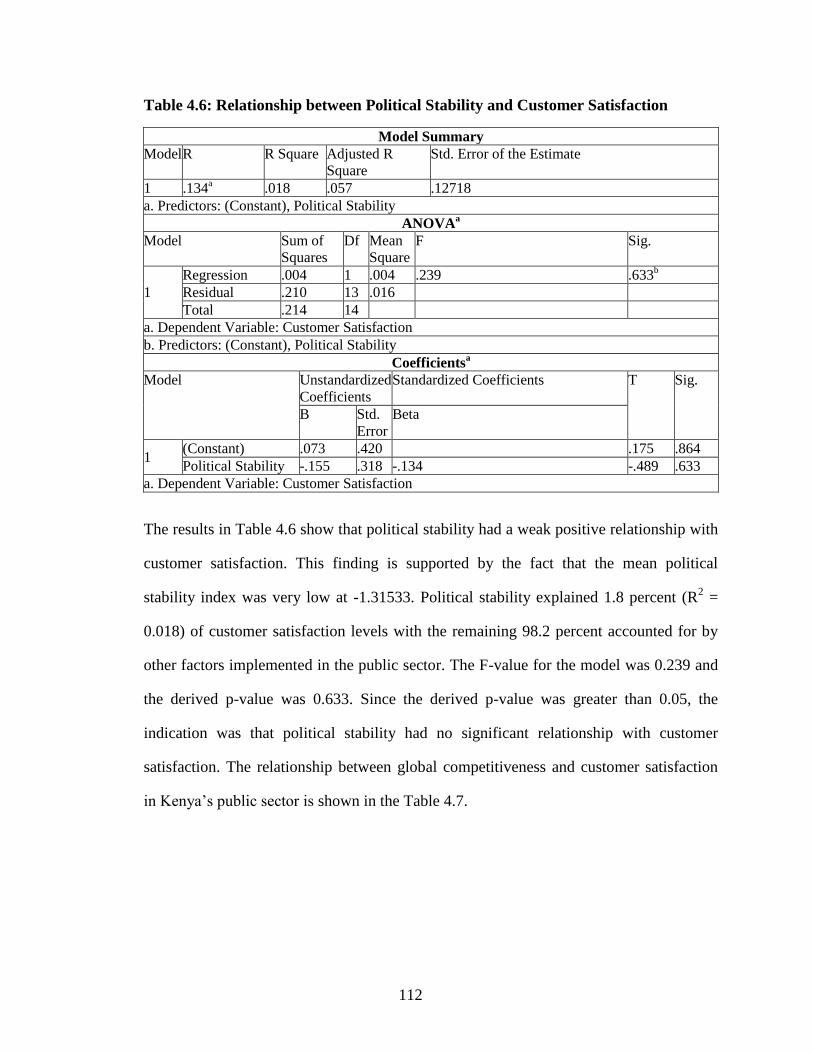
Table 46 Relationship between Political Stability and Customer Satisfaction 112
Table 47 Relationship between Global Competitiveness and Customer Satisfaction 113
Table 48 Intervening Effect of Political Stability 115
Table 49 Moderating Effects of Global Competitiveness117
Table 410 Joint Effect of Performance Measurement Political Stability Global
Competitiveness on Customer Satisfaction 119
Table 411 Summary of Tests of Hypotheses 120
Table 412 Hence the conclusions from the findings along with R2 and F values are
summarized as indicated in the table below 121
x
LIST OF FIGURES
Figure 21 Performance Management Measurement and Improvement System 50
Figure 22 Performance Contracting Cycle 51
Figure 23 Conceptual Framework 91
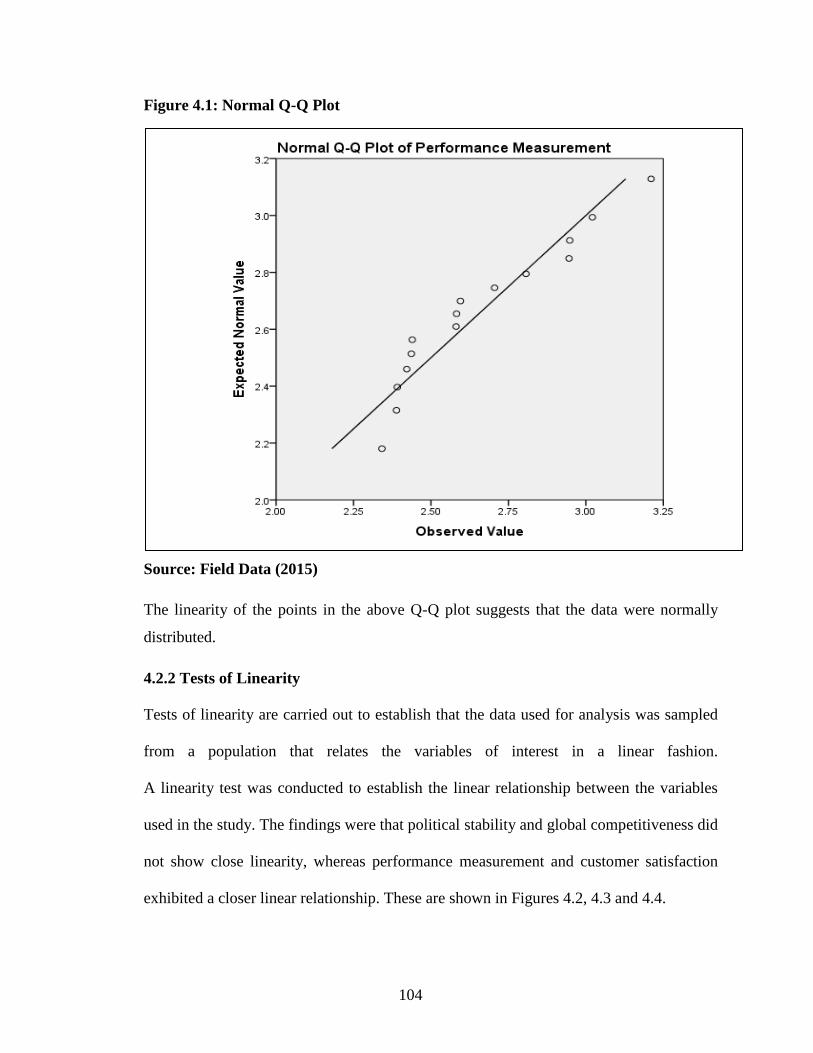
Figure 41 Normal Q-Q Plot 104
Figure 42 Performance Measurement and Customer Satisfaction 105
Figure 43 Political Stability and Customer Satisfaction 105
Figure 44 Political Stability and Customer Satisfaction 106
xi
ABSTRACT
Improvement in public service delivery and the consequent increase in customer (public) satisfaction with public services have been at the core of reform programs in many developed and developing countries The issues of performance contracting measurement and evaluation are not new phenomena governments have persistently sought to justify their existence based on their achievements in service delivery to their citizens The general objective of this study was to establish the relationship between performance contracting and measurement and public service delivery in Kenya as intervened and moderated by respectively political stability and global competitiveness The concepts of performance contracting measurement and service delivery are grounded in and indeed straddle a number of theories that embrace and give credence to these precepts These theories include theory of Performance theory of organizational performance management (OPM) theory of Change and Resource-Based Theory of Competitive Advantage This study was guided by positivist philosophy The positivist school of thought is based on the assumption that only one reality exists though it can only be known imperfectly due to human limitations and researchers can only discover this reality within the realm of probability This study employed a cross-sectional design focusing on the entire population of 470 MDAs The study relied on secondary data that was already available The political stability indices were extracted from the World Bank Report on Worldwide Governance Indicators on Political Stability and Absence of ViolenceTerrorism while the data on global competitiveness was obtained from the 2013 World Economic Forum (WEF) report of the World Bank Further the various categories of MDAs had by 201011 been on performance contract for differing periods these are 6 years for both ministries and state corporations 5 years for local authorities and 4 years for tertiary institutions The data used for the study was in respect to the five years of 200607 200708 200809 200910 and 201011 during which period customer satisfaction in the majority of the above categories of public agencies was measured Descriptive analysis was conducted to bring out the main characteristics of the sample To test the hypotheses correlation and regression analyses were carried out to establish the expected relationships between performance contracting and measurement and public service delivery in Kenya and the intervening and moderating effects of respectively political stability and global competitiveness on this relationship In addition t-test and p-values were used to determine individual significance of the results of the analysis Assessment of the overall robustness and significance of the regression models was done using the F-test and p-values Based on the research findings it can be concluded that performance measurement has a significant effect on customer satisfaction Secondly it can be concluded that political stability has an intervening effect on the relationship between performance measurement and customer satisfaction Further global competitiveness has a moderating effect on the relationship between performance measurement and customer satisfaction The outcome of this study is expected impact on a broad spectrum of constituents among them governments desirous to improve public service delivery practitioners and academicians in the field of performance measurement and public service delivery managers of public sector institutions individual public sector employees and the public who are the beneficiaries of government services The study findings reveal a number of questions that still need to be addressed It will be recalled for example that the study established that performance measurement explains 736 percent of customer satisfaction levels Political stability explains 18 percent while global competitiveness explains 25 percent The three variables explain 785 percent of customer satisfaction levels Further research is required to establish what other factors could explain the remainder of the customer satisfaction level that was not explained by the above variables
xii
ABBREVIATIONS AND ACRONYMS
BATHO PELE Putting People First
GAO Government Auditing Office
GASB Government Accounting Standards Board
GCI Global Competitiveness Index
GIE Government Invested Enterprise
GIEMA Government Invested Enterprises Management Act
GPRA Government Performance and Results Act
G8 Group of Eight
ISO International Organization for Standardization
KShs Kenya Shillings
LTDC Lesotho Tourist Development Corporation
MDA Ministry Department and Agencies
OECD Organization for Economic Cooperation and
Development
OMB Office of Management and Budget
PART Program Assessment Rating Tool
PC Performance ContractPerformance Contracting
PI Performance Indicator
PMDS Performance Management and Development System
PMMIS Performance Management Measurement and Improvement
System
PMS Performance Management System
PUMA Public Management Committee of the OECD
SADC Southern African Development Community
SCSB Swedish Customer Satisfaction Barometer
SEA Service Efforts and Accomplishments
TQM Total Quality Management
WGI World Governance Indicators
WEF World Economic Forum
1
CHAPTER ONE
INTRODUCTION
11 Background of the Study
Until about four decades ago the administration and management of the public sector in
many countries seemed to have taken on a life of their own Citizens of most of these
countries were regarded as almost after thoughts to the complex network of structures
policies and systems internal to government However the recent wave of reforms
compelling reversion to customer focus in many governments changed substantially the
operating environment for both elected officials and public service employees The
struggle has now boiled down to finding the best and most cost effective ways to
continuously engage the public and improve service quality That means as Eggleton
(1996) states as elected officials and as public service employees it can be expected
that the words service and quality will become virtually interchangeable in our lives
and the public will certainly look upon that as good news
Improvement in public service delivery and the consequent increase in customer
(public) satisfaction with public services have been at the core of reform programs in
many developed and developing countries Public sector reforms in the past half century
have accordingly been directed at ensuring that public services have the right people
structures and organization capable of developing and delivering the right policies and
services while at the same time ensuring the public service operates efficiently and
effectively (Strategic Management in the Irish Civil Service 1995) This is in addition
to the imperative need to expose the management of the public sector and the country to
global market forces and competition
2
The ultimate objective is to replace unresponsive public service bureaucracies with
modern flexible systems geared to the needs of public service customers which are
more responsive to the competing pressures of the outside world and which equip the
public service to more effectively meet changing national socioeconomic needs
(Humphreys 1983) Moreover to accomplish this objective a country needs a
government that is smaller and more responsive that has lower cost but a higher quality
of service that moves more authority to states and localities and to entrepreneurs in the
private sector that produces fewer regulations and more incentives and that has more
common sense and seeks more common ground (Clinton 1995) Higher quality of
service is about deliberate and continuous engagement and empowerment of the citizen
Braverman amp Kuntz (2012) observed that innovative governments are making it easier
for citizens to access public services In addition the most forward-thinking
governments are starting to master the shift from simply administering services to
regularly engaging and empowering citizens involving them in the design and in some
cases the delivery of the services This shift is not just about increasing choice and well-
being it is also about boosting government productivity with the help of technology
and the use of open data
Further the private sectorlsquos responsiveness to customer demands has led to heightened
public expectations of government Since people can do their banking shopping
payment of utility bills and money transactions online for example they would expect to
for example be able to apply for passports identity cards and driving licenses and
submit tax returns online as well and governments are investing and struggling to meet
these expectations
3
Since recorded history began governments have sought to justify their existence not
merely by appeals to the divine right of the king or emperor but also by their mighty
achievements In the modern era democratic governments and political parties regularly
praise their own achievements on behalf of the citizens or include promises of results in
their manifestos (Talbot 2005) Citing the Organization for Economic Cooperation and
Development and Public Management Committee (OECD ndashPUMA) 1997 report and
OECD 2005 Talbot (2006) observes that there has been a massive rise in attempts by
governments across the globe to better measure and report upon the results of public
activities over the past two decades and that the current wave of reform in this area is
larger broader deeper and longer than all previously recorded attempts
A report prepared by Farrell and Goodman (McKinsey amp Company December 2013)
headed ―Government by design four principles for a better public sector explored the
daunting challenges governments are facing today It observed that in a world
characterized by macroeconomic uncertainty rapid social change and technological
innovation citizenslsquo expectations of what government ought to deliver are rising On the
other hand governments are hampered by unsustainable debt burdens and shrinking
budgets For example by 2013 the ratio of general government debt to Gross Domestic
Product (GDP) for member states of the OECD exceeded 100 percent (OECD Economic
Outlook No 93 June 2013) Meanwhile public trust in government is eroding and
against this backdrop not only must governments do more with less they must do so in
highly visible ways if they are to regain the faith of their constituents
4
On the basis of research findings by the McKinsey Center for Government into hundreds
of cases of government innovation around the world their ground experience working
with governments and numerous conversations with public-sector leaders and thinkers
the report concludes that what works today is a more disciplined systematic approach to
solving public sector management problemsmdashin short ―government by design
This model requires public officers who are willing to abandon tools and techniques that
no longer work and who embrace the rational and the analytical over the purely
ideological The four principles for a better public sector include the use of better
evidence for decision making and greater engagement and empowerment of citizens The
use of better evidence for decision making and engagement and empowerment of
citizens is insured through implementation of an appropriate and strong performance
management measurement and improvement system
111 Performance Contracting
The key challenge practitioners and authors in the field of performance management have
been grappling with in the pursuit of performance improvement has been the question of
developing a flexible yet powerful model of performance measurement management and
improvement one that is grounded in theory supported by research and able to
communicate complex relationships while maintaining simplicity (Lopez amp Hutchinson
2013) A systemic model for performance measurement and management that is sensitive
to transactional relationships across performance levels (that is individual group
organizational and external impact) and contexts Yet as Cho amp Yoon (2010) observe
despite shared interests in human performance management as well as complementary
agendas for research and practice dialogue between academics in Human Performance
Technology (HPT) and Human Resource Managers (HRM) appears to be lacking
5
Many government dispensations in attempts to transform their public services have
developed systems that involve employees in improving organizational effectiveness by
focusing them on achieving the organizationlsquos mission and strategic goals These are
essentially performance management systems (PMSs) designed for implementing
strategy by communicating organizational goals and objectives reinforcing individual
accountability for meeting those goals and tracking individual and organizational
performance results They are therefore largely tools to address the immediate
performance shortfalls without necessarily meeting the criteria of models that are both
theoretically sound and attendant to the needs of practitioners
There are many and different types of performance management and measurement
frameworks with variants of the core PMS tools particularly measurement and
evaluation Among these are the Performance Contract (PC) (Trivedi 1994) the
Balanced Scorecard (BSC) (Kaplan amp Norton 1992) the Performance Prism (PP)
(Neely et al 2002) the Results and Determinants Framework (RDF) (Fitzgerald et al
1991) the Strategic Management and Reporting Technique (SMART) (Lynch amp Cross
1991) the Performance Measurement Matrix (PMM) (Keegan et al 1989) the
Performance Management Questionnaire (PMQ) (Dixon et al 1990) the Du Pont
Pyramid of Financial Ratios Brownlsquos Performance Framework (BPF) the Performance
Pyramid and the European foundation for quality managementlsquos business excellence
model
6
The bulk of these are however designed to drive performance in respect to revenue and
profit generating organizations Others place greater emphasis on the strategic
management processes with scanty regard for measurement and evaluation Moreover
except perhaps for the BSC the PC and BPF the bulk of the rest have not embraced
measurement frameworks with balanced measures that is indicators that measure both
financial and non-financial aspects including processes The BSC and the PC are the
most commonly known and used the former largely in the corporate sector and the latter
mainly in the public sector
The BSC emerged in the private sector in the early 1990lsquos as a framework for measuring
performance The finished product shows a list of goals for a specific time frame next to
the activities and measures used to achieve them The goals traditionally focus on four
areas financial performance the customer internal business processes and innovation
and learning (Poister 2004) The BSC links strategy to a set of indicators both financial
and non-financial (Chan 2004) The tool was introduced by Kaplan amp Norton in 1990
and is basically also a performance contracting tool The intention was to measure both
the short and long term objectives of organizations and provide a holistic view of how
organizations are performing (Kaplan amp Norton 1996) According to Whittaker (2001) a
balanced approach allows consideration of all the important operational measures at the
same time allowing a view on whether improvement in one area is achieved at the
expense of another area
7
A PC on the other hand is a management control system tool for selected public
enterprises (Trivedi 1994) The system began as a reaction to the perception of the
general public that public enterprises had not performed as was expected of them This
perception resulted in outpourings of public enterprise literature focused on two
categories of solutions to the perceived poor performance of public enterprises One
branch of the literature focused on privatization of public enterprises while the other
focused on performance improvement or as it has been variously termed privatization of
the public sector style of management through performance contracting (Trivedi 1994)
In essence the objective was to improve enterprise performance towards its goals such
as international competitiveness in cost design quality control delivery and marketing
or developing a backward region
The system addresses three of the key problems facing public enterprises which are ill-
defined and unreconciled goals political and bureaucratic interventions in operational
decision-making and management rewards which are fixed irrespective of effort or
results (Bennet 1990) Thus PCs aim to bring private enterprise conditions into public
enterprises and to encourage initiative innovation and the spirit of entrepreneurship for
the purpose of achieving targeted results effectively and efficiently The objective of the
performance contracting policy was to simultaneously increase managerial and
operational autonomy as well as accountability (Trivedi 1994)
Unlike privatization where public assets are privatized the policy seeks to privatize the
public sector style of management It is in essence an attempt to move the public sector
style of management away from control by procedureslsquo to control by resultslsquo (Trivedi
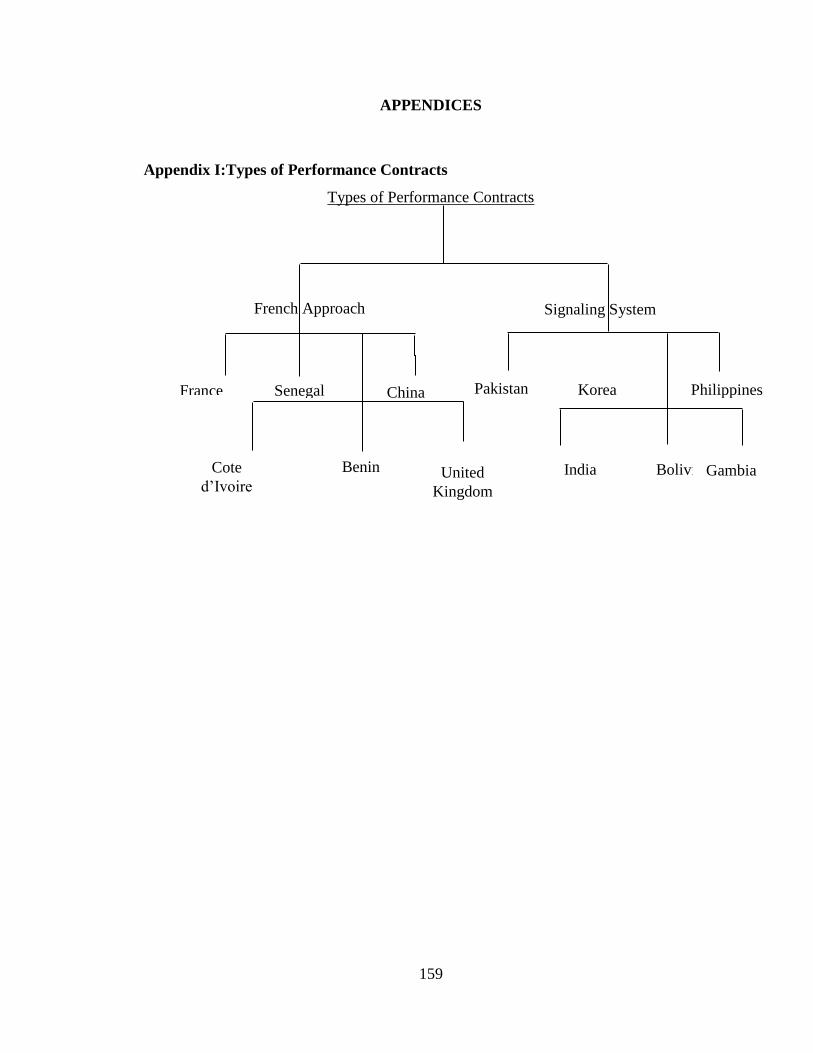
1994) According to Trivedi (1994) there is a general consensus that there are only two
8
main types of PCs and all other arrangements fall under one or the other These are the
French-based system and the signaling system (which originated in Pakistan and South
Korea) The difference between the two is that the French contract plans do not allocate
weights (and point calibrations) to targets Thus there is no distinction between targets in
terms of emphasis (by weighting them differently) and as such measurement and
evaluation of performance is affected by a high degree of subjectivity
This system is practiced in France United Kingdom China Senegal Benin
CotedlsquoVoire Morocco The signaling system which assigns weights to indicators was
practiced in India Pakistan South Korea Bangladesh and Philippines Nigeria Ghana
the Gambia and Bolivia (Trivedi 1994) The two systems including the countries that
subscribed to each of them are shown in Appendix I A number of countries under each
of the systems abandoned the system along the way owing to waning political support
resource deficits general apathy or a combination of them The public sector in Kenya
implements the signaling system In nearly all the countries where performance
contracting has been implemented or attempts have been made to introduce the system
his has been carried out as part of broader public sector reforms This has equally been
the case in Kenya
112 Background to Public Sector Reforms in Kenya
A Cabinet Memorandum of 2004 traces the genesis of public sector reforms in Kenya to
the period following independence in 1963 a period that saw excessive recruitment in the
public service resulting in serious imbalances between allocations for operations and
management and personnel emoluments without commensurate improvement in service
delivery Personnel emoluments grew from 47 of the recurrent budget in 198485 to an
average of 70 in the 1990lsquos and up to 95 in some ministries
9
The situation was exacerbated by low pay and shortagelack of working tools The
government responded by introducing the Civil Service Reform Program and Action Plan
in March 1992 and the Civil Service Reform Program (CSRP) in August 1993 The
program was implemented in phases The first phase focused on rationalization of
staffing comprising the voluntary early retirement imposition of employment embargo
issuance of personal numbers to control the specter of irregular recruitment and ghostlsquo
workers payroll cleansing retrenchment and withdrawal of guaranteed employment for
university graduates
Despite these reforms performance continued to plummet as resource wastage continued
to rise This prompted government to introduce CSRP II as a Medium Term Strategy
guided by the strategy for performance improvement in the public servicelsquo in March
2002 This was essentially the foundation of performance contracting as it provided for
inter alia setting performance standards and benchmarks for public servants
institutionalizing strategic planning in the public service improving staff appraisal and
undertaking public service delivery surveys in ministries to determine service delivery
levels constraints and bottlenecks as a basis for developing performance improvement
programs for all major service areas The overriding objective of the reforms was to
create a leaner efficient motivated and more productive public service equipped to
focus finance and human resources on the delivery of core public services
The reforms were quickly followed by immediate direction to the public service to
among others Develop strategic plans and annual work plans to allow for proper
utilization of resources on clearly identified core functions objective staff appraisal
better and improved method of supervising staff based on achievement of set targets
10
development introduction and institutionalization of performance based management
practices undertaking service delivery surveys in all ministriesdepartments and
developing and installing service charters with clear service benchmarks and standards in
order to enhance efficiency transparency and accountability in service delivery carrying
out immediate and comprehensive benchmarking exercise to identify the minimum costs
of delivering government services and thus enable cost reductions in government
activities and placement of all Permanent Secretaries and Chief Executives of state
corporations on performance contracts
Kobia amp Mohammed (2006) have traced the background to performance contracting in
Kenya to the period before the 1990lsquos According to them the concept of performance
contracting was first introduced in the management of state corporations in 1989 with the
issue of a Parastatal Reform Strategy Paper by the cabinet in 1991 The objective of this
initiative was to streamline and improve the performance of State Corporations by among
others rationalizing the enabling environment of all strategic parastatals including
removal of potentially conflicting objectives and making transparent the cost of social
services and compensating the parastatals for social obligations
The first two parastatals to be on Performance Contracting were the Kenya Railways
Corporation and the National Cereals and Produce Board Kenya Railways signed PClsquos
in April 1989 and National Cereals and produce Board signed in November 1990
According to the authors the two PCs did not produce the expected results because of
lack of political goodwill to drive the process as it was perceived to be donor-driven
failure to incorporate performance incentive systems and overlooking the impact of
external factors The PC initiative was accordingly re-introduced in 2003 under the
Economic Recovery Strategy for Wealth and Employment Creation
11
113 Performance Measurement
Measurement is not an entirely new phenomenon and can be traced back to the beginning
of time Early measurement was based on human body parts The ancient cubit was for
example the length of the ancient Egyptian pharaohlsquos arm plus the width of his hand
Over the centuries as more sophisticated needs emerged more sophisticated measures
were developed In primitive settlements there was scanty need for measurement
Advances in measurement were driven by powerful needs such as the need for social
interaction and to move beyond subsistence living which led to trade and commerce
and the need for understanding and mastery of the physical environment which led to
science It is trade and commerce that gave rise to most of early practical measurement
including weight length width size quantity time and monetary measures
Measurement is at its root a social phenomenon not a detached calculation of numbers
In fact measurement was created to facilitate socialization and its further development
and effectiveness depend on a socialization process
The social nature of measurement is well exemplified by how the measurement of time
evolved from social need In early cultures time was not very important and the position
of the sun in the sky was sufficient for the level of time-consciousness needed at that
period As people became more conscious of time they started valuing it more requiring
more time discipline This led to more precise measurement of time including
development of appropriate measurement tools such as clocks and watches David
Landes (2000) observes that improvements in the measurement of time were the most
important physical advances in the history of western civilization without which few
12
other advances would have been likely Further that all scientific and industrial progress
has depended on measurement continuing development and refinement of increasingly
more sophisticated measurement devices such as telescopes microscopes x-rays and
atomic clocks
Geniat and Libert (2002) opined fairly correctly that ―without the capacity to measure
we would be uncertain literally as to where we stood and where we are going We
would not know whether we are rich or poor hot or cold old or young The very word
measurelsquo pervades all fieldshellipyou canlsquot make decisions connections money or music
without true measurements To a fairly significant extent the way we measure success
in turn determines the success we attain Activities events and programs which cannot
be measured cannot also be easily replicated managed or even appreciated Spitzer
(2007) states that the need to measure things is a result of the need to understand them
Further that one of the most important keys to the success of an organization is found in
the most unlikely of places a place that would ordinarily be considered complicated
inaccessible and perhaps even downright boring This key to success is already one of
the most ubiquitous forces in the organization It is there waiting to be tapped into this
key to success is ―measurement
Performance measurement is a key component of performance management systems and
is employed primarily in attempts to improve organizational performance and service
delivery Brown et al (2001) states that ―Measurement is not only a way of determining
what has already happened which is like driving by looking in the rear-view mirrorlsquo but
is also a way of getting people to act in ways that will bring about desired future
13
outcomes A performance measurement system should support both operations and the
overall corporate strategy At the operations level performance measures should link
processes to strategic objectives and motivate both workers and managers They should
balance financial measures with non-financial measures such as measurements of waste
and of customer satisfaction Over the long run good performance measures will help
support organizational transformation and organizational learning and sustain
competitiveness In complex organizations the need to measure performance at both the
individual and organizational levels may stem from the need to understand the nature of
the actions or behaviors that contribute to high or low levels of performance
There are as many perspectives on performance measurement as there are different
practitioners and writers although the perspectives ultimately converge These myriad
perspectives prompted Franco-Santos et al (2007) to state that ―There is a lack of
agreement on a single definition of performance measurement Clearly though
performance measurement refers to the process of obtaining the numerical information
that quantifies inputs outputs and performance dimensions of processes products
services and the overall outcomes Measurement has been recognized as a crucial
element to improve business performance (Sharma et al 2005) A performance
measurement and management system is therefore a balanced and dynamic system that
enables support of decision-making processes by gathering elaborating and analyzing
information (Neely et al 2002) The concept of ―balance refers to the need to use
different measures and perspectives that tied together give a holistic view of the
organization (Kaplan amp Norton 1996)
14
All measures are relative A measure that is not referenced to something else has no
meaning According to Thomas Fuller (1608 ndash 1661) ―Nothing is good or bad but by
comparison Amaratunga et al (2001) state that performance measurement is logically
governed by a number of principles A measurement system promotes productivity by
focusing attention on issues important to the organization managers can for example be
measured by the efficiency and effectiveness of the units they manage Productivity and
effectiveness of any function can be measured by some combination of cost time
quality quantity or other human relation indices Effectiveness and efficiency measures
help motivate people and make them feel better about what they are doing and about
themselves The value of performance measurement is summarized as follows if it canlsquot
be measured it canlsquot be managed what gets measured gets watched and what gets
watched gets done (Drucker 1999)
Meaningful performance measurement goes way beyond application of formulae or the
mere computation of numbers In this regard it should be possible to measure
expectations and undertakings and produce results that will help managers to make the
right decisions regarding continuous improvement of performance To be meaningful a
performance measurement methodology should not only dovetail into the overall PMS as
a key complement to performance improvement but should be the central part of the
system Performance measurement under the American Government Performance and
Results Act (GPRA) for example envisages among other benefits that it would be a
good way to convert evaluations that derive lessons from past experience into wisdom
and insight that influence planned activities and to link activities to program goals and
program goals to the mission
15
114 Public Service Delivery
A public service is a service provided by the government to the public The need for
services that no individual can or will pay for but that benefit all by their presence is the
key justification for taxation Examples of such services are sewage and garbage
collection and disposal street lighting and cleaning On a larger scale security
infrastructure education and public health are also public services Public service
delivery is the implementation of those services and making sure they reach the people
and places they are intended for A public service is a public trust because it is a non-
profitable association with government that gives its loyalty to its people by doing good
things to empower society In the broader sense service refers to the quality of customer
service service accessibility speed of delivery affordability reliability courtesy and
completeness and the measured appropriateness of assistance and support provided to a
customer As former US president Clinton (1995) put it in the forward to ―Commonsense
Government ndash Works Better and Costs Less ―hellipgovernment needs to change along with
the people it serves Further that ―hellipwe need to cure the anxiety and alienation many
people feel toward their government People will regain confidence in government if we
make it work better We need to make quality management the culture of government so
that no future administration can fail to embrace it (Clinton 1995)
This shift is not just about increasing choice and well-being it is also about boosting
government productivity with the help of technology and the use of open data The
Estonian governmentlsquos e-services portal for example visited by more than 10000 users
every day allows residents to perform an ever-expanding array of tasks including
applying for unemployment benefits paying taxes registering new companies and even
16
voting But being citizen-centric is not just about the Internet Australia for instance has
pioneered mobile government offices satellite-equipped trucks that serve as one-stop-
shops for government services for people living in remote areas Innovative governments
are creating new ways for citizens to make their voices heard giving them the ability to
provide input into regulations budgets and the provision of services
Regulationsgov one of the US governmentlsquos earliest e-government programs allows
citizens to search view and comment on federal regulations Users post more close to
30000 comments on the site every month Other governments are going even further to
solicit citizen feedback in 2010 Iceland picked 950 citizens at random to participate in
the drafting of a new constitution a significant example of ―deliberative democracy at
work The city of Cologne Germany has used participatory budgeting in which residents
helped decide how to allocate a portion of the municipal budget Citizens can play an
important role not just in the design but also in the delivery of public services New York
Citylsquos 311 system allows residents to report non-emergency complaints about things like
potholes or garbage collection via a website a mobile application text messaging Skype
or phone Thanks to the Open311 platform a free web-based application programming
interface the city now processes 60 percent of service requests online lowering
transaction and issue resolution costs Open311 platforms have been rolled out to other
cities as well including San Francisco and Chicago These platforms along with third-
party apps such as SeeClickFix empower citizens to do some of the work that has
traditionally fallen to municipal employees enabling citizens to in effect act as city
inspectors
17
In similar vein the mayors of Boston and Philadelphia have each created an office of new
urban mechanics which works with residents to fund and launch promising projects that
address civic needs Citizens not government employees come up with the ideas and do
much of the work but also reap the benefits The trend toward participatory government
will only gain in strength By engaging and empowering citizens to co-design and co-
deliver public services governments cannot only better meet citizenslsquo needs they can
also shift some of the burden of accountability from the state to the people allowing
high-quality delivery of services in an environment of constrained resources
In Kenya the service delivery aspects of public sector performance including service
standards cost expectations time lines and avenues for redress are set out in citizenslsquo
service delivery charters The charter was introduced in the public service in 2006 as the
key performance sub-indicator under the ―service delivery perspective in PCs The
charter is an instrument that documents and broadcasts the services rendered by a public
institution the expected service standard service quality requirements to qualify for the
service cost timelines and avenues for redress Measurement of achievements on the
various aspects of the charter is highly qualitative determined as it is by customer and
stakeholder feedback and surveys Recently technology has been employed to not only
speed up service delivery but to also facilitate measurement
In 2008 the then Ministry of Immigration and Registration of Persons under its
performance contracting adopted automation in the issuance of passports and identity
cards under a project dubbed lsquoe-service deliveryrsquo in the process heralding a revolution in
delivery of public service in terms of service quality accessibility timeliness
18
affordability and speed to unprecedented customer satisfaction levels This has now been
advanced further to include ―huduma (service delivery) centers which offer in
aggregate over 40 diverse and most commonly demanded services under one roof in
over 30 counties
Malaysia has leveraged technology and e-services to improve public service delivery
through the creation of multichannel delivery portals such as internet and village kiosk
machines with the objective of enhancing service access through multiple electronic
delivery channels providing internet services where multiple services can be obtained at
each delivery channel and improving service quality in terms of speed reliability
transparency and security (Multimedia Development Corporation 2007) The challenge
then is in devising a PMS that supports calibration a wider rating scale and comparative
performance rating and thereby inspiring improvement in service delivery
115 Determinants of Performance
According to Hansen (1989) there are two streams of research regarding the determinants
of firm performance One is based on the economic tradition and emphasizes external
market factors while the other builds on the behavioral and sociological paradigms
focusing on organizational factors as they fit into the environment the latter therefore
focuses on factors internal to the firm Organizational researchers have developed a wide
variety of performance models Research by Cameron (1986) Goodman and Pennings
(1977) Steers (1975) suggests that managers can influence organizational performance
by influencing the behavior of employees This entails taking consideration of multiple
factors among them the formal and informal structures planning reward control and
information systems their skills and personalities and relating these to the environment
19
One research stream that has managed to capture these multidimensional aspects is that
of organizational climate The latter encompasses the perceived properties and
characteristics found in the work environment that result from actions taken consciously
or unconsciously by an organization and which affect behavior (Steers and Lee
198382) It refers to a broad class of organizational and perceptual variables that reflect
individual - organizational interactions which affect the behavior of the individual and
provides the conceptual link between analysis at the organizational level and at the
employee level This means that changes in organizational structures systems and
practices can alter climate measures and hence individual performance Other studies
have suggested that organizational climate was directly linked to performance (Lawler et
al (1974) and that there are strong linkages between managerial practices and dimensions
of organizational climate and firm performance (Simmons amp Mares 1983 Likert 1961)
These studies brought out three key classes of factors that influence performance These
are the following Organizational factors ndash structure systems size history
Environmental factors ndash political sociological economic technological and People
factors ndash skills personalities age
The study selected key constructs from each of the three categories That is
organizational factors ndash performance contracting and measurement system
environmental factors ndash political stability and global competitiveness and people factors -
effective and efficient public service As discussed later in this study the issue of political
stability is critical to the performance of the public service and the country at large The
study captures the aftermath of the 200708 post ndash election skirmishes and the consequent
effect on the performance of both the economy and the public service as indicated in
20
Annexes VIII and IX The annexes indicate that the aggregate performance of the public
service plummeted to its lowest in 2008 in terms of average composite scoring and in its
wake fell along with the economy from a real GDP growth rate of 71 in 2007 to 17
in 2008 The exposition on political stability in subsequent sections in this study makes
reference also to the case of the Kingdom of Lesotho where political instability had
driven the performance of the economy to the lowest levels in years Political stability
and global competitiveness were hence used in the study as respectively intervening and
moderating factors
116 The Public Sector in Kenya
The Republic of Kenya has experienced mixed fortunes in its economic development
since independence in 1963 This period witnessed undefined government allocation of
financial resources to development programs ultimately declining from 4080 percent in
1978 to 1283 percent in 1999 1358 percent in 2000 and 1360 percent in 2002 in
proportion to total expenditure (Appendix V) thereby constraining and in many cases
stifling the growth of the economy Moreover it was not possible as a result to correlate
development expenditure with economic growth (presumably because of numerous
resource leakages) which apparently varied not because of but in spite of the proportion
of development expenditure appropriated by government to the total expenditure as
shown in Appendix VI
Until 2004 when performance contracting began to take shape in Kenya public sector
management was characterized by considerable inertia exemplified by inefficiencies in
the exploitation and use of national resources unresponsive service delivery culture and
unmitigated graft This was to change dramatically when PCs became operational The
21
performance of both public sector institutions and the economy improved rapidly with the
economic growth rate rising from 04 percent in 2002 to 71 percent in 2007(Appendix V
and VIII) Moreover save for variations resulting from the contribution of non ndash state
sectors of the economy there seemed to be a similarity between the growth of the
economy and improvement in the performance of the public sector as shown in Appendix
VIII and Appendix IX This growth trend was however to be interrupted by the
skirmishes that followed the disputed 2007 general elections The effects of the
skirmishes on the growth of the economy and the aggregate performance of the public
service are discernible from the trends graphed in Appendices VII VIII and IX
Until March 2013 the public sector in Kenya was made up of 487 public agencies in the
executive arm of the government comprising 46 ministries and accounting departments
202 state corporations 175 local authorities and 64 tertiary institutions Out of these 486
were on PC Performance contracting in the public sector in Kenya whose core focus is
performance management measurement and improvement was born out of the need to
improve performance by re-focusing public service operations and management from
inputs processes procedures and activities to results (outputs outcomes and impacts)
The system is founded on five year institutional strategic plans which are in turn linked
to the national vision and is built around clear performance criteria indicators and
targets and an elaborate measurement and evaluation system which compares
achievement of freely negotiated performance targets with actual achievement The
subsequent evaluation examines the various factors affecting performance
22
Although performance contracting was introduced in the country in 2004 it was not until
the financial year 200506 that citizenslsquo service delivery charters and the concomitant
requirement for service-oriented agencies to carry out annual customer satisfaction
surveys thereby paving the way for measurement of various aspects of service delivery
that yield to customer satisfaction began to take root Accordingly ministries state
corporations and local authorities that were on PC began to incorporate ―customer
satisfaction as a key performance indicator under the ―service delivery criterion in their
PCs in the financial year 200607 It was therefore not until 200607 that measurement
and evaluation of performance incorporating ―customer satisfaction was carried out
Tertiary institutions came on board in 200708
12 The Research Problem
Until 2004 the foremost obstacles to public service delivery in Kenya had been identified
with inefficient exploitation and use of public resources and a largely lethargic public
service These obstacles had a direct bearing on policy and project implementation and
the conduct of public servants which in turn affected overall performance and service
delivery Yet improvement in operational performance informs the quality accessibility
affordability and speed of public services Performance improvement is engendered when
operations are managed under a performance management measurement and
improvement regime that has an elaborate measurement system because as Osborne et al
(1992) state ―what gets measured gets done According to Brown et al (2001) people
make decisions and do their work at least partly based on how they will be evaluated As
a result they tend to improve in performance aspects that will be measured and rewarded
rather than in un-measured aspects even if these may not necessarily support
organizational goals and customer satisfaction
23
Moreover governments have generally tended to focus on project implementation and
not on the quality of performance They have as a consequence not laid significant
emphasis on improvement in service delivery This study on performance contracting
measurement and public service delivery in Kenya is therefore motivated by the need to
establish and understand the factors that affect and influence improvement in
organizational performance in the public sector and ultimately improvement in the
quality of public service delivery
Many governments have made attempts at improving service delivery across public
activities and finding generally agreeable better measures and ways of reporting on their
performance has been a great challenge over the past three decades The issues of
performance contracting measurement and evaluation are not new phenomena
governments have persistently sought to justify their existence based on their
achievements in service delivery to their citizens As early as the start of the 20th century
efforts to scientifically measure such achievements and efforts have been made but there
is little doubt that the current wave of reform in this area is larger broader deeper and
longer than all previous attempts It has been asserted therefore that the measurement of
government achievement is here to stay (OECD-PUMA 1997 OECD 2005 Talbot
2005) This study set out to investigate and understand the factors that affect and
influence the performance of the public service and the quality of public service delivery
in Kenya
24
Experiences of Africalsquos development over the last two decades have consistently
demonstrated the need for more intensive efforts towards effectively addressing the
continentlsquos major development challenges the degree of which varies from country to
country It is only recently that these countries are realizing that it is competitive
advantage not comparative advantage that drives economic development Competitive
advantage driven by public sector efficiency and effectiveness and customer centric
approach to public sector governance then is the missing link that defines the difference
in performance excellence between virtually resource-deficit countries and resource-
abundant nations mainly in the developing world as shown in Appendix X which
depicts the performance of selected countries against a number of economic indicators
The thrust then is to devise effective systems of qualitative and quantitative performance
management measurement and improvement which can also be domesticated and
replicated in other countries Governments have critical roles to play in the creation of
competitive advantage for respective countries According to Porter (1990) this role
entails acting as a catalyst to encourage and even push companies to raise their
aspirations and move to higher levels of competitive performance stimulating early
demand for advanced products focusing on specialized factor creation and stimulating
corporate rivalry by limiting direct cooperation and enforcing anti-trust regulations
Creation of competitive advantage is the foundation of global competitiveness for a
country
25
Effective execution of the role requires an efficient and effective public service the
performance of which forms the basis for measurement and improvement This then is
about performance improvement driven by an empowered and efficient public service A
number of studies have been conducted across sectors on the concepts of performance
contracting measurement and service delivery In the research findings by March and
Olsen (1989) Peters (1999) and Talbot et al (2004) the impact of different countries
with varying institutional differences on shaping performance practice was an area which
had been almost totally ignored despite the resurgence of institutional-based analysis
which was as yet largely not applied to performance management and measurement
systems
According to the research findings by Talbot (2005) Japan the UK and the USA all now
have well developed systems of reporting government performance results In Japan the
Government Policy Evaluation Act (GPEA) has been active since 2001 in the UK the
Public Service Agreements (PSA) system dates back to 1998 while in the USA the
Government Performance and Results Act (GPRA) has been operational since 1993
There is still need however for research on the best forms and systems for reporting the
results of performance and how they can best be used This study sought to establish the
role that performance contracting and measurement play in influencing organizational
performance and customer satisfaction in public service delivery in the Kenya and the
intervening and moderating effects of respectively political stability and global
competitiveness
26
Early studies have focused on policy evaluation as opposed to performance measurement
as seen in both theory and practice (Blalock 1999) Although the two concepts have the
same basic aim of establishing the effectiveness and efficiency of various forms of public
activity there is a wide gap in the potential synergy between the two approaches
Accordingly the term ―performance referred to all measurement of the results of
government public agencies and programs of activity while policy evaluation tended to
focus on programs Only a few countries have developed more integrated systems that
combine evaluation and performance but it is still not done in most developing countries
(Talbot 2005) Through research within the Kenyan public service this study sets out to
address the contradictions by spotlighting on performance measurement with a more
organizational focus tended towards setting up long-term continuous monitoring
systems which rely slightly more on quantitative approaches and its outputs
According to the findings of a study conducted by OECD-PUMA (1997) Blalock
(1999) Peters (1999) Behn (2001) Talbot et al (2004) OECD (2005) Talbot (2005)
Pollitt (2006) and Radin (2006) addressing major gaps in performance measurement
within the public sector most current literature about the performance systems has been
directed on the types of reporting systems which have emerged for example the focus on
outputs or outcomes and not results like service delivery Most studies have focused on
organizational and behavioral responses to performance policies as opposed to the use of
performance measurement in strategic and operational management including the use of
methods such as the BSCs
27
Observations at the beginning of this chapter alluded to the genesis of the declining
performance of the public sector as emanating from poor exploitation and use of public
resources and a lethargic public service delivery culture Further prior to 2004 there had
been only token efforts at measurement of performance of the public sector focused
primarily on individual employees Organizational performance was in essence not
measured Measurement practices were moreover directed at compliance with
regulations and procedures rather than on results Poor and largely unmeasured
performance resulted inevitably in poor service delivery This study was guided by the
use of the performance measurement results and institutional-based analysis in exploring
service delivery among public institutions in Kenya and explored the proposition that
performance contracting and measurement done right can improve service delivery by the
public sector
13 Research Objectives
The general objective of this study was to establish the relationship between performance
contracting and measurement and public service delivery in Kenya as intervened and
moderated by respectively political stability and global competitiveness The specific
objectives were to
(i) Determine the relationship between performance contracting and measurement
and public service delivery in Kenya
(ii) Establish the intervening effect of political stability on the relationship between
performance contracting and measurement and public service delivery in Kenya
28
(iii) Establish the moderating effect of global competitiveness on the relationship
between performance contracting and measurement and public service delivery in
Kenya
(iv) Establish the joint effect of political stability and global competitiveness on the
relationship between performance contracting and measurement and public
service delivery in Kenya
14 Value of the Study
The outcome of this study is expected impact on a broad spectrum of constituents among
them governments desirous to improve public service delivery practitioners and
academicians in the field of performance measurement and public service delivery
managers of public sector institutions individual public sector employees and the public
who are the beneficiaries of government services The key value lies in the demonstration
in the study that organizational performance influences service delivery and that to spur
organizational performance improvement performance must be measured This
vindicates the assertion by Brown et al (2001) that measurement is a way of getting
people to act in ways that will bring about desired future outcomes and effectively links
the performance of the individual to the performance of the institution It further supports
the observations by Nathan (2009) that performance management practices will continue
to be questionable unless they are rooted in a performance measurement system
The study adds to conventional knowledge in the field by incorporating organizational
and environmental aspects (political stability and global competitiveness) as respectively
key intervening and moderating variables on the relationship between performance
measurement and improvement in service delivery In essence and perhaps more
29
importantly the findings of the study should impact on policy formulation and
implementation in making it easy for policy makers to determine more accurately what to
focus effort and resources on in order to improve service delivery and the role that good
governance political stability and global competitiveness play in the process
15 Chapter Summary
This chapter provides a background of the study by discussing the key variables and their
linkages to the study The nature of the public service is discussed A discussion of the
research problem follows and it elaborates on the conceptual contextual and
methodological gaps that the study intend to fill The purpose of the study is presented
together with specific objectives which involve establishing the relationship between
performance contracting and measurement and public service delivery in Kenya The
chapter also presents the value of the study
30
CHAPTER TWO
LITERATURE REVIEW
21 Introduction
This chapter covers a review of literature in the fields of performance management
measurement and improvement including key selected factors that influence and impact
the relationship between measurement of performance and service delivery The review
vindicates a number of the theoretical underpinnings that inform the role of measurement
on performance improvement and ultimately on service delivery and identifies a number
of unexplored consequences and influence of intermediary factors on the relationship
The chapter includes also a contextual and conceptual framework defining the
relationships between the pertinent variables and which forms the basis of this study
22 Theoretical Perspective
The concepts of performance contracting measurement and service delivery are
grounded in and indeed straddle a number of theories that embrace and give credence to
these precepts This section covers the key theories including the contextual and
conceptual perspectives of the study It explores the broad literature on performance
management measurement and service delivery including historical perspectives of the
precepts and the views of various academicians and practitioners It will be expedient to
note that performance measurement is viewed in this study in the context of performance
improvement and the extent to which it impels improvement in organizational
performance
31
221 Theory of Performance
The Theory of Performance espoused by Don Edgar (1974) is premised on the
perceived enormous potential of humanity to realize extraordinary accomplishments and
goals which they do because as for example JF Kennedy put it in 1962 challenging
Americans to go to the moon the goals are hard and ―hellipbecause that goal will serve to
organize and measure the best of our energies and skillshellip and posits that improvement
in performance can be created through the processes of influencing the performerlsquos
mindset by engaging them in an optimal emotional state immersing the performer in an
enriching environment and engaging the performer in reflective practice
It attempts to explain performance and improvement in performance within the
framework of six concepts comprising the context of performance level of knowledge
levels of skills level of identity personal factors and the level of performance upon
which the performance of an individual or organization is predicated Performance
therefore produces results that can be classified into the following categories quality
increases cost decreases capability increases capacity increases knowledge increases
skills increases identity and motivation increases
The theory views performance as taking a complex series of actions that integrate skills
and knowledge to produce a valuable result It accordingly informs learning through
examining the level of performance of the organization Performance is a journey not a
destination and the level of performance is the location in the journey Each level or
location indicates the effectiveness or quality of performance
32
The precepts of the theory of performance are supported in literature by the works of
Tomlinson et al (2002) and Bransford et al (2000) They developed a model for
effective teaching and learning that included knowledge-centered learner-centered
assessment-centered and community-centered components The learner-centered
component involves the performerlsquos mindset while the knowledge and community
centered components allude to the immersion into an enriching environment The
assessment centered component embraces elements of reflective practice Don Edgar
sums up the theory by referring to Wiske (1998) the advocacy by Harvardlsquos Project Zero
that when people learn and grow they are empowered to create results that make a
difference Working and learning together in ways that make the world better has been a
primary goal of higher education throughout the ages
222 Theory of Organizational Performance Management (OPM)
Performance management is a set of techniques used to measure success in meeting goals
in a business context and is used to evaluate specific processes and systems the
performance of departments or the performance of individual employees The theory of
organizational performance management applies this approach to an organization as a
whole assessing progress toward goals and identifying and adjusting factors which
hinder progress OPM is categorized as a proactive approach to promoting progress
toward goal achievement in a business environment Where an OPM approach is in place
techniques for monitoring progress including the performance of systems subsystems
departments and employees are an integral part of the conduct of business
33
OPM runs recurring analyses of systems and makes improvements wherever possible
with the intention of avoiding performance gaps that may impact the achievement of
defined goals The approach is based on analyzing aggregates of performance data in
order to measure progress toward defined goals Top management must set the goals for
for example increased earnings increased sales higher productivity reduced cost or
improved safety OPM identifies the data relevant to progress toward such goals OPM
will search proactively for possible improvements to systems OPM solicits participation
from both managers and employees engaged in the relevant processes and from
customers and other stakeholders It also conducts reviews of best practices in the field
including new technological developments and employs data analysis to identify deficient
operating systems where improvements are needed
After the process of analysis and validation improvements are selected for
implementation These may be improvements to the system technical or staff
performance Managing implementation may include training programs consultation
with affected staff safety reviews if the improvement calls for changes in the workplace
environment and a generally controlled and measured release of the planned changes It
should also include preparations to monitor the effectiveness of the improvement once it
is in place
OPM has been criticized for vagueness and imprecision It has been suggested that the
performance of the organization is sometimes defined not in terms of tangible
measurable goals but as Barbara Czarniawska-Joerges and Pasquale Gagliardi put it
34
more like a platonic ideal Others such as Steven M Jex have argued that it is
problematic to impose a performance management and reward system on an
organization as such systems were originally designed with the performance and
behavior of individuals in mind
223 Theory of Change
The Theory of Change is a specific type of methodology for planning participation and
evaluation that is used in the philanthropy not-for-profit and government sectors to
promote social change The Theory of Change emerged in the 1990s at the Aspen
Institute Roundtable on Community Change as a means to model and evaluate
comprehensive community initiatives The Theory defines long-term goals and then
bends backwards to identify preconditions necessary for meeting the goals and explains
the process of change by outlining causal linkages in an initiative ie its shorter-term
intermediate and longer-term outcomes The identified changes are mapped as the
―outcomes pathway showing each outcome in a logical relationship to all the others as
well as the chronological flow The links between outcomes are explained by ―rationales
or statements of why one outcome is thought to be a prerequisite for another The
innovation of Theory of Change lies (i) in making the distinction between desired and
actual outcomes and (ii) in requiring stakeholders to model their desired outcomes before
they decide on forms of intervention to achieve those outcomes
The Theory of Change is a form of critical theory that ensures a transparent distribution
of power dynamics Further the process is necessarily inclusive of many perspectives and
participants in achieving solutions The Theory can begin at any stage of an initiative
35
depending on the intended use A theory developed at the outset is best at informing the
planning of an initiative Having worked out a change model practitioners can make
more informed decisions about strategy and tactics As monitoring and evaluation data
become available stakeholders can periodically refine the Theory as the evidence
indicates A Theory of Change can be developed retrospectively by reading program
documents talking to stakeholders and analyzing data This is often done during
evaluations reflecting what has worked or not in order to understand the past and plan for
the future
Theory of Change emerged from the field of program theory and program evaluation in
the mid-1990s as a new way of analyzing the theories motivating programs and
initiatives working for social and political change Carol Weiss popularized the term
―Theory of Change as a way to describe the set of assumptions that explain both the
mini-steps that lead to the long-term goal of interest and the connections between
program activities and outcomes that occur at each step of the way
She challenged designers of complex community-based initiatives to be specific about
the theories of change guiding their work and suggested that doing so would improve
their overall evaluation plans and would strengthen their ability to claim credit for
outcomes that were predicted in their theory She called for the use of an approach that at
first glance seems like common sense lay out the sequence of outcomes that are
expected to occur as the result of an intervention and plan an evaluation strategy around
tracking whether these expected outcomes are actually produced Her stature in the field
and the apparent promise of this idea motivated a number of foundations to support the
36
use of this technique later termed ―the Theory of Change approach in the evaluation of
community change initiatives In the years that followed a number of evaluations were
developed around this approach fueling more interest in the field about its value and
potential application
In the early days of Theory of Change Anne Kubisch and others established three quality
control criteria These are plausibility feasibility and testability Plausibility refers to the
logic of the outcomes pathway whether it makes sense and whether the outcomes are in
the right order It also attempts to answer the questions are the preconditions each
necessary and collectively sufficient to reach the long-term outcomes and ultimate
impact are there gaps in the logic Feasibility refers to whether the initiative can
realistically achieve its long-term outcomes and impact Does the organization have
adequate resources Does it need partners Does the scope expectations or timeline of
the theory need adjustment Testability refers chiefly to the indicators Are they solid and
measurable Will they yield sufficient information to evaluate the success of the
initiative Will they be convincing to necessary audiences In addition to these three
basic quality control criteria Act Knowledge has added another key criterion
Appropriate Scope An actionable theory that can be communicated to the key audiences
is dependent in part upon choosing the right scope broad enough to leave no gaps in the
model yet focused enough on the opportunities and resources at hand Appropriate Scope
also integrates the evaluation concept of accountability Many Theory of Change
outcome pathways include an accountability ceiling often a dashed line drawn across the
pathway that separates outcomes the organization will monitor and claim credit for
attaining from higher-order outcomes that are beyond its power to achieve for example
―a just society
37
The ultimate success of any Theory of Change lies in its ability to demonstrate progress
on the achievement of outcomes Evidence of success confirms the theory and indicates
that the initiative is effective Therefore the outcomes in a Theory of Change must be
coupled with indicators that guide and facilitate measurement Indicators may be said to
operationalize the outcomes that is they make the outcomes understandable in concrete
observable and measurable terms As the origins of Theory of Change lie in the field of
evaluation and monitoring developments over the years have ensured that the Theory
continues to be an invaluable method to conduct evaluations of many different types of
projects and organizations Often posing theory-based evaluation questions helps to focus
evaluation efforts on key concerns As well there may be a need to pick the right
indicators from among the many available and one can use ―monitoring questions to
select the indicators that will be most helpful
The use of Theory of Change in planning and evaluation has increased exponentially
among philanthropies government agencies international NGOs the UN and many
other major organizations in both developed and developing countries This has led to
new areas of work such as linking the Theory of Change approach to systems thinking
and complexity Change processes are no longer seen as linear but as having many
feedback loops that need to be understood Consequently Theory of Change is
strengthening monitoring evaluation and learning They are also helping to understand
and assess impact in hard to measure areas such as governance capacity strengthening
and institutional development Innovations continue to emerge
38
Theory of Change is essentially a comprehensive description and illustration of how and
why a desired change is expected to happen in a particular context It is focused in
particular on mapping out or ―filling in what has been described as the ―missing middle
between what a program or change initiative does (its activities or interventions) and how
these lead to desired goals being achieved It does this by first identifying the desired
long-term goals and then works backwards to identify all the conditions that must be in
place (and how these relate to one another causally) for the goals to occur These are all
mapped out in an outcomes framework
The outcomes framework then provides the basis for identifying the type of activity or
intervention that will lead to the outcomes identified as preconditions for achieving the
long-term goal Through this approach the precise link between activities and the
achievement of the long-term goals are more fully understood This leads to better
planning in that activities are linked to a detailed understanding of how change actually
happens It also leads to better evaluation as it is possible to measure progress towards
the achievement of longer-term goals that goes beyond the identification of program
outputs
224 Resource-Based Theory of Competitive Advantage
The Resource-Based (RB) Theory has been described as an ―inside-out process of
strategy formulation that begins by looking at what resources the firm possesses This is
followed by assessment of the potential of the resources for value generation and ends up
by defining a strategy that will allow the capturing of maximum of value in a sustainable
way The process involves identifying and classifying the firmlsquos resources and
appraising strengths and weaknesses relative to competitors identifying opportunities for
39
better utilization of resources appraising the rent generating potential of resources and
capabilities in terms of (i) their potential for sustainable competitive advantage and (ii)
the appropriateness of their returns identifying the firmlsquos capabilities What can the firm
do more effectively than its rivals identifying the resource inputs to each capability and
the complexity of each capability selecting a strategy which best exploits the firmlsquos
resources and capabilities relative to external opportunities and identifying resource gaps
which need to be filled It is therefore about investing in replenishing augmenting and
upgrading the firmlsquos resource base including capabilities resources strategy and
competitive advantage
225 Theoretical Foundations of Performance Improvement
Swanson (1999) contends that performance a highly ubiquitous and generalizable
phenomenon is mediated through human expertise and human effort The ubiquity of
performance is evident in everyday human discourse with references to such terms as
organizational performance team performance individual performance hardware system
performance vehicle engine performance and even class performance According to the
American Heritage College Dictionary to perform is to fulfill an obligation or
requirement to accomplish something as promised or expected Accordingly
performance is the valued productive output of a system in form of goods and services
The goods and services viewed also as units of performance and the fulfillment of the
goods and viewed as performance units are measured in terms of quantity time and
quality feature measures In exploring the theoretical foundations of performance
improvement Swanson (1999) makes reference to the key contributors to the individual
and process improvement performance perspectives focusing on the core external
40
economic political and cultural forces that drive organizational performance agenda and
formula and proposes a discreet and logical set of theories as the foundation of
performance improvement These theoretical domains are economic theory
psychological theory and systems theory
The economic theory foundation requires that performance improvement must include
direct analysis action and measurement of outcomes That over time organizations must
generate more income than they spend in order to exist This facet of the theory is
underpinned by three perspectives These are the scarce resource theory sustainable
resource theory and the human capital theory The scarce resource theory postulates that
there are limitations to everything and this requires that prudent choices are made
regarding the manner in which capital will be employed and allowing forecasted return
on investment to guide decisions on choices between options Swanson and Gradous
(1988) The sustainable resource theory incorporates the additional concerns of the long
term versus short term agenda and recognizes the dominance of competitive advantage
over comparative advantage premised on human brain power (Thurow 1993) The
human capital theory recognizes the softer strategic issues of training health and medical
care the virtues of honesty punctuality and others such as integrity as investments in
capital with valuable returns that can be calculated The theme of this theory then is that
because performance improvement takes place in economic entities referred to as
organizations performance improvement must of essence invoke economic theory as its
basis Further as Drucker (1964) observed management theories and methods must be
properly viewed as useful derivatives of economic theory
41
The psychological theory perspective addresses the core understandings to human
behavior and learning and recognizes the immense leverage value that performance
improvement initiatives can draw from such concomitant theories as theories of
motivation learning group dynamics behavioral and social psychology The
psychological theory is based on three perspectives These are the Gestalt psychology
behavioral psychology and cognitive psychology (purposive behaviorism) The Gestalt
psychology focuses on the holistic view of individuals and their need for holistic based
on the believe that people add something to experience that is not contained in the
sensory data and that they understand the world in meaningful wholes (Hergenhahn amp
Olson 1993) Behavioral psychology relates to the study of actual human behavior and
suggests that individuals respond the only way they can based on their capacity
experience and the present forces working on them In contrast cognitive psychology is
about purposive behaviorism that attempts to explain goal-directed behavior and the
notion that human beings organize their lives around purposes The gist of this
perspective is that since performance improvement takes place in organizations that are
psychologically framed by those who establish and operate them performance
improvement must then call on psychology as a core (Bereiter amp Scardamalia 1993
Dubin 1971) According to Bereiter amp Scardamalia 1993 and Ilgenamp Klein 1990)
performance cannot be improved if people choose not to perform or do not make
significant and persistent and that workplace systems and systematically designed
learning experiences provide a sustainable foundation for performance improvement
Theories of learning motivation information processing and other psychological theories
therefore comprise a core theoretical foundation
42
Systems theory deals with systemic disconnects that affect performance adversely such
as failure to clearly specify expected outcomes of an organization and not having a
clearly defined performance improvement system This theory is made up of a collection
of general concepts principles tools problems and methods associated with all manner
of systems and comprises threes theory perspectives These are the general systems
theory chaos theory and the futures theory The general systems theory makes reference
to inputs processes outputs and feedback and the limitations of a single personality
theory in predicting human behavior (Von Bertalanffy 1962) Boulding (1956) states that
a single theory from a single field of study cannot reach a satisfactory level of theory
generality and proceeds to refer to a spectrum of theories or system of systemslsquo to
perform the function of a gestalt in theory building (Boulding 1956) Chaos theory
makes reference and studies phenomena that are unsystematic and which therefore do not
follow the rules The futures theory is about planning for the future in uncertain
conditions and liberating peoplelsquos insights (Schwartz 1991 9) It may be viewed as
essentially managing risk and the unpredictable vagaries of the operating environment
The futures theory prepares organizations to cope with the future uncertainties and is
therefore critical for sustainable performance improvement
The moral here is that since performance improvement happens in organizations that can
be categorized as systems functioning within an ever-changing environment the systems
theory is critical (Buckley 1968 Gradous 1989 Senge 1990) Further engineering and
technology theories should be viewed as useful derivatives of systems theory (FitzGerald
amp FitzGerald 1973 Davenport 1993)
43
23 Performance Contracting and Measurement
Performance contracting as it is known and implemented today is essentially a
management tool that identifies organizational goals decomposes strategic objectives
into measurable performance indicators and targets and defines objective methodologies
for measuring progress towards achievement of the targets It therefore encapsulates the
full range of the key attributes of managing measuring and improving performance To
this extent the performance contracting system is fairly sensitive to transactional
relationships across performance levels (that is individual group organizational and
external impact) and contexts (Guerra-Loacutepez amp Hutchinson 2013)
Viewed from this dimension performance contracting is rated along with any
accomplished Performance Management Measurement and Improvement System
(PMMIS) In this perspective and within human resource management and allied fields
performance management is typically defined as a set of ongoing integrated activities
that move beyond isolated performance appraisals to strategically measure manage and
develop human performance within the context of organizational strategy and goals
(Aguinis 2007) Nathan (2009) however cautioned that performance measurement
should not be confused with performance management but should instead be seen as a
prerequisite for effective management
The rationale for this distinction is adequately captured by a number of researchers
Aguinis (2007) Aguinis et al (2011) Biron et al (2011) Hantula (2011) Nankervis and
Compton (2006) Pulakos and OlsquoLeary (2011) are in agreement that although
organizational use of PMSs is widespread dissatisfaction among both management and
44
employees is also high and the value addition questionable Performance management
has the potential to generate significant value for organizations but it is frequently
ineffective because it is often viewed skeptically by employees typically requires a
significant investment of resources and capital and may actually undermine strategic
improvement when implemented poorly (Aguinis 2007 Biron et al 2011 Pulakos amp
OlsquoLeary 2011) These findings can however be traced back to both poor measurement
of important performance indicators and consequently poor alignment to performance
management interventions
Performance measurement is a central mechanism in both assessment and evaluation
which provides the required data for identifying the most appropriate interventions to
measurably improve performance (Guerra-Loacutepez 2008 2010) The robustness of
performance management including its capacity to influence performance is therefore up
- scaled by rooting it in a system that quantifies performance and provides evidence-
based data that is a performance measurement system Nutt (2007) opines that beyond
implementing research findings to improve performance there is a critical requirement to
implement evidence-gathering practices into performance management Nutt (2007) cites
a variety of studies that indicate intelligence gathering is the most over-looked step of the
decision making process In a different study Nutt (2008) compared the success of
organizational decisions among three groups and found that those who made decisions
based on the use of quantified performance data were significantly more successful than
those that made decisions on the basis of personal hunches or feelings or on the basis of
consensus of opinions of others This does not suggest that the two latter perspectives do
not have their utility rather it suggests that they must be triangulated with independently
45
verifiable performance data It can be safely concluded therefore that performance
measurement is at the heart of managing and improvement in performance (Rummler
2004) yet according to the research it is often over-looked (Clark amp Estes 2000
Guerra-Loacutepez amp Leigh 2009)
Clark and Estes (2000 48) noted that highly regarded research groups who surveyed
performance improvement solutions found that a huge gap exists between what we think
we accomplish and what scientific analyses say we accomplished These authors cite a
number of findings from the National Academy of Science the National Research
Council and other independent groups including the fact that the majority of
organizational change initiatives are quickly abandoned transfer of performance
solutions shows that even though they may work once they almost never work in other
organizational contexts because they are not evaluated one-third of performance
feedback strategies fail and another third make performance worse and successful
performance improvement interventions do exist but are rarely integrated into the
commonly used performance solutions PMSs provide the information that drives
performance management processes and are therefore of critical importance to an
effective and efficient PMS (Bititci et al 1997)
These accounts bring out succinctly the observation that the core ingredient that impels
performance improvement in a performance contract is performance measurement
Indeed in many countries including Kenya there is no distinction between performance
contracting and performance measurement as their design and development overlap
Neely et al (1995) described typical process for developing a performance measurement
system as shown in the table below
46
Table 21 Steps in Developing a Performance Measurement System
Step Action
1 Clearly define the firmlsquos mission statement
2 Identify the firmlsquos strategic objectives using the mission statement as a guide
(Profitability market share quality cost flexibility dependability and innovation
3 Develop an understanding of each functional arealsquos role in achieving the
Various strategic objectives
4 For each functional area develop global performance measures capable of
defining the firmlsquos overall competitive position to top management
5 Communicate strategic objectives and performance goals to lower levels in the
organization Establish more specific performance criteria at each level
6 Assure consistency with strategic objectives among the performance criteria used
at each level
7 Assure the compatibility of performance measures used in all functional areas
8 Use the performance measurement system
9 Periodically reevaluate the appropriateness of the established performance
measurement system in view of the current competitive environment
To sustain the system additional requirements in the development of a performance
measurement system include providing a maintenance structure involving key users
securing top management and employeeslsquo support ensuring clear and explicit objectives
and setting timescales This sequence is wholly similar to the sequence employed in the
design and development of the performance contracting system in Kenya
A number of researchers have argued that performance management research in
particular suffers from a weak theoretical foundation (Buchner 2007 Claus amp Briscoe
2009 Hantula 2011) Others argue that performance management research is too limited
to positivist frames that investigate on a particular tool or approach (McKenna et al
2011 Thorpe amp Beasley 2004) Yet despite this reliance on prescription human
resource research findings are not being adequately integrated into the work of
practitioners which may be due to differences in goals interests or access (Aguinis amp
47
Pierce 2007 Deadrick amp Gibson 2009 Rynes et al 2007) The resulting disconnection
between research and practice also underscores the necessity for a meaningful model of
performance management that is both theoretically sound and attendant to the needs of
practitioners and sensitive to transactional relationships across performance levels
Guerra and Alisa (2013) state that among the themes on performance management that
have been pursued is one that centers on organizational factors that foster effective
performance management In the quest for achievement of results and excellence in
performance it is important to explore the organizational factors that impel effective
performance management Rather than focusing on aspects of the performance
management system itself this line of inquiry investigates contextual circumstances that
may be associated with successful implementation of performance management
programs
Biron and colleagues (2011) drew on signaling theory to examine organizational
practices that influence performance management in 16 high-performing global firms
and found that strategically and tactically focused goals senior management
involvement and robust organizational communication were conditions that appear to
support performance management efforts Pulakos and OlsquoLeary (2011) argue that the
managerndashemployee relationship is a primary facilitator of effective performance
management thus organizations should focus on strengthening this connection rather
than continuing to fruitlessly tinker with formal PMS features This is echoed by Den
Hartog et al (2004 563) who assert that managers and supervisors play a key role in the
enactment of performance management As such their consistency fairness and skill in
using tools will to a large degree determine whether such tools indeed generate positive
effects on commitment and employee performance
48
Performance contracting entails execution of a performance agreement between a
principal or a superior authority acting as the owner of an agency and a subordinate or
agent for the purpose of impelling the delivery of targeted results effectively and
efficiently In the public service performance contracting is defined as the execution of a
freely negotiated performance agreement between government acting as the owner of a
public agency and the management of the agency The performance agreement more
commonly known as PC consists of a range of management tools used to define
responsibilities and expectations between parties to enable them achieve targeted and
mutually agreed results The agreement therefore specifies what needs to be achieved
expected levels of achievement timelines and the evaluation and reporting
methodologies It is also expected to clearly specify the intentions obligations and
responsibilities of the two parties (Trivedi 1994) It is an attempt to move the public
sector style of management away from ―control by procedures to control by results and to
simultaneously increase the quality of the controls while reducing the quantity of the
controls
According to Trivedi (1994) there is consensus among public enterprise professionals and
practitioners that the rhetoric of privatization has far exceeded the reality that the
dramatic turnaround of public enterprise performance in such diverse countries as South
Korea Pakistan and France is testimony to the achievement of the policy of performance
contracting According to an OECD report of 1999 ―Les Contrats de Performance the
unifying theme in performance contracting arrangements is in its value as a management
tool to promote savings effectiveness and responsiveness These key objectives are
expressed in terms of performance expectations linked to budget (inputs) service
49
(outputs) impacts (outcomes) and management (corporate capacity) In countries where
the system is employed achievement of these objectives is vindicated including capacity
for performance measurement and improvement in service delivery According to the
report PCs first emerged in Europe in the 1960lsquos and 1970lsquos in the context of high
inflation and high unemployment when corporate governments such as France and the
United Kingdom used public enterprises to counter these problems
The French Government introduced stability contracts (contrats de stabilite) to impose
price controls on major public enterprises in 1965 In 1967 the Nora Report proposed the
use of program contracts (contrats de programme) which would define goals increase
managerial autonomy set financial targets and obligate the government to pay for the
non-commercial activities and policies imposed on the enterprise The first program
contracts were signed in 1970 with the Societe Nationale de Chemins de Fer Francais
(SNCF) the French National Railway and the Electricity Utility (EDF) in 1969
followed by the Radio and Television Utility (ORTF) in 1971 These early contracts were
however abandoned following the oil crisis of 197374 which undermined the ability of
either party to fulfill their commitments (Trivedi 1988 1990 1994)
The typical PC is made up of three subsystems the first one is the performance
information system which ensures symmetry of information between the principal and
the agent during the process of negotiating performance targets This subsystem also
defines the frequency and modalities of periodic continuous or end of year reporting of
performance The second is the performance evaluation system whichconsists of a
number of steps relating mainly to the development of criteria for evaluating
50
performance The latter focuses on static efficiency which determines whether the
agency is making optimum use of its resources dynamic efficiency which addresses
decisions that entail costs outlays in the present but whose benefits are realized in the
future project implementation that seeks to establish whether projects are being
implemented efficiently achievement of non-commercial objectives which relates to
development of systems to measure non-commercial activities and the computation of
composite scores The third is the Performance IncentivesSanctions System whichrelates
rewardssanctions to measurable performance The PC as a Performance Management
Measurement and Improvement System (PMMIS) is therefore defined by the three
subsystems as shown in Figure 21
Figure 21 Performance Management Measurement and Improvement System
Source Memorandum of Understanding (Trivedi 1994)
The architecture of the PC in Kenya comprises a narrative made up of a preamble that
sets out the precepts and coordinates within which the parties enter into the agreement
and six consecutive sections describing the vision mission and strategic objectives
Institutional framework (the
―who) should measureevaluate
Criteria (the ―how) to
measureevaluate
Performance
incentivessanctions
system
Performance
measurementevaluatio
n system
Performance
information system
Performance Contract
51
listing commitments and responsibilities of the agent listing the commitments and
obligations of the principal defining modalities of reporting and information flows
defining duration of the contract and detailing signatories to the contract The PC more
importantly includes a PC matrix with six management perspectives (referred to as
performance criteria) (Appendix III) the citizenslsquo service charter (Appendix IV) as a
separate tool that serves to operationalize the critical performance criterion of ―service
delivery and the measurement of the ―customer satisfaction sub-indicator and a
detailed measurement and evaluation methodology Administration and sequencing of the
Kenyan version of performance contracting presumes the existence of a strategic plan and
involves the steps depicted in the Figure 22
Figure 22 Performance Contracting Cycle
Source Performance contracting training modules (2011) Office of Prime Minister
Government of Kenya
52
The cycle begins with the organization mobilizing for the purpose of setting targets
Since commencement of the process presumes existence of a strategic plan (in the
absence of a strategic plan its (strategic plan) development within the contract year
should be featured as a performance indicator with significant weighting under the ―non
ndash financial perspective) target setting should draw principally from the strategic
objectives in the strategic plan taking cognizance of the detailed Strengths Weaknesses
Opportunities and Threats (SWOT) analysis that must have informed the decision on the
strategic direction to achieve the vision Moreover setting of targets must involve as
broad a spectrum of employees as possible in order that each individual section and
division is able to identify and own their niche early enough for effective strategy
execution
The next phase in the sequence is drafting the PC and proceeding to negotiate it with the
external experts referred to as Ad Hoc Negotiation Task Force Negotiation is carried out
primarily for the purpose of ensuring that performance targets are significantly growth -
oriented but realistic that every key operational area is catered for each indicator is
taggedlsquo to a strategic objective and generally that the design of the PC is consistent with
the guidelines for implementing PCs This phase is succeeded by vetting a term that
refers to the process of scrutinizing negotiated PCs to establish conformity to the policy
on performance management The latter is therefore a quality assurance exercise and is
carried out by the core performance contracting coordinating unit assisted by
independent external experts representing the principal Then follows the implementation
phase which lasts for the 12 months coinciding with the financial year during which
performance is monitored continuously or periodically by the principal or his agents At
the end of the contract year performance is measured by a team of external experts and
the results subsequently made public
53
As observed negotiation of PCs and measurement and evaluation of performance are
carried out by independent experts drawn from outside the public service These are
external stakeholders selected from the business community professional associations
academia civil society other non-state actors and retired public servants but in all cases
the best in their respective areas of competence Involvement of external stakeholders in
both negotiation of performance targets and measurementevaluation of performance in
the public service is a deliberate strategy to secure public awareness support and
ownership of key performance improvement service delivery and project implementation
initiatives as the external experts (who are not active public servants) represent the
public and also double up as consumers of public services It also gives credibility and
objectivity to the performance contracting system and the results of evaluation (in that
government does not set its own performance standards andor evaluate its own
performance) while at the same time taking advantage of expertise that may
occasionally be in short supply in the public service A copy of a model PC comprising
the main narrative a PC matrix and a citizenslsquo service charter are shown in Appendices
II III and IV
The period following completion of the study has seen the structure of the performance
contract remaining largely the same except for the addition of a seventh performance
criterion referred to as ―National cohesion and national values In addition the
weighting of individual performance criterion has been adjusted assigning higher and
uniform weighting of 50 on the ―operations criterion across the board from 25 for
ministries and 40 for public universities This change saw a reduction of the weighting
of the ―finance and stewardship and ―service delivery criteria This is significant
because it in essence downgrades the hitherto higher focus and emphasis on service
delivery These adjustments are indicated in the tables below
54
Table 22 Assignment of Weights over Study Period
Criterion Ministry Local
Authority
State Corporation
Tertiary
institution
Commercial Non-
commercial
Public
university
1 Finance amp
1stewardship
20 20 45 20 20 20
2 Non-financial 15 15 10 15 15 15
3 Service
delivery
25 25 - 20 10 25
4 Operations 25 25 30 25 40 25
5 Dynamic
qualitative
10 10 10 15 10 10
6 Corruption
eradication
5 5 5 5 5 5
Table 23 Assignment of Weights after Study Period
Criterion State corporation
(commercial)
All other agencies
1 Finance amp stewardship 35 10
2 Non-financial 10 15
3 Service delivery 15 10
4 Operations 25 50
5 DynamicQualitative 5 5
6 Corruption Eradication 5 5
7 National cohesion and national values 5 5
The adjustments may have been inevitable with the advent of the new constitution with
the additional criterion motivated by the rising polarization among Kenyan communities
Other post-study developments include the signing arrangements where HE the
President signs with the Cabinet Secretaries and Cabinet Secretaries sign with the Boards
of Directors of downstream agencies The case of Departments is a departure from
55
previous practice where Permanent Secretaries would sign with the Head of the Public
Service with the Prime Minister endorsing the contracts and the parent Permanent
Secretaries subsequently signed with Boards of downstream agencies This is the result of
the shift of executive power and functions from Permanent Secretaries to Cabinet
Secretaries as provided in the constitution
231 Reasons for Measuring Public Sector Performance
Neely (2007) explored the reasons for measuring public sector performance in the
provision of public services and identified five reasons These were to establish what
works in order to ensure that policy stands on a solid base informed by evidence (Bird et
al 2003) This therefore is done primarily on behalf of policy makers to identify
competencies which entails comparing performance with other providers other
institutions or some standard or norm in order to bring out good or bad performers The
focus is more on howlsquo people have performed and less on what they do (Bird et al
2003) This is done on behalf of government and policy makers who require data to
facilitate comparison to support public accountability in consideration that public
services are funded by tax payers who are hence entitled to know the manner in which
their taxes are being utilized (Bird et al 2003) To fulfill the need for central government
to exercise control over the services for which it is responsible and which are rolled out
using tax revenue (Hofstede 1981) This serves the interests of government and policy
staff who seek to retain central control of decentralized services and is done by
introducing performance targets against which progress and performance are measured
and symbolic action to enable the political class to engage in activity that reflects their
contract with the electorate (Neely 2007)
56
It is conceivable that performance measurement can be employed for more than one of
the five reasons so long as there is clarity of vision with reasons and objectives for
introducing and effecting the measurement Despite the observed benefits however
performance measurement can conceivably be prone to unintended side effects and
dysfunctional behavior particularly in the process of assessing the outputs and outcomes
of activities programs and projects Smith (1995) lists a number of dysfunctional
behavior types that emerge when quantitative performance indicators are introduced in
public service delivery and publicized These are tunnel vision - which sees managers
focusing only on the quantifiable elements and overlooking the multidimensionality of
public sector performance criteria sub-optimization- entailing concentration on the
narrower local objectives and ignoring the bigger picture that is encapsulated in corporate
objectives myopia- this is about short-termism the pursuit of short term targets in the
place of longer-term objectives
Measure fixationndash this is essentially emphasizing only on measures of success rather than
the underlying objectives and overlooking outcomes that may be difficult to measure
misrepresentation- a situation where data forming parts of indicators is distorted and
manipulated to create a desired impression with targeted audiences misinterpretationndash
this results from misunderstandings because of the complex and monolithic nature of
public agencies It may be brought about by capacity challenges or mix-ups owing to the
size of operations gamingndash this entails manipulation of behavior to secure desired
advantages for example setting soft targets to attain high scores and ossificationndash this is
about paralysis resulting from inflexibility in evaluation for example insistence on
retaining ambitious targets even when the operating environment and other
uncontrollable factors have changed
57
Measurement and evaluation of performance in Kenya focuses primarily on how
effectively and efficiently management have steered the affairs of an agency to deliver
agreed and defined value and is carried out by computing weighted and ultimately
composite scores using the formula
Managerial Performance = Institutional Performance plusmn Exogenous Factors
The overriding objective of performance contracting on the other hand is to ensure
achievement of results that lead in turn to achievement of overall goals while infusing
efficiency in the operational processes The system is fully grounded on performance
measurement and relies on the latter to enforce accountability at the individual and
corporate levels It is indeed performance measurement and the results thereof that
underwrite the utility of performance contracting For the purpose of this study therefore
performance contracting and measurement are denominated into performance
measurement which is the core essence of performance contracting
Khan and Shah (2011) give a detailed exposition of the evolution of performance
measurement According to them the origin of performance measurement can be traced
back to the late 13th
century in Venice when double-entry accounting was introduced to
settle transactions among traders (Johnson 1981) Onwards financial measures for the
most part were used to develop cost and management control systems (Kaplan 1983
Johnson amp Kaplan 1987 Keegan at al 1989) In late 1980s after globalization of trade
and the emergence of the world economy markets became competitive and customers
were more demanding the focus thus shifted from productivity to quality time cost
flexibility and customer satisfaction (Hayes amp Abernothy 1980 Slack 1983 Kaplan
1984) This was the time when researchers highlighted the deficiencies in the traditional
58
financial measures and criticized it to be inappropriate for measuring business
performance Johnson and Kaplan (1987) were among the first to suggest a shift from
cost accounting based performance measurement approach to a more integrated
performance measurement approach following criticisms advanced against the traditional
performance measures
The shortcomings in traditional measures resulted in a performance measurement crisis
which led to a revolution in the existing PMSs (Eccles 1991 Neely 1999) The
emergence of balanced performance measurement frameworks marked the start of the
second phase of performance measurement evolution The term ―balanced refers to
using measures that give a holistic view of the organization (Kaplan ampNorton 1996)
During this era the need to use non-financial measures for monitoring performance and
motivating employees was stressed (Santori amp Anderson 1987) and included the non-
financial measures for being timely measurable precise meaningful an aid to continual
improvement consistent with companylsquos goal and strategies and flexibility (Medori amp
Steeple 2000) Moreover researchers accentuated the importance of aligning financial
and non-financial measures with the organizationlsquos strategy (McNair amp Mosconi 1987)
Throughout the 1990s researchers were busy designing models and frameworks as a
result of which a number of frameworks were developed such as the BSC (Kaplan amp
Norton 1992) the PP (Neely et al 2002) SMART (Lynch amp Cross 1991) the RDF
(Fitzgerald et al 1991) the PMM (Keegan et al 1989) and the PMQ (Dixon et al
1990)
59
As Neely (2007) puts it the question that operations managers wanted their performance
measurement systems to help them answer was about operational efficiency Further a
significant stream of literature at the time was associated with the measurement of total
factor productivity Too often managers hitherto relied on partial measures of
productivity mainly labor productivity Several authors questioned the veracity of single-
dimensional measures of productivity on the grounds that they provided only a partial
picture of firm performance (Craig amp Harris 1973 Mundel 1987) In reality the
productivity a firm achieves is a function of how efficiently it uses all its inputs labor
capital technology and energy to produce outputs (Hayes amp Clark 1986)
According to Neely 2007 by late 1970lsquos the field of operations management under
which measurement of operations performance was carried out was in turmoil following
a crisis of confidence (Buffa 1980 Chase 1980) Throughout the 1960s and 1970s
operations research was effectively used in operations management Operations research
techniques such as linear programming and data envelopment analysis were applied to
pragmatic operations management problems such as lot sizing scheduling and production
control (Charnes et al 1978 Buffa 1980 Chase 1980 Banker et al 1984) Neely
(2007) states that the 1980s saw a rise in the popularity of the ―quality gurus most
notably Crosby Deming Feigenbaum and Juran
These developments resulted in a resurgence of interest in the measurement of operations
performance especially in terms of the five operations performance objectives of quality
dependability speed cost and flexibility originally proposed by Skinner (1969) The five
objectives essentially under-pin much of the work on performance measurement
undertaken subsequently by the operations management fraternity The notable
60
characteristics of these objectives are that they are all multidimensional and trade off with
one another the extent to which is time and context specific Quality for example is not
merely conformity to established specifications it should encompass other dimensions
such as performance (how well the product performs its primary functions) features
(what additional features the product contains) reliability (how long the product lasts
before becoming technically obsolete) serviceability (how easy the product is to service)
aesthetics (the look and feel of the product) perceived quality (the customerlsquos perception
of the productlsquos quality) and value for money (Garvin 1987 Schonberger 1990 Neely
amp Wilson 1992)
Speed on the other hand can refer to the time taken to generate quotations delivery
speed delivery frequency production speed and the time taken to develop new products
(Stalk 1988) Dependability can be extended to refer to schedule adherence (keeping to
plan) delivery performance (whether the product is delivered on time and in full) and
price performance indeed the general ability to live up to promises Flexibility can be
viewed in the context of both range and response flexibility (Slack 1983 1987) The
former is the ability to cope with a wide range of requirements while the latter is the
ability to change quickly There is a whole expansive range of other flexibility
dimensions (Gerwin 1987 Slack 1987) which include material quality (the ability to
cope with incoming materials of varying quality) output quality (the ability to produce
output of varying quality) new product flexibility (the ability to cope with the
introduction of new products) product modification (the ability to cope with the
introduction of new products) product modification (the ability to cope with modified
products) deliverability (the ability to cope with changed delivery schedules) volume
(the ability to cope with changed production volumes) and resource mix (the ability to
cope with different production mixes)
61
In the case of tradeoffs between the objectives high quality can for example be
delivered but potentially at a cost Tight delivery schedules can be met but perhaps only
by investing in additional resources Operations managers constantly strive to find ways
of pushing back the performance frontiers of these five performance objectives by
enhancing their operationlsquos capabilities so that the impact of the tradeoffs can be
mitigated over time The continuous search for enhanced operational capabilities under-
pins for example the manufacturing philosophy of kaizen the continuous improvement
of the operation in the search for new and better ways of delivering performance The
second point to note about the five operations performance objectives is that there are
internal as well as external reasons why organizations might wish to excel at them (Slack
1991)
Higher quality for example allows the organization to deliver potentially more valuable
products Higher quality however also means fewer mistakes hence less rework which
is costly to the operation if it has to be performed Speed means that the organization can
respond to customer requests more rapidly but also that the organizationlsquos capital is tied
up for shorter periods of time in the form of inventories and work in progress Similar
arguments can be made for each of each of the five operations performance objectives
Hence one of the key strategic challenges for operations managers is to decide on which
of the sub-dimensions of the five performance objectives they wish their operation to
excel in and how they can configure the operations to do so The focus on the five
performance objectives was largely fixated on the new perspectives on quality with
Feigenbaum (1961) suggesting that the true cost of quality is a function of three types of
quality cost prevention appraisal and failure costs Neely (2007) further states that with
the advent of Total Quality Management (TQM) emphasis shifted from ―conformance to
specification to customer satisfaction
62
In addition during the 1980s and 1990s period and riding on the work of Skinner on
manufacturing strategy (Skinner 1969) debates in practitionerslsquo and business
conferences in the United States and the United Kingdom highlighted how important it
was for the operations management community to consider how to align performance
measurement systems with operations strategies (Neely et al 1994) This is because as
Neely (2005) observes the bulk of work by the operations management community has
so far focused on performance measurement rather than performance management
despite the fact that measurement on its own delivers little value until the data generated
are analyzed and acted upon
The research and literature in the field of performance measurement has produced a body
of knowledge of best practices in the measurement of organizational activity focused on
what to measure (Danks 2013 Neely et al 2005) Others have advocated for the use of
both in-process and outcome measures or Key Performance Indicators (KPIs) strategic
and operational measures perceptual and tangible measures descriptive and predictive
measures and a balance among strategic workforce customer financial and internal
business indicators to evaluate performance (Bititci et al 1997 Harbour 2009 Kaplan
amp Norton 1996 Neely et al 2002 Poister 2003 Spitzer 2007)
The problem however still remains that very few users of this flurry of data truly
understand the antecedents of excellence the structures and conditions that precede
anticipate or predict excellence in performance (White 2005) Debate has raged about
measurement of such complex phenomena as organizational strategy Above
measurement of strategic initiatives and interventions that organizational leaders
63
commonly use to improve organizational excellence the question is about how
organizational leaders measure such highly complex constructs as organizational strategy
Buzachero et al (2013) categorize the work of strategic improvement into the buckets of
programs projects systems initiatives policies procedures events meetings processes
people and capabilities and tools and affirm that the terms can be used interchangeably
when it comes to how these efforts can be measured or evaluated to determine their
contribution to outcomes
Regardless of the terms used it is generally understood that each of these constructs
represents complex phenomena where multiple parts work together to contribute to the
results of the system making it difficult to partition out or isolate the components that
lead to desirable or undesirable outcomes In some cases measures of improvement
tactics may be operational in nature easier to quantify and report and therefore easier to
track than measures of organizational strategy (Phillips et al 2012) However Hubbard
(2010) reminds organizational leaders that while certain constructs may seem intangible
and not easily measured any construct organizational efforts included can indeed be
measured through specifically designed instrumentation
To develop and use an instrument to measure the ―intangible phenomenon Hubbard
(2010) recommends the following steps firstly decompose the uncertain construct until
certain observable behaviors are identified secondly classify each of the observable
things into a comprehensible framework that can be understood by intended stakeholders
thirdly test and calibrate the instrument to decrease error ensure consistency in its use
and affirm the validity of the causal model and lastly use sampling and other efficient
efforts to collect the appropriate amount of information needed to make critical decisions
64
By employing these critical steps the academic or practitioner can be equipped to assign
value to a complex phenomenon and therefore measure its critical components On the
other hand (McKenna et al 2011 Thorpe amp Beasley 2004) argue that performance
management research is too limited to positivist frames that investigate on a particular
tool or approach and perhaps vindicates the findings by Biron et al (2011) that
―hellipstrategically and tactically focused goals senior management involvement and robust
organizational communication were conditions that appear to support performance
management efforts
24 Performance Contracting and Other Public Sector Performance Measurement
and Improvement Systems
Many business enterprises and the public sector have adopted various systems in
attempts to organize and improve performance These include the traditional
(incremental) budgeting performance budgeting zero-based budgeting and management
by objectives (MBO) While these systems may have varying degrees of impact on
performance they are distinct from the PC but can significantly complement the
processes of performance management measurement and improvement
Among these only zero-based budgeting would be a formidable complement to the
system of PC to the extent of enabling efficient allocation of resources discarding
inefficient obsolete operations avoiding wasteful expenditure and compelling managers
to consider alternative methods of achieving objectives The MBO is perhaps the system
that comes closest to the PC because of its emphasis on greater efficiency through
systematic procedures greater employee motivation and commitment through participation
in the planning process and planning for results instead of planning just for work
65
241 Public Service Delivery
A research study commissioned by the Committee for Public Management Research to
serve the needs of the future development of the Irish public service and published in
1998 by the Institute of Public Administration defined public services as those services
which are mainly or completely funded by taxation Because of this fundamental
premise public services differ from commercial private-sector services in a number
of ways which in turn have important implications for the development of public
service delivery systems The differences are brought about by the distinctive objectives
and constraints of the public sector (Murray 1990)
Public services for one do not normally operate for financial profit or require immediate
payment for goods or services prior to delivery In addition public services are in many
cases not charged directly and in cases where they are charged for they are not usually
sold to customers at commercial prices set to produce profits (see Flynn 1990) As Flynn
(1990) observed certain of the public services established activities may be contracted
out operationally in some countries to private firms but the delivery of such services
continue to be funded from taxation and remain governed by public service criteria
Where private sector companies are contracted to public bodies for the provision of
services charges may be subsidized for social policy reasons
In addition to their primarily noncommercial character public services are often
distinguished by an absolute or at least comparative lack of competition in the normal
market sense of seeking to entice customers away from their competitors or rival service
providers As a result many of the basic features of the commercial marketplace are
66
absent from the delivery of public services Moreover given the regulatory role often
performed by public services such as tax collection law enforcement and provision of
security not only are public services invariably monopolistic or oligopolistic in character
but they can also be mandatory There are in addition different guiding principles for the
public service that pervade decision making management and provision These principles
are mainly equitable treatment and the allocation of resources according to need which
are often prerequisites to quality efficiency and cost effectiveness considerations
Efficiency and cost effectiveness are nonetheless key elements but unlike their
counterparts in the private sector public service customers rarely have the choice of an
alternative competitive supplier
Public and private bodies also differ significantly in their service relationships with
external customers (OShea 1992) Within the market oriented private sector the
relationship between service provider and customer is normally direct and comparatively
straightforward If the service on offer to the customer meets an actual or perceived need
at a competitive price it will normally be demanded and sold In such conditions
customer satisfaction should find expression through the level of sales as supply seeks to
meet that demand The comparative freedom of consumers to choose between competing
service providers to select on the basis of price andor quality as well as to express
satisfaction or dissatisfaction with the service provided means that customer needs are
paramount in services provided by the private sector With regard to the provision of
public services the provider customer relationship is often more complex and indirect
Payment is not normally made directly for the service received and so customer control is
weakened
67
Customer choice is very limited when provision is monopolistic From the providers
viewpoint ability to pay is often not a key determinant of demand and accordingly the
typical market disciplines of price control seen in private enterprise frequently do not
apply Indeed the providers ability to supply is likely to be determined by budgetary
funding outside its direct control The OECD (1996) observes that clients cannot have a
final say on the level and type of service unless they are paying the full cost In other
words the clients views and interests are not the only ones to be considered as the client
represents only one of several stakeholders There is a balance to be struck between the
views of clients and the views of the service provider andor the government on behalf of
more general interest groups such as taxpayers
Funding which comes directly or indirectly from the state is often fixed by annual
allocation through the Exchequer budgetary arrangements Consequently within the
public service mismatches in demand and supply can find expression in longer waiting
lists or the rationing of services The relationship between demand and provision in the
public services can also be perverse in private sector terms As Pollitt and Bouckaert
(1995) point out a fall in demand for a public service can actually be a relief because it
means less pressure more time for professional development research or leisure little or
no reduction on budget An increase in demand by contrast may be very unwelcome
because it means more pressure on staff and facilities but probably no increase in the
budget It is only in recent years that changes in budgeting practices have begun to lessen
these perverse incentives by relating budgets to workload or performance
68
Given such a perverse service provider relationship monopolistic public bodies can be
vulnerable to the development of a vicious circle of low standards in the demand for and
supply of their services The phenomenon of excess demand which leads to queues and
rationing decreases the motivation to improve quality in other ways too If one customer
dislikes the service and goes elsewhere (if they can) there is usually another one
waiting in the queue Large scale desertion may be unlikely because the public provider
occupies a monopolistic or oligopolistic position and there are invariably few if any
alternatives to turn to This restriction on behavior is of course likely to be felt most
acutely by low-income consumers Trapped in a monopolistic system which provides
them with essentials such as health care or education or social security benefits such
customers often form very low expectations for service quality They get used to low
standards as do the service providers (Pollitt amp Bouckaert 1995)
The primary attribute of public service delivery is quality of the service According to
Murray (1990) service quality is defined by such factors as courtesy consideration
information and speed OECD (1987) stressed the following types of characteristic with
regard to service quality timeliness volumeamount accessibilityconvenience
availability accuracy safety appropriateness or suitability as well as such qualitative
aspects as pleasantness and simplicity Equality and legality are acknowledged as priority
issues in service delivery together with the cost of the service referred to and its efficacy
Service quality initiatives reflect a general acceptance of the importance of responsive
and efficient government to economic and social progress within a general context of
budgetary constraints They are also consistent with an ongoing role for the public sector
and with defending and instilling confidence in the public sector (OECD 1996 20)
69
Based on its international experiences up to that time the OECD (1987) suggested that
the key components of responsive service delivery were transparency participation
satisfying user requirements and accessibility In revisiting these key elements nine years
later the OECD (1996) stresses their continuing validity but restates them as clients
participate in or are consulted about decisions on what level and type of service is to be
provided they are informed as to what level and type of services are to be provided and
they can reasonably expect to receive this level of service they have rights of complaint
and redress if the appropriate level of service is not provided and service delivery
agencies are required to set service quality targets and to report their performance against
them and openness and accountability on behalf of the service providers
A key attribute of public service delivery is user involvement The OECD (1996)
identifies five points on the potential spectrum of user involvement with service delivery
information consultation partnership delegation and control The Canadian public
service gives a checklist against which public servants can determine progress in quality
development These are that quality organizations must ask their clients to identify their
needs and expectations continuously meet the needs of their clients while managing their
expectations support active employee involvement in meeting these needs foster
employee innovation to improve processes continuously cultivate a people first
environment where teamwork is valued accept the risk associated with innovation
support a continuous learning environment and provide visible leadership for employees
which is crucial to the success of any quality services initiative
70
In addition the National Quality Institute highlights the following characteristics as
typical of quality service organizations in both the public and private sectors everyone
understands where the organization is heading and understands his or her part in the
process there is respect for people in the organization and all employees are encouraged
to develop their potential the primary focus is on serving clients cooperation and
teamwork are a way of life leaders are fully involved in the quality service programs and
initiatives everyone concentrates on achieving quality there is a focus on continuous
improvement employees appreciate and understand stakeholders expectations and know
how to satisfy them and the organization is driven by quality and innovation (Treasury
Board of Canada 1995)
In administering the movement from unresponsive public service bureaucracies to the
adoption of a clear user focus in the delivery of public services governments have
embraced a variety of approaches often involving the adoption of explicit statements of
standards in the form of service delivery charters The concept of the charter is fairly
universal For example the EU through its Citizens First initiative (1996 onwards)
committed itself to providing accessible information on EU citizens rights to work
live and study in another member state This initiative was later extended to embrace
gender equality consumer protection travelling within the EU as well as buying goods
and services in other member states Information was also provided on what citizens
would do in the event of infringement of these rights
In Portugal the Public Service Quality Charter (1992) was a deliberate attempt by
government to generate confidence in a system of public administration which enjoyed
little public support (CorteReal 1996) In France the Public Service Charter (1992)
71
draws together diverse initiatives to improve the quality of services provided by public
bodies over the preceding decade (Trosa 1995 Pochard 1996) It incorporated a number
of the important characteristics identified by the OECD (1996) namely improved
transparency and simplicity in service provision greater integration in point of delivery
better arrangements for reception of the public arrangements for handling complaints
and redress as well as less centralization of services In taking forward its Declaration of
Quality Services Principles (1994) the Canadian federal government acknowledged not
only its own corporate budgetary and other needs as well as the needs of its customers
but also that all employees contribute to the management and quality of their own outputs
and thus to the success of the organization In the USA President Clinton in 1995
directed every executive department and federal agency to publish customer service
standards in a form readily available to customers These standards cover all operations
that deliver significant services directly to the public including those delivered in
partnership with state and local governments Achievement against these standards is
monitored and results published annually Public bodies are encouraged to survey their
employees for ideas to improve customer service and to take measures to recognize
employees for meeting or exceeding service standards In addition agencies are required
to take action across agency lines of responsibility to serve shared customer groups more
effectively
The Australian government strongly advocated the widespread adoption of government
service charters in order to help shift public bodies from an internal to an external focus
and to open them up more effectively to customers This initiative was intended to cover
all government departments agencies and enterprises providing services to the public
72
with over 115 charters scheduled for completion by mid-1998 (Developing Service
Charters 1997) Perhaps the best known longest running and most frequently cited of
these initiatives is the Citizens Charter (1991) adopted in the UK It is the acknowledged
precursor of many of the initiatives taken in other countries
The citizenlsquos service delivery charter had its debut in Kenya in 2006 Its take off was
slow as has been the case in many countries owing mainly to resistance and skepticism
on the part of public servants In regard to such skepticism Bynoe (1996) concludes that
―Many dismiss the Citizens Charter as a poor attempt at public relations Yet as a policy
vehicle it touches subjects of widespread public concern which politicians ignore at their
peril Ways must be found to render public services more responsive to those who use
them Poor quality services need to be improved and waste eliminated In its fashion the
Charter program has attempted such tasks It has highlighted the need to improve the
standards of public service management and accountability It attempts to transform the
culture of the public service into one which acknowledges the vital importance of user
perceptions of service standards and delivery Any Government whose strategy is to
guarantee robust popular and effective public services must pursue these broad
objectives
There are of course alternative service delivery approaches to the charter One approach
that has been both an alternative and complementary to the charter is the one-stop-shop
One stop shops or citizens service centers are another service improvement tool
different from the various charters One of their specific purposes may be to provide
clients with particular information adapted to the different situations experienced by
73
them One stop shops are being tested and promoted mostly at a local level in
the United Kingdom the Netherlands the Nordic countries and Italy Experiences in
OECD Member countries suggest that a single point of contact for information improves
efficiency with simple referral tasks (Amberg 1996) In Kenya the one stop shop is a
public service delivery approach referred to as Huduma Center that enables citizens and
customers to access the most commonly demanded services under one roof through
integrated electronic service platforms The program aims at transforming public services
to be people-centered professional efficient transparent and accountable The one stop
shop platforms place emphasis on uniform and high customer service standards across all
government services provided under the program
The Huduma Kenya programme is one of Kenya Vision 2030 flagship projects that
integrate the delivery of all transactional and citizen facing public services through one
stop shop platforms The program has five ―one stop shop service delivery channels
including physical facilities where several transactional public services by different
MDAs are provided an online portal that enables customers to transact public services
electronically mobile phone platform that offers m-government services to citizens from
the convenience of their mobile phones a toll free contact center established to provide
services using a single dialling prefix that citizens use to enquire about services offered
by different Government Agencies and an integrated multi-channel payment gateway
that simplifies payment for government services through various platforms including the
Huduma Smart Service and Payment card There are currently 32 Huduma Centers each
offering over 44 different Public Services
74
What is clear is that improvement in the quality of public service delivery requires
deliberate engagement of the user The need to engage with the users of public services
holds true whether the strategy for reform is market driven or more oriented towards
empowerment For whatever reason by engaging with its external customers public
bodies are seeking to improve the efficiency effectiveness and hopefully the equity of
the services they deliver
Steele and Seargeant (1997) identify three main types of reasons for public service bodies
to engage with the public These are specific reasons which fall into four main groups the
exploration of needs the development of policies plans and strategies the setting of
priorities for services and the assessment of service performance Contextual reasons
which relate particularly to culture and attitudes and often derive from a belief in the
value of consultation or the desire to empower users and instrumental reasons which
may not be explicit but serve to undermine the success of consultation Such reasons
would include going through the motions by complying with requirements to consult or
using consultation to defer difficult decisions
242 The Public Service in Kenya
The Kenyan public service has evolved dramatically since independence in 1963 when
its staff establishment comprised 63000 employees According to a report prepared for
the Public Sector Reform and Development Secretariat (Office of the President) by a
DonorGovernment of Kenya Consultative meeting in 2005 the establishment in 1963
was overstretched leading to poor performance and low productivity The civil service
was further constrained by scarcity of management and entrepreneurial skills especially
among the indigenous people This figure however grew rapidly in subsequent years
rising to 158883 in 1980 and 271979 in 1990
75
A report published in December 2013 attributed to the Public Service Commission of
Kenya put the current public service establishment comprising the central government
Teachers Service Commission state corporations and local authorities at 655300 Until
2013 the public service was made up of 487 public agencies in the executive arm of the
government comprising 46 ministries and accounting departments 202 state
corporations 175 local authorities and 64 tertiary institutions Out of these 470 were on
PC This picture has changed radically with implementation of the constitution which
was promulgated in August 2010 The ministries were scaled down to 18 from 46 and
there have been extensive on-going reforms aimed at merging and reducing the number
of state corporations More significantly local authorities no longer exist their place
having been subsumed by county governments
Performance contracting was introduced in the public service in 2004 in a pilot group of
16 largely commercial public enterprises growing to 476 MDAs in 2012 comprising
ministries state corporations local authorities and tertiary institutions As a key
requirement under the performance contracting system all service oriented MDAs were
required to develop and implement citizenslsquo service delivery charters and to carry out
independent annual customer satisfaction surveys
243 Customer Satisfaction
Boulding et al (1993) Johnson and Furnell (1991) and Furnell et al (1996) view
customer satisfaction as an overall evaluation of a firmlsquos product or service rather than a
particular individuallsquos evaluation of a specific transaction Overall customer satisfaction
should be a more fundamental indicator of the firmlsquos performance due to its links to
behavioral and economic consequences beneficial to the firm (Anderson et al 1994) In
operations research and production it is common practice to argue that there is a positive
76
relationship between customer satisfaction and productivity Thus the firm that achieves
superior levels of customer satisfaction needs to devote fewer resources to handling
returns rework warranties and complaints management thus lowering costs and
improving productivity (Crosby 1979 Deming 1982 Juran1988) In the context of the
service industry Reichheld amp Sasser (1990) argued that reducing defects leads to greater
customer loyalty increased customer loyalty in turn leads to greater productivity via
lower costs of making future transactions favorable word of mouth and in many cases a
price premium
There is however an equally compelling logic to suggest that the pursuit of customer
satisfaction increases costs and thereby reduces productivity In economics for example
the relationship between productivity and customer satisfaction is viewed as positive
Customer satisfaction or utilitylsquo is modeled as a function of product or service attributes
Improving the level of utility by for example improving raw materials incorporating
additional features or adding service personnel requires increasing the level of product
attributes and therefore costs (Grilicher 1971 Lancaster 1979) Such efforts of
progressive increase in utility (customer satisfaction) ultimately also result in diminishing
returns
As mentioned earlier performance measurement is a key component of PMSs Countries
the world over have therefore conceived and applied measurement and evaluation
within the context of PMSs A common characteristic within these reforms is
PMSsResults Based Management (RBM) aimed at improving service delivery through
results-oriented performance management frameworks and creating a culture of focusing
on results rather than processes The key is in the delivery of measurable outputs and
providing a framework for using a strategic approach to planning and resource allocation
77
measuring outputs accountability monitoring and evaluation of performance The key
elements in these systems are the determination of expected outputs identification of
performance indicators and setting of targets monitoring and evaluation as well as
rewardingsanctioning of performance
25 Examples of Countries Implementing PMMIS
Ever since the setting up of public enterprises governments all over the world have been
groping to find ways of managing them effectively This effort has spawned over a large
number of varied instrumentalities (Trivedi 1990) The little that is available in
analytical literature regarding measurement and evaluation of performance in the public
sector traces measurement to the efforts of various countries in designing techniques to
rationalize government control of public enterprises in order to improve their
performance
The earliest organized effort began with the development of PCs in their diverse forms
mainly in France as seen earlier in this study This was commonly referred to as the
French contract system and was the product of the Nora Committee Report of 1967
which had been appointed to inquire into the functioning of the French public enterprises
with a view to suggesting measures for improvement of their performance The
appointment of the committee was informed by the need to resolve the confusion
resulting from excessive control of public enterprises by government and the
complacency and apathy on the part of the different parties involved towards their
efficient functioning
78
The report envisaged a system that would impart operational autonomy to management of
public enterprises and a realistic pricing policy in the context of well-defined contracts
which would list out the objectives to be fulfilled by public enterprises and the financial
assistance to be expected from the government Further countries such as Japan the
United Kingdom the United States of America all have well developed systems of
measuring and reporting government results in Japan the Government Policy Evaluation
Act (GPEA) has been active since 2002 in the UK the Public Service Agreements
(PSA) system has been operational since 1998 while the Government Performance and
Results Act in the US was promulgated in 1993 and became fully operational in 1997
(Talbot 2006) While most countries are still coping with the consequences of the 2008
global crisis the demand for public goodsservices post the crisis has only increased even
as the fiscal resources have dwindled The mechanism featuring performance
management measurement and improvement has been used effectively in a number of
countries
251 Indian Experience
The Memorandum of Understanding (MOU) was the Indian version of the signaling
contract system which derived performance criteria and targets from long-term
institutional plans and was applied selectively to the large and most important public
enterprises The system was primarily intended to increase autonomy of the managers of
public enterprises along with accountability The MOUs are one year performance
agreements which require explicit statement of public enterprise priorities by attaching
weights and specifying how to evaluate deviations from agreed targets Evaluation under
the MOU focuses on both quantitative and qualitative aspects They in addition provide
79
for an integrated performance measure referred to as the composite scorelsquo and recognize
the need for rewards based on actual performance The MOU was introduced in 1987 to
assist in improving the performance of public enterprises In 2009 the Results
Framework Document (RFD) was introduced as the MOU counterpart for managing
performance in government departments Conceived under the Indian government maxim
of ―minimum government and maximum governance the RFD was based on the
principle of what gets measured gets donelsquo Preparation of the RFD by each
ministrydepartment detailing priorities set out by the concerned departmentministry was
the starting point of Performance Measurement and Evaluation System The system
evaluates the performance of these ministries and departments based on the quantitative
targets set at the beginning of each financial year An important feature of the system is
the priority it has accorded to inter-ministerial linkages If the performance of a particular
departmentministry is affected by underbetter performance of a linked
departmentministry the linked departmentministry is also penalizedrewarded
According to the Second Administrative Reform Commission of India the performance
agreement has been the most common accountability mechanism adopted by countries to
improve quality transparency and effectiveness of their public governance At the core
the performance agreements are the objectives to be achieved the resources provided to
achieve them the accountability and control measures and the autonomy and flexibilities
that the civil servants will be given
252 South Korean Experience
South Korea is one of the few countries in the world with a system incepted in 1983 for
evaluating the performance of its public enterprises referred to as Government Invested
Enterprises (GIEs) (Trivedi 1990) In efforts to improve the performance of GIEs the
80
government of South Korea promulgated the Government-Invested Enterprise
Management Act (GIEMA) in December 1963 with the objective of facilitating
evaluation of the performance of GIEs increasing managerial autonomy and
accountability and engendering effective controls These were to be achieved through the
management by objectives system of budget preparation greater management control
over procurement budgeting and personnel policy a two-tier management organization
with the Board of Directors as the main decision-making organ and the enterprise
President as Chief Executive responsible for implementation the simplification and
unification of outside audits the elimination of business supervision by technical
ministries and an objective-oriented ex-post evaluation system and related incentive
system
South Korealsquos performance evaluation system is essentially an operations planning and
control system It involves specifying performance criteria for each public enterprise
setting criteria values defining gradations of performance around those criterion values
allocating weights to various criteria evaluating actual performance at the end of the year
and finally paying an incentive bonus based on results The system has been highly
successful
253 Public Service Agreements in the United Kingdom
The Public Service Agreements (PSA) system was introduced in the United Kingdom in
1998 It lists a set of performance targets set by the treasury against which each
government agency (only ministries in the UK case) must report The targets were
initially set for three years but have since been revised every two years The revision was
extended for three years and a new set of targets set in 2007 The PSAs outline the
81
objectives for the agency or department regarding the services to be delivered as agreed
between the department and the prime ministerlsquos delivery unit PSAs set out targets for
achieving the strategic objectives for a medium term frame of three years
254 Government Performance Results Act (GPRA) in the United States of America
Government performance management in the USA is grounded in law the Government
Performance Results Act (GPRA) The GPRA was signed into law in 1993 but became
operational in 1997 The GPRA established statutory requirements for federal
government agencies to set goals measure performance and submit related plans and
reports to the congress This law requires government agencies to produce performance
plans and reports for the annual appropriations cycle with the guidance of both the
presidency and the congress Further under this law the US President is obliged to sign a
performance agreement with cabinet members In 2010 the GPRA was modified
substantially and the modifications became law in January 2011 as the GPRA
Modernization Act of 2010 (GPRAMA) The GPRAMA set out to build on the GPRA
by among others establishing processes to intensify focus on goal setting and
performance measurement on cross-cutting policy areas using goals and measures during
policy implementation and assigning individual responsibility for the achievement of
goals and management tasks
The US government has since built considerably on these developments by directing
federal agency leaders to set specific agency goals reflecting administration priorities
Cabinet departments and large federal agencies are required to identify a few high
performance (priority) goals whose achievement is overseen by the Performance
82
Improvement Council working closely with the White House Office of Management and
Budget (OMB) The OMB uses the goals the agencies set in their strategic plans along
with the short term priority goals to align budget resources with priorities
According to the OMB the power of this type of goal focused performance management
system is that it uses performance measures to create a constructive dynamic that
motivates continual improvement not just compliance Implementation of performance
agreements policy in the United States had the highest-level political support Each
performance agreement was signed by the president and the cabinet secretary responsible
for respective department The structure of these documents contained an introduction
major objectives of the department measurement of performance administrative support
and terms of agreement
255 Performance Contracting in Kenya
The PC in Kenya is a performance agreement between the government and the
management of a public agency specifying targets to be achieved in addition to
requirements to develop charters to communicate and operationalize expected service
standards and incentives for achieving the targets The introduction of PCs in the
management of the public service was conceived in a 5-year national strategic plan the
Economic Recovery Strategy for Wealth and Employment Creation (2003 ndash 2007)
commonly referred to as the ERS as part of wider public sector reforms The ERS
recommended sweeping reforms in the management of the public service observing at
the outset that the public sector ―hellipis excessively large thereby absorbing inordinately
large amounts of national resources
83
The sector is characterised by wastefulness and inefficiency The ERS recognised
further that―hellipthe problems attributed to the many state corporations arise from the lack
of clear performance contracts that facilitate the monitoring of the performance of the
CEOs appointed to manage the corporations The Kenyan version of the PC
incorporated an elaborate measurement methodology that denominates achievement into
weighted and composite scores Under the measurement and evaluation system
achievement of the freely negotiatedlsquo performance targets was classified as excellentlsquo
for achievement of 30 percent above the agreed performance target very goodlsquo for
achievement between 100 percent and 130 percent of the performance target in the signed
PC goodlsquo for achievement between 70 percent and 100 percent of performance target in
the signed PC) fairlsquo for achievement between 50 percent and 70 percent of the target in
the signed PC) and poorlsquo for achievement between 0 percent and 50 percent of the
target in the signed PC The scoring scales are in turn denominated into raw and
composite scores with the criteria value ranges indicated in Table 24 below
Table 24 Performance Grading Scores
Performance
Grade
Criteria Value Range
Upper Lower
Range Span
Excellent From 100 To 240 140
Very Good Over 240 To 300 060
Good Over 300 To 360 060
Fair Over 360 To 400 040
Poor Over 400 To 500 100
(Source Performance contracting training modules Office of the Prime Minister Government of Kenya)
The methodology for calculating the raw score of any achievement is more like
measuring the distance which performance has ―traveled inside the entire span of 1 to 5
Calculation of the raw score is based on the actual achievement (Xa) as it relates to the
target (T) where
84
Xa = Actual achievement
Xu = 2T = Upper criteria value
XL = 0 = Lower Criteria Value
Span = 4 (500 -100)
The raw scores obtained using this methodology are subsequently aggregated to generate
the composite score
The criteria for performance excellence (Baldrige Performance Excellence Program
2013a12) challenges organizations to collect report and use performance measures in
the areas of products customers operations finances and the marketplace and the
workplace as a key means to make fact-based decisions leading to excellence at all levels
of the organization Migeon (2012) observes that results-oriented governments are
increasingly making use of hard data and statistical analysis to inform decisions and
proceeds to document two forms of evidence-based decision making in government one
of the goals of a government-wide transformation effort in France between 2009 and
2012 was to reduce the perceived complexity of dealing with the government As part of
this initiative the government identified 50 life events such as getting married or starting
a business during which citizens have to interact with public agencies It then sought to
simplify each of these interactions all the while measuring citizen satisfaction to track
whether the changes were actually working Similarly as part of a broader open
government initiative the city of Moscow began to publish a dashboard of around 50 key
85
performance indicators relating to the citylsquos health education safety business
conditions and transportation outcomes The dashboard acted as a scorecard for citizens
showing the citylsquos performance against these metrics
The UK governmentlsquos behavioral insights team was formed explicitly to use data about
citizen behavior to improve the effectiveness of government interventions The team sets
up randomized control trials long used in the medical field but only now gaining favor in
the public sector to test the impact of small changes like adjustments in the language and
tone of the letter that the tax department sends to delinquent taxpayers In its first two
years the team paid for itself 22 times over in savings It has identified interventions
expected to save the UK government at leastpound300 million over the next five years The
unit has since started to advise other governments on how to use data and randomized
control trials to improve government performance
26 Previous Related Studies
Four studies related to the current research study carried out in 1994 2006 2010 and
2012 were identified The studies set out to respectively investigate whether there are
conditions under which there are tradeoffs between customer satisfaction and firm
productivity examine the relationship between performance management and service
delivery in the department of water affairs and forestry in S Africa explore the
antecedents of satisfaction and loyalty for the freight shipping industry in Taiwan
investigate the linkages between customer service customer satisfaction and firm
performance in the US airline industry
86
The objectives of the studies were to respectively establish the links between customer
satisfaction and productivity establish the role of performance management as a pre-
condition for organizational performance and improved public service delivery establish
the effects of service quality and relational performance on customer satisfaction and
loyalty in a business-to-business context and investigate the linkages between customer
service customer satisfaction and firm performance in the US airline industry
The findings of the studies were that the association between changes in customer
satisfaction and changes in productivity was positive for goods but negative for services
While both customer satisfaction and productivity were positively associated with Return
on Investment (ROI) for goods and services the interaction between the two was positive
for goods but significantly less so for services this meant that simultaneous attempts to
increase both customer satisfaction and productivity were likely to be more challenging
in service oriented operations This implied further that services exhibit ―tradeoffs
while goods do not given that the increases (decreases) in customer satisfaction were
associated with decreases (increases) in productivity for services the conclusion drawn
by the researcher was that the introduction of performance management in DWAF had
not brought about the desired impact on service delivery
Analytical results showed that customer loyalty was influenced by the level of
satisfaction Additionally relational performance and service quality were significant
predictors of satisfaction relational performance was an antecedent of service quality and
satisfaction and its influence on satisfaction was greater than that of service quality and
that market concentration moderated the relationship between satisfaction and
87
profitability for US airlines Airlines that operated in concentrated markets had fewer
incentives to satisfy their customers than airlines that operated in more competitive
markets
Details of the studies including the researchers the methodologies and the gaps intended
to be filled are shown in Appendix XI
27 Conceptual Framework
The principal aim of the research study on performance contracting measurement and
public service delivery in Kenya was to explore the relationship between performance
measurement and improvement which are the core essential elements of performance
contracting and public service delivery in Kenya including the factors that affect and
influence the relationship The roadmap of this study entailed review of literature
documentation and use of secondary data from key public sector agencies that have long
records with performance measurement The study therefore sought to bridge a number
of gaps between theory and practice in performance measurement in the Kenyan context
The effects of political stability as a key factor in governance and global
competitiveness and how and the extent to which they influence performance and
ultimately service delivery were considered and analyzed in the study
Alesina Ozler Roubini and Swagel (1992) defined political stability as the propensity of
a government collapse either because of conflicts or rampant competition between
various political parties They proceeded to state that political stability is beneficial for
much of the economic progress that a country may achieve because investment and
growth highly depend on it recovery is faster under a stable political environment and
88
issues of employment human capital development and business development can be
dealt with much faster and effectively in an environment that does not suffer from risks
of change or even worse risk of conflict because of political instability
A report by the Centre for Public Policy Studies cites an IMF Working Paper of 2011
associated progressive decline in per capita GDP declining rates of productivity and
growth and physical and human capital accumulation to rising political instability
Further that political instability usually leads to sub-optimal macroeconomic policies and
a frequent switch between policies creating volatility and thus high levels of uncertainty
This position is supported by the findings by Alesina Ozler Roubini and Swagel (1992)
that in countries where there are high levels of political instability the economic growth
is reported at very low levels and that the two phenomena are in fact interconnected and
affect each other
High volatility in the government establishment may lead to lower growth but also a
poor indicator of growth may lead to higher political instability Uncertainty in the
governmentlsquos stability and therefore the continuation of current or similar policies may
affect investment At the same time low investment levels and low economic growth
may see higher political instability as the electorate loses faith in a standing government
and might opt to elect some other party with the hope that economic growth will benefit
from a change in government
The report by the Centre for Public Policy Studies concludes that if a country has a stable
government and thus does not need to worry about conflicts and radical changes of
regimes the people can concentrate on achieving more in their lives in terms of career
89
or otherwise Political stability gives a peaceful stable environment that is necessary for
any progress in other areas of life ndashscience economic developmental and philanthropic
progress and in general sees more progress than a period that a country is under an
unstable political situation for the simple reason that in a stable peaceful environment
people have the time and luxury of being able to deal with issues other than basic survival
needs
The variables conventionally associated with political stability include economic and
democratic freedom the predictability of the electoral environment (political certainty)
ideological homogeneity of political parties and establishments ethnic homogeneity and
general absence of violence and terrorism This variable relates essentially to the quality
of governance The political stability indices used in this study were extracted from the
World Bank Report on Worldwide Governance Indicators on Political Stability and
Absence of ViolenceTerrorism The indices reflect perceptions of the likelihood that the
government will be destabilized or overthrown by unconstitutional or violent means
including politically motivated violence or terrorism
The Worldwide Governance Indicators (WGI) is a research dataset summarizing the
views on the quality of governance provided by a large number of enterprise citizen and
expert survey respondents in industrialized and developing countries These data are
gathered from a number of survey institutes think tanks non-governmental
organizations international organizations and private sector firms The estimates of
governance range from approximately -25 (weak) to 25 (strong) governance
performance The Worldwide Governance Indicators which inform political stability
90
have been compiled for 215 developed and developing countries covering the years 1996
through to 2012 The indices that relate to this study are in respect of the years 2006 to
2011 in respect to political stability in Kenya and are shown in Table 25 in comparison
to the best and worst countries
Table 25 Political Stability Country Comparisons
Year Political Stability (WGI)
Finland (best) Kenya Somalia (worst)
2006 150 -112 -278
2007 150 -127 -324
2008 145 -138 -331
2009 145 -143 -332
2010 139 -117 -311
2011 137 -124 -307 Source World Bank Report Political Stability and Absence of Violence Worldwide Governance
Indicators (WGI)
Data on global competitiveness is compiled by the World Economic Forum (WEF) of the
World Bank The World Economic Forum in its Global Competitiveness Report defines
competitiveness in the context of a grouping of factors that drive productivity and
competitiveness These include institutions infrastructure the macro economy health
and primary education higher education and training market efficiency technological
readiness business sophistication and innovation The level of productivity in turn sets
the level of prosperity that can be reached by an economy
The productivity level also determines the rates of return obtained by investments in an
economy which in turn are the fundamental drivers of its growth rates In other words a
more competitive economy is one that is likely to grow faster over time The concept of
competitiveness thus involves static and dynamic components Although the productivity
91
of a country determines its ability to sustain a high level of income it is also one of the
central determinants of its return on investment which is one of the key factors
explaining an economylsquos growth potential The index organizes the pillars into three sub-
indexes efficiency enhancers innovation and sophistication factors and is based on a 1-7
scale (the higher the average score the higher the degree of competitiveness)
The Global Competitiveness Indices for Kenya for the years 200607 200708 200809
200910 and 201011 were respectively 357 361 384 367 and 365 The
relationships that formed the basis of the study are shown in the conceptual framework
depicted in Figure 23
Figure 23 Conceptual Framework
Independent
Variables
Performance contracting
and measurement
Dependent
variable
H3
Intervening
variable
Moderating Variable Global
competitiveness
H4
Service delivery
Growth in customer
satisfaction
H2
Political stability
H1
92
28 Hypotheses
The study sought to establish the relationship between performance contracting and
measurement and public service delivery in Kenya as well as the intervening and
moderating effects of respectively political stability and global competitiveness on this
relationship From the literature review and on the basis of the relationships depicted in
the conceptual framework above the following hypotheses were formulated for testing
H1 There is no significant relationship between performance contracting and
measurement and public service delivery in Kenya
H2 There is no significant intervening effect of political stability on the relationship
between performance contracting and measurement and public service delivery in
Kenya
H3There is no significant moderating effect of global competitiveness on the relationship
between performance contracting and measurement and public service delivery in
Kenya
H4 There is no significant joint effect of political stability and global competitiveness on
the relationship between performance contracting and measurement and public
service delivery in Kenya
29 Chapter Summary
The chapter has summarized both theories anchoring this study and empirical literature
The chapter has the discussed and synthesized the theoretical underpinnings and pairwise
reviews of the study variables It has clearly highlighted the various contributions by the
underpinning theories A summary of selected empirical studies is presented and clearly
highlight their focus of study findings and conclusions The important aspects of this
chapter are propositions emerging from the theoretical and empirical gaps It also
presents a conceptual model in a diagrammatic relationship with variables of the study
with resultant hypotheses
93
CHAPTER THREE
RESEARCH METHODOLOGY
31 Introduction
This chapter describes the steps the study employed to create a relationship between the
research objectives and the research questions and therefore demonstrates and guides on
how the research was conducted It includes the research design the research philosophy
the target population of the study and how the data was collected the analysis procedures
and techniques and concludes with a summary of the key indicators used to measure the
study variables and the analytical model
32 Research Philosophy
The study was based on quantitative research entailing the collection and observation of
existing numerical data on the performance of public agencies and public service delivery
in Kenya over a period of six years and using statistical analysis to draw conclusions
regarding the relationship between the variables that were being investigated The study
used secondary data on performance denominated into composite scores generated
through independent performance measurement and evaluation and customer satisfaction
indices obtained through independent annual customer satisfaction surveys The
objectivity of already existing data underpins the objectivity associated with the positivist
research philosophy enunciated by Cooper and Schindler (2006)
According to Dash (1993) research is essentially concerned with exploring and
understanding social phenomena which are educational in nature mainly pertaining to
formalized andor spontaneously occurring social cultural psychological processes
94
Further that since theoretical questions in education emerge from different conceptions
and interpretations of social reality different paradigms have been evolved to determine
the criteria according to which one would select and define problems for inquiry (Dash
1993)
The positivist approach can be traced to the French philosopher August Comte who
emphasized observation and reason as a means of understanding human behavior
According to him true knowledge is based on experience of senses and can be obtained
by observation and experiment Thus the positivistic paradigm systematizes the
knowledge generation process with the help of quantification which is essentially to
enhance precision in the description of parameters and the discernment of the relationship
among them The anti-positivist paradigm on the other hand emphasizes that social
reality should be viewed and interpreted by the individual according to the ideological
positions they hold Therefore knowledge is personally experienced rather than acquired
or imposed from outside According to Cohen et al (2000) the anti-positivists emphasize
that the verification of a phenomenon is adopted when the level of understanding of a
phenomenon is such that the concern is to probe into the various unexplored dimensions
of a phenomenon rather than establishing specific relationship among the components as
it happens in the case of positivism
In brief the two paradigms are concerned with two concepts of disparate social reality
While positivism stands for objectivity measurability predictability controllability and
constructs laws and rules of human behavior non-positivism essentially emphasizes
understanding and interpretation of phenomena and making meaning out of this process
95
suggesting qualitative rather than quantitative approach to social inquiry The current
study is premised on measurement of observed phenomena and making predictions based
on objective evidence based data and is therefore positivistic in orientation
33 Research Design
Research design is the detailed outline or strategy selected to integrate the different
components of the study to effectively address the research problem It typically includes
the methods employed to collect data and measurement and analysis of the data and the
instruments used to analyze the data According to DeVaus (2001) and Trochim (2006) it
constitutes the blueprint for the collection measurement and analysis of data In social
sciences research obtaining information relevant to the research problem generally
entails specifying the type of evidence needed to test a theory to evaluate a program or
to accurately describe and assess meaning related to an observable phenomenon The
function of a research design is to ensure that the evidence obtained enables logical and
unambiguous consideration of the research problem In social sciences research
obtaining information relevant to the research problem generally entails specifying the
type of evidence needed to test a theory to evaluate a program or to accurately describe
and assess a meaning related to an observable phenomenon
This study employed a cross-sectional design whereby the data is collected from a large
number of public institutions controlled and funded largely by the government but which
results of performance and service delivery differ The data used for the study was
already available for the period of six years and not subject to intervention or
manipulation by the researcher The statistical analysis employed was for the purpose of
96
drawing inferences about possible relationships but not to establish cause and effect
relationships The research in addition considered a number of variables including
performance (the product of measurement) customer satisfaction indices political
stability and global competitiveness The research problem was identified and its
selection justified previous published literature reviewed and synthesized hypotheses
relating to the research questions specified and the data necessary for adequate testing of
the hypotheses described in addition to explanation of how the data was obtained The
methods of analysis to be applied to the data in determining whether or not the
hypotheses are true or false were also described Unlike in experimental design where
there is an active intervention by the researcher to produce and measure change or to
create differences cross-sectional designs focus on studying and drawing inferences from
existing differences between subjects or phenomena This type of design may not
demonstrate cause and effect but may provide a snapshot of correlations existing at
particular points in time and may give clues to guide further research
34 Population and Data Collection
The new Constitution that was promulgated in August 2010 significantly altered the
landscape of the structure and profile of government agencies Requirements in the
Constitution precipitated wide ranging restructuring of the mainstream civil service
resulting in the merger of ministerial functions thereby reducing the number of ministries
and accounting departments from 46 to 18 and virtual abolition of local authorities The
data available for the study therefore was in regard only to agencies in the old pre-
constitution structure The study was a cross-sectional one and relied on secondary data
97
that was already available The political stability indices were extracted from the World
Bank Report on Worldwide Governance Indicators on Political Stability and Absence of
ViolenceTerrorism while the data on global competitiveness was obtained from the
2013 World Economic Forum (WEF) report of the World Bank
In 201011 which was the terminal year for data collection and analysis in this paper the
number of MDAs on performance contract was 470 made up of 46 ministries and
accounting departments 178 state corporations 175 local authorities and 71 tertiary
institutions The distribution is shown in Table 33 The focus of the study was the entire
population of 470 MDAs Further the various categories of MDAs had by 201011 been
on performance contract for differing periods these are 6 years for both ministries and
state corporations 5 years for local authorities and 4 years for tertiary institutions The
data used for the study was in respect to the five years of 200607 200708 200809
200910 and 201011 during which period customer satisfaction in the majority of the
above categories of public agencies was measured The distribution of the various
categories of institutions is shown in Table 31
Table 31 Distribution of MDAs in 2011
Category of MDA No Percent
Ministries and Accounting Departments 46 979
State Corporations 178 3787
Local Authorities 175 3723
Tertiary Institutions 71 1511
Total 470 10000
Source Organization of Government Office of the President
98
The performance evaluation methodology in Kenya grades excellence on a composite ndash
scoring scale ranging from 1 to 5 with 1 denoting the upper limit of excellentlsquo
achievement and 5 representing the lowest limit of poor achievement Charts and graphs
constructed directly on performance gradings drawn from this type of scale would
therefore have a visual depiction of declining achievements for top achievers and a rising
trend for poor achievers To mitigate this problem the composite scores were inverted in
order to give a rising visual effect to positive achievement and a declining visual effect to
poor achievement Further the composite scores in each of the four categories of MDAs
were averaged for each year to contain the data within manageable parameters
35 Data Analysis
The data from the agencies was organized summarized and collated in a manner that
linked with the research questions and subsequently analyzed using both descriptive
statistics (mean and measures of dispersion) and inferential statistics (correlation
analysis of variance and regression analysis) Descriptive analysis was conducted to bring
out the main characteristics of the sample To test the hypotheses correlation and
regression analyses were carried out to establish the expected relationships between
performance contracting and measurement and public service delivery in Kenya and the
intervening and moderating effects of respectively political stability and global
competitiveness on this relationship The regression analyses provided estimate
equations to predict the magnitude of the dependent variable (customer satisfaction) and
provide values for the predictor variables
99
In addition t-test and p-values were used to determine individual significance of the
results of the analysis Assessment of the overall robustness and significance of the
regression models was done using the F-test and p-values Pearson correlation
coefficient R2 beta coefficients and p values were computed If p-value was less or
equal to 005 (p-value le 005) the hypothesis was rejected otherwise it failed to be
rejected Additionally for each hypothesis a model equation of the variables relationship
was computed showing the magnitude and relationships of the independent variable(s)
and dependent variable
In order to establish the intervening and moderating effects on the relationship between
performance contracting and measurement (Independent Variable) X1-p and service
delivery (Dependent Variable) Y in public agencies the following model was used
Service Delivery (Y) = 0+ 1X1 + 2X2 + 3X3 + 4X4 hellip+ pXp + i
Where
Y is the dependent variable (Customer Satisfaction) and is a linear function of X1 X2 X3
X4hellipXi plus i
0 is the regression constant or intercept
1-p are the regression coefficients or change induced in Y by each X
i is the error term
X1-p are independent variables (performance contracting and measurement political
stability and global competitiveness)In order to compare the performance of different
categories of public agencies an analysis of variances was carried out The analytical
model is depicted in the Table 32 below
100
Table 32 Summary of Analytical Model
Objective Hypothesis Type of
Data
Analytical Model
1 To determine the
relationship between
performance contracting and
measurement and public
service delivery in Kenya
H1 - There is no
significant relationship
between performance
contracting and
measurement and
public service delivery
in Kenya
Secondary
Linear Regression
Y = o + 1X1 +
where
Y = Customer
Satisfaction
o= Constant
1= Regression Constant
X1= Performance
Improvement
2 To establish the intervening
effect of political stability
on the relationship between
performance contracting and
measurement and public
service delivery in Kenya
H2 - There is no
intervening effect of
political stability on the
relationship between
performance contracting
and measurement and
public service delivery
in Kenya
Secondary
Multiple Regression
Y = o + 1X1 + 2X2 +
where
Y = Customer
Satisfaction
o= Constant
1 B2 = Regression
Constants
X1= Performance
Improvement
X2 = Political Stability
3 To establish the moderating
effect of global
competitiveness on the
relationship between
performance contracting and
measurement and public
service delivery in Kenya
H3There is no
moderating effect of
global competitiveness
on the relationship
between performance
contracting and
measurement and
public service delivery
in Kenya
Secondary Multiple Regression
Y = o + 1X1 + 3X3 +
where
Y = Customer
Satisfaction
o= Constant
1 3 = Regression
Constants
X1 = Performance
Improvement
X3 = Global
Competitiveness
4 To establish the joint effect
of political stability as well
as global competitiveness
on the relationship between
performance contracting and
measurement and public
service delivery in Kenya
H4-There is no joint
effect of political
instability as well as
global competitiveness
on the relationship
between performance
contracting and
measurement and
public service delivery
in Kenya
Secondary
Multiple Regression
Y = o + 1X1 + 2X2 +
3X3 + where
Y = Customer
Satisfaction
o= Constant
1 2 3 = Regression
Constants
X1 = Performance
Improvement
X2 = Political Stability
X3 = Global
Competitiveness
101
36 Chapter Summary
This chapter has presents the research methodology of the study It comprises the
philosophical orientation that will be employed in the study The choice of the positivism
approach (objective) that will guide this study and its justification is presented The
chapter then discusses and justifies the research design to be used describes the
population of the study the data collection method the instrument and the nature of the
respondents Data analysis techniques and the analytical models that will be applied in
the study are presented and supported with relevant evidence
102
CHAPTER FOUR
DATA ANALYSIS AND DISCUSSION OF FINDINGS
41 Introduction
The study sought to establish the relationship between performance contracting and
measurement and public service delivery in Kenya To achieve this objective four
specific objectives and their corresponding hypotheses were formulated A number of
inferential statistical operations were performed to test the hypotheses Performance
contracting and measurement were designed to improve institutional and managerial
performance measured using composite scores and to consequently improve public
service delivery Public service delivery on the other hand is expected to be the outcome
of improvement in performance measured through customer satisfaction indices obtained
through annual customer satisfaction surveys over the period under consideration To test
the hypotheses correlation and regression analyses were carried out to establish the
expected relationships between performance contracting and measurement and public
service delivery in Kenya and the intervening and moderating effects of respectively
political stability and global competitiveness on this relationship In addition t-test and
p-values were used to determine individual significance of the results of the analysis
Assessment of the overall robustness and significance of the regression models was done
using the F-test and p-values
42 Pretesting for Multiple Regression Assumptions
Usually there are assumptions that are made about variables during statistical tests One
of the main assumptions is that data follows a normal distribution Statistical procedures
used in analyses may however have some errors and therefore need to be tested This is to
103
ensure that the findings are worth using in decision making Testing for assumptions is
beneficial because it ensures that analysis meets associated assumptions and helps avoid
89 Type I and Type II errors (Osborne et al 2001) This study therefore carried out test of
normality linearity Homogeneity of variances and Multicollinearity tests
421 Tests of Normality
Normality tests are used to establish if a data set is well-modeled by a normal
distribution compute the likelihood of a random variable underlying the data set to be
normally distributed and to justify the use of the mean as the measure of central tendency
(Zikmund 2010) They are therefore measures of goodness of fit of a normal model to
the data if the fit is poor then the data are not well modeled in that respect by a normal
distribution Tests of normality are important because the bulk of the statistical analysis
such as regression correlation and t-tests are premised on the presumption of normal
distribution of data (Ghasemi amp Zahediasl 2012) The studylsquos variables were found to be
in conformity with the test of normality implying that there was no skewedness using a
normal Q-Q plot shown in Figure 41 The Q-Q plot established that the data used for the
study were fairly normally distributed and statistically significant as relates to customer
satisfaction political stability and global competitiveness
104
Figure 41 Normal Q-Q Plot
Source Field Data (2015)
The linearity of the points in the above Q-Q plot suggests that the data were normally
distributed
422 Tests of Linearity
Tests of linearity are carried out to establish that the data used for analysis was sampled
from a population that relates the variables of interest in a linear fashion
A linearity test was conducted to establish the linear relationship between the variables
used in the study The findings were that political stability and global competitiveness did
not show close linearity whereas performance measurement and customer satisfaction
exhibited a closer linear relationship These are shown in Figures 42 43 and 44
105
Figure 42 Performance Measurement and Customer Satisfaction
Source Field Data (2015)
Figure 43 Political Stability and Customer Satisfaction
Source Field Data (2015)
106
Figure 44 Political Stability and Customer Satisfaction
Source Field Data (2015)
423 Test of Homogeneity of Variances
A test of homogeneity of variances was carried out to establish the significance of the
variance of the variables used in the study The test indicated that the variances of the
variables are not necessarily statistically significant This is shown in Table 41
Table 41 Test of Homogeneity of Variances
Variable Levene Statistic Sig
Performance Measurement 2146 152
Customer Satisfaction 1345 310
Political Instability 2064 154
Global Competitiveness 1382 427
Source Field Data (2015)
107
424 Multicolinearity Test
Multicollinearity tests are carried out primarily to avoid the problem of multiple
counting brought about when a researcher uses the same type of information more than
once with different variables which is common in technical analysis A multicolinearity
test was also carried out and the findings indicated that political stability and global
competitiveness have identical tolerance and identical variance inflation factor (VIF)
values regarding the multicolinearity There was therefore no multicolinearity amid these
indicators This is shown in Table 42
Table 42 Multicolinearity Coefficientsa
Model Collinearity Statistics
Tolerance VIF
1 Global Competitiveness 781 1280
Political Instability 781 1280
a Dependent Variable Customer Satisfaction
Coefficientsa
Model Collinearity Statistics
Tolerance VIF
1 Political Instability 982 1018
Customer Satisfaction 982 1018
a Dependent Variable Global Competitiveness
Source Field Data (2015)
43 Descriptive Analysis of the Study Variables
The analysis was carried out using the Statistical Package for Social Sciences (SPSS)
version 21 and both descriptive and inferential statistics Descriptive statistics was carried
out to summarize the data and to bring out variability and dispersion using the mean the
standard deviation and the coefficient of variation Standard deviation shows how far the
distribution is from the mean A small standard error implies that most of the sample
means will be near the center population means thus the sample mean has a good chance
of being close to the population mean and a good estimator of the population mean On
the other hand a large standard error illustrates that the given sample mean will be a poor
estimator of the population mean (Harvill 1991)
108
Correlation coefficients were computed to establish the relationship between the study
variables and the extent to which the dependent variable could be predicted from the
independent variable and to derive the regression equation Linear regression analysis
was used to examine the models overall and individual statistical significance by using F-
value and t-value respectively In both cases if the p-value was less than or equal to
005 the hypothesis was rejected otherwise the hypothesis failed to be rejected if the p-
value was greater than 005 A model equation was derived for each hypothesis using
variables that were significant
Table 43 Shows the Descriptive Statistics of the Study Variables
Variable T-value Sig (2-tailed) Mean Std Deviation CV ()
Performance Measurement 37720 000 265439 27255 1027
Customer Satisfaction 8699 000 027779 12368 4452
Global Competitiveness 157181 000 369800 09112 246
Political Stability -47656 000 -131533 10690 -813
Source Field Data (2015)
As the table indicates the public sector in Kenya had an average customer satisfaction
index of 027779 implying that nearly 73 percent of customers were dissatisfied with the
public sector service delivery Performance measurement had the highest variability (SD
= 027255) across the public sector made up of ministries state corporations local
authorities and tertiary institutions Political stability was found to be weak with a mean
of -131533 on a scale of -25 (very weak) and 25 (very strong) Global competitiveness
on the other hand was found to be an average of 3698 on a scale of 1 (very low) and 7
(very competitive)
109
The coefficient of variation was computed to show the variability in the data of the study
parameters Customer satisfaction shows the greatest variability followed by
performance measurement The global competitiveness shows the least variability and
political stability has fairly negative variability
Table 44 Correlation Analysis of the Study Variables
Performance
Measurement
Customer
Satisfaction
Global
Competitiveness
Political
Stability
Performance
Measurement
Pearson Correlation 1
Sig (2-tailed)
Customer
Satisfaction
Pearson Correlation 858
1
Sig (2-tailed) 000
Global
Competitiveness
Pearson Correlation 086 159 1
Sig (2-tailed) 760 571
Political Stability Pearson Correlation 099 -134 -468 1
Sig (2-tailed) 724 633 079
Correlation is significant at the 001 level (2-tailed)
Source Field Data (2015)
The correlation analysis of the study variables (Table 44) indicates that all the four
studylsquos variables were related but not perfectly Performance measurement was highly
correlated with customer satisfaction (R = 0858) and the relationship was significant at
99 percent confidence level This high relationship indicating that performance
improvement (the product of performance measurement) and customer satisfaction share
08582or about 736 per cent of their variation brings out the importance of having a
performance measurement system to establish performance levels and to monitor how
customers are served in the public sector Global competitiveness was found to be
negatively related with political stability (R = -0468) and the relationship was not
significant This indicates that social-political chaos and turmoil may not have a
significant impact on the attractiveness of a country in the global arena
110
44 Performance Measurement and Customer Satisfaction
The first objective of the study was to establish the relationship between performance
contracting and measurement and customer satisfaction in the services delivered by
Kenyalsquos public sector Hypothesis one was formulated as
H1 There is no significant relationship between performance contracting and
measurement and public service delivery in Kenya
The results of the analysis carried out to establish the relationship between performance
measurement and customer satisfaction are shown in Table 45 The results show that
performance measurement had a strong positive relationship (R = 0858) with customer
satisfaction Performance measurement explained 736 percent (R2 = 0736) of customer
satisfaction levels with the remaining 264 percent accounted for by other factors The F-
value for the model was 36176 and the derived p-value was 0000 Since the derived p-
value of 0000 was less than 005 with a table value of 2145 as compared to a calculated
value of 6015 the hypothesis was rejected hence performance measurement had a
significant relationship with customer satisfaction The performance measurement
variable had a t-value of 6015 and was significant
111
Table 45 Relationship between Performance Measurement and Customer
Satisfaction
Model Summary
Model R R Square Adjusted R
Square
Std Error of the Estimate
1 858a 736 715 06599
a Predictors (Constant) Performance Measurement
ANOVAa
Model Sum of
Squares
Df Mean Square F Sig
1
Regression 158 1 158 36176 000b
Residual 057 13 004
Total 214 14
a Dependent Variable Customer Satisfaction
b Predictors (Constant) Performance Measurement
Model Unstandardized
Coefficients
Standardized
Coefficients
T Sig
B Std Error Beta
1
(Constant) -755 173 -4376 001
Performance
Measurement 389 065 858 6015 000
a Dependent Variable Customer Satisfaction
Coefficientsa
Source Field Data (2015)
A model equation of the relationship is described in equation 41
Customer satisfaction = - 0775 + 0389 Performance Improvement hellipEquation 41
This shows that a unit change in performance improvement impelled by performance
measurement will result in customer satisfaction changing by a factor of 0389 In the
absence of performance improvement a constant customer satisfaction of negative 0775
would be realized
Additional analyses were carried out to establish the effect of both political stability and
global competitiveness on customer satisfaction in Kenyalsquos public sector The results of
the analyses are shown in Tables 46 and 47
112
Table 46 Relationship between Political Stability and Customer Satisfaction
Model Summary
Model R R Square Adjusted R
Square
Std Error of the Estimate
1 134a 018 057 12718
a Predictors (Constant) Political Stability
ANOVAa
Model Sum of
Squares
Df Mean
Square
F Sig
1
Regression 004 1 004 239 633b
Residual 210 13 016
Total 214 14
a Dependent Variable Customer Satisfaction
b Predictors (Constant) Political Stability
Coefficientsa
Model Unstandardized
Coefficients
Standardized Coefficients T Sig
B Std
Error
Beta
1 (Constant) 073 420 175 864
Political Stability -155 318 -134 -489 633
a Dependent Variable Customer Satisfaction
The results in Table 46 show that political stability had a weak positive relationship with
customer satisfaction This finding is supported by the fact that the mean political
stability index was very low at -131533 Political stability explained 18 percent (R2 =
0018) of customer satisfaction levels with the remaining 982 percent accounted for by
other factors implemented in the public sector The F-value for the model was 0239 and
the derived p-value was 0633 Since the derived p-value was greater than 005 the
indication was that political stability had no significant relationship with customer
satisfaction The relationship between global competitiveness and customer satisfaction
in Kenyalsquos public sector is shown in the Table 47
113
Table 47 Relationship between Global Competitiveness and Customer Satisfaction
Model Summary
Model R R Square Adjusted R Square Std Error of
the Estimate
1 159a 025 -050 12671
a Predictors (Constant) Global Competitiveness
ANOVAa
Model Sum of
Squares
Df Mean Square F Sig
1
Regression 005 1 005 338 571b
Residual 209 13 016
Total 214 14
a Dependent Variable Customer Satisfaction
b Predictors (Constant) Global Competitiveness
Coefficientsa
Model Unstandardized
Coefficients
Standardized
Coefficients
T Sig
B Std Error Beta
1 (Constant) -522 1375 -379 711
Global Competitiveness 216 372 159 582 571
a Dependent Variable Customer Satisfaction
Source Field Data (2015)
Table 47 shows the results of the analysis done to establish the effect of global
competitiveness on the customer satisfaction levels The results show that global
competitiveness had a weak positive relationship with customer satisfaction This finding
is supported by the fact that the mean global competitiveness index was neither strong
nor weak at 3698 Global competitiveness explained 25 percent (R2 = 0025) of
customer satisfaction levels with the remaining 975 percent accounted for by other
factors implemented in the public sector The F-value for the model was 0338 and the
derived p-value was 0571 Since the derived p-value was greater than 005 the
indication was that global competitiveness had no significant relationship with customer
satisfaction
114
45 Intervening Effect of Political Stability on the Relationship between
Performance Measurement (Improvement) and Customer Satisfaction
The second objective of the study was to establish the intervening effect of political
stability on the relationship between performance contracting and measurement and
customer satisfaction in the services delivered by Kenyalsquos public sector Hypothesis two
was formulated as
H2 There is no significant intervening effect of political stability on the relationship
between performance contracting and measurement and public service delivery in Kenya
The results of the analysis conducted to establish the intervening effect of political
stability on the relationship between performance measurement and customer satisfaction
are shown in Table 48 The results show that political stability explained an additional
49 percent (Δ R2 = 0049) on the direct effect of performance measurement on customer
satisfaction The change in the F-value caused by the intervening effect was 2712 and
was not significant since the derived p-value of 0126 was greater than 005 The F-value
for the intervening model was 21825 and the derived p-value was 0000 Since the
derived p-value was less than 005 with table value of 2145 as compared to a calculated
value of 6530 the hypothesis was rejected suggesting that political stability has a
significant intervening effect on the relationship between performance measurement and
customer satisfaction The performance measurement variable had a t-value of 6530 and
was statistically significant while the effect of political stability had a t ndash value of ndash 1647
although not statistically significant
115
Table 48 Intervening Effect of Political Stability
Model Summary
Model R R Square Adjusted
R
Square
Std Error of the
Estimate
Change Statistics
R
Square
Change
F
Change
df1 df2 Sig F
Change
1 858a 736 715 06599 736 36176 1 13 000
2 886b 784 748 06203 049 2712 1 12 126
a Predictors (Constant) Performance Measurement
b Predictors (Constant) Performance Measurement Political Stability
ANOVAa
Model Sum of
Squares
Df Mean Square F Sig
1
Regression 158 1 158 36176 000b
Residual 057 13 004
Total 214 14
2
Regression 168 2 084 21825 000c
Residual 046 12 004
Total 214 14
a Dependent Variable Customer Satisfaction
b Predictors (Constant) Performance Measurement
c Predictors (Constant) Performance Measurement Political Stability
Coefficientsa
Model Unstandardized
Coefficients
Standardized
Coefficients
T Sig
B Std Error Beta
1 (Constant) -755 173 -4376 001
Performance Measurement 389 065 858 6015 000
2
(Constant) -1119 274 -4081 002
Performance Measurement 399 061 880 6530 000
Political Stability -257 156 -222 -1647 126
Source Field Data (2015)
A model equation of the intervening effect of political stability on the relationship
between performance measurement and customer satisfaction is described in equation
42
C Customer satisfaction = - 1119 + 0399 Performance Improvement - 0 257 Political
Stability helliphelliphelliphelliphelliphelliphelliphelliphelliphelliphelliphelliphelliphelliphelliphelliphelliphelliphelliphelliphelliphelliphelliphelliphelliphelliphellipEquation 42
116
This shows that a unit change in performance improvement impelled by performance
measurement will result in customer satisfaction changing by a factor of 0399 The unit
change in Political Stability contributes negatively to the customer satisfaction by a factor
of 0257 though not statistically significant In the absence of performance measurement
and political stability a constant customer satisfaction of negative 1119 would be
realized
46 Moderating Effect of Global Competitiveness on the Relationship between
Performance Measurement and Customer Satisfaction
The third objective of the study was to establish the moderating effect of global
competitiveness on the relationship between performance contracting and measurement
and customer satisfaction in the services delivered by Kenyalsquos public sector Hypothesis
three was formulated as
H3 There is no significant moderating effect of global competitiveness on the
relationship between performance contracting and public service delivery in Kenya
The results of analysis carried out to establish the moderating effect of global
competitiveness on the relationship between performance measurement and customer
satisfaction are shown in Table 49 The results show that global competitiveness
explained an additional 07 percent (Δ R2 = 0007) on the direct effect of performance
measurement on customer satisfaction The change in the F-value caused by the
moderating effect was 0343 and was not significant since the derived p-value of 0569
was greater than 005 Since the derived p-value was greater than 005 the hypothesis
was supported and therefore failed to be rejected The performance measurement variable
had a t-value of 5789 and was statistically significant while the effect of global
competitiveness was positive although not statistically significant
117
Tale 49 Moderating Effects of Global Competitiveness
Model Summary
Model R R
Square
Adjusted
R
Square
Std Error of the Estimate Change Statistics
R Square
Change
F
Change
df1 df2 Sig F
Change
1 858a 736 715 06599 736 36176 1 13 000
2 862b 743 700 06772 007 343 1 12 569
a Predictors (Constant) Performance Measurement
b Predictors (Constant) Performance Measurement Global Competitiveness
ANOVAa
Model Sum of
Squares
Df Mean Square F Sig
1
Regression 158 1 158 36176 000b
Residual 057 13 004
Total 214 14
2
Regression 159 2 080 17346 000c
Residual 055 12 005
Total 214 14
a Dependent Variable Customer Satisfaction
b Predictors (Constant) Performance Measurement
c Predictors (Constant) Performance Measurement Global Competitiveness
Coefficientsa
Model Unstandardized Coefficients Standardized
Coefficients
t Sig
B Std Error Beta
1
(Constant) -755 173 -4376 001
Performance
Measurement 389 065 858 6015 000
2
(Constant) -1178 743 -1585 139
Performance
Measurement 386 067 850 5789 000
Global
Competitiveness 117 199 086 586 569
Source Field Data (2015)
A model equation of the moderating effect of global competitiveness on the relationship
between performance measurement and customer satisfaction impelled by performance
measurement is described in equation 43
Customer Satisfaction = -1178 + 0386 Performance Improvement + 0117 Global
Competitiveness helliphelliphelliphelliphelliphelliphelliphelliphelliphelliphelliphelliphelliphelliphelliphelliphelliphelliphelliphelliphelliphelliphellip Equation 43
118
This shows that a unit change in performance improvement will result in customer
satisfaction changing by a factor of 0386 The unit change in global Competitiveness
will result in a change in customer satisfaction by 0117 though not statistically
significant In the absence of performance measurement and global Competitiveness
customer satisfaction will change by negative 1178
47 Joint Effect of Performance Measurement Political Stability and Global
Competitiveness on Customer Satisfaction
The fourth objective of the study was to establish the joint effect of political stability and
global competitiveness on the relationship between performance contracting and
measurement and customer satisfaction in the services delivered by Kenyalsquos public
sector Hypothesis four was formulated as
H4 There is no significant joint effect of political stability and global competitiveness on
the relationship between performance contracting and measurement and public service
delivery in Kenya
The results of the analysis carried out to establish the joint effect of performance
measurement political stability and global competitiveness on customer satisfaction are
shown in Table 410 The results show that performance measurement political stability
and global competitiveness were positively related to customer satisfaction The joint
effect of the three independent variables explained 785 percent (R2 = 0785) of customer
satisfaction levels with the remaining 215 percent accounted for by other factors
implemented in the public sector The F-value for the model was 13380 and the derived
p-value was 0001 Since the derived p-value was less than 005 with table value of 2145
as compared to a calculated value of 6213 the hypothesis was rejected hence
119
performance measurement political stability and global competitiveness had jointly a
significant relationship with customer satisfaction The performance measurement
variable had a t-value of 6213 and was statistically significant Political stability and
global competitiveness on the other hand were found to individually have negative effects
on customer satisfaction The negative effects were however not statistically significant
Table 410 Joint Effect of Performance Measurement Political Stability Global
Competitiveness on Customer Satisfaction
Model Summary
Model R R Square Adjusted R Square Std Error of the
Estimate
1 886a 785 726 06471
a Predictors (Constant) Global Competitiveness Performance Measurement Political Stability
ANOVAa
Model Sum of
Squares
Df Mean Square F Sig
1
Regression 168 3 056 13380 001b
Residual 046 11 004
Total 214 14
a Dependent Variable Customer Satisfaction
b Predictors (Constant) Global Competitiveness Performance Measurement Political Stability
Coefficientsa
Model Unstandardized
Coefficients
Standardized
Coefficients
t Sig
B Std
Error
Beta
1
(Constant) -1010 720 -1404 188
Performance
Measurement 401 065 883 6213 000
Political Stability -271 185 -235 -1464 171
Global
Competitiveness -036 217 -026 -165 872
a Dependent Variable Customer Satisfaction
Source Field Data (2015)
A model equation of the joint effect relationship is described in equation 44
Customer Satisfaction = -101 + 0401 Performance Improvement ndash 0271 Political
Stability ndash 0036 Global Competitiveness helliphelliphelliphelliphellip helliphelliphelliphelliphelliphelliphellipEquation 44
120
The equation demonstrates that a unit change in performance improvement intervened
and mediated respectively by political stability and global competitiveness will result in
customer satisfaction changing by a factor of 0401 In the absence of performance
measurement political stability and global competitiveness customer satisfaction will
change by negative 101 In the study of the joint effect of political stability and global
competitiveness on the relationship between performance contracting and measurement
and public service delivery it was found that for a unit percentage change in political
stability there would be a 0271 decrease in customer satisfaction while a unit
percentage change in global competitiveness would result in a decrease of 0036in
customer satisfaction although both were individually not statistically significant
48 Summary of Tests of Hypotheses
Table 411 shows the summary of the tests of the hypotheses The results show that three
of the studylsquos hypotheses were supported while one hypothesis went unsupported
Table 411 Summary of Tests of Hypotheses
Hypothesis Empirical Evidence R2 F
H1 There is no significant relationship between
performance contracting and measurement and
public service delivery in Kenya
Rejected there4 there as
a significant
relationship
0736 36176
H2 There is no significant intervening effect of
political stability on the relationship between
performance contracting and measurement and
public service delivery in Kenya
Rejected there4 there
was a significant
effect
0784 2712
H3 There is no significant moderating effect of
global competitiveness on the relationship
between performance contracting and
measurement and public service delivery in
Kenya
Failed to be rejected
there4 proposition was
accepted
0743 0343
H4 There is no significant joint effect of political
stability and global competitiveness on the
relationship between performance contracting
and measurement and public service delivery in
Kenya
Rejected there4 there
was a significant
joint effect
0785 1338
Source Field Data (2015)
121
Hence the conclusions from the findings along with R2 and F values are summarized as
indicated in the table below
Table 412 Conclusion from Findings
Hypothesis R2 F
H1 There is no significant relationship between performance
contracting and measurement and public service delivery in Kenya
0736 36176
H2 There is no significant intervening effect of political stability on the
relationship between performance contracting and measurement
and public service delivery in Kenya
0784 2712
H3 There is no significant moderating effect of global competitiveness
on the relationship between performance contracting and
measurement and public service delivery in Kenya
0743 0343
H4 There is no significant joint effect of political stability and global
competitiveness on the relationship between performance
contracting and measurement and public service delivery in Kenya
0785 1338
Source Field Data (2015)
49 Discussion of the Findings
The study brought out interesting inferences on the relationship between performance
contracting and measurement and public service delivery in Kenya The finding that
measurement was highly correlated with both improvement in performance and customer
satisfaction did not come as a huge surprise and vindicates both the observation by
Osborne et al (1992) that ―what gets measured gets done and the statement by Brown
et al (2001) that people make decisions and do their work at least partly based on how
their performance is measured and evaluated As a result they tend to improve in
performance aspects that will be measured and rewarded rather than in un-measured
aspects even if these do not necessarily support organizational goals and customer
satisfaction It also supports statements by Nathan (2009) that the utility of performance
management practices is predicated on sound performance measurement system and the
latter should be seen as a prerequisite for effective management and that performance
122
management practices will continue to be questionable unless they are rooted in a
performance measurement system Moreover there is a distinct linkage between
organizational performance and excellence in public service delivery It is also consistent
with the findings of research by Martinez amp Kennerley (2005) that performance
measurement and management systems deliver superior results and focus peoples
attention on what is important to an organization propel business improvement improve
customer satisfaction increase productivity align operational performance with strategic
objectives align people behaviors towards continuous improvement and improve
company reputation
The effects of political stability have been documented in both Kenya and the Kingdom
of Lesotho The fortunes of Kenya as evidenced by growth in real GDP plummeted
steeply following the 2007-2008 post-election skirmishes which fomented widespread
political instability pitting communities against each other The growth rates including
the post-election period are indicated in Appendix III Business activity in Lesotho was
severely albeit gradually affected by political instability resulting from polarization in a
loose coalition government Political stability is closely intertwined with the quality of
political governance with poor governance precipitating instability and vice versa As had
been the case in the Kingdom of Lesotho between 2012 and early 2015 the Republic of
Kenya was under the governance of a loose coalition of parties that did not agree on
many fronts between 2008 and early 2013
The most curious findings were that outside the relationship between performance
contracting and measurement and public service delivery political stability and global
competitiveness on their own did not have significant effect on customer satisfaction
That even within the relationship only political stability had a significant relationship
123
This is somewhat surprising considering the impact political instability had on economic
growth and performance in Kenya in 2008 and considering further ras observed earlier in
the study that improvement in organizational performance informs improvement in
service delivery It would be expected too that improvement in global competitiveness
would moderate the performance of an economy This was not the case as brought out in
the study
Overall the outcomes of the study should be of practical interest to governments desirous
to improve public sector performance practitioners in the field of performance
contracting and measurement and public service delivery academicians and the public as
beneficiaries of public services as the following chapter indicates
410 Chapter Summary
This chapter presented the research findings and the corresponding interpretations based
on the objectives and hypothesis It presented the findings in a chronological order based
on study hypothesis relating the findings with the previous literature Discussion of the
major findings was also presented
Composite data of study variables were also tested and interpreted using mean scores
coefficients of variations and significance levels Varied outcomes were noted Most of
the variables had moderately high rankings with statistically significant levels meaning
that performance contracting and measurement explained the variation in service delivery
in public service
124
CHAPTER FIVE
SUMMARY CONCLUSIONS AND RECOMMENDATIONS
51 Introduction
This chapter includes a summary of the findings of the study along with interpretation of
the results further discussion of the findings the conclusions made from the findings
limitations of the study and suggestions for further research The findings and
conclusions which have important implications for public policy formulation and
implementation management of mainly public but also private sector organizations
academicians general practitioners and significantly the operations research community
are based on the research objectives and hypotheses
A number of the findings and conclusions are consistent with both the empirical work
carried out in this area and the theoretical assertions captured in both the introduction to
the study and the literature review Some of the findings may also however have been
influenced by the unique peculiarities of the Kenyan situation and could conceivably
differ with other empirical and academic work to this extent
The specific objectives of the study were the following to determine the relationship
between performance contracting and measurement and public service delivery in Kenya
to establish the intervening effect of political stability on the relationship between
performance contracting and measurement and public service delivery in Kenya to
establish the moderating effect of global competitiveness on the relationship between
125
performance contracting and measurement and public service delivery in Kenya and to
establish the joint effect of political stability as well as global competitiveness on the
relationship between performance contracting and measurement and public service
delivery in Kenya Four hypotheses were drawn from the above objectives and from the
conceptual framework and accepted on the basis largely of significance as evidenced by
the various statistical tests
52 Summary of the Findings
The research study was focused on the relationship between performance contracting and
measurement on the one hand and public service delivery on the other as intervened and
moderated by respectively political stability and global competitiveness Performance
contracting as practiced and implemented in the public service in Kenya is essentially a
performance management measurement and improvement system The essence of the
system is that it ensures measuring and improving the performance of all key factors by
focusing on multiple management perspectives which include finance and stewardship
operations service delivery and non-financial and dynamicqualitative aspects and using
weighted and composite scores to measure the performance This is consistent with the
statements by Hayes and Clark that ―In reality the productivity a firm achieves is a
function of how efficiently it uses all its inputs ndash labor capital technology and energy ndash
to produce outputs (Hayes and Clark 1986) By introducing the intervening and
moderating variables focusing on a large population of diverse public agencies the study
set itself aside from the empirical studies referred to earlier in the study Inclusion of
these distinctions was deliberate as attempts to address knowledge gaps and addition to
the existing stock of knowledge in the field
126
The key finding was that performance measurement is critical to improvement in public
service delivery and accounts for or explains 736 percent of improvement in service
delivery with a unit change in measurement of performance resulting in a change of
0389 in customer satisfaction Other findings were that both political stability and global
competitiveness had significant effects on the relationship between performance
improvement ndash which is the outcome of performance contracting and measurement - on
the one hand and service delivery on the other Deterioration in political stability affects
service delivery adversely while improvement in global competitiveness has a positive
effect on service delivery The converse obtains as true when the intervening and
moderating variables are moving in opposite directions Taken together the three
independent variables explained 785 percent (R2 = 0785) of customer satisfaction levels
with the remaining 215 percent accounted for by other factors implemented in the public
sector The study established further that on their own individually both political stability
and global competitiveness had no significant relationship with service delivery and
would therefore not significantly affect customer satisfaction
Preliminary findings had indicated that all the four variables ndash customer satisfaction
performance measurement political stability and global competitiveness were related but
not perfectly Performance measurement was singled out as the most highly correlated
with customer satisfaction (R = 0858) and the relationship was significant at 99 percent
confidence level This clearly underscores the importance of performance measurement
in the improvement of both performance and customer satisfaction Again this is
consistent with the contention by Brown et al (2001) that ―Measurement is not only a
way of determining what has already happened which is like driving by looking in the
127
rear-view mirrorlsquo but is also a way of getting people to act in ways that will bring about
desired future outcomes It probably came as little surprise that the public sector in Kenya
had an average customer satisfaction index of 027779 implying that 72 percent of
customers were dissatisfied with public service delivery Performance measurement had
the highest variability (SD = 027255) across the public sector made up of ministries
state corporations local authorities and tertiary institutions Political stability was found to
be weak with a mean of -131533 on a scale of -25 (very weak) and 25 (very strong)
Global competitiveness on the other hand was found to be average of 3698 on a scale of
1 (very low) and 7 (very competitive)
53 Conclusion
The preliminary findings pointed out that customer satisfaction performance
measurement political stability and global competitiveness are related but not perfectly
Based on the research findings it can be concluded that performance measurement has a
significant effect on customer satisfaction Secondly it can be concluded that political
stability has an intervening effect on the relationship between performance measurement
and customer satisfaction Further global competitiveness has a moderating effect on the
relationship between performance measurement and customer satisfaction although on
their own political stability and global competitiveness have no significant effect on
customer satisfaction
54 Implications of the Study Findings
The following are the implications of this study for the various constituents including the
government at the policy formulation and implementation levels the public as the
customer and consumer of government services and the academic and operations
management fraternity and practitioners
128
541 Implications for Public Policy Formulation and Implementation
The study findings have important implications for future policy formulation and
execution in the public sector This is because the study has clearly brought out the key
variables the management of the public sector needs to put higher resources and effort
into in the pursuit of improved performance of the public service and increasing
efficiency in the exploitation and use of public resources Top of the variables with the
most significant relationship with service delivery and customer satisfaction was
performance measurement which explained 736 percent of customer satisfaction levels
implying as in the words of caution by Nathan (2009) then keep boomeranging that ―hellip
performance measurement should not be confused with performance management but
should instead be seen as a prerequisite for effective management Further that ―hellip the
value of performance management practices will continue to be questionable unless they
are rooted in a performance measurement system that continuously feeds decision
making as well as produces evidence and supports communication of value added
(Nathan 2009) Clearly too performance measurement within the context of
performance contracting facilitates improvement in service quality vindicating
Druckerlsquos (1999) statements that if it canlsquot be measured it canlsquot be managed what gets
measured gets watched and what gets watched gets done It would accordingly serve
governments well in the pursuit of performance improvement that all forms of
performance should be subjected to measurement As Osborne et al (1992) contends
―what gets measured gets done
129
The effects of the intervening and moderating factors cannot also be wished away The
study brings out that political stability had a positive albeit weak relationship with
customer satisfaction explaining 18 percent of customer satisfaction levels while
global competitiveness also had a weak positive relationship with customer satisfaction
explaining 25 of customer satisfaction levels The implication here is that the status
of political stability has a role in defining the direction customer satisfaction assumes
The core essence of political stability is the quality of governance Improvement in the
quality of governance which largely defines political stability impacts positively on
service delivery and combines with performance measurement to improve customer
satisfaction Decline in political stability (political instability) precipitates the converse
principally because it affects performance adversely This stark reality has begun to show
its glare in the performance of the tourist industry in the Kingdom of Lesotho This tiny
mountain kingdom experienced serious political turmoil following the formation of a
loose coalition government after the May 2012 general elections The situation
deteriorated in June 2014 leading to the collapse of the coalition an unscheduled
prorogation of parliament and ultimate Southern African Development Community
(SADC) mediated agreement to hold early elections in February 2015
According to a statement issued by the public relations manager of the Lesotho Tourist
Development Corporation (LTDC) to the local media ―The tourism industry is feeling
the pinch of a drastic decline in the inflow of tourists as well as decreased spending by
both corporate and individual consumers owing to the political and security instability
rocking the mountain kingdom Despite the LTDC efforts in marketing Lesotho as a
tourist and investment destination political turmoil had left the sector reeling Businesses
130
have reported a downturn in revenue for lodging food events and other hospitality
services In Kenya political instability following the 20072008 post-election skirmishes
resulted in sharp decline in economic growth from a high of 71 in 2007 to a measly
17 in 2008 and a proportionally sharp decline in aggregate performance of the public
service (Appendices VII and IX)
On the other hand improvement in global competitiveness when taken together with
performance measurement induces improvement in service delivery and increases
customer satisfaction and vice versa It should finally be noted that the joint effect of the
three variables working together that is measurement premised on improved governance
and global competitiveness have a significantly dominant effect on customer satisfaction
542 Implications for the Customer
The constituency most affected by the performance of the government is essentially the
citizen who is also the tax payer The brunt of flawed service delivery is borne fully by
the citizen while improvement in service delivery serves to improve customer
satisfaction underwrite demonstrable value on the tax shilling and build trust in
government When a government is able to identify and manage the factors that influence
and affect service delivery it is better able to relate with the citizen and to improve
customer satisfaction with public services
Moreover identifying the key factors affecting performance helps in not only focusing of
public resources in the right areas but also refocusing of managerial effort to address
customer-centric issues This will ensure a government that as Clinton (1995) states has
a lower cost and a higher quality of service and one that changes along with the people it
131
serves in order to cure the anxiety and alienation many people feel toward their
government Clinton (1995) adds for good measure that people will regain confidence in
government if we make it work better That there is need to make quality management
the culture of government so that no future administration can fail to embrace it
543 Implications for the Academic Community
A number of postulates by practitioners and writers in the field of performance
management measurement and improvement have been largely vindicated by the
findings of the study while others have failed to find accommodation The findings of the
study vindicate the assertion by Nutt (2008) In a study carried out in 2008 Nutt
compared the success of organizational decisions among three groups and found that
those who made decisions based on the use of quantified performance data were
significantly more successful than those who made decisions on the basis of personal
―hunches or feelings or on the basis of consensus of opinions of others This does not
suggest that the two latter perspectives do not have their utility rather it suggests that
they must be triangulated with independently verifiable performance data The robustness
of performance management including its capacity to influence performance is therefore
up - scaled by rooting it in a system that quantifies performance and provides evidence-
based data
Nutt (2007) opines that beyond implementing research findings to improve performance
there is a critical requirement to implement evidence-gathering practices into
performance management Nutt (2007) cites a variety of studies that indicate intelligence
gathering is the most overlooked step of the decision making process It can be safely
concluded therefore that performance measurement is at the heart of managing and
132
improving performance (Rummler 2004) yet according to the research it is often
overlooked (Clark amp Estes 2000 Guerra-Loacutepezamp Leigh 2009) As Garvin (1993) states
―hellipif something cannot be measured it cannot be managed Lebas (1995) goes to the
extreme of negating the existence of performance management without measurement
Performance management ―hellipis instrumental for businesses in providing feedback to
employees allocating resources adopting a long - term perspective continuously
improving the organization improving communication and motivating employees
(Sinclair amp Zairi 1995) Martinez and Kennerley (2005) argued that performance
measurement and management systems deliver superior results and have the following
positive effects focus peoples attention on what is important to an organization propel
business improvement improve customer satisfaction increase productivity align
operational performance with strategic objectives improve people satisfaction align
people behaviors towards continuous improvement and improve company reputation
At the expense of redundancy there is need to reflect on the views of Nathan (2009) that
performance measurement should not be confused with performance management but
should instead be seen as a prerequisite for effective management Further that ―hellip the
value of performance management practices will continue to be questionable unless they
are rooted in a performance measurement system that continuously feeds decision
making as well as produces evidence and supports communication of value added He
proceeds to state that the first condition to improve and ultimately achieve business
excellence and which must be an attribute of an effective Performance Management
System is provision for an elaborate system for performance measurement and
evaluation This helps in establishing progress towards goals By knowing the real path
133
for excellence an organization can identify where to improve and how its limited
resources can be more effectively used for this improvement Aguinis (2007) Aguinis
Joo and Gottfredson (2011) Biron Farndale and Paauwe (2011) Hantula (2011)
Nankervis and Compton (2006) Pulakos and OlsquoLeary 2011) contend however that
although organizational use of performance management systems is widespread
dissatisfaction among both management and employees is also high and the value added
questionable at best They proceed to argue that performance management has the
potential to generate significant value for organizations but it is frequently ineffective is
often viewed skeptically by employees typically requires a significant investment of
resources and capital and may actually undermine strategic improvement when
implemented poorly (Aguinis 2007 2009 Biron et al 2011 Pulakos amp OlsquoLeary 2011)
These contentions can however be traced back to both poor measurement of important
performance indicators and consequently poor alignment to performance management
interventions
Performance measurement is a central mechanism in both assessment and evaluation
which provides the required data for identifying the most appropriate interventions to
measurably improve performance (Guerra-Loacutepez 2008 2010) The robustness of
performance management including its capacity to influence performance is therefore up
- scaled by rooting it in a system that quantifies performance and provides evidence based
data Nutt (2007) opines that beyond implementing research findings to improve
performance there is a critical requirement to implement evidence-gathering practices
into performance management
134
The findings of the study appear to be largely consistent with the conclusions in three of
the past four related studies cited in this report but contradicts the findings of the fourth
study The studies their objectives and findings are shown in Appendix X The apparent
divergence in the studieslsquo findings notwithstanding the study brings out the essence and
critical role that measurement has on performance improvement leading ultimately to
improvement in service delivery and customer satisfaction
From a public policy perspective the findings point to the importance of formulating
deliberate national policies that allow for the development and employment of strong
performance management measurement and improvement policies and systems by
governments Further it is important to keep in mind the affirmation by Nathan (2009)
that ―hellip the value of performance management practices will continue to be questionable
unless they are rooted in a performance measurement system that continuously feeds
decision making as well as produces evidence and supports communication of value
added in addition to the statement by Brown et al 2001 that ―Measurement is not only
a way of determining what has already happened which is like driving by looking in the
rear-view mirrorlsquo but is also a way of getting people to act in ways that will bring about
desired future outcomes Deliberate measurement of performance should therefore be
the core attribute of public sector performance management systems
55 Limitations of the Study
The obvious limitations of the study relate to the weaknesses of cross-sectional study
designs that cross-sectional designs only provide a snapshot of analysis so there is
always the possibility that a study could have differing results if another time-frame had
been chosen Further that the studies cannot be utilized to establish cause and effect
135
relationships Other limitations were occasioned by the dismantling of particularly
ministerial structures by the constitution of 2010 The constitution drew clear lines
between the functions of the national government and the newly established county
governments and this affected the structuring and functioning of the residual 18
ministries significantly relative to the earlier government structure which was organized
around 46 ministries and accounting departments
The subsequent lumping together of several ministerial functions resulted in complex
functional tradeoffs and triangulation of functions This meant that it became difficult to
identify any one earlier ministerial performance contract with the emergent ministries
thereby curtailing the possibility of obtaining coherent survey information or conducting
meaningful performance trend analysis The other limitation was to do with lack of a
standardized tool for measuring customer satisfaction leaving external consultants to
devise and use often disparate measurement tools Poor understanding and appreciation
of the precepts of the concept and essence of customer satisfaction led occasionally to
review of customer satisfaction scores
56 Suggestions for Further Research
The study findings reveal a number of questions that still need to be addressed It will be
recalled for example that the study established that performance measurement explains
736 percent of customer satisfaction levels Political stability explains 18 percent while
global competitiveness explains 25 percent The three variables explain 785 percent of
customer satisfaction levels Further research is required to establish what other factors
could explain the remainder of the customer satisfaction level that was not explained by
the above variables
136
In addition it emerged that on their own political stability and global competitiveness do
not individually have an effect on customer satisfaction This comes as a surprise
because the default perception is that a country going through political turmoil
precipitated by poor governance would in the same vein record lower performance and
service delivery levels Equally the default expectation in a situation where global
competitiveness is either improving or declining would be that performance and service
delivery would assume a concomitant direction These contradictions require further
research
The study was carried out for a period that the government in Kenya was a loose political
coalition where project implementation and the process of governance were often
interposed by constant coalition squabbles It may be apt to establish whether the findings
of the study would have been different with a unitary government or a more solid
coalition
137
REFERENCES
Aguinis H (2007) Performance management Upper Saddle River NJ Pearson
Education Inc
Aguinis H Joo H amp Gottfredson R K (2011) Why we hate performance
managementmdash and why we should love it Business Horizons 54 503ndash507
Aisen A amp Veiga F J (2011) IMF Working Paper How Does Political Instability
Affect Economic Growth International Monetary Fund Working paper
WP1112
Alesina A Ozler S Roubini N amp Swagel P (1992) Political Instability and Economic
growth Journal OF Economic Growth 1(2) 189-211
Amaratunga Beldry amp Majani (2001) From intention to action A theory of planned
behaviour citato in Zani B Cicognani E (2000) Psicologiadellasalute Il
Mulino Bologna
Anderson E W (1994) Customer Satisfaction and Word-of-Mouth Journal of Service
Research 1(1) 5-17
Anderson E W Fornell C amp Rust R T (1994) Customer Satisfaction Productivity
and Profitability Difference between Goods and Services Marketing Science
16(2)
Arnberg M (1996) Informing Clients Statements of Service Information and Service
Standards in OECD (1996) pp 245-264
Baldrige P E (2011) Baldrige performance excellence the foundation for national
malcolm bridge national quality award NIST Planning Report 01-3
Banker R D Charnes A amp Cooper W W (1984) Some models for estimating
technical and scale inefficiencies in data development analysis Management
Science 30(9) 1078-1092
138
Banks R L amp Wheelwright S C (1979) Operations versus strategy plusmn trading
tomorrow for today Harvard Business Review MayJune 112-20
Behn R (2001) Rethinking Democratic Accountability Washington Brookings
Institution
Bennett W (1990) Repairing the news a case study of the news paradigm Journal of
Communication 35(2) 50-68
Bereiter C amp Scardamalia M (1993) Surpassing ourselves an inquiry into the nature
and implications of expertise Chicago Open Court
Bird S M Cox D Harvey G Tim H amp Smith P C 2003) Performance indicators
good bad and ugly report of the royal statistical society working party on
performance monitoring in the public service London Royal Statistical Society
Biron M Farndale E amp Paauwe J (2011) Performance management effectiveness
Lessons from world leading firms The International Journal of Human Resource
Management 22 1294ndash1311
Bititci U Garengo P Doumlrfler V amp Mendibil K (2009) Performance measurement
questions for tomorrow SIOM Research Paper Series (October)
Bititci U (2011) Performance Measurement Challenges for Tomorrow International
Journal of Management Reviews 14(3) 305 ndash 327
Bititci U Carrie A S amp McDevitt L (1997) Integrated performance measurement
systems a development guide International Journal of Operations and
Production Management 17(5) 522-534
Blalock A B (1999) Evaluation Research and the Performance Management
Movement From Estrangement to Useful Integration Evaluation 5(2) 117 - 149
139
Boland T amp Fowler A (2000) A Systematic Perspective of performance management in
public sector organizations The International Journal of Public Sector
Management 13(June) 15
Boulding K F (1956) General systems theory The skeleton of science Management
Science 2 197-208
Boulding W (1990) Commentary on Unobservable Effects and Business Performance
Do Effects Really Matter Marketing Science 9 (Winter) 88-91
Bourne M Neely A Mills J amp Platts K (2003) Implementing performance
measurement systems a literature review International Journal of Business
Performance and Management 5(1) 1-24
Bransford J D Brown A L Cocking amp R R (Eds) (2000) How people learn
Brain mind experience and school Washington DC National Academy Press
Braverman E amp Kuntz M (2012) Innovation in government India and Estonia New
Delhi McKinsey amp Company
Broeckling J (2010) Performance Measurement Theory and Practice Research Paper
Marquette University
Brown S Blackmon K Paul Cousins P amp Maylor H (2001) Operations
Management ndash Policy Practice and Performance Improvementrdquo Paper Back
Buckley W (Ed) (1968) Modern systems research for the behavioral scientist
Hawthorne NY Aldine de Gruyter
Buffa E S (1980) Research in operations management Journal of Operations
Management 1(1) 1-8
Buzachero V V Phillips J Phillips P Pamp Phillips Z L (2013) Proving ROI Value
of Healthcare Education and Training Simulation Programs Measuring ROI in
140
Healthcare Tools and Techniques to Measure the Impact and ROI in Healthcare
Improvement Projects and Programs 2013
Bynoe I (1996) Beyond the citizens charter new directions for social rights London
IPPR
Center for Public Policy Studies (2012) Political Stability ndash an advantage or a curse
Chan Y L (2004) Performance measurement and adoption of balanced scorecards A
survey of municipal governments in the USA and Canada International Journal
of Public Sector Management 17(23) 204-221
Charnes A Cooper W W amp Rhodes (1978) Measuring efficiency of decision-making
units European Journal of Operations Research 2(6) 429-44
Chase R B (1980) A classification and evaluation of research in operations
management Journal of Operations Management 1(1) 9-14
Cho Y amp Yoon SW (2010) Theory development and convergence of human resource
fields Implications for human performance technology Performance
Improvement Quarterly 23 39ndash56
Citizens Charter Raising the Standard (1991) White Paper Cm 1599 London HMSO
Citizens First EU Rights on Equal Opportunities Buying Goods and Services and
Travelling (1997)
httpeuropaeuintconundg15 enupdatecitizen1035htm Brussels
Civil Service Reforms CAB (03)115 (2004) Cabinet Memorandum on civil service
reforms Government of Kenya Cabinet Office
Clark R E amp Estes F (2000) A proposal for the collaborative development of
authentic performance technology Performance Improvement 39 48ndash53
141
Claus L amp Briscoe D (2009) Employee performance management across borders A
review of relevant academic literature International Journal of Management
Reviews 11 175-196
Clinton B (1995) Forward to Vice President Al Gorersquos Common Sense Government
works better and costs less New York Random House
Corte-Real I (1996) Current and Future Developments in Quality Initiatives in the
Portuguese Public Administration in OECD (1996) 39-47
Covaleski W R (2006) Institutions and organizations Thousand Oaks Sage
Publications
Craig CE amp Harris CR (1973) Total productivity measurement at the firm level
Sloan Management Review 14(3) 13 ndash 29
Crosby P B (1972) Quality is free New York McGraw Hill
Cunningham K amp Ricks M (2004) Why measure Stanford Social Innovation Review
2(1) 44-51
Cyert M amp March J (2002) The pursuit of organizational intelligence Oxford
Blackwell
Danks S (2013) Performance measurement systems and culture an integrative literature
review Learning and Performance Quarterly 2(1) 30-44
Davenport T H (1993) Process innovation reengineering work through information
technology Cambridge MA Harvard Business School Press
De Vaus D A (2001) Research Design in Social Research London SAGE
Deadrick D L amp Gibson P A (2009) Revisiting the researchndashpractice gap in HR A
longitudinal analysis Human Resource Management Review 19 144ndash153
142
Deming W E (1982) Quality productivity and competitive position Cambridge MA
MIT Center for Advanced Engineering Study
Deming W E (1986) Out of the crisis Cambridge MA MIT Press
Den Hartog D N Boselie P amp Paauwe J (2004) Performance management A model
and research agenda Applied Psychology 53 556ndash569
Developing Service Charters (1997) httpwwwdistgovauconsumer
chartersdevelophtmoverviewhtml Canberra
Dixon JR Nanni A J amp Vollmann T E (1990) The New Performance Challenge
Measuring Operations for World-class Competition Homewood Ill Dow Jones-
Irwin drive performance Harvard Business Review 70(1) 71-79
Dixon J amp Bitton F (2005) Researching performance measurement system
implementation DOI 101111j1365-
Dresner M E amp Windle R J (1992) Airport dominance and yields in the US airline
industry Logistics and Transportation Review 28(4) 319ndash339
Dresner M amp Xu K (1995)Customer service customer satisfaction and corporate
performance in the service sector Journal of Business Logistics 16 (1) 23-40
Drucker P (1954) The practice of management New York Harper
Drucker P (1990) Control Controls and Management in C P Bonini R K Jaedieke
and H M Wagner Management Controls New Directions in Basic Research
McGraw
Drucker P (1999) Management challenges for the 21st Century Taylor amp Francis Ltd
Drucker P F (1964) Managing for results economic tasks and risk-taking decisions
New York Harper Collins
143
Drucker P F (1990) The emerging theory of manufacturing Harvard Business Review
68(3) 94-102
Eccles Robert G Jr (1991) The Performance Measurement Manifesto Harvard
Business Review 69(1)
Edwin L amp Latham P G (1990) A Theory of Goal Setting and Task Performance
New York Prentice Hall
Farrell D amp Goodman A (2013) Government by design four principles for a better
public sector Waltham MA Mackinsey amp Company
Feigenbaum AV (1961) Total Quality Control New York McGraw Hill
FitzGerald J M amp FitzGerald A F (1973) Fundamentals of systems theory New
York Wiley
Fitzgerald L Johnston R Brignall TJ Silvestro Ramp Voss C (1991)Performance
Measurement in Service Businesses London The Chartered Institute of
Management Accountants
Fletcher J L (1993) Patterns of high performance Discovering the ways people work
best San Francisco Berret-Koehler Publishers
Flynn N (1990) Public sector management London HarvesterWheatsheaf
Fornell Claesamp Lehman Donald R (1994) Customer Satisfaction Market Share and
Profitability Journal of Marketing 56(July) 53-66
Fornell Claes (1992) A National Customer Satisfaction Barometer The Swedish
Experience Journal of Marketing January 1-21
Franco-Santos M Kennerley M Micheli P Martinez V Mason S Marr B Gray
D amp Neely A (2007) Towards a definition of a business performance
144
measurement system International Journal of Operation and Production
Management 27(8) 784-801
Fry TD amp Cox J F (1989) Manufacturing performance local versus global measures
Production and Inventory Management Journal 2nd Quarter 52-56
Fuller T (1661) English preacher historian and scholar London Institute OF
Historical Research
Garvin D A (1993) Manufacturing strategic planning California Management Review
35(4) 85-106
Garvin D A (1987) Competing on the eight dimensions of quality Harvard business
Review 65(6) 101-9
Gates S (1999) Aligning strategic performance measures and results New York The
Conference Board
Geniat M A amp Libert F H (2002) Communicating and Controlling Strategy an
Empirical Study of the Effectiveness of the Balanced Scorecard Journal of
Management Accounting Research 13
Ghalayini A M amp Noble J S (1996) The changing basis of performance measurement
International Journal of Operations and Production Management 16(8) 63-80
Ghasemi A amp Zahediasl S (2012) Normality tests for statistical analysis a guide for
non-statisticians International Journal of Endocrinology and Metabolism 10(2)
486-489
Gore Al (1995) Common Sense Government Works better and costs less New York
Random House
Gradous D B (Ed) (1989) Systems theory applied to human resource development
Alexandria VA American Society for Training and Development
145
Griliches Z (1971) Price indices and price change Cambridge MA Harvard
University Press
Guerra-Loacutepez I (2008) Performance evaluation Proven approaches for improving
program and organizational performance San Francisco CA Jossey-Bass
Guerra-Loacutepez I (2010) Performance measurement and management systems Hoboken
NJ John Wiley amp Sons
Guerra-Loacutepez I amp Hutchinson A (2013) Measurable and continuous performance
improvement The development of a performance measurement management and
improvement system Performance Improvement Quarterly 26(2) 159-173
Guerra-Loacutepez I amp Leigh H (2009) Are performance improvement professionals
measurably improving performance What PIJ and PIQ have to say about the
current use of evaluation and measurement in the field of performance
improvement Performance Improvement Quarterly 22 97ndash110
Halachmi A(2002) Performance Measurement and Government Productivity
Work Study 51(2) 63 ndash73
Halachmi A amp Bouckaert G (1995) Re-engineering in the Public Sector International
Review of Administrative Sciences 61(3) 323 - 327
Hall J (2009) Cross-Sectional Survey Design Health knowledge Cross-Sectional
Study Wikipedia
Hall J (2009) Cross-sectional survey design in encyclopedia of survey research
methods Thousand Oaks CA Sage
Harbor J L (2009) The basics of performance measurement New York NY
Productivity Press
146
Hayes R H Garvin D A (1982) Managing as if tomorrow mattered Harvard Business
Review 60(3) 70-79
Hayes R H amp Clark K B (1986) Why some factories are more productive than others
Harvard Business Review 64(5) 66-73
Hayes R H Abernathy W J (1980) Managing our way to economic decline Harvard
Business Review 62 95-101
Hergenhahn B R amp Olson M H (1993) An introduction to theories of learning (4th
ed) Englewood Cliffs NJ Prentice Hall
Hofstede G (1981) Management control of public and not for profit activities
Accounting Organizations and Society 6(3) 193-211
Hofstede G (1981) Management control of public and not for profit activities
Accounting Organizations and Society 6 (3) 193-211
Hubbard DW (2010) How to measure anything Finding the value of intangibles in
business Hoboken NJ Wiley
Hudson M M (2006) Performance management and service delivery in the department
of Water affairs and forestry (DWAF) Postgraduate thesis paper university of
South Africa
Hudson M Smart A amp Bourne M (2000) Theory and Practice in SME performance
measurement systems International Journal of Operations and Production
Management 21(8) 1096 -1115
Ilgen D R amp Klein H J (1990) Individual motivation and performance cognitive
influences on effort and choice San Francisco Jossey Bass
Jerry L H (2010) The Basics of Performance Measurement 2nd
edition International
Journal of Production Research 48(12)
147
Johnson C amp Talbot C (2006) The UK Parliament and Performance Challenge or
Challenged American Review of Public Administration under review
Johnson H T (1975) Management accounting in an early integrated industrial E I du
Pont de Nemours Powder Company 1903ndash1912 Business History Review 44(2)
184ndash204
Johnson H T amp Kaplan R S (1987) Relevance lost the rise and fall of management
accounting Boston MA Harvard Business School Press
Johnson HT amp Kaplan R S (1987) Relevance lost the rise and fall of management
accounting Boston MA Harvard Business School Press
Johnson HT (1972) Early cost accounting for internal management control Lyman
Mills in the 1850s Business History Review 46(4) 466ndash474
Johnson HT (1978) Management accounting in an early multidivisional organization
General Motors in the 1920s Business History Review 52(4) 490ndash517
Johnson HT (1981) Towards an understanding of nineteenth century cost accounting
The Accounting Review 56(3) 510ndash518
Juran JM (1988) Juranrsquos Quality Control Handbook 4th
ed New York McGraw Hill
Kaplan R amp Norton D (1996) Using the balanced scorecard as a strategic management
system Harvard Business Review Jan ndash Feb 75-85
Kaplan R S amp Norton DP (1992) The balanced scorecard measures that drive
performance Boston MA Harvard Business School Press
Kaplan R S amp Norton DP (2004) The strategy-focused organization how balanced
score-card companies thrive in the new business environment Boston M
Harvard Business School Press
148
Kaplan R S (1983) Accounting lag the obsolescence of cost accounting system
California Management Review Winter 174-199
Kaplan R S Norton DP (1992) The balanced scorecard ndash measures that drive
performance Harvard Business Review 70(1) 71-79
Keegan D P (1989) Are your performance measures obsolete Management
Accounting June 134-47
Kennedy J F (1962) Address given at Rice University Public Papers of the Presidents
of the United States 1 669-670
Kennerley M amp Neely A (2002) A framework of the factors affecting the evolution of
performance measurement systems International Journal of Operations and
Production Management 22 1222-1245
Kobia M amp Mohammed N (2006) Towards an effective Delivery of Public Services in
Africa Kenyan experience with performance contracting Arusha Tanzania
AAPAM annual round table conference
Kravchuck R amp Schack R (2006) Performance contracting rating tool and its use in
budget process Public Performance amp Management Review 30 351-368
Kumar S (1994) Research methodology A step-by-step guide for beginners 2nd
edition Australia Pearson Education
Kurien G P amp Qureshi M N (2011) Study of performance measurement practices in
supply chain management International Journal of Business Management and
Social Sciences 2(4) 19-34
Lancaster K (1979) Variety Equity and Efficiency New York Columbia University
Press
149
Landes D S (2000) Revolution in time clocks and the making of the modern world
Revised and Enlarged Edition Harvard University Press
Langdon D G (2000) Aligning performance improving people systems and
organisations San Francisco Calif Jossey-Bass Pfeifer
Lebas MJ (1995) Performance measurement and performance management The
International Journal of Productivity amp Performance Management 41(1-3) 23-
35
Lefton R E Buzzotta VR Sherberg M amp Karraker D L (1977) Effective
motivation through performance appraisal Canada John Wiley amp Sons Inc
Letts C Ryan W amp Grossman A (1997) Virtuous capital What foundations can
learn from venture capitalists Harvard Business Review 75(2) 36-44
Light P (2000) Making nonprofits work A report on the tides of nonprofit management
reform Washington DC Brookings Institution Press
Locke E (1968) Toward a theory of task motivation and incentives Organizational
Behaviour on Human Performance 3 157-89
Lynch R amp Cross K (1991) Measure up yardstick for continuous improvement
Oxford Blackwell
Maisel L (2001) Performance measurement practices survey results American Institute
of Certified Public Accountants Management 5(1) 1-24
Manchafalo M (2014) Public Relations Manager Lesotho Tourism Development
Corporation Lesotho Times (23rd
October 2014 p17) Tourism sector still
reeling from instability
March J G amp J P Olsen (1989) Rediscovering institutions and the organizational
basis of politics Oxford Maxwell Macmillan International
150
Martinez V amp Kennerley (2005) What is the value of using performance measurement
and management systems government by design Mike Centre for Business
Performance Cranfield School of Management
Maslow AH (1943) A theory of human motivation Psychological Review 50(4) 370ndash
96
Mayo E (1933) The Human Problems of an Industrialized Civilization New York
Macmillan Co
McGregor D (2011) Management education in the network economy its context
content and organization Organizational Dynamics 29 (3) 221ndash225
McKenna S amp Richardson J amp Manroop L (2011) Alternative paradigms and the
study and practice of performance management and evaluation Human Resource
Management Review 21(2) 148-157
McNair C J amp Mosconi W (1987) Measuring performance in an advanced
manufacturing environment Management Accounting 69(1) 8-31
McNair CJ Lynch R L amp Cross K F (1990) Do financial and non-financial
measures have to agree Management Accounting 28-36
Medori Damp Steeple D (2000) A framework for auditing and enhancing performance
measurement systems International Journal of Operation and Production
Management 20(5) 520-533
Meyer J W amp Rowan B (1977) Institutional organizations Formal structure as myth
and ceremony American Journal of Sociology 83 340-363
Mezey M (1979) Comparative Legislatures Durham NC Duke University Press
Modell S (2001) Performance measurement myths in the public sector a research note
Financial Accountability amp Management 20 39-55
151
Mudel M (1987) Measuring Total Productivity of Manufacturing Organizations White
Plains NY Unipub-Kraus International
Mugenda O M amp Mugenda A G (2003) Research methods Qualitative and
qualitative approaches Nairobi African Centre for Technology Studies
Multimedia Development Corporation (2007) Flagship Applications Retrieved
December 2007 from httpwwwmscmalaysiamytopic12073046901815
Mundel M (1987) Measuring total productivity of manufacturing organizations White
Plains NY Unipub-Kraus International
Murray CH (1990) The Civil Service Observed Dublin IPA
Mutahaba G (2010) Performance management monitoring measurement and
evaluation Research paper written for African Union Conference of African
Ministers for Public Service
Nathan RP (2009) Pointcounterpoint Journal of Policy Analysis and Management
26(1) 496ndash516
Neely A D Gregory M J Platts K W (1995) Performance measurement system
design A literature review and research agenda Journal of Operation and
Production Management 25(12) 1228-1263
Neely A (1999) The performance measurement revolution why now and where next
International Journal of Operations and Production Management 19 (2) 205-28
Neely A (2007) Business performance measurement (unifying theory and integrating
practice) Cambridge Cambridge University Press
Neely A D Gregory M J amp Platts KW (1995) Performance measurement system
design A literature review and research agenda Journal of Operation and
Production Management 15(4) 1228-1263
152
Neely A Adams C amp Kennerley M (2002) Performance prism the scorecard for
measuring and managing stakeholder relationships London Financial Times
Prentice Hall
Neely A Adams C amp Kennerley M (2007) Business performance measurement
Unifying theory and integrating practice Cambridge Cambridge University
Press
Neely A Mills J Platts K Richards H Gregory M Bourne M amp Kennerley M
(2000) Performance measurement system design developing and testing a
process-based approach Journal of Operation and Production Management
20(10) 1119-1145
Neely AD (2005) The revolution of performance measurement research agenda for
next International Journal of Operations and Production Management 25(12)
1264-1277
Neely AD Mills JF Platts KW Gregory MJ and Richards AH (1994)
Realizing strategy through measurement International Journal of Operations and
Production Management 14(3) 140-152
Neely AD Wilson J (1992) Measuring product goal congruence an exploratory
study International Journal of Operations and Production Management 12(4)
45-52
Norton P E (1998) Parliaments and Governments in Western Europe Oxford
Routledge
Nunnally JC (1978) Psychometric theory 2nd ed New York McGraw-Hill
Nutt PC (2007) Intelligence gathering for decision making Omega 35(5) 604ndash622
Nutt PC (2008) Investigating the success of decision making processes Journal of
Management Studies 45 425ndash455
153
OECD (1987) Administration as Service the Public as Client Paris
OECD (1996) Responsive Government Service Quality Initiatives Paris
OECD (2005) OECD Factbook 2005 Economic Environmental and Social Statistics
OECD Publishing
OECD-PUMA (1997) In Search of Results Performance Management Practices Paris
OECD
OECD-PUMA (1999) Performance Contracting ndash lessons from performance
contracting case studies a framework for public sector performance contracting
Paris OECD
Oliver C (1991) Sustainable competitive advantage Combining institutional and
resource-based views Strategic Management Journal 18 697-713
Osborne D amp Gaebler T (1992) Reinventing Government How the entrepreneurial
spirit is transforming the public sector New York Penguin Books USA Inc 375
Hudson Street
Osborne D amp Plastrik P (1997) Banishing Democracy The Five Strategies for
Reinventing Government New York Penguin Books USA Inc 375 Hudson
Street
OShea D (1992) Customer Care in the Public Sector Administration 40(3) 234-247
Otley DT (1999) Performance management a framework for management control
systems research Management Accounting Research 10(4) 363-382
Pasteur L (1822 - 1895) French chemist
Peters G B (1999) Institutional theory in political science London and New York
Pinter
154
Peters G B (1999) Institutional Theory in Political Science London and New York
Pinter
Pfeffer J amp Salancik G R (2008) The effect of CEOs on firm performance Strategic
Management Journal 29(12) 1357ndash1367
Pochard M (1996) Current and future developments in service quality initiatives the
situation in France OECD 49-57
Poister T (2004) Performance Monitoring In JS Wholey H Hatryamp K Newcomer
(Eds) Handbook of practical program evaluation San Francisco John Wileyamp
Sons
Poister T H (2003) Measuring Performance in Public and Non-profit Organizations
San Francisco CA Jossey ndash Bass
Pollitt C amp Bouckaert G (eds) (1995) Quality improvement in European public
services concepts cases and commentary London Sage
Pollitt C (2006) Performance information for democracy - the missing link
Evaluation 12(1)
Porter M (1990) The Competitive Advantage of Nations Harvard Business Review
Pulakos E D amp OlsquoLeary R S (2011) Why is performance management broken
Industrial and Organizational Psychology 4 146ndash164
Radin B (2006) Challenging the performance movement Accountability complexity
and democratic values Washington DC Georgetown University Press
Reichheld Fredrick F amp Sasser Earl W (1990) Zero defections quality comes to
services Harvard Business Review 68(5) 105ndash111
Rummler GA (2004) Serious performance consulting According to Rummler Silver
Spring MD International Society for Performance Improvement
155
Rynes SL Giluk TL amp Brown KG (2007) The very separate worlds of academic
and practitioner periodicals in human resource management Implications for
evidence-based management Academy of Management Journal 50(5) 987ndash1008
Salamon L (2003) The resilient sector The state of nonprofit America Washington
DC Brookings Institution Press
Santori PR amp Anderson AD (1987) Manufacturing performance in the 1990s
measuring for excellence Journal of Accountancy 164(5) 41-147
Schmenner RW ampVollmann T E (1998) Performance measures gaps false alarms
and the usual suspectslsquo International Journal of Operations and Production
Management 14(2) 58ndash69
Schonberger R J (1982) Japanese Manufacturing Techniques New York Macmillan
(1986) World Class Manufacturing New York Macmillan
Schonberger R J (1990) Creating a Chain of Customers London Guild Publishing
Sekaran U (2000) Applied business research qualitative and quantitative methods
Australia John Wiley amp Sons Australia Ltd
Senge PM (1990) The fifth discipline the art and practice of learning organization
New York Doubleday
Sinclair D amp Mohamed Z (1995) Business process re-engineering and process
management A survey of current practice and future trends in integrated
management Business Process Re-engineering amp Management Journal 1(1) 8 ndash
30
Sinclair D amp Mohamed Z (1995) Effective process management through performance
measurement Part III-an integrated model of total quality-based performance
measurement Business Process Re-engineering amp Management Journal 1(3)
50-65
156
Skinner W (1969) Manufacturing missing link in corporate strategy Harvard Business
Review 47(3) 136-45
Skinner W (1974) The decline fall and renewal of manufacturing Harvard Business
Review47(3) 138-145
Slack N (1983) Flexibility as a manufacturing objective International Journal of
Operations and Production Management 3(3) 5ndash13
Slack N (1987) The flexibility of manufacturing systems International Journal of
Operations and Production Management 7(4) 35-45
Slack N (1991) The Manufacturing Advantage Achieving Competitive Manufacturing
Operations International Journal of Operations and Production Management
3(3) 4-13
Smith PC (1995) Assessing the performance off NHS hospital trusts the role of
―hardand ―soft information International Journal of Health Policy and
Management (IJHPM)
Smith P (1995) On the unintended consequences of publishing performance data in the
public sector International Journal of Public Administration 18(2) 277 - 310
Spitzer DR (2007) Transforming performance measurement rethinking the way we
measure and drive organizational success New York NY Amacom
Stalk G (1988) Time the next source of competitive advantage Harvard business
Review 66(4) 41-51
Steele J amp Seargeant J (1997) Does consultation work Swindon ESRC
Sullivan M (1993) The antecedents and consequences of customer satisfaction for
firms Marketing Science 12(2) 125-143
157
Swanson R A (1999) The foundations of performance improvement and implications
for practice Berrett Koehler San Francisco
Talbot C (2004) Executive Agencies have they improved management in government
Public Money and Management 24(2)
Talbot C (2005) Performance Oxford Oxford University Press
Talbot C (2006) Performance regimes and institutional contexts Comparing Japan
UK and USA Paper for the International Symposium on Policy Evaluation24-25th
June 2006 Tokyo Ministry of Internal Affairs and Communications
Taylor FW (1911) The Principles of Scientific Management New York Harper
Brothers
Thorpe R amp Beasley T (2004) The characteristics of performance management
research Implications and challenges International Journal of Productivity and
Performance Management 53(4) 334ndash344
Thurow L (993) Head to headThe coming economic battle between Japan Europe and
America New York Warner Books
Tomlinson CA Kaplan S N Renzulli J S Purcell J Leppien J amp Burns D
(2002) The parallel curriculum A design to develop high potential and challenge
high-ability learners Thousand Oaks CA Corwin Press
Treasury Board of Canada Secretariat (1995) Declaration of Quality Services Principles
Ottawa
Trivedi P (1994) Memorandum of understanding ndash an approach to improving Public
enterprise performance International Management Publishers
Trochim William MK (2006)Research Methods Knowledge Base Edition 3 New
York Cengage Learning
158
Trosa S (1995) Quality in the French Public Service in Pollitt and Bouckaert 58-68
Turney PBB amp Anderson B (1989) Accounting for continuous improvement Sloan
Management Review 30(2) 37-47
White SH (2005) Beyond numbers making data work for teachers and school leaders
Englewood CO Lead + Learn Press
Whittaker JB (2001)Balanced Scorecard in the federal government Management
ConceptsVirginia Vienna
Wholey J S Hatry HP amp Newcomer KE (2010) Handbook of practical program
evaluation (3rd
ed) San fransisco CA Jossey-Bass
Williams D (2002) Before performance measurement Administration Theory Praxis
24(3) 457-486
Wiske M S (Ed) (1998) Teaching for understanding Linking research with practice
San Francisco Jossey-Bass
Zikmund W G Babin B J Carr J C amp Griffin M (2010)Business research
methods 8th
Edition South-Western Cangage Learning
159
APPENDICES
Appendix ITypes of Performance Contracts
Types of Performance Contracts
French Approach Signaling System
Philippines Korea Pakistan France Senegal China
Cote
dlsquoIvoire India Bolivia Gambia United
Kingdom
Benin
160
Appendix II Model Performance Contract Framework
This Performance Contract (hereinafter referred to as ―Contract) is entered into between
the Government of the Republic Kenya (hereinafter referred to as ―GoK) represented by
the Permanent Secretary Secretary to the Cabinet and Head of Public Service of PO
BOX helliphellipNairobi( together with its assignees and successors) of the one part and the
Permanent SecretaryAccounting Officer MinistryDepartment of helliphelliphelliphelliphellip
(Hereinafter referred to as the ―the Permanent SecretaryAccount Officer) (together
with its assignees and successors) of PO BOX helliphellipof the other part
WHEREAS
The Government is committed to ensuring that public offices are well managed and cost
less in delivering efficient and quality service to the public
The Government recognizes that MinistriesDepartments hold vital key to improving
performance and restoring the faith of the Kenyan people in their government
The purpose of this performance contract is to establish clarity and consensus about
priorities for the MinistrylsquosDepartmentlsquos management
This contract represents a basis for continuous improvement as we reinvent our
government to meet the needs and expectations of the Kenyan people
From this contract should flow the program and management priorities of the
MinistryDepartment
NOW THEREFORE the parties hereto agree as follows
Part I
Vision Mission and Strategic Objectives
161
(a) Vision of the MinistryDepartment
Ideal picture of the future
(b) Mission of the MinistryDepartment
Focuses attention on the main purpose of the organization
Aligns the organizational goals priorities and practices
(c) Strategic Objectives of MinistryDepartment
Objectives should be linked to National policy documents such Vision 2030
MTPSector Performance Standards etc
Specific easily understood attainable measurable time bound
Quantitative qualitative commercial non-commercial static dynamic
Not many avoid repetitions contradictions and overlaps
Only outcome (not process) objectives to be included
Include all critical objectives
Part II
Commitments and Responsibilities of
Permanent SecretaryAccounting Officer
Developing and implementing strategic plans in the MinistryDepartment
Ensuring strategic plans are linked to National policy documents such as Vision
2030
MTP Sector Performance Standards etc
Ensuring appropriate work plans are developed on the basis of the strategic plans
Developing comprehensive performance targets
Assigning weights to performance indicators
Signing performance contract with the Permanent SecretarySecretary to the
Cabinet and Head of Public Service
Ensuring achievement of the agreed targets
Preparing employees in the organization for the desired changes in working
styles attitudes and work ethics
Part III
Commitments and Obligations of the Government
Assistance required from Government should reflect assistance which is not
within the Ministrylsquos mandate eg implementation of laws and increase in
funding are already within the mandate of the MinistryDepartment
162
Government to ensure that public officers suspected of corrupt practices step
down to allow room for investigations
Part IV
Frequency of Monitoring and Information Flow
Modalities of information flow
Frequency of monitoring
Part V
Duration of the Performance Contract
The Performance Contract will run for one financial year
Part VI
Signing of Performance Contract
Signed
Permanent Secretary helliphelliphelliphelliphelliphelliphelliphelliphelliphelliphelliphelliphelliphellipDatehelliphelliphelliphelliphelliphelliphelliphellip
MinistryDepartment
Permanent SecretarySecretary to the Cabinet and Head of Public Service
helliphelliphelliphelliphelliphelliphelliphelliphelliphelliphelliphelliphelliphelliphelliphelliphelliphelliphelliphelliphelliphelliphelliphellipDatehelliphelliphelliphelliphelliphelliphellip
Counter-signed
Honorable MinisterhelliphelliphelliphelliphelliphelliphelliphelliphelliphelliphelliphelliphelliphelliphelliphellipDatehelliphelliphelliphelliphelliphelliphellip
Ministry of helliphelliphelliphelliphelliphelliphelliphelliphelliphelliphelliphelliphelliphelliphelliphelliphelliphelliphelliphelliphelliphelliphelliphelliphelliphelliphelliphellip
Endorsed
Rt Hon Prime MinisterhelliphelliphelliphelliphelliphelliphelliphelliphelliphelliphelliphelliphelliphellipDatehelliphelliphelliphelliphelliphellip
163
Appendix III Performance Contract Matrix
Pre
vio
us
YR
YR
(-1
)
Cu
rren
t S
tatu
s
YR
(0
)
Tar
get
CRITERION VALUES
CRITERIA CATEGORY
UN
IT
WT
Ex
cell
ent
(10
0-2
40
)
Ver
y G
oo
d
(24
0-3
00
)
Go
od
(30
0-3
60
)
Fai
r
(36
0-4
00
)
Po
or
(40
0-5
00
)
Ach
iev
emen
t
Raw
Sco
re
Wei
gh
ted
Sco
re
A Finance amp Stewardship
Indicators
Weight Sub total 20
B Service Delivery
Indicators
Weight Sub total 25
C Non-Financial
Indicators
Weight Sub total 15
D Operations
Indicators
Weight Sub total 25
E DynamicQualitative
Indicators
Weight sub total 10
Corruption Eradication
Weight Sub Total 5
Total 100
164
Appendix IV Citizensrsquo Service Delivery Charter
NO SERVICESGOODS REQUIREMENTS
TO OBTAIN
SERVICESGOODS
COST TIMELINE
ldquoCommitment to Courtesy and Excellence in Service Deliveryrdquo
Any service that does not conform to the above standards or any officer who does
not live up to commitment to courtesy and excellence in Service Delivery should be
reported to
a The PSAccounting OfficerCEOMDPrincipal etc of thePublic
Institutionhelliphelliphelliphelliphelliphelliphelliphelliphelliphelliphelliphelliphelliphelliphelliphelliphelliphellip
b The Ombudsmanhelliphelliphelliphelliphelliphelliphelliphelliphelliphelliphelliphellip
( hot lines should be provided in both cases)
165
Appendix V Development Expenditure as percent of Total Expenditure
Year
Total
Expenditure
(KShs)
Development
Exp (Ksh)
of
Total
1985 23460315340 6465672280 2756
1960 1986 24251325220 6181978960 2549
1961 1987 32047230000 9243656600 2884
1962 1988 35085856880 8172045840 2329
1963 1989 25198432660 8137262760 3229
1964 1172514580 304853540 2600 1990 46597584460 15253518460 3273
1965 1293680940 293489420 2269 1991 52062813760 16554960120 3180
1966 1451390600 313083420 2157 1992 49192306140 12997333480 2642
1967 1520725720 354863860 2334 1993 60444018440 17028725780 2817
1968 1762987760 421116880 2389 1994 77100084320 20536529560 2664
1969 1982475480 517499200 2610 1995 101197860140 26128312520 2582
1970 2361298140 645595900 2734 1996 117168533300 27687733540 2363
1971 2925507060 951134580 3251 1997 127793434640 27318969900 2138
1972 3515487500 1076110060 3061 1998 143768064220 24143694540 1679
1973 3947293760 1261806400 3197 1999 158176703040 20293558020 1283
1974 4486642320 1353172740 3016 2000 144179487740 19581211360 1358
1975 5738597500 1853214120 3229 2001 198518350917 33366819993 1681
1976 7044472220 2492318720 3538 2002 204554850864 27821518058 1360
1977 7772655300 2455179240 3159 2003 219744483248 32529594082 1480
1978 12052295900 4917358520 4080 2004 250629375925 36188116860 1444
1979 13198473140 4401866620 3335 2005 280226382275 40181462390 1434
1980 14742599440 4640910260 3148 2006 336719420465 61812300804 1836
1981 17408358340 5657858600 3250 2007 407946769898 105839813298 2594
1982 19978315720 5842147120
2924
2008
32815607394
42
653430948415
1983 19607417640 4653162580 2373
1984 21533866490 5559417430 2582
Source Ministry of Finance
166
Appendix VI Development Expenditure vs GDP Growth at Market Prices
Source Ministry of Finance Auditor- General
-10
-5
0
5
10
15
20
-
20
40
60
80
100
120
GD
P a
t M
ark
et P
rice
s (P
erec
ent)
Dev
elop
men
t E
xp
end
itu
re (
Bil
lion
s K
Sh
s)
Calender Years
Development Expenditure
167
Appendix VII GDP Trend
GDP
growth
rate (at
factor
cost)
GDP
growth
rate (at
mkt
price)
1960 1985 51 18
1961 1986 55 96
1962 1987 49 75
1963 1988 51 64
1964 68 69 1989 51 66
1965 24 26 1990 42 36
1966 105 103 1991 21 17
1967 46 58 1992 05 -05
1968 77 90 1993 02 20
1969 64 82 1994 30 34
1970 69 113 1995 48 50
1971 57 91 1996 46 50
1972 65 146 1997 24 03
1973 65 20 1998 18 34
1974 41 93 1999 14 21
1975 12 -48 2000 -02 05
1976 56 04 2001 12 45
1977 86 98 2002 12 05
1978 77 100 2003 31 29
1979 50 12 2004 39 51
1980 40 45 2005 52 58
1981 60 15 2006 56 64
1982 39 25 2007 62 71
1983 25 -10 2008 09 17
1984 09 37
Source Ministries of Finance and Planning
168
Appendix VIII Economic Growth (percent 2001-2010)
Source Performance Evaluation results Office of the Prime Minister
0
1
2
3
4
5
6
7
8
2002 2003 2004 2005 2006 2007 2008 2009 2010
04
28
43
58
63
71
17
26
56
Appendix VII Economic Growth (percent 2002 ndash 2010)
Year
169
Appendix IX Public Service Aggregate Performance
Source Performance Evaluation results Office of the Prime Minister
Mea
n C
om
po
site
Sco
rin
g
0355
0360
0365
0370
0375
0380
0385
0390
0395
200506 200607 200708 200809 200910 201011
170
Appendix X Economic Performance for selected Countries
No Country Area
Sqkm
Popul
(mil)
GDP
(US$
TrilBil)
GDP
Per
Capita
(US$)
Life
Exp
(Yrs)
Unemployment
Below
poverty
line
1 Japan 377915 127 5981 Tri 46973 83 36 16
2 UK 242900 63 2450 Tri 39459 80 69 14
3 S Korea 99678 49 1164 Tri 31753 81 35 15
4 Singapore 697 54 277 bil 51709 82 18 NA
5 Malaysia 329750 25 304 Bil 10304 74 31 38
DRC 2345410 696 667 Bil 237 46 NA 71
Tanzania 945078 477 249 Bil 578 59 NA 36
Lesotho 30355 254 2448 Bil 1380 49 25 573
Kenya 582650 40 379 Bil 1008 60 42 50
Nigeria 923768 160 5099 Bil 1631 53 279 70
S Africa 1219090 549 408 Bil 8078 56 247 50
SourceCIA World Factbook 2013 Lesotho MDG Report 2013
171
Append XI Previous Related Studies
1 2 3 4
Researcher Kai Chieh HU Assistant
Professor Department of
Business Administration
Soochow University Taipei
Taiwan
William JEN Professor
Department of Transportation
Technology and Management
National Chiao Tung University
Hsinchu Taiwan
Eugene W Anderson Claes
Fornell amp Roland T Rust
School of Business
Administration The University
Michigan Ann Arbor
Michigan 48109-1234
Owen Graduate School of
Management Vanderbilt
University Nashville
Tennessee 37203
Hudson Moloto Maila Public
Management University of South
Africa
Adams B Steven Yan Dong
Martin Dresner Robert H
Smith School of Business
University of Maryland
College Park MD 20742
Study Exploring the Antecedents of
Satisfaction and Loyalty for
Freight Shipping Industry in
Taiwan From the Viewpoint of
Business Customers
To investigate whether there are
conditions under which there
are tradeoffs between customer
satisfaction and firm
productivity
Performance management and
service delivery in the Department
of water affairs and forestry
(DWAF)
Investigate the linkages
between customer service
customer satisfaction and firm
performance in the US airline
industry
Year 2010 1994 2006 2012
Objective Establish the effects of service
quality and relational
performance on customer
satisfaction and loyalty in a
business-to-business context
Establish the links between
customer satisfaction and
productivity
Establish the role of performance
management as a pre-condition for
organizational performance and
improved public service delivery
To investigate moderating
variables that may influence the
linkage between customer
satisfaction and performance
notably market power and
market concentration
Methodolo
gy
Adopted business customers
of freight shipping companies
in Taiwan as its sample
Collected data via a self-
administered questionnaire
Structural equation modeling
was used to verify the fitness of
Used measures of customer
satisfaction provided by the
Swedish Customer Satisfaction
Barometer from 1989 to
1992Tradeoffs hypothesis was
tested using a statistical model
Used a series of methodological
Researcher used empirical data such
as the departmental strategic plan
and the annual report official and
unofficial documents in the
department articles as well as
newspaper reports in order to do
content analysis The information
Used a model that first
estimates complaints and then
the estimated value for
complaints is used in the second
equation in a two stage least
square (2SLS) methodology
that corrects for the
172
the theoretical model and the
causal relationships and inputs
among variables
approaches to address potential
sources of bias for example to
control for unobserved fixed
effects the efficacy of
transforming the specifications
in the model was considered p-
differencing was considered to
investigate the possibility of
serial correlation and the
instrumental variables approach
was applied to control for
potential measurement error
and random effects
was spread on a BSC to measure
the organisationlsquos performance in
terms of service delivery to
eliminate biases the researcher
opted to ―complement this with a
strong theoretical base (also termed
the authority argument) and a
coherent convincing argument
based on both empirical evidence
and the researcherlsquos understanding
and logic It is in this articulated
interpretation that the understanding
and explanation of the phenomenon
lie ndash not in the presentation of
organized and rearranged data
(Henning 20047)
endogeneity between the
complaints and the other
customer service measures
Model allowed for
nonlinearities in the relationship
between customer service and
customer satisfaction to account
for diminishing marginal
returns to customer service
Findings Analytical results showed that
customer loyalty was
influenced by the level of
satisfaction
Additionally relational
performance and service quality
are significant predictors of
satisfaction relational
performance is an antecedent of
service quality and satisfaction
and its influence on satisfaction
is greater than that of service
quality
The association between
changes in customer
satisfaction and changes in
productivity is positive for
goods but negative for
services While both customer
satisfaction and productivity are
positively associated with
Return on Investment (ROI) for
goods and services the
interaction between the two is
positive for goods but
significantly less so for
services This means that
simultaneous attempts to
increase both customer
satisfaction and productivity are
likely to be more challenging in
The conclusion drawn by the
researcher is that the introduction of
performance management in
DWAF has not brought about the
desired impact on service delivery
Market concentration
moderates the relationship
between satisfaction and
profitability for US airlines
Airlines that operate in
concentrated markets have
fewer incentives to satisfy their
customers than airlines that
operate in more competitive
markets
173
service oriented operations
This implies further that
services exhibit ―tradeoffs
while goods do not given that
the increases (decreases) in
customer satisfaction are
associated with decreases
(increases) in productivity for
services
Gaps to be
filled
Establishing effect of
organizational performance on
customer satisfaction
Exploring other antecedents to
and predictors of customer
satisfaction
Establishing the effect of
selected intervening and
mediating variables on the
linkage between customer
satisfaction and productivity
Establishing that performance
measurement leads to performance
improvement which leads in turn
to higher customer satisfaction
Introducing different
intervening and moderating
variables on relationship
between customer satisfaction
and performance
Establishing that the converse
obtains that is performance
affects customer satisfaction

ii
DECLARATION
iii
DEDICATION
This study is wholly dedicated to my lovely wife Winnie and adorable daughters Lisa and
Tyna who bore the brunt of low and at times altogether lack of attention in the course of
carrying out and documenting the research
iv
ACKNOWLEDGEMENTS
My foremost acknowledgement is to the Almighty God who helped me to overcome
seemingly insurmountable obstacles to complete this study to the satisfaction of my
supervisors The timely completion of the study including any discernible quality
premium is wholly attributable to my supervisors Prof Isaac Meroka Mbeche and Prof
Ganesh P Pokhariyal These distinguished scholars were consistently resolute in
impelling completion of the study and nose ndash hard insistent on quality and relevance of
substance Professor Aosa along with staff faculty and colleagues in the School of
Business gave valuable encouragement at every stage in the preparation of the report I
owe them considerable gratitude for their individual and collective assistance
v
TABLE OF CONTENTS
DECLARATION ii
DEDICATION iii
ACKNOWLEDGEMENTS iv
LIST OF TABLES ix
LIST OF FIGURES x
ABSTRACT xi
ABBREVIATIONS AND ACRONYMS xii
CHAPTER ONE INTRODUCTION 1
11 Background of the Study 1
111 Performance Contracting 4
112 Background to Public Sector Reforms in Kenya 8
113 Performance Measurement 11
114 Public Service Delivery 15
115 Determinants of Performance 18
116 The Public Sector in Kenya 20
12 The Research Problem 22
13 Research Objectives 27
14 Value of the Study 28
15 Chapter Summary 29
CHAPTER TWO LITERATURE REVIEW 30
21 Introduction 30
22 Theoretical Perspective 30
221 Theory of Performance 31
222 Theory of Organizational Performance Management (OPM) 32
223 Theory of Change 34
224 Resource-Based Theory of Competitive Advantage38
225 Theoretical Foundations of Performance Improvement 39
23 Performance Contracting and Measurement 43
vi
231 Reasons for Measuring Public Sector Performance55
24 Performance Contracting and Other Public Sector Performance Measurement and
Improvement Systems 64
241 Public Service Delivery 65
242 The Public Service in Kenya74
243 Customer Satisfaction 75
25 Examples of Countries Implementing PMMIS77
251 Indian Experience 78
252 South Korean Experience 79
253 Public Service Agreements in the United Kingdom 80
254 Government Performance Results Act (GPRA) in the United States of
America 81
255 Performance Contracting in Kenya 82
26 Previous Related Studies85
27 Conceptual Framework 87
28 Hypotheses 92
29 Chapter Summary 92
CHAPTER THREE RESEARCH METHODOLOGY 93
31 Introduction 93
32 Research Philosophy 93
33 Research Design95
34 Population and Data Collection 96
35 Data Analysis 98
36 Chapter Summary 101
CHAPTER FOUR DATA ANALYSIS AND DISCUSSION OF FINDINGS 102
41 Introduction 102
42 Pretesting for Multiple Regression Assumptions 102
421 Tests of Normality 103
422 Tests of Linearity 104
vii
423 Test of Homogeneity of Variances 106
424 Multicolinearity Test 107
43 Descriptive Analysis of the Study Variables 107
44 Performance Measurement and Customer Satisfaction 110
45 Intervening Effect of Political Stability on the Relationship between Performance
Measurement (Improvement) and Customer Satisfaction 114
46 Moderating Effect of Global Competitiveness on the Relationship between
Performance Measurement and Customer Satisfaction 116
47 Joint Effect of Performance Measurement Political Stability and Global
Competitiveness on Customer Satisfaction 118
48 Summary of Tests of Hypotheses 120
49 Discussion of the Findings 121
410 Chapter Summary 123
CHAPTER FIVE SUMMARY CONCLUSIONS AND
RECOMMENDATIONS 124
51 Introduction 124
52 Summary of the Findings 125
53 Conclusion 127
54 Implications of the Study Findings 127
541 Implications for Public Policy Formulation and Implementation 128
542 Implications for the Customer 128
543 Implications for the Academic Community 131
55 Limitations of the Study134
56 Suggestions for Further Research 135
REFERENCES 137
APPENDICES 159
Appendix I Types of Performance Contracts 159
Appendix II Model Performance Contract Framework 160
viii
Appendix III Performance Contract Matrix 163
Appendix IV Citizenslsquo Service Delivery Charter 164
Appendix V Development Expenditure as Percent of Total Expenditure 165
Appendix VI Development Expenditure vs GDP Growth at Market Prices 166
Appendix VII GDP Trend 167
Appendix VIII Economic Growth (percent 2001-2010) 168
Appendix IX Public Service Aggregate Performance 169
Appendix X Economic Performance for selected Countries 170
Append XI Previous Related Studies 171
ix
LIST OF TABLES
Table 21 Steps in Developing a Performance Measurement System 46
Table 22 Assignment of Weights Over Study Period 54
Table 23 Assignment of Weights after Study Period54
Table 24 Performance Grading Scores 83
Table 25 Political Stability Country Comparisons 90
Table 31 Distribution of MDAs in 2011 97
Table 32 Summary of Analytical Model 100
Table 41 Test of Homogeneity of Variances 106
Table 42 Multicolinearity Coefficientsa 107
Table 43 Shows the Descriptive Statistics of the Study Variables 108
Table 44 Correlation Analysis of the Study Variables 109
Table 45 Relationship between Performance Measurement and Customer
Satisfaction 111
Table 46 Relationship between Political Stability and Customer Satisfaction 112
Table 47 Relationship between Global Competitiveness and Customer Satisfaction 113
Table 48 Intervening Effect of Political Stability 115
Table 49 Moderating Effects of Global Competitiveness117
Table 410 Joint Effect of Performance Measurement Political Stability Global
Competitiveness on Customer Satisfaction 119
Table 411 Summary of Tests of Hypotheses 120
Table 412 Hence the conclusions from the findings along with R2 and F values are
summarized as indicated in the table below 121
x
LIST OF FIGURES
Figure 21 Performance Management Measurement and Improvement System 50
Figure 22 Performance Contracting Cycle 51
Figure 23 Conceptual Framework 91
Figure 41 Normal Q-Q Plot 104
Figure 42 Performance Measurement and Customer Satisfaction 105
Figure 43 Political Stability and Customer Satisfaction 105
Figure 44 Political Stability and Customer Satisfaction 106
xi
ABSTRACT
Improvement in public service delivery and the consequent increase in customer (public) satisfaction with public services have been at the core of reform programs in many developed and developing countries The issues of performance contracting measurement and evaluation are not new phenomena governments have persistently sought to justify their existence based on their achievements in service delivery to their citizens The general objective of this study was to establish the relationship between performance contracting and measurement and public service delivery in Kenya as intervened and moderated by respectively political stability and global competitiveness The concepts of performance contracting measurement and service delivery are grounded in and indeed straddle a number of theories that embrace and give credence to these precepts These theories include theory of Performance theory of organizational performance management (OPM) theory of Change and Resource-Based Theory of Competitive Advantage This study was guided by positivist philosophy The positivist school of thought is based on the assumption that only one reality exists though it can only be known imperfectly due to human limitations and researchers can only discover this reality within the realm of probability This study employed a cross-sectional design focusing on the entire population of 470 MDAs The study relied on secondary data that was already available The political stability indices were extracted from the World Bank Report on Worldwide Governance Indicators on Political Stability and Absence of ViolenceTerrorism while the data on global competitiveness was obtained from the 2013 World Economic Forum (WEF) report of the World Bank Further the various categories of MDAs had by 201011 been on performance contract for differing periods these are 6 years for both ministries and state corporations 5 years for local authorities and 4 years for tertiary institutions The data used for the study was in respect to the five years of 200607 200708 200809 200910 and 201011 during which period customer satisfaction in the majority of the above categories of public agencies was measured Descriptive analysis was conducted to bring out the main characteristics of the sample To test the hypotheses correlation and regression analyses were carried out to establish the expected relationships between performance contracting and measurement and public service delivery in Kenya and the intervening and moderating effects of respectively political stability and global competitiveness on this relationship In addition t-test and p-values were used to determine individual significance of the results of the analysis Assessment of the overall robustness and significance of the regression models was done using the F-test and p-values Based on the research findings it can be concluded that performance measurement has a significant effect on customer satisfaction Secondly it can be concluded that political stability has an intervening effect on the relationship between performance measurement and customer satisfaction Further global competitiveness has a moderating effect on the relationship between performance measurement and customer satisfaction The outcome of this study is expected impact on a broad spectrum of constituents among them governments desirous to improve public service delivery practitioners and academicians in the field of performance measurement and public service delivery managers of public sector institutions individual public sector employees and the public who are the beneficiaries of government services The study findings reveal a number of questions that still need to be addressed It will be recalled for example that the study established that performance measurement explains 736 percent of customer satisfaction levels Political stability explains 18 percent while global competitiveness explains 25 percent The three variables explain 785 percent of customer satisfaction levels Further research is required to establish what other factors could explain the remainder of the customer satisfaction level that was not explained by the above variables
xii
ABBREVIATIONS AND ACRONYMS
BATHO PELE Putting People First
GAO Government Auditing Office
GASB Government Accounting Standards Board
GCI Global Competitiveness Index
GIE Government Invested Enterprise
GIEMA Government Invested Enterprises Management Act
GPRA Government Performance and Results Act
G8 Group of Eight
ISO International Organization for Standardization
KShs Kenya Shillings
LTDC Lesotho Tourist Development Corporation
MDA Ministry Department and Agencies
OECD Organization for Economic Cooperation and
Development
OMB Office of Management and Budget
PART Program Assessment Rating Tool
PC Performance ContractPerformance Contracting
PI Performance Indicator
PMDS Performance Management and Development System
PMMIS Performance Management Measurement and Improvement
System
PMS Performance Management System
PUMA Public Management Committee of the OECD
SADC Southern African Development Community
SCSB Swedish Customer Satisfaction Barometer
SEA Service Efforts and Accomplishments
TQM Total Quality Management
WGI World Governance Indicators
WEF World Economic Forum
1
CHAPTER ONE
INTRODUCTION
11 Background of the Study
Until about four decades ago the administration and management of the public sector in
many countries seemed to have taken on a life of their own Citizens of most of these
countries were regarded as almost after thoughts to the complex network of structures
policies and systems internal to government However the recent wave of reforms
compelling reversion to customer focus in many governments changed substantially the
operating environment for both elected officials and public service employees The
struggle has now boiled down to finding the best and most cost effective ways to
continuously engage the public and improve service quality That means as Eggleton
(1996) states as elected officials and as public service employees it can be expected
that the words service and quality will become virtually interchangeable in our lives
and the public will certainly look upon that as good news
Improvement in public service delivery and the consequent increase in customer
(public) satisfaction with public services have been at the core of reform programs in
many developed and developing countries Public sector reforms in the past half century
have accordingly been directed at ensuring that public services have the right people
structures and organization capable of developing and delivering the right policies and
services while at the same time ensuring the public service operates efficiently and
effectively (Strategic Management in the Irish Civil Service 1995) This is in addition
to the imperative need to expose the management of the public sector and the country to
global market forces and competition
2
The ultimate objective is to replace unresponsive public service bureaucracies with
modern flexible systems geared to the needs of public service customers which are
more responsive to the competing pressures of the outside world and which equip the
public service to more effectively meet changing national socioeconomic needs
(Humphreys 1983) Moreover to accomplish this objective a country needs a
government that is smaller and more responsive that has lower cost but a higher quality
of service that moves more authority to states and localities and to entrepreneurs in the
private sector that produces fewer regulations and more incentives and that has more
common sense and seeks more common ground (Clinton 1995) Higher quality of
service is about deliberate and continuous engagement and empowerment of the citizen
Braverman amp Kuntz (2012) observed that innovative governments are making it easier
for citizens to access public services In addition the most forward-thinking
governments are starting to master the shift from simply administering services to
regularly engaging and empowering citizens involving them in the design and in some
cases the delivery of the services This shift is not just about increasing choice and well-
being it is also about boosting government productivity with the help of technology
and the use of open data
Further the private sectorlsquos responsiveness to customer demands has led to heightened
public expectations of government Since people can do their banking shopping
payment of utility bills and money transactions online for example they would expect to
for example be able to apply for passports identity cards and driving licenses and
submit tax returns online as well and governments are investing and struggling to meet
these expectations
3
Since recorded history began governments have sought to justify their existence not
merely by appeals to the divine right of the king or emperor but also by their mighty
achievements In the modern era democratic governments and political parties regularly
praise their own achievements on behalf of the citizens or include promises of results in
their manifestos (Talbot 2005) Citing the Organization for Economic Cooperation and
Development and Public Management Committee (OECD ndashPUMA) 1997 report and
OECD 2005 Talbot (2006) observes that there has been a massive rise in attempts by
governments across the globe to better measure and report upon the results of public
activities over the past two decades and that the current wave of reform in this area is
larger broader deeper and longer than all previously recorded attempts
A report prepared by Farrell and Goodman (McKinsey amp Company December 2013)
headed ―Government by design four principles for a better public sector explored the
daunting challenges governments are facing today It observed that in a world
characterized by macroeconomic uncertainty rapid social change and technological
innovation citizenslsquo expectations of what government ought to deliver are rising On the
other hand governments are hampered by unsustainable debt burdens and shrinking
budgets For example by 2013 the ratio of general government debt to Gross Domestic
Product (GDP) for member states of the OECD exceeded 100 percent (OECD Economic
Outlook No 93 June 2013) Meanwhile public trust in government is eroding and
against this backdrop not only must governments do more with less they must do so in
highly visible ways if they are to regain the faith of their constituents
4
On the basis of research findings by the McKinsey Center for Government into hundreds
of cases of government innovation around the world their ground experience working
with governments and numerous conversations with public-sector leaders and thinkers
the report concludes that what works today is a more disciplined systematic approach to
solving public sector management problemsmdashin short ―government by design
This model requires public officers who are willing to abandon tools and techniques that
no longer work and who embrace the rational and the analytical over the purely
ideological The four principles for a better public sector include the use of better
evidence for decision making and greater engagement and empowerment of citizens The
use of better evidence for decision making and engagement and empowerment of
citizens is insured through implementation of an appropriate and strong performance
management measurement and improvement system
111 Performance Contracting
The key challenge practitioners and authors in the field of performance management have
been grappling with in the pursuit of performance improvement has been the question of
developing a flexible yet powerful model of performance measurement management and
improvement one that is grounded in theory supported by research and able to
communicate complex relationships while maintaining simplicity (Lopez amp Hutchinson
2013) A systemic model for performance measurement and management that is sensitive
to transactional relationships across performance levels (that is individual group
organizational and external impact) and contexts Yet as Cho amp Yoon (2010) observe
despite shared interests in human performance management as well as complementary
agendas for research and practice dialogue between academics in Human Performance
Technology (HPT) and Human Resource Managers (HRM) appears to be lacking
5
Many government dispensations in attempts to transform their public services have
developed systems that involve employees in improving organizational effectiveness by
focusing them on achieving the organizationlsquos mission and strategic goals These are
essentially performance management systems (PMSs) designed for implementing
strategy by communicating organizational goals and objectives reinforcing individual
accountability for meeting those goals and tracking individual and organizational
performance results They are therefore largely tools to address the immediate
performance shortfalls without necessarily meeting the criteria of models that are both
theoretically sound and attendant to the needs of practitioners
There are many and different types of performance management and measurement
frameworks with variants of the core PMS tools particularly measurement and
evaluation Among these are the Performance Contract (PC) (Trivedi 1994) the
Balanced Scorecard (BSC) (Kaplan amp Norton 1992) the Performance Prism (PP)
(Neely et al 2002) the Results and Determinants Framework (RDF) (Fitzgerald et al
1991) the Strategic Management and Reporting Technique (SMART) (Lynch amp Cross
1991) the Performance Measurement Matrix (PMM) (Keegan et al 1989) the
Performance Management Questionnaire (PMQ) (Dixon et al 1990) the Du Pont
Pyramid of Financial Ratios Brownlsquos Performance Framework (BPF) the Performance
Pyramid and the European foundation for quality managementlsquos business excellence
model
6
The bulk of these are however designed to drive performance in respect to revenue and
profit generating organizations Others place greater emphasis on the strategic
management processes with scanty regard for measurement and evaluation Moreover
except perhaps for the BSC the PC and BPF the bulk of the rest have not embraced
measurement frameworks with balanced measures that is indicators that measure both
financial and non-financial aspects including processes The BSC and the PC are the
most commonly known and used the former largely in the corporate sector and the latter
mainly in the public sector
The BSC emerged in the private sector in the early 1990lsquos as a framework for measuring
performance The finished product shows a list of goals for a specific time frame next to
the activities and measures used to achieve them The goals traditionally focus on four
areas financial performance the customer internal business processes and innovation
and learning (Poister 2004) The BSC links strategy to a set of indicators both financial
and non-financial (Chan 2004) The tool was introduced by Kaplan amp Norton in 1990
and is basically also a performance contracting tool The intention was to measure both
the short and long term objectives of organizations and provide a holistic view of how
organizations are performing (Kaplan amp Norton 1996) According to Whittaker (2001) a
balanced approach allows consideration of all the important operational measures at the
same time allowing a view on whether improvement in one area is achieved at the
expense of another area
7
A PC on the other hand is a management control system tool for selected public
enterprises (Trivedi 1994) The system began as a reaction to the perception of the
general public that public enterprises had not performed as was expected of them This
perception resulted in outpourings of public enterprise literature focused on two
categories of solutions to the perceived poor performance of public enterprises One
branch of the literature focused on privatization of public enterprises while the other
focused on performance improvement or as it has been variously termed privatization of
the public sector style of management through performance contracting (Trivedi 1994)
In essence the objective was to improve enterprise performance towards its goals such
as international competitiveness in cost design quality control delivery and marketing
or developing a backward region
The system addresses three of the key problems facing public enterprises which are ill-
defined and unreconciled goals political and bureaucratic interventions in operational
decision-making and management rewards which are fixed irrespective of effort or
results (Bennet 1990) Thus PCs aim to bring private enterprise conditions into public
enterprises and to encourage initiative innovation and the spirit of entrepreneurship for
the purpose of achieving targeted results effectively and efficiently The objective of the
performance contracting policy was to simultaneously increase managerial and
operational autonomy as well as accountability (Trivedi 1994)
Unlike privatization where public assets are privatized the policy seeks to privatize the
public sector style of management It is in essence an attempt to move the public sector
style of management away from control by procedureslsquo to control by resultslsquo (Trivedi
1994) According to Trivedi (1994) there is a general consensus that there are only two
8
main types of PCs and all other arrangements fall under one or the other These are the
French-based system and the signaling system (which originated in Pakistan and South
Korea) The difference between the two is that the French contract plans do not allocate
weights (and point calibrations) to targets Thus there is no distinction between targets in
terms of emphasis (by weighting them differently) and as such measurement and
evaluation of performance is affected by a high degree of subjectivity
This system is practiced in France United Kingdom China Senegal Benin
CotedlsquoVoire Morocco The signaling system which assigns weights to indicators was
practiced in India Pakistan South Korea Bangladesh and Philippines Nigeria Ghana
the Gambia and Bolivia (Trivedi 1994) The two systems including the countries that
subscribed to each of them are shown in Appendix I A number of countries under each
of the systems abandoned the system along the way owing to waning political support
resource deficits general apathy or a combination of them The public sector in Kenya
implements the signaling system In nearly all the countries where performance
contracting has been implemented or attempts have been made to introduce the system
his has been carried out as part of broader public sector reforms This has equally been
the case in Kenya
112 Background to Public Sector Reforms in Kenya
A Cabinet Memorandum of 2004 traces the genesis of public sector reforms in Kenya to
the period following independence in 1963 a period that saw excessive recruitment in the
public service resulting in serious imbalances between allocations for operations and
management and personnel emoluments without commensurate improvement in service
delivery Personnel emoluments grew from 47 of the recurrent budget in 198485 to an
average of 70 in the 1990lsquos and up to 95 in some ministries
9
The situation was exacerbated by low pay and shortagelack of working tools The
government responded by introducing the Civil Service Reform Program and Action Plan
in March 1992 and the Civil Service Reform Program (CSRP) in August 1993 The
program was implemented in phases The first phase focused on rationalization of
staffing comprising the voluntary early retirement imposition of employment embargo
issuance of personal numbers to control the specter of irregular recruitment and ghostlsquo
workers payroll cleansing retrenchment and withdrawal of guaranteed employment for
university graduates
Despite these reforms performance continued to plummet as resource wastage continued
to rise This prompted government to introduce CSRP II as a Medium Term Strategy
guided by the strategy for performance improvement in the public servicelsquo in March
2002 This was essentially the foundation of performance contracting as it provided for
inter alia setting performance standards and benchmarks for public servants
institutionalizing strategic planning in the public service improving staff appraisal and
undertaking public service delivery surveys in ministries to determine service delivery
levels constraints and bottlenecks as a basis for developing performance improvement
programs for all major service areas The overriding objective of the reforms was to
create a leaner efficient motivated and more productive public service equipped to
focus finance and human resources on the delivery of core public services
The reforms were quickly followed by immediate direction to the public service to
among others Develop strategic plans and annual work plans to allow for proper
utilization of resources on clearly identified core functions objective staff appraisal
better and improved method of supervising staff based on achievement of set targets
10
development introduction and institutionalization of performance based management
practices undertaking service delivery surveys in all ministriesdepartments and
developing and installing service charters with clear service benchmarks and standards in
order to enhance efficiency transparency and accountability in service delivery carrying
out immediate and comprehensive benchmarking exercise to identify the minimum costs
of delivering government services and thus enable cost reductions in government
activities and placement of all Permanent Secretaries and Chief Executives of state
corporations on performance contracts
Kobia amp Mohammed (2006) have traced the background to performance contracting in
Kenya to the period before the 1990lsquos According to them the concept of performance
contracting was first introduced in the management of state corporations in 1989 with the
issue of a Parastatal Reform Strategy Paper by the cabinet in 1991 The objective of this
initiative was to streamline and improve the performance of State Corporations by among
others rationalizing the enabling environment of all strategic parastatals including
removal of potentially conflicting objectives and making transparent the cost of social
services and compensating the parastatals for social obligations
The first two parastatals to be on Performance Contracting were the Kenya Railways
Corporation and the National Cereals and Produce Board Kenya Railways signed PClsquos
in April 1989 and National Cereals and produce Board signed in November 1990
According to the authors the two PCs did not produce the expected results because of
lack of political goodwill to drive the process as it was perceived to be donor-driven
failure to incorporate performance incentive systems and overlooking the impact of
external factors The PC initiative was accordingly re-introduced in 2003 under the
Economic Recovery Strategy for Wealth and Employment Creation
11
113 Performance Measurement
Measurement is not an entirely new phenomenon and can be traced back to the beginning
of time Early measurement was based on human body parts The ancient cubit was for
example the length of the ancient Egyptian pharaohlsquos arm plus the width of his hand
Over the centuries as more sophisticated needs emerged more sophisticated measures
were developed In primitive settlements there was scanty need for measurement
Advances in measurement were driven by powerful needs such as the need for social
interaction and to move beyond subsistence living which led to trade and commerce
and the need for understanding and mastery of the physical environment which led to
science It is trade and commerce that gave rise to most of early practical measurement
including weight length width size quantity time and monetary measures
Measurement is at its root a social phenomenon not a detached calculation of numbers
In fact measurement was created to facilitate socialization and its further development
and effectiveness depend on a socialization process
The social nature of measurement is well exemplified by how the measurement of time
evolved from social need In early cultures time was not very important and the position
of the sun in the sky was sufficient for the level of time-consciousness needed at that
period As people became more conscious of time they started valuing it more requiring
more time discipline This led to more precise measurement of time including
development of appropriate measurement tools such as clocks and watches David
Landes (2000) observes that improvements in the measurement of time were the most
important physical advances in the history of western civilization without which few
12
other advances would have been likely Further that all scientific and industrial progress
has depended on measurement continuing development and refinement of increasingly
more sophisticated measurement devices such as telescopes microscopes x-rays and
atomic clocks
Geniat and Libert (2002) opined fairly correctly that ―without the capacity to measure
we would be uncertain literally as to where we stood and where we are going We
would not know whether we are rich or poor hot or cold old or young The very word
measurelsquo pervades all fieldshellipyou canlsquot make decisions connections money or music
without true measurements To a fairly significant extent the way we measure success
in turn determines the success we attain Activities events and programs which cannot
be measured cannot also be easily replicated managed or even appreciated Spitzer
(2007) states that the need to measure things is a result of the need to understand them
Further that one of the most important keys to the success of an organization is found in
the most unlikely of places a place that would ordinarily be considered complicated
inaccessible and perhaps even downright boring This key to success is already one of
the most ubiquitous forces in the organization It is there waiting to be tapped into this
key to success is ―measurement
Performance measurement is a key component of performance management systems and
is employed primarily in attempts to improve organizational performance and service
delivery Brown et al (2001) states that ―Measurement is not only a way of determining
what has already happened which is like driving by looking in the rear-view mirrorlsquo but
is also a way of getting people to act in ways that will bring about desired future
13
outcomes A performance measurement system should support both operations and the
overall corporate strategy At the operations level performance measures should link
processes to strategic objectives and motivate both workers and managers They should
balance financial measures with non-financial measures such as measurements of waste
and of customer satisfaction Over the long run good performance measures will help
support organizational transformation and organizational learning and sustain
competitiveness In complex organizations the need to measure performance at both the
individual and organizational levels may stem from the need to understand the nature of
the actions or behaviors that contribute to high or low levels of performance
There are as many perspectives on performance measurement as there are different
practitioners and writers although the perspectives ultimately converge These myriad
perspectives prompted Franco-Santos et al (2007) to state that ―There is a lack of
agreement on a single definition of performance measurement Clearly though
performance measurement refers to the process of obtaining the numerical information
that quantifies inputs outputs and performance dimensions of processes products
services and the overall outcomes Measurement has been recognized as a crucial
element to improve business performance (Sharma et al 2005) A performance
measurement and management system is therefore a balanced and dynamic system that
enables support of decision-making processes by gathering elaborating and analyzing
information (Neely et al 2002) The concept of ―balance refers to the need to use
different measures and perspectives that tied together give a holistic view of the
organization (Kaplan amp Norton 1996)
14
All measures are relative A measure that is not referenced to something else has no
meaning According to Thomas Fuller (1608 ndash 1661) ―Nothing is good or bad but by
comparison Amaratunga et al (2001) state that performance measurement is logically
governed by a number of principles A measurement system promotes productivity by
focusing attention on issues important to the organization managers can for example be
measured by the efficiency and effectiveness of the units they manage Productivity and
effectiveness of any function can be measured by some combination of cost time
quality quantity or other human relation indices Effectiveness and efficiency measures
help motivate people and make them feel better about what they are doing and about
themselves The value of performance measurement is summarized as follows if it canlsquot
be measured it canlsquot be managed what gets measured gets watched and what gets
watched gets done (Drucker 1999)
Meaningful performance measurement goes way beyond application of formulae or the
mere computation of numbers In this regard it should be possible to measure
expectations and undertakings and produce results that will help managers to make the
right decisions regarding continuous improvement of performance To be meaningful a
performance measurement methodology should not only dovetail into the overall PMS as
a key complement to performance improvement but should be the central part of the
system Performance measurement under the American Government Performance and
Results Act (GPRA) for example envisages among other benefits that it would be a
good way to convert evaluations that derive lessons from past experience into wisdom
and insight that influence planned activities and to link activities to program goals and
program goals to the mission
15
114 Public Service Delivery
A public service is a service provided by the government to the public The need for
services that no individual can or will pay for but that benefit all by their presence is the
key justification for taxation Examples of such services are sewage and garbage
collection and disposal street lighting and cleaning On a larger scale security
infrastructure education and public health are also public services Public service
delivery is the implementation of those services and making sure they reach the people
and places they are intended for A public service is a public trust because it is a non-
profitable association with government that gives its loyalty to its people by doing good
things to empower society In the broader sense service refers to the quality of customer
service service accessibility speed of delivery affordability reliability courtesy and
completeness and the measured appropriateness of assistance and support provided to a
customer As former US president Clinton (1995) put it in the forward to ―Commonsense
Government ndash Works Better and Costs Less ―hellipgovernment needs to change along with
the people it serves Further that ―hellipwe need to cure the anxiety and alienation many
people feel toward their government People will regain confidence in government if we
make it work better We need to make quality management the culture of government so
that no future administration can fail to embrace it (Clinton 1995)
This shift is not just about increasing choice and well-being it is also about boosting
government productivity with the help of technology and the use of open data The
Estonian governmentlsquos e-services portal for example visited by more than 10000 users
every day allows residents to perform an ever-expanding array of tasks including
applying for unemployment benefits paying taxes registering new companies and even
16
voting But being citizen-centric is not just about the Internet Australia for instance has
pioneered mobile government offices satellite-equipped trucks that serve as one-stop-
shops for government services for people living in remote areas Innovative governments
are creating new ways for citizens to make their voices heard giving them the ability to
provide input into regulations budgets and the provision of services
Regulationsgov one of the US governmentlsquos earliest e-government programs allows
citizens to search view and comment on federal regulations Users post more close to
30000 comments on the site every month Other governments are going even further to
solicit citizen feedback in 2010 Iceland picked 950 citizens at random to participate in
the drafting of a new constitution a significant example of ―deliberative democracy at
work The city of Cologne Germany has used participatory budgeting in which residents
helped decide how to allocate a portion of the municipal budget Citizens can play an
important role not just in the design but also in the delivery of public services New York
Citylsquos 311 system allows residents to report non-emergency complaints about things like
potholes or garbage collection via a website a mobile application text messaging Skype
or phone Thanks to the Open311 platform a free web-based application programming
interface the city now processes 60 percent of service requests online lowering
transaction and issue resolution costs Open311 platforms have been rolled out to other
cities as well including San Francisco and Chicago These platforms along with third-
party apps such as SeeClickFix empower citizens to do some of the work that has
traditionally fallen to municipal employees enabling citizens to in effect act as city
inspectors
17
In similar vein the mayors of Boston and Philadelphia have each created an office of new
urban mechanics which works with residents to fund and launch promising projects that
address civic needs Citizens not government employees come up with the ideas and do
much of the work but also reap the benefits The trend toward participatory government
will only gain in strength By engaging and empowering citizens to co-design and co-
deliver public services governments cannot only better meet citizenslsquo needs they can
also shift some of the burden of accountability from the state to the people allowing
high-quality delivery of services in an environment of constrained resources
In Kenya the service delivery aspects of public sector performance including service
standards cost expectations time lines and avenues for redress are set out in citizenslsquo
service delivery charters The charter was introduced in the public service in 2006 as the
key performance sub-indicator under the ―service delivery perspective in PCs The
charter is an instrument that documents and broadcasts the services rendered by a public
institution the expected service standard service quality requirements to qualify for the
service cost timelines and avenues for redress Measurement of achievements on the
various aspects of the charter is highly qualitative determined as it is by customer and
stakeholder feedback and surveys Recently technology has been employed to not only
speed up service delivery but to also facilitate measurement
In 2008 the then Ministry of Immigration and Registration of Persons under its
performance contracting adopted automation in the issuance of passports and identity
cards under a project dubbed lsquoe-service deliveryrsquo in the process heralding a revolution in
delivery of public service in terms of service quality accessibility timeliness
18
affordability and speed to unprecedented customer satisfaction levels This has now been
advanced further to include ―huduma (service delivery) centers which offer in
aggregate over 40 diverse and most commonly demanded services under one roof in
over 30 counties
Malaysia has leveraged technology and e-services to improve public service delivery
through the creation of multichannel delivery portals such as internet and village kiosk
machines with the objective of enhancing service access through multiple electronic
delivery channels providing internet services where multiple services can be obtained at
each delivery channel and improving service quality in terms of speed reliability
transparency and security (Multimedia Development Corporation 2007) The challenge
then is in devising a PMS that supports calibration a wider rating scale and comparative
performance rating and thereby inspiring improvement in service delivery
115 Determinants of Performance
According to Hansen (1989) there are two streams of research regarding the determinants
of firm performance One is based on the economic tradition and emphasizes external
market factors while the other builds on the behavioral and sociological paradigms
focusing on organizational factors as they fit into the environment the latter therefore
focuses on factors internal to the firm Organizational researchers have developed a wide
variety of performance models Research by Cameron (1986) Goodman and Pennings
(1977) Steers (1975) suggests that managers can influence organizational performance
by influencing the behavior of employees This entails taking consideration of multiple
factors among them the formal and informal structures planning reward control and
information systems their skills and personalities and relating these to the environment
19
One research stream that has managed to capture these multidimensional aspects is that
of organizational climate The latter encompasses the perceived properties and
characteristics found in the work environment that result from actions taken consciously
or unconsciously by an organization and which affect behavior (Steers and Lee
198382) It refers to a broad class of organizational and perceptual variables that reflect
individual - organizational interactions which affect the behavior of the individual and
provides the conceptual link between analysis at the organizational level and at the
employee level This means that changes in organizational structures systems and
practices can alter climate measures and hence individual performance Other studies
have suggested that organizational climate was directly linked to performance (Lawler et
al (1974) and that there are strong linkages between managerial practices and dimensions
of organizational climate and firm performance (Simmons amp Mares 1983 Likert 1961)
These studies brought out three key classes of factors that influence performance These
are the following Organizational factors ndash structure systems size history
Environmental factors ndash political sociological economic technological and People
factors ndash skills personalities age
The study selected key constructs from each of the three categories That is
organizational factors ndash performance contracting and measurement system
environmental factors ndash political stability and global competitiveness and people factors -
effective and efficient public service As discussed later in this study the issue of political
stability is critical to the performance of the public service and the country at large The
study captures the aftermath of the 200708 post ndash election skirmishes and the consequent
effect on the performance of both the economy and the public service as indicated in
20
Annexes VIII and IX The annexes indicate that the aggregate performance of the public
service plummeted to its lowest in 2008 in terms of average composite scoring and in its
wake fell along with the economy from a real GDP growth rate of 71 in 2007 to 17
in 2008 The exposition on political stability in subsequent sections in this study makes
reference also to the case of the Kingdom of Lesotho where political instability had
driven the performance of the economy to the lowest levels in years Political stability
and global competitiveness were hence used in the study as respectively intervening and
moderating factors
116 The Public Sector in Kenya
The Republic of Kenya has experienced mixed fortunes in its economic development
since independence in 1963 This period witnessed undefined government allocation of
financial resources to development programs ultimately declining from 4080 percent in
1978 to 1283 percent in 1999 1358 percent in 2000 and 1360 percent in 2002 in
proportion to total expenditure (Appendix V) thereby constraining and in many cases
stifling the growth of the economy Moreover it was not possible as a result to correlate
development expenditure with economic growth (presumably because of numerous
resource leakages) which apparently varied not because of but in spite of the proportion
of development expenditure appropriated by government to the total expenditure as
shown in Appendix VI
Until 2004 when performance contracting began to take shape in Kenya public sector
management was characterized by considerable inertia exemplified by inefficiencies in
the exploitation and use of national resources unresponsive service delivery culture and
unmitigated graft This was to change dramatically when PCs became operational The
21
performance of both public sector institutions and the economy improved rapidly with the
economic growth rate rising from 04 percent in 2002 to 71 percent in 2007(Appendix V
and VIII) Moreover save for variations resulting from the contribution of non ndash state
sectors of the economy there seemed to be a similarity between the growth of the
economy and improvement in the performance of the public sector as shown in Appendix
VIII and Appendix IX This growth trend was however to be interrupted by the
skirmishes that followed the disputed 2007 general elections The effects of the
skirmishes on the growth of the economy and the aggregate performance of the public
service are discernible from the trends graphed in Appendices VII VIII and IX
Until March 2013 the public sector in Kenya was made up of 487 public agencies in the
executive arm of the government comprising 46 ministries and accounting departments
202 state corporations 175 local authorities and 64 tertiary institutions Out of these 486
were on PC Performance contracting in the public sector in Kenya whose core focus is
performance management measurement and improvement was born out of the need to
improve performance by re-focusing public service operations and management from
inputs processes procedures and activities to results (outputs outcomes and impacts)
The system is founded on five year institutional strategic plans which are in turn linked
to the national vision and is built around clear performance criteria indicators and
targets and an elaborate measurement and evaluation system which compares
achievement of freely negotiated performance targets with actual achievement The
subsequent evaluation examines the various factors affecting performance
22
Although performance contracting was introduced in the country in 2004 it was not until
the financial year 200506 that citizenslsquo service delivery charters and the concomitant
requirement for service-oriented agencies to carry out annual customer satisfaction
surveys thereby paving the way for measurement of various aspects of service delivery
that yield to customer satisfaction began to take root Accordingly ministries state
corporations and local authorities that were on PC began to incorporate ―customer
satisfaction as a key performance indicator under the ―service delivery criterion in their
PCs in the financial year 200607 It was therefore not until 200607 that measurement
and evaluation of performance incorporating ―customer satisfaction was carried out
Tertiary institutions came on board in 200708
12 The Research Problem
Until 2004 the foremost obstacles to public service delivery in Kenya had been identified
with inefficient exploitation and use of public resources and a largely lethargic public
service These obstacles had a direct bearing on policy and project implementation and
the conduct of public servants which in turn affected overall performance and service
delivery Yet improvement in operational performance informs the quality accessibility
affordability and speed of public services Performance improvement is engendered when
operations are managed under a performance management measurement and
improvement regime that has an elaborate measurement system because as Osborne et al
(1992) state ―what gets measured gets done According to Brown et al (2001) people
make decisions and do their work at least partly based on how they will be evaluated As
a result they tend to improve in performance aspects that will be measured and rewarded
rather than in un-measured aspects even if these may not necessarily support
organizational goals and customer satisfaction
23
Moreover governments have generally tended to focus on project implementation and
not on the quality of performance They have as a consequence not laid significant
emphasis on improvement in service delivery This study on performance contracting
measurement and public service delivery in Kenya is therefore motivated by the need to
establish and understand the factors that affect and influence improvement in
organizational performance in the public sector and ultimately improvement in the
quality of public service delivery
Many governments have made attempts at improving service delivery across public
activities and finding generally agreeable better measures and ways of reporting on their
performance has been a great challenge over the past three decades The issues of
performance contracting measurement and evaluation are not new phenomena
governments have persistently sought to justify their existence based on their
achievements in service delivery to their citizens As early as the start of the 20th century
efforts to scientifically measure such achievements and efforts have been made but there
is little doubt that the current wave of reform in this area is larger broader deeper and
longer than all previous attempts It has been asserted therefore that the measurement of
government achievement is here to stay (OECD-PUMA 1997 OECD 2005 Talbot
2005) This study set out to investigate and understand the factors that affect and
influence the performance of the public service and the quality of public service delivery
in Kenya
24
Experiences of Africalsquos development over the last two decades have consistently
demonstrated the need for more intensive efforts towards effectively addressing the
continentlsquos major development challenges the degree of which varies from country to
country It is only recently that these countries are realizing that it is competitive
advantage not comparative advantage that drives economic development Competitive
advantage driven by public sector efficiency and effectiveness and customer centric
approach to public sector governance then is the missing link that defines the difference
in performance excellence between virtually resource-deficit countries and resource-
abundant nations mainly in the developing world as shown in Appendix X which
depicts the performance of selected countries against a number of economic indicators
The thrust then is to devise effective systems of qualitative and quantitative performance
management measurement and improvement which can also be domesticated and
replicated in other countries Governments have critical roles to play in the creation of
competitive advantage for respective countries According to Porter (1990) this role
entails acting as a catalyst to encourage and even push companies to raise their
aspirations and move to higher levels of competitive performance stimulating early
demand for advanced products focusing on specialized factor creation and stimulating
corporate rivalry by limiting direct cooperation and enforcing anti-trust regulations
Creation of competitive advantage is the foundation of global competitiveness for a
country
25
Effective execution of the role requires an efficient and effective public service the
performance of which forms the basis for measurement and improvement This then is
about performance improvement driven by an empowered and efficient public service A
number of studies have been conducted across sectors on the concepts of performance
contracting measurement and service delivery In the research findings by March and
Olsen (1989) Peters (1999) and Talbot et al (2004) the impact of different countries
with varying institutional differences on shaping performance practice was an area which
had been almost totally ignored despite the resurgence of institutional-based analysis
which was as yet largely not applied to performance management and measurement
systems
According to the research findings by Talbot (2005) Japan the UK and the USA all now
have well developed systems of reporting government performance results In Japan the
Government Policy Evaluation Act (GPEA) has been active since 2001 in the UK the
Public Service Agreements (PSA) system dates back to 1998 while in the USA the
Government Performance and Results Act (GPRA) has been operational since 1993
There is still need however for research on the best forms and systems for reporting the
results of performance and how they can best be used This study sought to establish the
role that performance contracting and measurement play in influencing organizational
performance and customer satisfaction in public service delivery in the Kenya and the
intervening and moderating effects of respectively political stability and global
competitiveness
26
Early studies have focused on policy evaluation as opposed to performance measurement
as seen in both theory and practice (Blalock 1999) Although the two concepts have the
same basic aim of establishing the effectiveness and efficiency of various forms of public
activity there is a wide gap in the potential synergy between the two approaches
Accordingly the term ―performance referred to all measurement of the results of
government public agencies and programs of activity while policy evaluation tended to
focus on programs Only a few countries have developed more integrated systems that
combine evaluation and performance but it is still not done in most developing countries
(Talbot 2005) Through research within the Kenyan public service this study sets out to
address the contradictions by spotlighting on performance measurement with a more
organizational focus tended towards setting up long-term continuous monitoring
systems which rely slightly more on quantitative approaches and its outputs
According to the findings of a study conducted by OECD-PUMA (1997) Blalock
(1999) Peters (1999) Behn (2001) Talbot et al (2004) OECD (2005) Talbot (2005)
Pollitt (2006) and Radin (2006) addressing major gaps in performance measurement
within the public sector most current literature about the performance systems has been
directed on the types of reporting systems which have emerged for example the focus on
outputs or outcomes and not results like service delivery Most studies have focused on
organizational and behavioral responses to performance policies as opposed to the use of
performance measurement in strategic and operational management including the use of
methods such as the BSCs
27
Observations at the beginning of this chapter alluded to the genesis of the declining
performance of the public sector as emanating from poor exploitation and use of public
resources and a lethargic public service delivery culture Further prior to 2004 there had
been only token efforts at measurement of performance of the public sector focused
primarily on individual employees Organizational performance was in essence not
measured Measurement practices were moreover directed at compliance with
regulations and procedures rather than on results Poor and largely unmeasured
performance resulted inevitably in poor service delivery This study was guided by the
use of the performance measurement results and institutional-based analysis in exploring
service delivery among public institutions in Kenya and explored the proposition that
performance contracting and measurement done right can improve service delivery by the
public sector
13 Research Objectives
The general objective of this study was to establish the relationship between performance
contracting and measurement and public service delivery in Kenya as intervened and
moderated by respectively political stability and global competitiveness The specific
objectives were to
(i) Determine the relationship between performance contracting and measurement
and public service delivery in Kenya
(ii) Establish the intervening effect of political stability on the relationship between
performance contracting and measurement and public service delivery in Kenya
28
(iii) Establish the moderating effect of global competitiveness on the relationship
between performance contracting and measurement and public service delivery in
Kenya
(iv) Establish the joint effect of political stability and global competitiveness on the
relationship between performance contracting and measurement and public
service delivery in Kenya
14 Value of the Study
The outcome of this study is expected impact on a broad spectrum of constituents among
them governments desirous to improve public service delivery practitioners and
academicians in the field of performance measurement and public service delivery
managers of public sector institutions individual public sector employees and the public
who are the beneficiaries of government services The key value lies in the demonstration
in the study that organizational performance influences service delivery and that to spur
organizational performance improvement performance must be measured This
vindicates the assertion by Brown et al (2001) that measurement is a way of getting
people to act in ways that will bring about desired future outcomes and effectively links
the performance of the individual to the performance of the institution It further supports
the observations by Nathan (2009) that performance management practices will continue
to be questionable unless they are rooted in a performance measurement system
The study adds to conventional knowledge in the field by incorporating organizational
and environmental aspects (political stability and global competitiveness) as respectively
key intervening and moderating variables on the relationship between performance
measurement and improvement in service delivery In essence and perhaps more
29
importantly the findings of the study should impact on policy formulation and
implementation in making it easy for policy makers to determine more accurately what to
focus effort and resources on in order to improve service delivery and the role that good
governance political stability and global competitiveness play in the process
15 Chapter Summary
This chapter provides a background of the study by discussing the key variables and their
linkages to the study The nature of the public service is discussed A discussion of the
research problem follows and it elaborates on the conceptual contextual and
methodological gaps that the study intend to fill The purpose of the study is presented
together with specific objectives which involve establishing the relationship between
performance contracting and measurement and public service delivery in Kenya The
chapter also presents the value of the study
30
CHAPTER TWO
LITERATURE REVIEW
21 Introduction
This chapter covers a review of literature in the fields of performance management
measurement and improvement including key selected factors that influence and impact
the relationship between measurement of performance and service delivery The review
vindicates a number of the theoretical underpinnings that inform the role of measurement
on performance improvement and ultimately on service delivery and identifies a number
of unexplored consequences and influence of intermediary factors on the relationship
The chapter includes also a contextual and conceptual framework defining the
relationships between the pertinent variables and which forms the basis of this study
22 Theoretical Perspective
The concepts of performance contracting measurement and service delivery are
grounded in and indeed straddle a number of theories that embrace and give credence to
these precepts This section covers the key theories including the contextual and
conceptual perspectives of the study It explores the broad literature on performance
management measurement and service delivery including historical perspectives of the
precepts and the views of various academicians and practitioners It will be expedient to
note that performance measurement is viewed in this study in the context of performance
improvement and the extent to which it impels improvement in organizational
performance
31
221 Theory of Performance
The Theory of Performance espoused by Don Edgar (1974) is premised on the
perceived enormous potential of humanity to realize extraordinary accomplishments and
goals which they do because as for example JF Kennedy put it in 1962 challenging
Americans to go to the moon the goals are hard and ―hellipbecause that goal will serve to
organize and measure the best of our energies and skillshellip and posits that improvement
in performance can be created through the processes of influencing the performerlsquos
mindset by engaging them in an optimal emotional state immersing the performer in an
enriching environment and engaging the performer in reflective practice
It attempts to explain performance and improvement in performance within the
framework of six concepts comprising the context of performance level of knowledge
levels of skills level of identity personal factors and the level of performance upon
which the performance of an individual or organization is predicated Performance
therefore produces results that can be classified into the following categories quality
increases cost decreases capability increases capacity increases knowledge increases
skills increases identity and motivation increases
The theory views performance as taking a complex series of actions that integrate skills
and knowledge to produce a valuable result It accordingly informs learning through
examining the level of performance of the organization Performance is a journey not a
destination and the level of performance is the location in the journey Each level or
location indicates the effectiveness or quality of performance
32
The precepts of the theory of performance are supported in literature by the works of
Tomlinson et al (2002) and Bransford et al (2000) They developed a model for
effective teaching and learning that included knowledge-centered learner-centered
assessment-centered and community-centered components The learner-centered
component involves the performerlsquos mindset while the knowledge and community
centered components allude to the immersion into an enriching environment The
assessment centered component embraces elements of reflective practice Don Edgar
sums up the theory by referring to Wiske (1998) the advocacy by Harvardlsquos Project Zero
that when people learn and grow they are empowered to create results that make a
difference Working and learning together in ways that make the world better has been a
primary goal of higher education throughout the ages
222 Theory of Organizational Performance Management (OPM)
Performance management is a set of techniques used to measure success in meeting goals
in a business context and is used to evaluate specific processes and systems the
performance of departments or the performance of individual employees The theory of
organizational performance management applies this approach to an organization as a
whole assessing progress toward goals and identifying and adjusting factors which
hinder progress OPM is categorized as a proactive approach to promoting progress
toward goal achievement in a business environment Where an OPM approach is in place
techniques for monitoring progress including the performance of systems subsystems
departments and employees are an integral part of the conduct of business
33
OPM runs recurring analyses of systems and makes improvements wherever possible
with the intention of avoiding performance gaps that may impact the achievement of
defined goals The approach is based on analyzing aggregates of performance data in
order to measure progress toward defined goals Top management must set the goals for
for example increased earnings increased sales higher productivity reduced cost or
improved safety OPM identifies the data relevant to progress toward such goals OPM
will search proactively for possible improvements to systems OPM solicits participation
from both managers and employees engaged in the relevant processes and from
customers and other stakeholders It also conducts reviews of best practices in the field
including new technological developments and employs data analysis to identify deficient
operating systems where improvements are needed
After the process of analysis and validation improvements are selected for
implementation These may be improvements to the system technical or staff
performance Managing implementation may include training programs consultation
with affected staff safety reviews if the improvement calls for changes in the workplace
environment and a generally controlled and measured release of the planned changes It
should also include preparations to monitor the effectiveness of the improvement once it
is in place
OPM has been criticized for vagueness and imprecision It has been suggested that the
performance of the organization is sometimes defined not in terms of tangible
measurable goals but as Barbara Czarniawska-Joerges and Pasquale Gagliardi put it
34
more like a platonic ideal Others such as Steven M Jex have argued that it is
problematic to impose a performance management and reward system on an
organization as such systems were originally designed with the performance and
behavior of individuals in mind
223 Theory of Change
The Theory of Change is a specific type of methodology for planning participation and
evaluation that is used in the philanthropy not-for-profit and government sectors to
promote social change The Theory of Change emerged in the 1990s at the Aspen
Institute Roundtable on Community Change as a means to model and evaluate
comprehensive community initiatives The Theory defines long-term goals and then
bends backwards to identify preconditions necessary for meeting the goals and explains
the process of change by outlining causal linkages in an initiative ie its shorter-term
intermediate and longer-term outcomes The identified changes are mapped as the
―outcomes pathway showing each outcome in a logical relationship to all the others as
well as the chronological flow The links between outcomes are explained by ―rationales
or statements of why one outcome is thought to be a prerequisite for another The
innovation of Theory of Change lies (i) in making the distinction between desired and
actual outcomes and (ii) in requiring stakeholders to model their desired outcomes before
they decide on forms of intervention to achieve those outcomes
The Theory of Change is a form of critical theory that ensures a transparent distribution
of power dynamics Further the process is necessarily inclusive of many perspectives and
participants in achieving solutions The Theory can begin at any stage of an initiative
35
depending on the intended use A theory developed at the outset is best at informing the
planning of an initiative Having worked out a change model practitioners can make
more informed decisions about strategy and tactics As monitoring and evaluation data
become available stakeholders can periodically refine the Theory as the evidence
indicates A Theory of Change can be developed retrospectively by reading program
documents talking to stakeholders and analyzing data This is often done during
evaluations reflecting what has worked or not in order to understand the past and plan for
the future
Theory of Change emerged from the field of program theory and program evaluation in
the mid-1990s as a new way of analyzing the theories motivating programs and
initiatives working for social and political change Carol Weiss popularized the term
―Theory of Change as a way to describe the set of assumptions that explain both the
mini-steps that lead to the long-term goal of interest and the connections between
program activities and outcomes that occur at each step of the way
She challenged designers of complex community-based initiatives to be specific about
the theories of change guiding their work and suggested that doing so would improve
their overall evaluation plans and would strengthen their ability to claim credit for
outcomes that were predicted in their theory She called for the use of an approach that at
first glance seems like common sense lay out the sequence of outcomes that are
expected to occur as the result of an intervention and plan an evaluation strategy around
tracking whether these expected outcomes are actually produced Her stature in the field
and the apparent promise of this idea motivated a number of foundations to support the
36
use of this technique later termed ―the Theory of Change approach in the evaluation of
community change initiatives In the years that followed a number of evaluations were
developed around this approach fueling more interest in the field about its value and
potential application
In the early days of Theory of Change Anne Kubisch and others established three quality
control criteria These are plausibility feasibility and testability Plausibility refers to the
logic of the outcomes pathway whether it makes sense and whether the outcomes are in
the right order It also attempts to answer the questions are the preconditions each
necessary and collectively sufficient to reach the long-term outcomes and ultimate
impact are there gaps in the logic Feasibility refers to whether the initiative can
realistically achieve its long-term outcomes and impact Does the organization have
adequate resources Does it need partners Does the scope expectations or timeline of
the theory need adjustment Testability refers chiefly to the indicators Are they solid and
measurable Will they yield sufficient information to evaluate the success of the
initiative Will they be convincing to necessary audiences In addition to these three
basic quality control criteria Act Knowledge has added another key criterion
Appropriate Scope An actionable theory that can be communicated to the key audiences
is dependent in part upon choosing the right scope broad enough to leave no gaps in the
model yet focused enough on the opportunities and resources at hand Appropriate Scope
also integrates the evaluation concept of accountability Many Theory of Change
outcome pathways include an accountability ceiling often a dashed line drawn across the
pathway that separates outcomes the organization will monitor and claim credit for
attaining from higher-order outcomes that are beyond its power to achieve for example
―a just society
37
The ultimate success of any Theory of Change lies in its ability to demonstrate progress
on the achievement of outcomes Evidence of success confirms the theory and indicates
that the initiative is effective Therefore the outcomes in a Theory of Change must be
coupled with indicators that guide and facilitate measurement Indicators may be said to
operationalize the outcomes that is they make the outcomes understandable in concrete
observable and measurable terms As the origins of Theory of Change lie in the field of
evaluation and monitoring developments over the years have ensured that the Theory
continues to be an invaluable method to conduct evaluations of many different types of
projects and organizations Often posing theory-based evaluation questions helps to focus
evaluation efforts on key concerns As well there may be a need to pick the right
indicators from among the many available and one can use ―monitoring questions to
select the indicators that will be most helpful
The use of Theory of Change in planning and evaluation has increased exponentially
among philanthropies government agencies international NGOs the UN and many
other major organizations in both developed and developing countries This has led to
new areas of work such as linking the Theory of Change approach to systems thinking
and complexity Change processes are no longer seen as linear but as having many
feedback loops that need to be understood Consequently Theory of Change is
strengthening monitoring evaluation and learning They are also helping to understand
and assess impact in hard to measure areas such as governance capacity strengthening
and institutional development Innovations continue to emerge
38
Theory of Change is essentially a comprehensive description and illustration of how and
why a desired change is expected to happen in a particular context It is focused in
particular on mapping out or ―filling in what has been described as the ―missing middle
between what a program or change initiative does (its activities or interventions) and how
these lead to desired goals being achieved It does this by first identifying the desired
long-term goals and then works backwards to identify all the conditions that must be in
place (and how these relate to one another causally) for the goals to occur These are all
mapped out in an outcomes framework
The outcomes framework then provides the basis for identifying the type of activity or
intervention that will lead to the outcomes identified as preconditions for achieving the
long-term goal Through this approach the precise link between activities and the
achievement of the long-term goals are more fully understood This leads to better
planning in that activities are linked to a detailed understanding of how change actually
happens It also leads to better evaluation as it is possible to measure progress towards
the achievement of longer-term goals that goes beyond the identification of program
outputs
224 Resource-Based Theory of Competitive Advantage
The Resource-Based (RB) Theory has been described as an ―inside-out process of
strategy formulation that begins by looking at what resources the firm possesses This is
followed by assessment of the potential of the resources for value generation and ends up
by defining a strategy that will allow the capturing of maximum of value in a sustainable
way The process involves identifying and classifying the firmlsquos resources and
appraising strengths and weaknesses relative to competitors identifying opportunities for
39
better utilization of resources appraising the rent generating potential of resources and
capabilities in terms of (i) their potential for sustainable competitive advantage and (ii)
the appropriateness of their returns identifying the firmlsquos capabilities What can the firm
do more effectively than its rivals identifying the resource inputs to each capability and
the complexity of each capability selecting a strategy which best exploits the firmlsquos
resources and capabilities relative to external opportunities and identifying resource gaps
which need to be filled It is therefore about investing in replenishing augmenting and
upgrading the firmlsquos resource base including capabilities resources strategy and
competitive advantage
225 Theoretical Foundations of Performance Improvement
Swanson (1999) contends that performance a highly ubiquitous and generalizable
phenomenon is mediated through human expertise and human effort The ubiquity of
performance is evident in everyday human discourse with references to such terms as
organizational performance team performance individual performance hardware system
performance vehicle engine performance and even class performance According to the
American Heritage College Dictionary to perform is to fulfill an obligation or
requirement to accomplish something as promised or expected Accordingly
performance is the valued productive output of a system in form of goods and services
The goods and services viewed also as units of performance and the fulfillment of the
goods and viewed as performance units are measured in terms of quantity time and
quality feature measures In exploring the theoretical foundations of performance
improvement Swanson (1999) makes reference to the key contributors to the individual
and process improvement performance perspectives focusing on the core external
40
economic political and cultural forces that drive organizational performance agenda and
formula and proposes a discreet and logical set of theories as the foundation of
performance improvement These theoretical domains are economic theory
psychological theory and systems theory
The economic theory foundation requires that performance improvement must include
direct analysis action and measurement of outcomes That over time organizations must
generate more income than they spend in order to exist This facet of the theory is
underpinned by three perspectives These are the scarce resource theory sustainable
resource theory and the human capital theory The scarce resource theory postulates that
there are limitations to everything and this requires that prudent choices are made
regarding the manner in which capital will be employed and allowing forecasted return
on investment to guide decisions on choices between options Swanson and Gradous
(1988) The sustainable resource theory incorporates the additional concerns of the long
term versus short term agenda and recognizes the dominance of competitive advantage
over comparative advantage premised on human brain power (Thurow 1993) The
human capital theory recognizes the softer strategic issues of training health and medical
care the virtues of honesty punctuality and others such as integrity as investments in
capital with valuable returns that can be calculated The theme of this theory then is that
because performance improvement takes place in economic entities referred to as
organizations performance improvement must of essence invoke economic theory as its
basis Further as Drucker (1964) observed management theories and methods must be
properly viewed as useful derivatives of economic theory
41
The psychological theory perspective addresses the core understandings to human
behavior and learning and recognizes the immense leverage value that performance
improvement initiatives can draw from such concomitant theories as theories of
motivation learning group dynamics behavioral and social psychology The
psychological theory is based on three perspectives These are the Gestalt psychology
behavioral psychology and cognitive psychology (purposive behaviorism) The Gestalt
psychology focuses on the holistic view of individuals and their need for holistic based
on the believe that people add something to experience that is not contained in the
sensory data and that they understand the world in meaningful wholes (Hergenhahn amp
Olson 1993) Behavioral psychology relates to the study of actual human behavior and
suggests that individuals respond the only way they can based on their capacity
experience and the present forces working on them In contrast cognitive psychology is
about purposive behaviorism that attempts to explain goal-directed behavior and the
notion that human beings organize their lives around purposes The gist of this
perspective is that since performance improvement takes place in organizations that are
psychologically framed by those who establish and operate them performance
improvement must then call on psychology as a core (Bereiter amp Scardamalia 1993
Dubin 1971) According to Bereiter amp Scardamalia 1993 and Ilgenamp Klein 1990)
performance cannot be improved if people choose not to perform or do not make
significant and persistent and that workplace systems and systematically designed
learning experiences provide a sustainable foundation for performance improvement
Theories of learning motivation information processing and other psychological theories
therefore comprise a core theoretical foundation
42
Systems theory deals with systemic disconnects that affect performance adversely such
as failure to clearly specify expected outcomes of an organization and not having a
clearly defined performance improvement system This theory is made up of a collection
of general concepts principles tools problems and methods associated with all manner
of systems and comprises threes theory perspectives These are the general systems
theory chaos theory and the futures theory The general systems theory makes reference
to inputs processes outputs and feedback and the limitations of a single personality
theory in predicting human behavior (Von Bertalanffy 1962) Boulding (1956) states that
a single theory from a single field of study cannot reach a satisfactory level of theory
generality and proceeds to refer to a spectrum of theories or system of systemslsquo to
perform the function of a gestalt in theory building (Boulding 1956) Chaos theory
makes reference and studies phenomena that are unsystematic and which therefore do not
follow the rules The futures theory is about planning for the future in uncertain
conditions and liberating peoplelsquos insights (Schwartz 1991 9) It may be viewed as
essentially managing risk and the unpredictable vagaries of the operating environment
The futures theory prepares organizations to cope with the future uncertainties and is
therefore critical for sustainable performance improvement
The moral here is that since performance improvement happens in organizations that can
be categorized as systems functioning within an ever-changing environment the systems
theory is critical (Buckley 1968 Gradous 1989 Senge 1990) Further engineering and
technology theories should be viewed as useful derivatives of systems theory (FitzGerald
amp FitzGerald 1973 Davenport 1993)
43
23 Performance Contracting and Measurement
Performance contracting as it is known and implemented today is essentially a
management tool that identifies organizational goals decomposes strategic objectives
into measurable performance indicators and targets and defines objective methodologies
for measuring progress towards achievement of the targets It therefore encapsulates the
full range of the key attributes of managing measuring and improving performance To
this extent the performance contracting system is fairly sensitive to transactional
relationships across performance levels (that is individual group organizational and
external impact) and contexts (Guerra-Loacutepez amp Hutchinson 2013)
Viewed from this dimension performance contracting is rated along with any
accomplished Performance Management Measurement and Improvement System
(PMMIS) In this perspective and within human resource management and allied fields
performance management is typically defined as a set of ongoing integrated activities
that move beyond isolated performance appraisals to strategically measure manage and
develop human performance within the context of organizational strategy and goals
(Aguinis 2007) Nathan (2009) however cautioned that performance measurement
should not be confused with performance management but should instead be seen as a
prerequisite for effective management
The rationale for this distinction is adequately captured by a number of researchers
Aguinis (2007) Aguinis et al (2011) Biron et al (2011) Hantula (2011) Nankervis and
Compton (2006) Pulakos and OlsquoLeary (2011) are in agreement that although
organizational use of PMSs is widespread dissatisfaction among both management and
44
employees is also high and the value addition questionable Performance management
has the potential to generate significant value for organizations but it is frequently
ineffective because it is often viewed skeptically by employees typically requires a
significant investment of resources and capital and may actually undermine strategic
improvement when implemented poorly (Aguinis 2007 Biron et al 2011 Pulakos amp
OlsquoLeary 2011) These findings can however be traced back to both poor measurement
of important performance indicators and consequently poor alignment to performance
management interventions
Performance measurement is a central mechanism in both assessment and evaluation
which provides the required data for identifying the most appropriate interventions to
measurably improve performance (Guerra-Loacutepez 2008 2010) The robustness of
performance management including its capacity to influence performance is therefore up
- scaled by rooting it in a system that quantifies performance and provides evidence-
based data that is a performance measurement system Nutt (2007) opines that beyond
implementing research findings to improve performance there is a critical requirement to
implement evidence-gathering practices into performance management Nutt (2007) cites
a variety of studies that indicate intelligence gathering is the most over-looked step of the
decision making process In a different study Nutt (2008) compared the success of
organizational decisions among three groups and found that those who made decisions
based on the use of quantified performance data were significantly more successful than
those that made decisions on the basis of personal hunches or feelings or on the basis of
consensus of opinions of others This does not suggest that the two latter perspectives do
not have their utility rather it suggests that they must be triangulated with independently
45
verifiable performance data It can be safely concluded therefore that performance
measurement is at the heart of managing and improvement in performance (Rummler
2004) yet according to the research it is often over-looked (Clark amp Estes 2000
Guerra-Loacutepez amp Leigh 2009)
Clark and Estes (2000 48) noted that highly regarded research groups who surveyed
performance improvement solutions found that a huge gap exists between what we think
we accomplish and what scientific analyses say we accomplished These authors cite a
number of findings from the National Academy of Science the National Research
Council and other independent groups including the fact that the majority of
organizational change initiatives are quickly abandoned transfer of performance
solutions shows that even though they may work once they almost never work in other
organizational contexts because they are not evaluated one-third of performance
feedback strategies fail and another third make performance worse and successful
performance improvement interventions do exist but are rarely integrated into the
commonly used performance solutions PMSs provide the information that drives
performance management processes and are therefore of critical importance to an
effective and efficient PMS (Bititci et al 1997)
These accounts bring out succinctly the observation that the core ingredient that impels
performance improvement in a performance contract is performance measurement
Indeed in many countries including Kenya there is no distinction between performance
contracting and performance measurement as their design and development overlap
Neely et al (1995) described typical process for developing a performance measurement
system as shown in the table below
46
Table 21 Steps in Developing a Performance Measurement System
Step Action
1 Clearly define the firmlsquos mission statement
2 Identify the firmlsquos strategic objectives using the mission statement as a guide
(Profitability market share quality cost flexibility dependability and innovation
3 Develop an understanding of each functional arealsquos role in achieving the
Various strategic objectives
4 For each functional area develop global performance measures capable of
defining the firmlsquos overall competitive position to top management
5 Communicate strategic objectives and performance goals to lower levels in the
organization Establish more specific performance criteria at each level
6 Assure consistency with strategic objectives among the performance criteria used
at each level
7 Assure the compatibility of performance measures used in all functional areas
8 Use the performance measurement system
9 Periodically reevaluate the appropriateness of the established performance
measurement system in view of the current competitive environment
To sustain the system additional requirements in the development of a performance
measurement system include providing a maintenance structure involving key users
securing top management and employeeslsquo support ensuring clear and explicit objectives
and setting timescales This sequence is wholly similar to the sequence employed in the
design and development of the performance contracting system in Kenya
A number of researchers have argued that performance management research in
particular suffers from a weak theoretical foundation (Buchner 2007 Claus amp Briscoe
2009 Hantula 2011) Others argue that performance management research is too limited
to positivist frames that investigate on a particular tool or approach (McKenna et al
2011 Thorpe amp Beasley 2004) Yet despite this reliance on prescription human
resource research findings are not being adequately integrated into the work of
practitioners which may be due to differences in goals interests or access (Aguinis amp
47
Pierce 2007 Deadrick amp Gibson 2009 Rynes et al 2007) The resulting disconnection
between research and practice also underscores the necessity for a meaningful model of
performance management that is both theoretically sound and attendant to the needs of
practitioners and sensitive to transactional relationships across performance levels
Guerra and Alisa (2013) state that among the themes on performance management that
have been pursued is one that centers on organizational factors that foster effective
performance management In the quest for achievement of results and excellence in
performance it is important to explore the organizational factors that impel effective
performance management Rather than focusing on aspects of the performance
management system itself this line of inquiry investigates contextual circumstances that
may be associated with successful implementation of performance management
programs
Biron and colleagues (2011) drew on signaling theory to examine organizational
practices that influence performance management in 16 high-performing global firms
and found that strategically and tactically focused goals senior management
involvement and robust organizational communication were conditions that appear to
support performance management efforts Pulakos and OlsquoLeary (2011) argue that the
managerndashemployee relationship is a primary facilitator of effective performance
management thus organizations should focus on strengthening this connection rather
than continuing to fruitlessly tinker with formal PMS features This is echoed by Den
Hartog et al (2004 563) who assert that managers and supervisors play a key role in the
enactment of performance management As such their consistency fairness and skill in
using tools will to a large degree determine whether such tools indeed generate positive
effects on commitment and employee performance
48
Performance contracting entails execution of a performance agreement between a
principal or a superior authority acting as the owner of an agency and a subordinate or
agent for the purpose of impelling the delivery of targeted results effectively and
efficiently In the public service performance contracting is defined as the execution of a
freely negotiated performance agreement between government acting as the owner of a
public agency and the management of the agency The performance agreement more
commonly known as PC consists of a range of management tools used to define
responsibilities and expectations between parties to enable them achieve targeted and
mutually agreed results The agreement therefore specifies what needs to be achieved
expected levels of achievement timelines and the evaluation and reporting
methodologies It is also expected to clearly specify the intentions obligations and
responsibilities of the two parties (Trivedi 1994) It is an attempt to move the public
sector style of management away from ―control by procedures to control by results and to
simultaneously increase the quality of the controls while reducing the quantity of the
controls
According to Trivedi (1994) there is consensus among public enterprise professionals and
practitioners that the rhetoric of privatization has far exceeded the reality that the
dramatic turnaround of public enterprise performance in such diverse countries as South
Korea Pakistan and France is testimony to the achievement of the policy of performance
contracting According to an OECD report of 1999 ―Les Contrats de Performance the
unifying theme in performance contracting arrangements is in its value as a management
tool to promote savings effectiveness and responsiveness These key objectives are
expressed in terms of performance expectations linked to budget (inputs) service
49
(outputs) impacts (outcomes) and management (corporate capacity) In countries where
the system is employed achievement of these objectives is vindicated including capacity
for performance measurement and improvement in service delivery According to the
report PCs first emerged in Europe in the 1960lsquos and 1970lsquos in the context of high
inflation and high unemployment when corporate governments such as France and the
United Kingdom used public enterprises to counter these problems
The French Government introduced stability contracts (contrats de stabilite) to impose
price controls on major public enterprises in 1965 In 1967 the Nora Report proposed the
use of program contracts (contrats de programme) which would define goals increase
managerial autonomy set financial targets and obligate the government to pay for the
non-commercial activities and policies imposed on the enterprise The first program
contracts were signed in 1970 with the Societe Nationale de Chemins de Fer Francais
(SNCF) the French National Railway and the Electricity Utility (EDF) in 1969
followed by the Radio and Television Utility (ORTF) in 1971 These early contracts were
however abandoned following the oil crisis of 197374 which undermined the ability of
either party to fulfill their commitments (Trivedi 1988 1990 1994)
The typical PC is made up of three subsystems the first one is the performance
information system which ensures symmetry of information between the principal and
the agent during the process of negotiating performance targets This subsystem also
defines the frequency and modalities of periodic continuous or end of year reporting of
performance The second is the performance evaluation system whichconsists of a
number of steps relating mainly to the development of criteria for evaluating
50
performance The latter focuses on static efficiency which determines whether the
agency is making optimum use of its resources dynamic efficiency which addresses
decisions that entail costs outlays in the present but whose benefits are realized in the
future project implementation that seeks to establish whether projects are being
implemented efficiently achievement of non-commercial objectives which relates to
development of systems to measure non-commercial activities and the computation of
composite scores The third is the Performance IncentivesSanctions System whichrelates
rewardssanctions to measurable performance The PC as a Performance Management
Measurement and Improvement System (PMMIS) is therefore defined by the three
subsystems as shown in Figure 21
Figure 21 Performance Management Measurement and Improvement System
Source Memorandum of Understanding (Trivedi 1994)
The architecture of the PC in Kenya comprises a narrative made up of a preamble that
sets out the precepts and coordinates within which the parties enter into the agreement
and six consecutive sections describing the vision mission and strategic objectives
Institutional framework (the
―who) should measureevaluate
Criteria (the ―how) to
measureevaluate
Performance
incentivessanctions
system
Performance
measurementevaluatio
n system
Performance
information system
Performance Contract
51
listing commitments and responsibilities of the agent listing the commitments and
obligations of the principal defining modalities of reporting and information flows
defining duration of the contract and detailing signatories to the contract The PC more
importantly includes a PC matrix with six management perspectives (referred to as
performance criteria) (Appendix III) the citizenslsquo service charter (Appendix IV) as a
separate tool that serves to operationalize the critical performance criterion of ―service
delivery and the measurement of the ―customer satisfaction sub-indicator and a
detailed measurement and evaluation methodology Administration and sequencing of the
Kenyan version of performance contracting presumes the existence of a strategic plan and
involves the steps depicted in the Figure 22
Figure 22 Performance Contracting Cycle
Source Performance contracting training modules (2011) Office of Prime Minister
Government of Kenya
52
The cycle begins with the organization mobilizing for the purpose of setting targets
Since commencement of the process presumes existence of a strategic plan (in the
absence of a strategic plan its (strategic plan) development within the contract year
should be featured as a performance indicator with significant weighting under the ―non
ndash financial perspective) target setting should draw principally from the strategic
objectives in the strategic plan taking cognizance of the detailed Strengths Weaknesses
Opportunities and Threats (SWOT) analysis that must have informed the decision on the
strategic direction to achieve the vision Moreover setting of targets must involve as
broad a spectrum of employees as possible in order that each individual section and
division is able to identify and own their niche early enough for effective strategy
execution
The next phase in the sequence is drafting the PC and proceeding to negotiate it with the
external experts referred to as Ad Hoc Negotiation Task Force Negotiation is carried out
primarily for the purpose of ensuring that performance targets are significantly growth -
oriented but realistic that every key operational area is catered for each indicator is
taggedlsquo to a strategic objective and generally that the design of the PC is consistent with
the guidelines for implementing PCs This phase is succeeded by vetting a term that
refers to the process of scrutinizing negotiated PCs to establish conformity to the policy
on performance management The latter is therefore a quality assurance exercise and is
carried out by the core performance contracting coordinating unit assisted by
independent external experts representing the principal Then follows the implementation
phase which lasts for the 12 months coinciding with the financial year during which
performance is monitored continuously or periodically by the principal or his agents At
the end of the contract year performance is measured by a team of external experts and
the results subsequently made public
53
As observed negotiation of PCs and measurement and evaluation of performance are
carried out by independent experts drawn from outside the public service These are
external stakeholders selected from the business community professional associations
academia civil society other non-state actors and retired public servants but in all cases
the best in their respective areas of competence Involvement of external stakeholders in
both negotiation of performance targets and measurementevaluation of performance in
the public service is a deliberate strategy to secure public awareness support and
ownership of key performance improvement service delivery and project implementation
initiatives as the external experts (who are not active public servants) represent the
public and also double up as consumers of public services It also gives credibility and
objectivity to the performance contracting system and the results of evaluation (in that
government does not set its own performance standards andor evaluate its own
performance) while at the same time taking advantage of expertise that may
occasionally be in short supply in the public service A copy of a model PC comprising
the main narrative a PC matrix and a citizenslsquo service charter are shown in Appendices
II III and IV
The period following completion of the study has seen the structure of the performance
contract remaining largely the same except for the addition of a seventh performance
criterion referred to as ―National cohesion and national values In addition the
weighting of individual performance criterion has been adjusted assigning higher and
uniform weighting of 50 on the ―operations criterion across the board from 25 for
ministries and 40 for public universities This change saw a reduction of the weighting
of the ―finance and stewardship and ―service delivery criteria This is significant
because it in essence downgrades the hitherto higher focus and emphasis on service
delivery These adjustments are indicated in the tables below
54
Table 22 Assignment of Weights over Study Period
Criterion Ministry Local
Authority
State Corporation
Tertiary
institution
Commercial Non-
commercial
Public
university
1 Finance amp
1stewardship
20 20 45 20 20 20
2 Non-financial 15 15 10 15 15 15
3 Service
delivery
25 25 - 20 10 25
4 Operations 25 25 30 25 40 25
5 Dynamic
qualitative
10 10 10 15 10 10
6 Corruption
eradication
5 5 5 5 5 5
Table 23 Assignment of Weights after Study Period
Criterion State corporation
(commercial)
All other agencies
1 Finance amp stewardship 35 10
2 Non-financial 10 15
3 Service delivery 15 10
4 Operations 25 50
5 DynamicQualitative 5 5
6 Corruption Eradication 5 5
7 National cohesion and national values 5 5
The adjustments may have been inevitable with the advent of the new constitution with
the additional criterion motivated by the rising polarization among Kenyan communities
Other post-study developments include the signing arrangements where HE the
President signs with the Cabinet Secretaries and Cabinet Secretaries sign with the Boards
of Directors of downstream agencies The case of Departments is a departure from
55
previous practice where Permanent Secretaries would sign with the Head of the Public
Service with the Prime Minister endorsing the contracts and the parent Permanent
Secretaries subsequently signed with Boards of downstream agencies This is the result of
the shift of executive power and functions from Permanent Secretaries to Cabinet
Secretaries as provided in the constitution
231 Reasons for Measuring Public Sector Performance
Neely (2007) explored the reasons for measuring public sector performance in the
provision of public services and identified five reasons These were to establish what
works in order to ensure that policy stands on a solid base informed by evidence (Bird et
al 2003) This therefore is done primarily on behalf of policy makers to identify
competencies which entails comparing performance with other providers other
institutions or some standard or norm in order to bring out good or bad performers The
focus is more on howlsquo people have performed and less on what they do (Bird et al
2003) This is done on behalf of government and policy makers who require data to
facilitate comparison to support public accountability in consideration that public
services are funded by tax payers who are hence entitled to know the manner in which
their taxes are being utilized (Bird et al 2003) To fulfill the need for central government
to exercise control over the services for which it is responsible and which are rolled out
using tax revenue (Hofstede 1981) This serves the interests of government and policy
staff who seek to retain central control of decentralized services and is done by
introducing performance targets against which progress and performance are measured
and symbolic action to enable the political class to engage in activity that reflects their
contract with the electorate (Neely 2007)
56
It is conceivable that performance measurement can be employed for more than one of
the five reasons so long as there is clarity of vision with reasons and objectives for
introducing and effecting the measurement Despite the observed benefits however
performance measurement can conceivably be prone to unintended side effects and
dysfunctional behavior particularly in the process of assessing the outputs and outcomes
of activities programs and projects Smith (1995) lists a number of dysfunctional
behavior types that emerge when quantitative performance indicators are introduced in
public service delivery and publicized These are tunnel vision - which sees managers
focusing only on the quantifiable elements and overlooking the multidimensionality of
public sector performance criteria sub-optimization- entailing concentration on the
narrower local objectives and ignoring the bigger picture that is encapsulated in corporate
objectives myopia- this is about short-termism the pursuit of short term targets in the
place of longer-term objectives
Measure fixationndash this is essentially emphasizing only on measures of success rather than
the underlying objectives and overlooking outcomes that may be difficult to measure
misrepresentation- a situation where data forming parts of indicators is distorted and
manipulated to create a desired impression with targeted audiences misinterpretationndash
this results from misunderstandings because of the complex and monolithic nature of
public agencies It may be brought about by capacity challenges or mix-ups owing to the
size of operations gamingndash this entails manipulation of behavior to secure desired
advantages for example setting soft targets to attain high scores and ossificationndash this is
about paralysis resulting from inflexibility in evaluation for example insistence on
retaining ambitious targets even when the operating environment and other
uncontrollable factors have changed
57
Measurement and evaluation of performance in Kenya focuses primarily on how
effectively and efficiently management have steered the affairs of an agency to deliver
agreed and defined value and is carried out by computing weighted and ultimately
composite scores using the formula
Managerial Performance = Institutional Performance plusmn Exogenous Factors
The overriding objective of performance contracting on the other hand is to ensure
achievement of results that lead in turn to achievement of overall goals while infusing
efficiency in the operational processes The system is fully grounded on performance
measurement and relies on the latter to enforce accountability at the individual and
corporate levels It is indeed performance measurement and the results thereof that
underwrite the utility of performance contracting For the purpose of this study therefore
performance contracting and measurement are denominated into performance
measurement which is the core essence of performance contracting
Khan and Shah (2011) give a detailed exposition of the evolution of performance
measurement According to them the origin of performance measurement can be traced
back to the late 13th
century in Venice when double-entry accounting was introduced to
settle transactions among traders (Johnson 1981) Onwards financial measures for the
most part were used to develop cost and management control systems (Kaplan 1983
Johnson amp Kaplan 1987 Keegan at al 1989) In late 1980s after globalization of trade
and the emergence of the world economy markets became competitive and customers
were more demanding the focus thus shifted from productivity to quality time cost
flexibility and customer satisfaction (Hayes amp Abernothy 1980 Slack 1983 Kaplan
1984) This was the time when researchers highlighted the deficiencies in the traditional
58
financial measures and criticized it to be inappropriate for measuring business
performance Johnson and Kaplan (1987) were among the first to suggest a shift from
cost accounting based performance measurement approach to a more integrated
performance measurement approach following criticisms advanced against the traditional
performance measures
The shortcomings in traditional measures resulted in a performance measurement crisis
which led to a revolution in the existing PMSs (Eccles 1991 Neely 1999) The
emergence of balanced performance measurement frameworks marked the start of the
second phase of performance measurement evolution The term ―balanced refers to
using measures that give a holistic view of the organization (Kaplan ampNorton 1996)
During this era the need to use non-financial measures for monitoring performance and
motivating employees was stressed (Santori amp Anderson 1987) and included the non-
financial measures for being timely measurable precise meaningful an aid to continual
improvement consistent with companylsquos goal and strategies and flexibility (Medori amp
Steeple 2000) Moreover researchers accentuated the importance of aligning financial
and non-financial measures with the organizationlsquos strategy (McNair amp Mosconi 1987)
Throughout the 1990s researchers were busy designing models and frameworks as a
result of which a number of frameworks were developed such as the BSC (Kaplan amp
Norton 1992) the PP (Neely et al 2002) SMART (Lynch amp Cross 1991) the RDF
(Fitzgerald et al 1991) the PMM (Keegan et al 1989) and the PMQ (Dixon et al
1990)
59
As Neely (2007) puts it the question that operations managers wanted their performance
measurement systems to help them answer was about operational efficiency Further a
significant stream of literature at the time was associated with the measurement of total
factor productivity Too often managers hitherto relied on partial measures of
productivity mainly labor productivity Several authors questioned the veracity of single-
dimensional measures of productivity on the grounds that they provided only a partial
picture of firm performance (Craig amp Harris 1973 Mundel 1987) In reality the
productivity a firm achieves is a function of how efficiently it uses all its inputs labor
capital technology and energy to produce outputs (Hayes amp Clark 1986)
According to Neely 2007 by late 1970lsquos the field of operations management under
which measurement of operations performance was carried out was in turmoil following
a crisis of confidence (Buffa 1980 Chase 1980) Throughout the 1960s and 1970s
operations research was effectively used in operations management Operations research
techniques such as linear programming and data envelopment analysis were applied to
pragmatic operations management problems such as lot sizing scheduling and production
control (Charnes et al 1978 Buffa 1980 Chase 1980 Banker et al 1984) Neely
(2007) states that the 1980s saw a rise in the popularity of the ―quality gurus most
notably Crosby Deming Feigenbaum and Juran
These developments resulted in a resurgence of interest in the measurement of operations
performance especially in terms of the five operations performance objectives of quality
dependability speed cost and flexibility originally proposed by Skinner (1969) The five
objectives essentially under-pin much of the work on performance measurement
undertaken subsequently by the operations management fraternity The notable
60
characteristics of these objectives are that they are all multidimensional and trade off with
one another the extent to which is time and context specific Quality for example is not
merely conformity to established specifications it should encompass other dimensions
such as performance (how well the product performs its primary functions) features
(what additional features the product contains) reliability (how long the product lasts
before becoming technically obsolete) serviceability (how easy the product is to service)
aesthetics (the look and feel of the product) perceived quality (the customerlsquos perception
of the productlsquos quality) and value for money (Garvin 1987 Schonberger 1990 Neely
amp Wilson 1992)
Speed on the other hand can refer to the time taken to generate quotations delivery
speed delivery frequency production speed and the time taken to develop new products
(Stalk 1988) Dependability can be extended to refer to schedule adherence (keeping to
plan) delivery performance (whether the product is delivered on time and in full) and
price performance indeed the general ability to live up to promises Flexibility can be
viewed in the context of both range and response flexibility (Slack 1983 1987) The
former is the ability to cope with a wide range of requirements while the latter is the
ability to change quickly There is a whole expansive range of other flexibility
dimensions (Gerwin 1987 Slack 1987) which include material quality (the ability to
cope with incoming materials of varying quality) output quality (the ability to produce
output of varying quality) new product flexibility (the ability to cope with the
introduction of new products) product modification (the ability to cope with the
introduction of new products) product modification (the ability to cope with modified
products) deliverability (the ability to cope with changed delivery schedules) volume
(the ability to cope with changed production volumes) and resource mix (the ability to
cope with different production mixes)
61
In the case of tradeoffs between the objectives high quality can for example be
delivered but potentially at a cost Tight delivery schedules can be met but perhaps only
by investing in additional resources Operations managers constantly strive to find ways
of pushing back the performance frontiers of these five performance objectives by
enhancing their operationlsquos capabilities so that the impact of the tradeoffs can be
mitigated over time The continuous search for enhanced operational capabilities under-
pins for example the manufacturing philosophy of kaizen the continuous improvement
of the operation in the search for new and better ways of delivering performance The
second point to note about the five operations performance objectives is that there are
internal as well as external reasons why organizations might wish to excel at them (Slack
1991)
Higher quality for example allows the organization to deliver potentially more valuable
products Higher quality however also means fewer mistakes hence less rework which
is costly to the operation if it has to be performed Speed means that the organization can
respond to customer requests more rapidly but also that the organizationlsquos capital is tied
up for shorter periods of time in the form of inventories and work in progress Similar
arguments can be made for each of each of the five operations performance objectives
Hence one of the key strategic challenges for operations managers is to decide on which
of the sub-dimensions of the five performance objectives they wish their operation to
excel in and how they can configure the operations to do so The focus on the five
performance objectives was largely fixated on the new perspectives on quality with
Feigenbaum (1961) suggesting that the true cost of quality is a function of three types of
quality cost prevention appraisal and failure costs Neely (2007) further states that with
the advent of Total Quality Management (TQM) emphasis shifted from ―conformance to
specification to customer satisfaction
62
In addition during the 1980s and 1990s period and riding on the work of Skinner on
manufacturing strategy (Skinner 1969) debates in practitionerslsquo and business
conferences in the United States and the United Kingdom highlighted how important it
was for the operations management community to consider how to align performance
measurement systems with operations strategies (Neely et al 1994) This is because as
Neely (2005) observes the bulk of work by the operations management community has
so far focused on performance measurement rather than performance management
despite the fact that measurement on its own delivers little value until the data generated
are analyzed and acted upon
The research and literature in the field of performance measurement has produced a body
of knowledge of best practices in the measurement of organizational activity focused on
what to measure (Danks 2013 Neely et al 2005) Others have advocated for the use of
both in-process and outcome measures or Key Performance Indicators (KPIs) strategic
and operational measures perceptual and tangible measures descriptive and predictive
measures and a balance among strategic workforce customer financial and internal
business indicators to evaluate performance (Bititci et al 1997 Harbour 2009 Kaplan
amp Norton 1996 Neely et al 2002 Poister 2003 Spitzer 2007)
The problem however still remains that very few users of this flurry of data truly
understand the antecedents of excellence the structures and conditions that precede
anticipate or predict excellence in performance (White 2005) Debate has raged about
measurement of such complex phenomena as organizational strategy Above
measurement of strategic initiatives and interventions that organizational leaders
63
commonly use to improve organizational excellence the question is about how
organizational leaders measure such highly complex constructs as organizational strategy
Buzachero et al (2013) categorize the work of strategic improvement into the buckets of
programs projects systems initiatives policies procedures events meetings processes
people and capabilities and tools and affirm that the terms can be used interchangeably
when it comes to how these efforts can be measured or evaluated to determine their
contribution to outcomes
Regardless of the terms used it is generally understood that each of these constructs
represents complex phenomena where multiple parts work together to contribute to the
results of the system making it difficult to partition out or isolate the components that
lead to desirable or undesirable outcomes In some cases measures of improvement
tactics may be operational in nature easier to quantify and report and therefore easier to
track than measures of organizational strategy (Phillips et al 2012) However Hubbard
(2010) reminds organizational leaders that while certain constructs may seem intangible
and not easily measured any construct organizational efforts included can indeed be
measured through specifically designed instrumentation
To develop and use an instrument to measure the ―intangible phenomenon Hubbard
(2010) recommends the following steps firstly decompose the uncertain construct until
certain observable behaviors are identified secondly classify each of the observable
things into a comprehensible framework that can be understood by intended stakeholders
thirdly test and calibrate the instrument to decrease error ensure consistency in its use
and affirm the validity of the causal model and lastly use sampling and other efficient
efforts to collect the appropriate amount of information needed to make critical decisions
64
By employing these critical steps the academic or practitioner can be equipped to assign
value to a complex phenomenon and therefore measure its critical components On the
other hand (McKenna et al 2011 Thorpe amp Beasley 2004) argue that performance
management research is too limited to positivist frames that investigate on a particular
tool or approach and perhaps vindicates the findings by Biron et al (2011) that
―hellipstrategically and tactically focused goals senior management involvement and robust
organizational communication were conditions that appear to support performance
management efforts
24 Performance Contracting and Other Public Sector Performance Measurement
and Improvement Systems
Many business enterprises and the public sector have adopted various systems in
attempts to organize and improve performance These include the traditional
(incremental) budgeting performance budgeting zero-based budgeting and management
by objectives (MBO) While these systems may have varying degrees of impact on
performance they are distinct from the PC but can significantly complement the
processes of performance management measurement and improvement
Among these only zero-based budgeting would be a formidable complement to the
system of PC to the extent of enabling efficient allocation of resources discarding
inefficient obsolete operations avoiding wasteful expenditure and compelling managers
to consider alternative methods of achieving objectives The MBO is perhaps the system
that comes closest to the PC because of its emphasis on greater efficiency through
systematic procedures greater employee motivation and commitment through participation
in the planning process and planning for results instead of planning just for work
65
241 Public Service Delivery
A research study commissioned by the Committee for Public Management Research to
serve the needs of the future development of the Irish public service and published in
1998 by the Institute of Public Administration defined public services as those services
which are mainly or completely funded by taxation Because of this fundamental
premise public services differ from commercial private-sector services in a number
of ways which in turn have important implications for the development of public
service delivery systems The differences are brought about by the distinctive objectives
and constraints of the public sector (Murray 1990)
Public services for one do not normally operate for financial profit or require immediate
payment for goods or services prior to delivery In addition public services are in many
cases not charged directly and in cases where they are charged for they are not usually
sold to customers at commercial prices set to produce profits (see Flynn 1990) As Flynn
(1990) observed certain of the public services established activities may be contracted
out operationally in some countries to private firms but the delivery of such services
continue to be funded from taxation and remain governed by public service criteria
Where private sector companies are contracted to public bodies for the provision of
services charges may be subsidized for social policy reasons
In addition to their primarily noncommercial character public services are often
distinguished by an absolute or at least comparative lack of competition in the normal
market sense of seeking to entice customers away from their competitors or rival service
providers As a result many of the basic features of the commercial marketplace are
66
absent from the delivery of public services Moreover given the regulatory role often
performed by public services such as tax collection law enforcement and provision of
security not only are public services invariably monopolistic or oligopolistic in character
but they can also be mandatory There are in addition different guiding principles for the
public service that pervade decision making management and provision These principles
are mainly equitable treatment and the allocation of resources according to need which
are often prerequisites to quality efficiency and cost effectiveness considerations
Efficiency and cost effectiveness are nonetheless key elements but unlike their
counterparts in the private sector public service customers rarely have the choice of an
alternative competitive supplier
Public and private bodies also differ significantly in their service relationships with
external customers (OShea 1992) Within the market oriented private sector the
relationship between service provider and customer is normally direct and comparatively
straightforward If the service on offer to the customer meets an actual or perceived need
at a competitive price it will normally be demanded and sold In such conditions
customer satisfaction should find expression through the level of sales as supply seeks to
meet that demand The comparative freedom of consumers to choose between competing
service providers to select on the basis of price andor quality as well as to express
satisfaction or dissatisfaction with the service provided means that customer needs are
paramount in services provided by the private sector With regard to the provision of
public services the provider customer relationship is often more complex and indirect
Payment is not normally made directly for the service received and so customer control is
weakened
67
Customer choice is very limited when provision is monopolistic From the providers
viewpoint ability to pay is often not a key determinant of demand and accordingly the
typical market disciplines of price control seen in private enterprise frequently do not
apply Indeed the providers ability to supply is likely to be determined by budgetary
funding outside its direct control The OECD (1996) observes that clients cannot have a
final say on the level and type of service unless they are paying the full cost In other
words the clients views and interests are not the only ones to be considered as the client
represents only one of several stakeholders There is a balance to be struck between the
views of clients and the views of the service provider andor the government on behalf of
more general interest groups such as taxpayers
Funding which comes directly or indirectly from the state is often fixed by annual
allocation through the Exchequer budgetary arrangements Consequently within the
public service mismatches in demand and supply can find expression in longer waiting
lists or the rationing of services The relationship between demand and provision in the
public services can also be perverse in private sector terms As Pollitt and Bouckaert
(1995) point out a fall in demand for a public service can actually be a relief because it
means less pressure more time for professional development research or leisure little or
no reduction on budget An increase in demand by contrast may be very unwelcome
because it means more pressure on staff and facilities but probably no increase in the
budget It is only in recent years that changes in budgeting practices have begun to lessen
these perverse incentives by relating budgets to workload or performance
68
Given such a perverse service provider relationship monopolistic public bodies can be
vulnerable to the development of a vicious circle of low standards in the demand for and
supply of their services The phenomenon of excess demand which leads to queues and
rationing decreases the motivation to improve quality in other ways too If one customer
dislikes the service and goes elsewhere (if they can) there is usually another one
waiting in the queue Large scale desertion may be unlikely because the public provider
occupies a monopolistic or oligopolistic position and there are invariably few if any
alternatives to turn to This restriction on behavior is of course likely to be felt most
acutely by low-income consumers Trapped in a monopolistic system which provides
them with essentials such as health care or education or social security benefits such
customers often form very low expectations for service quality They get used to low
standards as do the service providers (Pollitt amp Bouckaert 1995)
The primary attribute of public service delivery is quality of the service According to
Murray (1990) service quality is defined by such factors as courtesy consideration
information and speed OECD (1987) stressed the following types of characteristic with
regard to service quality timeliness volumeamount accessibilityconvenience
availability accuracy safety appropriateness or suitability as well as such qualitative
aspects as pleasantness and simplicity Equality and legality are acknowledged as priority
issues in service delivery together with the cost of the service referred to and its efficacy
Service quality initiatives reflect a general acceptance of the importance of responsive
and efficient government to economic and social progress within a general context of
budgetary constraints They are also consistent with an ongoing role for the public sector
and with defending and instilling confidence in the public sector (OECD 1996 20)
69
Based on its international experiences up to that time the OECD (1987) suggested that
the key components of responsive service delivery were transparency participation
satisfying user requirements and accessibility In revisiting these key elements nine years
later the OECD (1996) stresses their continuing validity but restates them as clients
participate in or are consulted about decisions on what level and type of service is to be
provided they are informed as to what level and type of services are to be provided and
they can reasonably expect to receive this level of service they have rights of complaint
and redress if the appropriate level of service is not provided and service delivery
agencies are required to set service quality targets and to report their performance against
them and openness and accountability on behalf of the service providers
A key attribute of public service delivery is user involvement The OECD (1996)
identifies five points on the potential spectrum of user involvement with service delivery
information consultation partnership delegation and control The Canadian public
service gives a checklist against which public servants can determine progress in quality
development These are that quality organizations must ask their clients to identify their
needs and expectations continuously meet the needs of their clients while managing their
expectations support active employee involvement in meeting these needs foster
employee innovation to improve processes continuously cultivate a people first
environment where teamwork is valued accept the risk associated with innovation
support a continuous learning environment and provide visible leadership for employees
which is crucial to the success of any quality services initiative
70
In addition the National Quality Institute highlights the following characteristics as
typical of quality service organizations in both the public and private sectors everyone
understands where the organization is heading and understands his or her part in the
process there is respect for people in the organization and all employees are encouraged
to develop their potential the primary focus is on serving clients cooperation and
teamwork are a way of life leaders are fully involved in the quality service programs and
initiatives everyone concentrates on achieving quality there is a focus on continuous
improvement employees appreciate and understand stakeholders expectations and know
how to satisfy them and the organization is driven by quality and innovation (Treasury
Board of Canada 1995)
In administering the movement from unresponsive public service bureaucracies to the
adoption of a clear user focus in the delivery of public services governments have
embraced a variety of approaches often involving the adoption of explicit statements of
standards in the form of service delivery charters The concept of the charter is fairly
universal For example the EU through its Citizens First initiative (1996 onwards)
committed itself to providing accessible information on EU citizens rights to work
live and study in another member state This initiative was later extended to embrace
gender equality consumer protection travelling within the EU as well as buying goods
and services in other member states Information was also provided on what citizens
would do in the event of infringement of these rights
In Portugal the Public Service Quality Charter (1992) was a deliberate attempt by
government to generate confidence in a system of public administration which enjoyed
little public support (CorteReal 1996) In France the Public Service Charter (1992)
71
draws together diverse initiatives to improve the quality of services provided by public
bodies over the preceding decade (Trosa 1995 Pochard 1996) It incorporated a number
of the important characteristics identified by the OECD (1996) namely improved
transparency and simplicity in service provision greater integration in point of delivery
better arrangements for reception of the public arrangements for handling complaints
and redress as well as less centralization of services In taking forward its Declaration of
Quality Services Principles (1994) the Canadian federal government acknowledged not
only its own corporate budgetary and other needs as well as the needs of its customers
but also that all employees contribute to the management and quality of their own outputs
and thus to the success of the organization In the USA President Clinton in 1995
directed every executive department and federal agency to publish customer service
standards in a form readily available to customers These standards cover all operations
that deliver significant services directly to the public including those delivered in
partnership with state and local governments Achievement against these standards is
monitored and results published annually Public bodies are encouraged to survey their
employees for ideas to improve customer service and to take measures to recognize
employees for meeting or exceeding service standards In addition agencies are required
to take action across agency lines of responsibility to serve shared customer groups more
effectively
The Australian government strongly advocated the widespread adoption of government
service charters in order to help shift public bodies from an internal to an external focus
and to open them up more effectively to customers This initiative was intended to cover
all government departments agencies and enterprises providing services to the public
72
with over 115 charters scheduled for completion by mid-1998 (Developing Service
Charters 1997) Perhaps the best known longest running and most frequently cited of
these initiatives is the Citizens Charter (1991) adopted in the UK It is the acknowledged
precursor of many of the initiatives taken in other countries
The citizenlsquos service delivery charter had its debut in Kenya in 2006 Its take off was
slow as has been the case in many countries owing mainly to resistance and skepticism
on the part of public servants In regard to such skepticism Bynoe (1996) concludes that
―Many dismiss the Citizens Charter as a poor attempt at public relations Yet as a policy
vehicle it touches subjects of widespread public concern which politicians ignore at their
peril Ways must be found to render public services more responsive to those who use
them Poor quality services need to be improved and waste eliminated In its fashion the
Charter program has attempted such tasks It has highlighted the need to improve the
standards of public service management and accountability It attempts to transform the
culture of the public service into one which acknowledges the vital importance of user
perceptions of service standards and delivery Any Government whose strategy is to
guarantee robust popular and effective public services must pursue these broad
objectives
There are of course alternative service delivery approaches to the charter One approach
that has been both an alternative and complementary to the charter is the one-stop-shop
One stop shops or citizens service centers are another service improvement tool
different from the various charters One of their specific purposes may be to provide
clients with particular information adapted to the different situations experienced by
73
them One stop shops are being tested and promoted mostly at a local level in
the United Kingdom the Netherlands the Nordic countries and Italy Experiences in
OECD Member countries suggest that a single point of contact for information improves
efficiency with simple referral tasks (Amberg 1996) In Kenya the one stop shop is a
public service delivery approach referred to as Huduma Center that enables citizens and
customers to access the most commonly demanded services under one roof through
integrated electronic service platforms The program aims at transforming public services
to be people-centered professional efficient transparent and accountable The one stop
shop platforms place emphasis on uniform and high customer service standards across all
government services provided under the program
The Huduma Kenya programme is one of Kenya Vision 2030 flagship projects that
integrate the delivery of all transactional and citizen facing public services through one
stop shop platforms The program has five ―one stop shop service delivery channels
including physical facilities where several transactional public services by different
MDAs are provided an online portal that enables customers to transact public services
electronically mobile phone platform that offers m-government services to citizens from
the convenience of their mobile phones a toll free contact center established to provide
services using a single dialling prefix that citizens use to enquire about services offered
by different Government Agencies and an integrated multi-channel payment gateway
that simplifies payment for government services through various platforms including the
Huduma Smart Service and Payment card There are currently 32 Huduma Centers each
offering over 44 different Public Services
74
What is clear is that improvement in the quality of public service delivery requires
deliberate engagement of the user The need to engage with the users of public services
holds true whether the strategy for reform is market driven or more oriented towards
empowerment For whatever reason by engaging with its external customers public
bodies are seeking to improve the efficiency effectiveness and hopefully the equity of
the services they deliver
Steele and Seargeant (1997) identify three main types of reasons for public service bodies
to engage with the public These are specific reasons which fall into four main groups the
exploration of needs the development of policies plans and strategies the setting of
priorities for services and the assessment of service performance Contextual reasons
which relate particularly to culture and attitudes and often derive from a belief in the
value of consultation or the desire to empower users and instrumental reasons which
may not be explicit but serve to undermine the success of consultation Such reasons
would include going through the motions by complying with requirements to consult or
using consultation to defer difficult decisions
242 The Public Service in Kenya
The Kenyan public service has evolved dramatically since independence in 1963 when
its staff establishment comprised 63000 employees According to a report prepared for
the Public Sector Reform and Development Secretariat (Office of the President) by a
DonorGovernment of Kenya Consultative meeting in 2005 the establishment in 1963
was overstretched leading to poor performance and low productivity The civil service
was further constrained by scarcity of management and entrepreneurial skills especially
among the indigenous people This figure however grew rapidly in subsequent years
rising to 158883 in 1980 and 271979 in 1990
75
A report published in December 2013 attributed to the Public Service Commission of
Kenya put the current public service establishment comprising the central government
Teachers Service Commission state corporations and local authorities at 655300 Until
2013 the public service was made up of 487 public agencies in the executive arm of the
government comprising 46 ministries and accounting departments 202 state
corporations 175 local authorities and 64 tertiary institutions Out of these 470 were on
PC This picture has changed radically with implementation of the constitution which
was promulgated in August 2010 The ministries were scaled down to 18 from 46 and
there have been extensive on-going reforms aimed at merging and reducing the number
of state corporations More significantly local authorities no longer exist their place
having been subsumed by county governments
Performance contracting was introduced in the public service in 2004 in a pilot group of
16 largely commercial public enterprises growing to 476 MDAs in 2012 comprising
ministries state corporations local authorities and tertiary institutions As a key
requirement under the performance contracting system all service oriented MDAs were
required to develop and implement citizenslsquo service delivery charters and to carry out
independent annual customer satisfaction surveys
243 Customer Satisfaction
Boulding et al (1993) Johnson and Furnell (1991) and Furnell et al (1996) view
customer satisfaction as an overall evaluation of a firmlsquos product or service rather than a
particular individuallsquos evaluation of a specific transaction Overall customer satisfaction
should be a more fundamental indicator of the firmlsquos performance due to its links to
behavioral and economic consequences beneficial to the firm (Anderson et al 1994) In
operations research and production it is common practice to argue that there is a positive
76
relationship between customer satisfaction and productivity Thus the firm that achieves
superior levels of customer satisfaction needs to devote fewer resources to handling
returns rework warranties and complaints management thus lowering costs and
improving productivity (Crosby 1979 Deming 1982 Juran1988) In the context of the
service industry Reichheld amp Sasser (1990) argued that reducing defects leads to greater
customer loyalty increased customer loyalty in turn leads to greater productivity via
lower costs of making future transactions favorable word of mouth and in many cases a
price premium
There is however an equally compelling logic to suggest that the pursuit of customer
satisfaction increases costs and thereby reduces productivity In economics for example
the relationship between productivity and customer satisfaction is viewed as positive
Customer satisfaction or utilitylsquo is modeled as a function of product or service attributes
Improving the level of utility by for example improving raw materials incorporating
additional features or adding service personnel requires increasing the level of product
attributes and therefore costs (Grilicher 1971 Lancaster 1979) Such efforts of
progressive increase in utility (customer satisfaction) ultimately also result in diminishing
returns
As mentioned earlier performance measurement is a key component of PMSs Countries
the world over have therefore conceived and applied measurement and evaluation
within the context of PMSs A common characteristic within these reforms is
PMSsResults Based Management (RBM) aimed at improving service delivery through
results-oriented performance management frameworks and creating a culture of focusing
on results rather than processes The key is in the delivery of measurable outputs and
providing a framework for using a strategic approach to planning and resource allocation
77
measuring outputs accountability monitoring and evaluation of performance The key
elements in these systems are the determination of expected outputs identification of
performance indicators and setting of targets monitoring and evaluation as well as
rewardingsanctioning of performance
25 Examples of Countries Implementing PMMIS
Ever since the setting up of public enterprises governments all over the world have been
groping to find ways of managing them effectively This effort has spawned over a large
number of varied instrumentalities (Trivedi 1990) The little that is available in
analytical literature regarding measurement and evaluation of performance in the public
sector traces measurement to the efforts of various countries in designing techniques to
rationalize government control of public enterprises in order to improve their
performance
The earliest organized effort began with the development of PCs in their diverse forms
mainly in France as seen earlier in this study This was commonly referred to as the
French contract system and was the product of the Nora Committee Report of 1967
which had been appointed to inquire into the functioning of the French public enterprises
with a view to suggesting measures for improvement of their performance The
appointment of the committee was informed by the need to resolve the confusion
resulting from excessive control of public enterprises by government and the
complacency and apathy on the part of the different parties involved towards their
efficient functioning
78
The report envisaged a system that would impart operational autonomy to management of
public enterprises and a realistic pricing policy in the context of well-defined contracts
which would list out the objectives to be fulfilled by public enterprises and the financial
assistance to be expected from the government Further countries such as Japan the
United Kingdom the United States of America all have well developed systems of
measuring and reporting government results in Japan the Government Policy Evaluation
Act (GPEA) has been active since 2002 in the UK the Public Service Agreements
(PSA) system has been operational since 1998 while the Government Performance and
Results Act in the US was promulgated in 1993 and became fully operational in 1997
(Talbot 2006) While most countries are still coping with the consequences of the 2008
global crisis the demand for public goodsservices post the crisis has only increased even
as the fiscal resources have dwindled The mechanism featuring performance
management measurement and improvement has been used effectively in a number of
countries
251 Indian Experience
The Memorandum of Understanding (MOU) was the Indian version of the signaling
contract system which derived performance criteria and targets from long-term
institutional plans and was applied selectively to the large and most important public
enterprises The system was primarily intended to increase autonomy of the managers of
public enterprises along with accountability The MOUs are one year performance
agreements which require explicit statement of public enterprise priorities by attaching
weights and specifying how to evaluate deviations from agreed targets Evaluation under
the MOU focuses on both quantitative and qualitative aspects They in addition provide
79
for an integrated performance measure referred to as the composite scorelsquo and recognize
the need for rewards based on actual performance The MOU was introduced in 1987 to
assist in improving the performance of public enterprises In 2009 the Results
Framework Document (RFD) was introduced as the MOU counterpart for managing
performance in government departments Conceived under the Indian government maxim
of ―minimum government and maximum governance the RFD was based on the
principle of what gets measured gets donelsquo Preparation of the RFD by each
ministrydepartment detailing priorities set out by the concerned departmentministry was
the starting point of Performance Measurement and Evaluation System The system
evaluates the performance of these ministries and departments based on the quantitative
targets set at the beginning of each financial year An important feature of the system is
the priority it has accorded to inter-ministerial linkages If the performance of a particular
departmentministry is affected by underbetter performance of a linked
departmentministry the linked departmentministry is also penalizedrewarded
According to the Second Administrative Reform Commission of India the performance
agreement has been the most common accountability mechanism adopted by countries to
improve quality transparency and effectiveness of their public governance At the core
the performance agreements are the objectives to be achieved the resources provided to
achieve them the accountability and control measures and the autonomy and flexibilities
that the civil servants will be given
252 South Korean Experience
South Korea is one of the few countries in the world with a system incepted in 1983 for
evaluating the performance of its public enterprises referred to as Government Invested
Enterprises (GIEs) (Trivedi 1990) In efforts to improve the performance of GIEs the
80
government of South Korea promulgated the Government-Invested Enterprise
Management Act (GIEMA) in December 1963 with the objective of facilitating
evaluation of the performance of GIEs increasing managerial autonomy and
accountability and engendering effective controls These were to be achieved through the
management by objectives system of budget preparation greater management control
over procurement budgeting and personnel policy a two-tier management organization
with the Board of Directors as the main decision-making organ and the enterprise
President as Chief Executive responsible for implementation the simplification and
unification of outside audits the elimination of business supervision by technical
ministries and an objective-oriented ex-post evaluation system and related incentive
system
South Korealsquos performance evaluation system is essentially an operations planning and
control system It involves specifying performance criteria for each public enterprise
setting criteria values defining gradations of performance around those criterion values
allocating weights to various criteria evaluating actual performance at the end of the year
and finally paying an incentive bonus based on results The system has been highly
successful
253 Public Service Agreements in the United Kingdom
The Public Service Agreements (PSA) system was introduced in the United Kingdom in
1998 It lists a set of performance targets set by the treasury against which each
government agency (only ministries in the UK case) must report The targets were
initially set for three years but have since been revised every two years The revision was
extended for three years and a new set of targets set in 2007 The PSAs outline the
81
objectives for the agency or department regarding the services to be delivered as agreed
between the department and the prime ministerlsquos delivery unit PSAs set out targets for
achieving the strategic objectives for a medium term frame of three years
254 Government Performance Results Act (GPRA) in the United States of America
Government performance management in the USA is grounded in law the Government
Performance Results Act (GPRA) The GPRA was signed into law in 1993 but became
operational in 1997 The GPRA established statutory requirements for federal
government agencies to set goals measure performance and submit related plans and
reports to the congress This law requires government agencies to produce performance
plans and reports for the annual appropriations cycle with the guidance of both the
presidency and the congress Further under this law the US President is obliged to sign a
performance agreement with cabinet members In 2010 the GPRA was modified
substantially and the modifications became law in January 2011 as the GPRA
Modernization Act of 2010 (GPRAMA) The GPRAMA set out to build on the GPRA
by among others establishing processes to intensify focus on goal setting and
performance measurement on cross-cutting policy areas using goals and measures during
policy implementation and assigning individual responsibility for the achievement of
goals and management tasks
The US government has since built considerably on these developments by directing
federal agency leaders to set specific agency goals reflecting administration priorities
Cabinet departments and large federal agencies are required to identify a few high
performance (priority) goals whose achievement is overseen by the Performance
82
Improvement Council working closely with the White House Office of Management and
Budget (OMB) The OMB uses the goals the agencies set in their strategic plans along
with the short term priority goals to align budget resources with priorities
According to the OMB the power of this type of goal focused performance management
system is that it uses performance measures to create a constructive dynamic that
motivates continual improvement not just compliance Implementation of performance
agreements policy in the United States had the highest-level political support Each
performance agreement was signed by the president and the cabinet secretary responsible
for respective department The structure of these documents contained an introduction
major objectives of the department measurement of performance administrative support
and terms of agreement
255 Performance Contracting in Kenya
The PC in Kenya is a performance agreement between the government and the
management of a public agency specifying targets to be achieved in addition to
requirements to develop charters to communicate and operationalize expected service
standards and incentives for achieving the targets The introduction of PCs in the
management of the public service was conceived in a 5-year national strategic plan the
Economic Recovery Strategy for Wealth and Employment Creation (2003 ndash 2007)
commonly referred to as the ERS as part of wider public sector reforms The ERS
recommended sweeping reforms in the management of the public service observing at
the outset that the public sector ―hellipis excessively large thereby absorbing inordinately
large amounts of national resources
83
The sector is characterised by wastefulness and inefficiency The ERS recognised
further that―hellipthe problems attributed to the many state corporations arise from the lack
of clear performance contracts that facilitate the monitoring of the performance of the
CEOs appointed to manage the corporations The Kenyan version of the PC
incorporated an elaborate measurement methodology that denominates achievement into
weighted and composite scores Under the measurement and evaluation system
achievement of the freely negotiatedlsquo performance targets was classified as excellentlsquo
for achievement of 30 percent above the agreed performance target very goodlsquo for
achievement between 100 percent and 130 percent of the performance target in the signed
PC goodlsquo for achievement between 70 percent and 100 percent of performance target in
the signed PC) fairlsquo for achievement between 50 percent and 70 percent of the target in
the signed PC) and poorlsquo for achievement between 0 percent and 50 percent of the
target in the signed PC The scoring scales are in turn denominated into raw and
composite scores with the criteria value ranges indicated in Table 24 below
Table 24 Performance Grading Scores
Performance
Grade
Criteria Value Range
Upper Lower
Range Span
Excellent From 100 To 240 140
Very Good Over 240 To 300 060
Good Over 300 To 360 060
Fair Over 360 To 400 040
Poor Over 400 To 500 100
(Source Performance contracting training modules Office of the Prime Minister Government of Kenya)
The methodology for calculating the raw score of any achievement is more like
measuring the distance which performance has ―traveled inside the entire span of 1 to 5
Calculation of the raw score is based on the actual achievement (Xa) as it relates to the
target (T) where
84
Xa = Actual achievement
Xu = 2T = Upper criteria value
XL = 0 = Lower Criteria Value
Span = 4 (500 -100)
The raw scores obtained using this methodology are subsequently aggregated to generate
the composite score
The criteria for performance excellence (Baldrige Performance Excellence Program
2013a12) challenges organizations to collect report and use performance measures in
the areas of products customers operations finances and the marketplace and the
workplace as a key means to make fact-based decisions leading to excellence at all levels
of the organization Migeon (2012) observes that results-oriented governments are
increasingly making use of hard data and statistical analysis to inform decisions and
proceeds to document two forms of evidence-based decision making in government one
of the goals of a government-wide transformation effort in France between 2009 and
2012 was to reduce the perceived complexity of dealing with the government As part of
this initiative the government identified 50 life events such as getting married or starting
a business during which citizens have to interact with public agencies It then sought to
simplify each of these interactions all the while measuring citizen satisfaction to track
whether the changes were actually working Similarly as part of a broader open
government initiative the city of Moscow began to publish a dashboard of around 50 key
85
performance indicators relating to the citylsquos health education safety business
conditions and transportation outcomes The dashboard acted as a scorecard for citizens
showing the citylsquos performance against these metrics
The UK governmentlsquos behavioral insights team was formed explicitly to use data about
citizen behavior to improve the effectiveness of government interventions The team sets
up randomized control trials long used in the medical field but only now gaining favor in
the public sector to test the impact of small changes like adjustments in the language and
tone of the letter that the tax department sends to delinquent taxpayers In its first two
years the team paid for itself 22 times over in savings It has identified interventions
expected to save the UK government at leastpound300 million over the next five years The
unit has since started to advise other governments on how to use data and randomized
control trials to improve government performance
26 Previous Related Studies
Four studies related to the current research study carried out in 1994 2006 2010 and
2012 were identified The studies set out to respectively investigate whether there are
conditions under which there are tradeoffs between customer satisfaction and firm
productivity examine the relationship between performance management and service
delivery in the department of water affairs and forestry in S Africa explore the
antecedents of satisfaction and loyalty for the freight shipping industry in Taiwan
investigate the linkages between customer service customer satisfaction and firm
performance in the US airline industry
86
The objectives of the studies were to respectively establish the links between customer
satisfaction and productivity establish the role of performance management as a pre-
condition for organizational performance and improved public service delivery establish
the effects of service quality and relational performance on customer satisfaction and
loyalty in a business-to-business context and investigate the linkages between customer
service customer satisfaction and firm performance in the US airline industry
The findings of the studies were that the association between changes in customer
satisfaction and changes in productivity was positive for goods but negative for services
While both customer satisfaction and productivity were positively associated with Return
on Investment (ROI) for goods and services the interaction between the two was positive
for goods but significantly less so for services this meant that simultaneous attempts to
increase both customer satisfaction and productivity were likely to be more challenging
in service oriented operations This implied further that services exhibit ―tradeoffs
while goods do not given that the increases (decreases) in customer satisfaction were
associated with decreases (increases) in productivity for services the conclusion drawn
by the researcher was that the introduction of performance management in DWAF had
not brought about the desired impact on service delivery
Analytical results showed that customer loyalty was influenced by the level of
satisfaction Additionally relational performance and service quality were significant
predictors of satisfaction relational performance was an antecedent of service quality and
satisfaction and its influence on satisfaction was greater than that of service quality and
that market concentration moderated the relationship between satisfaction and
87
profitability for US airlines Airlines that operated in concentrated markets had fewer
incentives to satisfy their customers than airlines that operated in more competitive
markets
Details of the studies including the researchers the methodologies and the gaps intended
to be filled are shown in Appendix XI
27 Conceptual Framework
The principal aim of the research study on performance contracting measurement and
public service delivery in Kenya was to explore the relationship between performance
measurement and improvement which are the core essential elements of performance
contracting and public service delivery in Kenya including the factors that affect and
influence the relationship The roadmap of this study entailed review of literature
documentation and use of secondary data from key public sector agencies that have long
records with performance measurement The study therefore sought to bridge a number
of gaps between theory and practice in performance measurement in the Kenyan context
The effects of political stability as a key factor in governance and global
competitiveness and how and the extent to which they influence performance and
ultimately service delivery were considered and analyzed in the study
Alesina Ozler Roubini and Swagel (1992) defined political stability as the propensity of
a government collapse either because of conflicts or rampant competition between
various political parties They proceeded to state that political stability is beneficial for
much of the economic progress that a country may achieve because investment and
growth highly depend on it recovery is faster under a stable political environment and
88
issues of employment human capital development and business development can be
dealt with much faster and effectively in an environment that does not suffer from risks
of change or even worse risk of conflict because of political instability
A report by the Centre for Public Policy Studies cites an IMF Working Paper of 2011
associated progressive decline in per capita GDP declining rates of productivity and
growth and physical and human capital accumulation to rising political instability
Further that political instability usually leads to sub-optimal macroeconomic policies and
a frequent switch between policies creating volatility and thus high levels of uncertainty
This position is supported by the findings by Alesina Ozler Roubini and Swagel (1992)
that in countries where there are high levels of political instability the economic growth
is reported at very low levels and that the two phenomena are in fact interconnected and
affect each other
High volatility in the government establishment may lead to lower growth but also a
poor indicator of growth may lead to higher political instability Uncertainty in the
governmentlsquos stability and therefore the continuation of current or similar policies may
affect investment At the same time low investment levels and low economic growth
may see higher political instability as the electorate loses faith in a standing government
and might opt to elect some other party with the hope that economic growth will benefit
from a change in government
The report by the Centre for Public Policy Studies concludes that if a country has a stable
government and thus does not need to worry about conflicts and radical changes of
regimes the people can concentrate on achieving more in their lives in terms of career
89
or otherwise Political stability gives a peaceful stable environment that is necessary for
any progress in other areas of life ndashscience economic developmental and philanthropic
progress and in general sees more progress than a period that a country is under an
unstable political situation for the simple reason that in a stable peaceful environment
people have the time and luxury of being able to deal with issues other than basic survival
needs
The variables conventionally associated with political stability include economic and
democratic freedom the predictability of the electoral environment (political certainty)
ideological homogeneity of political parties and establishments ethnic homogeneity and
general absence of violence and terrorism This variable relates essentially to the quality
of governance The political stability indices used in this study were extracted from the
World Bank Report on Worldwide Governance Indicators on Political Stability and
Absence of ViolenceTerrorism The indices reflect perceptions of the likelihood that the
government will be destabilized or overthrown by unconstitutional or violent means
including politically motivated violence or terrorism
The Worldwide Governance Indicators (WGI) is a research dataset summarizing the
views on the quality of governance provided by a large number of enterprise citizen and
expert survey respondents in industrialized and developing countries These data are
gathered from a number of survey institutes think tanks non-governmental
organizations international organizations and private sector firms The estimates of
governance range from approximately -25 (weak) to 25 (strong) governance
performance The Worldwide Governance Indicators which inform political stability
90
have been compiled for 215 developed and developing countries covering the years 1996
through to 2012 The indices that relate to this study are in respect of the years 2006 to
2011 in respect to political stability in Kenya and are shown in Table 25 in comparison
to the best and worst countries
Table 25 Political Stability Country Comparisons
Year Political Stability (WGI)
Finland (best) Kenya Somalia (worst)
2006 150 -112 -278
2007 150 -127 -324
2008 145 -138 -331
2009 145 -143 -332
2010 139 -117 -311
2011 137 -124 -307 Source World Bank Report Political Stability and Absence of Violence Worldwide Governance
Indicators (WGI)
Data on global competitiveness is compiled by the World Economic Forum (WEF) of the
World Bank The World Economic Forum in its Global Competitiveness Report defines
competitiveness in the context of a grouping of factors that drive productivity and
competitiveness These include institutions infrastructure the macro economy health
and primary education higher education and training market efficiency technological
readiness business sophistication and innovation The level of productivity in turn sets
the level of prosperity that can be reached by an economy
The productivity level also determines the rates of return obtained by investments in an
economy which in turn are the fundamental drivers of its growth rates In other words a
more competitive economy is one that is likely to grow faster over time The concept of
competitiveness thus involves static and dynamic components Although the productivity
91
of a country determines its ability to sustain a high level of income it is also one of the
central determinants of its return on investment which is one of the key factors
explaining an economylsquos growth potential The index organizes the pillars into three sub-
indexes efficiency enhancers innovation and sophistication factors and is based on a 1-7
scale (the higher the average score the higher the degree of competitiveness)
The Global Competitiveness Indices for Kenya for the years 200607 200708 200809
200910 and 201011 were respectively 357 361 384 367 and 365 The
relationships that formed the basis of the study are shown in the conceptual framework
depicted in Figure 23
Figure 23 Conceptual Framework
Independent
Variables
Performance contracting
and measurement
Dependent
variable
H3
Intervening
variable
Moderating Variable Global
competitiveness
H4
Service delivery
Growth in customer
satisfaction
H2
Political stability
H1
92
28 Hypotheses
The study sought to establish the relationship between performance contracting and
measurement and public service delivery in Kenya as well as the intervening and
moderating effects of respectively political stability and global competitiveness on this
relationship From the literature review and on the basis of the relationships depicted in
the conceptual framework above the following hypotheses were formulated for testing
H1 There is no significant relationship between performance contracting and
measurement and public service delivery in Kenya
H2 There is no significant intervening effect of political stability on the relationship
between performance contracting and measurement and public service delivery in
Kenya
H3There is no significant moderating effect of global competitiveness on the relationship
between performance contracting and measurement and public service delivery in
Kenya
H4 There is no significant joint effect of political stability and global competitiveness on
the relationship between performance contracting and measurement and public
service delivery in Kenya
29 Chapter Summary
The chapter has summarized both theories anchoring this study and empirical literature
The chapter has the discussed and synthesized the theoretical underpinnings and pairwise
reviews of the study variables It has clearly highlighted the various contributions by the
underpinning theories A summary of selected empirical studies is presented and clearly
highlight their focus of study findings and conclusions The important aspects of this
chapter are propositions emerging from the theoretical and empirical gaps It also
presents a conceptual model in a diagrammatic relationship with variables of the study
with resultant hypotheses
93
CHAPTER THREE
RESEARCH METHODOLOGY
31 Introduction
This chapter describes the steps the study employed to create a relationship between the
research objectives and the research questions and therefore demonstrates and guides on
how the research was conducted It includes the research design the research philosophy
the target population of the study and how the data was collected the analysis procedures
and techniques and concludes with a summary of the key indicators used to measure the
study variables and the analytical model
32 Research Philosophy
The study was based on quantitative research entailing the collection and observation of
existing numerical data on the performance of public agencies and public service delivery
in Kenya over a period of six years and using statistical analysis to draw conclusions
regarding the relationship between the variables that were being investigated The study
used secondary data on performance denominated into composite scores generated
through independent performance measurement and evaluation and customer satisfaction
indices obtained through independent annual customer satisfaction surveys The
objectivity of already existing data underpins the objectivity associated with the positivist
research philosophy enunciated by Cooper and Schindler (2006)
According to Dash (1993) research is essentially concerned with exploring and
understanding social phenomena which are educational in nature mainly pertaining to
formalized andor spontaneously occurring social cultural psychological processes
94
Further that since theoretical questions in education emerge from different conceptions
and interpretations of social reality different paradigms have been evolved to determine
the criteria according to which one would select and define problems for inquiry (Dash
1993)
The positivist approach can be traced to the French philosopher August Comte who
emphasized observation and reason as a means of understanding human behavior
According to him true knowledge is based on experience of senses and can be obtained
by observation and experiment Thus the positivistic paradigm systematizes the
knowledge generation process with the help of quantification which is essentially to
enhance precision in the description of parameters and the discernment of the relationship
among them The anti-positivist paradigm on the other hand emphasizes that social
reality should be viewed and interpreted by the individual according to the ideological
positions they hold Therefore knowledge is personally experienced rather than acquired
or imposed from outside According to Cohen et al (2000) the anti-positivists emphasize
that the verification of a phenomenon is adopted when the level of understanding of a
phenomenon is such that the concern is to probe into the various unexplored dimensions
of a phenomenon rather than establishing specific relationship among the components as
it happens in the case of positivism
In brief the two paradigms are concerned with two concepts of disparate social reality
While positivism stands for objectivity measurability predictability controllability and
constructs laws and rules of human behavior non-positivism essentially emphasizes
understanding and interpretation of phenomena and making meaning out of this process
95
suggesting qualitative rather than quantitative approach to social inquiry The current
study is premised on measurement of observed phenomena and making predictions based
on objective evidence based data and is therefore positivistic in orientation
33 Research Design
Research design is the detailed outline or strategy selected to integrate the different
components of the study to effectively address the research problem It typically includes
the methods employed to collect data and measurement and analysis of the data and the
instruments used to analyze the data According to DeVaus (2001) and Trochim (2006) it
constitutes the blueprint for the collection measurement and analysis of data In social
sciences research obtaining information relevant to the research problem generally
entails specifying the type of evidence needed to test a theory to evaluate a program or
to accurately describe and assess meaning related to an observable phenomenon The
function of a research design is to ensure that the evidence obtained enables logical and
unambiguous consideration of the research problem In social sciences research
obtaining information relevant to the research problem generally entails specifying the
type of evidence needed to test a theory to evaluate a program or to accurately describe
and assess a meaning related to an observable phenomenon
This study employed a cross-sectional design whereby the data is collected from a large
number of public institutions controlled and funded largely by the government but which
results of performance and service delivery differ The data used for the study was
already available for the period of six years and not subject to intervention or
manipulation by the researcher The statistical analysis employed was for the purpose of
96
drawing inferences about possible relationships but not to establish cause and effect
relationships The research in addition considered a number of variables including
performance (the product of measurement) customer satisfaction indices political
stability and global competitiveness The research problem was identified and its
selection justified previous published literature reviewed and synthesized hypotheses
relating to the research questions specified and the data necessary for adequate testing of
the hypotheses described in addition to explanation of how the data was obtained The
methods of analysis to be applied to the data in determining whether or not the
hypotheses are true or false were also described Unlike in experimental design where
there is an active intervention by the researcher to produce and measure change or to
create differences cross-sectional designs focus on studying and drawing inferences from
existing differences between subjects or phenomena This type of design may not
demonstrate cause and effect but may provide a snapshot of correlations existing at
particular points in time and may give clues to guide further research
34 Population and Data Collection
The new Constitution that was promulgated in August 2010 significantly altered the
landscape of the structure and profile of government agencies Requirements in the
Constitution precipitated wide ranging restructuring of the mainstream civil service
resulting in the merger of ministerial functions thereby reducing the number of ministries
and accounting departments from 46 to 18 and virtual abolition of local authorities The
data available for the study therefore was in regard only to agencies in the old pre-
constitution structure The study was a cross-sectional one and relied on secondary data
97
that was already available The political stability indices were extracted from the World
Bank Report on Worldwide Governance Indicators on Political Stability and Absence of
ViolenceTerrorism while the data on global competitiveness was obtained from the
2013 World Economic Forum (WEF) report of the World Bank
In 201011 which was the terminal year for data collection and analysis in this paper the
number of MDAs on performance contract was 470 made up of 46 ministries and
accounting departments 178 state corporations 175 local authorities and 71 tertiary
institutions The distribution is shown in Table 33 The focus of the study was the entire
population of 470 MDAs Further the various categories of MDAs had by 201011 been
on performance contract for differing periods these are 6 years for both ministries and
state corporations 5 years for local authorities and 4 years for tertiary institutions The
data used for the study was in respect to the five years of 200607 200708 200809
200910 and 201011 during which period customer satisfaction in the majority of the
above categories of public agencies was measured The distribution of the various
categories of institutions is shown in Table 31
Table 31 Distribution of MDAs in 2011
Category of MDA No Percent
Ministries and Accounting Departments 46 979
State Corporations 178 3787
Local Authorities 175 3723
Tertiary Institutions 71 1511
Total 470 10000
Source Organization of Government Office of the President
98
The performance evaluation methodology in Kenya grades excellence on a composite ndash
scoring scale ranging from 1 to 5 with 1 denoting the upper limit of excellentlsquo
achievement and 5 representing the lowest limit of poor achievement Charts and graphs
constructed directly on performance gradings drawn from this type of scale would
therefore have a visual depiction of declining achievements for top achievers and a rising
trend for poor achievers To mitigate this problem the composite scores were inverted in
order to give a rising visual effect to positive achievement and a declining visual effect to
poor achievement Further the composite scores in each of the four categories of MDAs
were averaged for each year to contain the data within manageable parameters
35 Data Analysis
The data from the agencies was organized summarized and collated in a manner that
linked with the research questions and subsequently analyzed using both descriptive
statistics (mean and measures of dispersion) and inferential statistics (correlation
analysis of variance and regression analysis) Descriptive analysis was conducted to bring
out the main characteristics of the sample To test the hypotheses correlation and
regression analyses were carried out to establish the expected relationships between
performance contracting and measurement and public service delivery in Kenya and the
intervening and moderating effects of respectively political stability and global
competitiveness on this relationship The regression analyses provided estimate
equations to predict the magnitude of the dependent variable (customer satisfaction) and
provide values for the predictor variables
99
In addition t-test and p-values were used to determine individual significance of the
results of the analysis Assessment of the overall robustness and significance of the
regression models was done using the F-test and p-values Pearson correlation
coefficient R2 beta coefficients and p values were computed If p-value was less or
equal to 005 (p-value le 005) the hypothesis was rejected otherwise it failed to be
rejected Additionally for each hypothesis a model equation of the variables relationship
was computed showing the magnitude and relationships of the independent variable(s)
and dependent variable
In order to establish the intervening and moderating effects on the relationship between
performance contracting and measurement (Independent Variable) X1-p and service
delivery (Dependent Variable) Y in public agencies the following model was used
Service Delivery (Y) = 0+ 1X1 + 2X2 + 3X3 + 4X4 hellip+ pXp + i
Where
Y is the dependent variable (Customer Satisfaction) and is a linear function of X1 X2 X3
X4hellipXi plus i
0 is the regression constant or intercept
1-p are the regression coefficients or change induced in Y by each X
i is the error term
X1-p are independent variables (performance contracting and measurement political
stability and global competitiveness)In order to compare the performance of different
categories of public agencies an analysis of variances was carried out The analytical
model is depicted in the Table 32 below
100
Table 32 Summary of Analytical Model
Objective Hypothesis Type of
Data
Analytical Model
1 To determine the
relationship between
performance contracting and
measurement and public
service delivery in Kenya
H1 - There is no
significant relationship
between performance
contracting and
measurement and
public service delivery
in Kenya
Secondary
Linear Regression
Y = o + 1X1 +
where
Y = Customer
Satisfaction
o= Constant
1= Regression Constant
X1= Performance
Improvement
2 To establish the intervening
effect of political stability
on the relationship between
performance contracting and
measurement and public
service delivery in Kenya
H2 - There is no
intervening effect of
political stability on the
relationship between
performance contracting
and measurement and
public service delivery
in Kenya
Secondary
Multiple Regression
Y = o + 1X1 + 2X2 +
where
Y = Customer
Satisfaction
o= Constant
1 B2 = Regression
Constants
X1= Performance
Improvement
X2 = Political Stability
3 To establish the moderating
effect of global
competitiveness on the
relationship between
performance contracting and
measurement and public
service delivery in Kenya
H3There is no
moderating effect of
global competitiveness
on the relationship
between performance
contracting and
measurement and
public service delivery
in Kenya
Secondary Multiple Regression
Y = o + 1X1 + 3X3 +
where
Y = Customer
Satisfaction
o= Constant
1 3 = Regression
Constants
X1 = Performance
Improvement
X3 = Global
Competitiveness
4 To establish the joint effect
of political stability as well
as global competitiveness
on the relationship between
performance contracting and
measurement and public
service delivery in Kenya
H4-There is no joint
effect of political
instability as well as
global competitiveness
on the relationship
between performance
contracting and
measurement and
public service delivery
in Kenya
Secondary
Multiple Regression
Y = o + 1X1 + 2X2 +
3X3 + where
Y = Customer
Satisfaction
o= Constant
1 2 3 = Regression
Constants
X1 = Performance
Improvement
X2 = Political Stability
X3 = Global
Competitiveness
101
36 Chapter Summary
This chapter has presents the research methodology of the study It comprises the
philosophical orientation that will be employed in the study The choice of the positivism
approach (objective) that will guide this study and its justification is presented The
chapter then discusses and justifies the research design to be used describes the
population of the study the data collection method the instrument and the nature of the
respondents Data analysis techniques and the analytical models that will be applied in
the study are presented and supported with relevant evidence
102
CHAPTER FOUR
DATA ANALYSIS AND DISCUSSION OF FINDINGS
41 Introduction
The study sought to establish the relationship between performance contracting and
measurement and public service delivery in Kenya To achieve this objective four
specific objectives and their corresponding hypotheses were formulated A number of
inferential statistical operations were performed to test the hypotheses Performance
contracting and measurement were designed to improve institutional and managerial
performance measured using composite scores and to consequently improve public
service delivery Public service delivery on the other hand is expected to be the outcome
of improvement in performance measured through customer satisfaction indices obtained
through annual customer satisfaction surveys over the period under consideration To test
the hypotheses correlation and regression analyses were carried out to establish the
expected relationships between performance contracting and measurement and public
service delivery in Kenya and the intervening and moderating effects of respectively
political stability and global competitiveness on this relationship In addition t-test and
p-values were used to determine individual significance of the results of the analysis
Assessment of the overall robustness and significance of the regression models was done
using the F-test and p-values
42 Pretesting for Multiple Regression Assumptions
Usually there are assumptions that are made about variables during statistical tests One
of the main assumptions is that data follows a normal distribution Statistical procedures
used in analyses may however have some errors and therefore need to be tested This is to
103
ensure that the findings are worth using in decision making Testing for assumptions is
beneficial because it ensures that analysis meets associated assumptions and helps avoid
89 Type I and Type II errors (Osborne et al 2001) This study therefore carried out test of
normality linearity Homogeneity of variances and Multicollinearity tests
421 Tests of Normality
Normality tests are used to establish if a data set is well-modeled by a normal
distribution compute the likelihood of a random variable underlying the data set to be
normally distributed and to justify the use of the mean as the measure of central tendency
(Zikmund 2010) They are therefore measures of goodness of fit of a normal model to
the data if the fit is poor then the data are not well modeled in that respect by a normal
distribution Tests of normality are important because the bulk of the statistical analysis
such as regression correlation and t-tests are premised on the presumption of normal
distribution of data (Ghasemi amp Zahediasl 2012) The studylsquos variables were found to be
in conformity with the test of normality implying that there was no skewedness using a
normal Q-Q plot shown in Figure 41 The Q-Q plot established that the data used for the
study were fairly normally distributed and statistically significant as relates to customer
satisfaction political stability and global competitiveness
104
Figure 41 Normal Q-Q Plot
Source Field Data (2015)
The linearity of the points in the above Q-Q plot suggests that the data were normally
distributed
422 Tests of Linearity
Tests of linearity are carried out to establish that the data used for analysis was sampled
from a population that relates the variables of interest in a linear fashion
A linearity test was conducted to establish the linear relationship between the variables
used in the study The findings were that political stability and global competitiveness did
not show close linearity whereas performance measurement and customer satisfaction
exhibited a closer linear relationship These are shown in Figures 42 43 and 44
105
Figure 42 Performance Measurement and Customer Satisfaction
Source Field Data (2015)
Figure 43 Political Stability and Customer Satisfaction
Source Field Data (2015)
106
Figure 44 Political Stability and Customer Satisfaction
Source Field Data (2015)
423 Test of Homogeneity of Variances
A test of homogeneity of variances was carried out to establish the significance of the
variance of the variables used in the study The test indicated that the variances of the
variables are not necessarily statistically significant This is shown in Table 41
Table 41 Test of Homogeneity of Variances
Variable Levene Statistic Sig
Performance Measurement 2146 152
Customer Satisfaction 1345 310
Political Instability 2064 154
Global Competitiveness 1382 427
Source Field Data (2015)
107
424 Multicolinearity Test
Multicollinearity tests are carried out primarily to avoid the problem of multiple
counting brought about when a researcher uses the same type of information more than
once with different variables which is common in technical analysis A multicolinearity
test was also carried out and the findings indicated that political stability and global
competitiveness have identical tolerance and identical variance inflation factor (VIF)
values regarding the multicolinearity There was therefore no multicolinearity amid these
indicators This is shown in Table 42
Table 42 Multicolinearity Coefficientsa
Model Collinearity Statistics
Tolerance VIF
1 Global Competitiveness 781 1280
Political Instability 781 1280
a Dependent Variable Customer Satisfaction
Coefficientsa
Model Collinearity Statistics
Tolerance VIF
1 Political Instability 982 1018
Customer Satisfaction 982 1018
a Dependent Variable Global Competitiveness
Source Field Data (2015)
43 Descriptive Analysis of the Study Variables
The analysis was carried out using the Statistical Package for Social Sciences (SPSS)
version 21 and both descriptive and inferential statistics Descriptive statistics was carried
out to summarize the data and to bring out variability and dispersion using the mean the
standard deviation and the coefficient of variation Standard deviation shows how far the
distribution is from the mean A small standard error implies that most of the sample
means will be near the center population means thus the sample mean has a good chance
of being close to the population mean and a good estimator of the population mean On
the other hand a large standard error illustrates that the given sample mean will be a poor
estimator of the population mean (Harvill 1991)
108
Correlation coefficients were computed to establish the relationship between the study
variables and the extent to which the dependent variable could be predicted from the
independent variable and to derive the regression equation Linear regression analysis
was used to examine the models overall and individual statistical significance by using F-
value and t-value respectively In both cases if the p-value was less than or equal to
005 the hypothesis was rejected otherwise the hypothesis failed to be rejected if the p-
value was greater than 005 A model equation was derived for each hypothesis using
variables that were significant
Table 43 Shows the Descriptive Statistics of the Study Variables
Variable T-value Sig (2-tailed) Mean Std Deviation CV ()
Performance Measurement 37720 000 265439 27255 1027
Customer Satisfaction 8699 000 027779 12368 4452
Global Competitiveness 157181 000 369800 09112 246
Political Stability -47656 000 -131533 10690 -813
Source Field Data (2015)
As the table indicates the public sector in Kenya had an average customer satisfaction
index of 027779 implying that nearly 73 percent of customers were dissatisfied with the
public sector service delivery Performance measurement had the highest variability (SD
= 027255) across the public sector made up of ministries state corporations local
authorities and tertiary institutions Political stability was found to be weak with a mean
of -131533 on a scale of -25 (very weak) and 25 (very strong) Global competitiveness
on the other hand was found to be an average of 3698 on a scale of 1 (very low) and 7
(very competitive)
109
The coefficient of variation was computed to show the variability in the data of the study
parameters Customer satisfaction shows the greatest variability followed by
performance measurement The global competitiveness shows the least variability and
political stability has fairly negative variability
Table 44 Correlation Analysis of the Study Variables
Performance
Measurement
Customer
Satisfaction
Global
Competitiveness
Political
Stability
Performance
Measurement
Pearson Correlation 1
Sig (2-tailed)
Customer
Satisfaction
Pearson Correlation 858
1
Sig (2-tailed) 000
Global
Competitiveness
Pearson Correlation 086 159 1
Sig (2-tailed) 760 571
Political Stability Pearson Correlation 099 -134 -468 1
Sig (2-tailed) 724 633 079
Correlation is significant at the 001 level (2-tailed)
Source Field Data (2015)
The correlation analysis of the study variables (Table 44) indicates that all the four
studylsquos variables were related but not perfectly Performance measurement was highly
correlated with customer satisfaction (R = 0858) and the relationship was significant at
99 percent confidence level This high relationship indicating that performance
improvement (the product of performance measurement) and customer satisfaction share
08582or about 736 per cent of their variation brings out the importance of having a
performance measurement system to establish performance levels and to monitor how
customers are served in the public sector Global competitiveness was found to be
negatively related with political stability (R = -0468) and the relationship was not
significant This indicates that social-political chaos and turmoil may not have a
significant impact on the attractiveness of a country in the global arena
110
44 Performance Measurement and Customer Satisfaction
The first objective of the study was to establish the relationship between performance
contracting and measurement and customer satisfaction in the services delivered by
Kenyalsquos public sector Hypothesis one was formulated as
H1 There is no significant relationship between performance contracting and
measurement and public service delivery in Kenya
The results of the analysis carried out to establish the relationship between performance
measurement and customer satisfaction are shown in Table 45 The results show that
performance measurement had a strong positive relationship (R = 0858) with customer
satisfaction Performance measurement explained 736 percent (R2 = 0736) of customer
satisfaction levels with the remaining 264 percent accounted for by other factors The F-
value for the model was 36176 and the derived p-value was 0000 Since the derived p-
value of 0000 was less than 005 with a table value of 2145 as compared to a calculated
value of 6015 the hypothesis was rejected hence performance measurement had a
significant relationship with customer satisfaction The performance measurement
variable had a t-value of 6015 and was significant
111
Table 45 Relationship between Performance Measurement and Customer
Satisfaction
Model Summary
Model R R Square Adjusted R
Square
Std Error of the Estimate
1 858a 736 715 06599
a Predictors (Constant) Performance Measurement
ANOVAa
Model Sum of
Squares
Df Mean Square F Sig
1
Regression 158 1 158 36176 000b
Residual 057 13 004
Total 214 14
a Dependent Variable Customer Satisfaction
b Predictors (Constant) Performance Measurement
Model Unstandardized
Coefficients
Standardized
Coefficients
T Sig
B Std Error Beta
1
(Constant) -755 173 -4376 001
Performance
Measurement 389 065 858 6015 000
a Dependent Variable Customer Satisfaction
Coefficientsa
Source Field Data (2015)
A model equation of the relationship is described in equation 41
Customer satisfaction = - 0775 + 0389 Performance Improvement hellipEquation 41
This shows that a unit change in performance improvement impelled by performance
measurement will result in customer satisfaction changing by a factor of 0389 In the
absence of performance improvement a constant customer satisfaction of negative 0775
would be realized
Additional analyses were carried out to establish the effect of both political stability and
global competitiveness on customer satisfaction in Kenyalsquos public sector The results of
the analyses are shown in Tables 46 and 47
112
Table 46 Relationship between Political Stability and Customer Satisfaction
Model Summary
Model R R Square Adjusted R
Square
Std Error of the Estimate
1 134a 018 057 12718
a Predictors (Constant) Political Stability
ANOVAa
Model Sum of
Squares
Df Mean
Square
F Sig
1
Regression 004 1 004 239 633b
Residual 210 13 016
Total 214 14
a Dependent Variable Customer Satisfaction
b Predictors (Constant) Political Stability
Coefficientsa
Model Unstandardized
Coefficients
Standardized Coefficients T Sig
B Std
Error
Beta
1 (Constant) 073 420 175 864
Political Stability -155 318 -134 -489 633
a Dependent Variable Customer Satisfaction
The results in Table 46 show that political stability had a weak positive relationship with
customer satisfaction This finding is supported by the fact that the mean political
stability index was very low at -131533 Political stability explained 18 percent (R2 =
0018) of customer satisfaction levels with the remaining 982 percent accounted for by
other factors implemented in the public sector The F-value for the model was 0239 and
the derived p-value was 0633 Since the derived p-value was greater than 005 the
indication was that political stability had no significant relationship with customer
satisfaction The relationship between global competitiveness and customer satisfaction
in Kenyalsquos public sector is shown in the Table 47
113
Table 47 Relationship between Global Competitiveness and Customer Satisfaction
Model Summary
Model R R Square Adjusted R Square Std Error of
the Estimate
1 159a 025 -050 12671
a Predictors (Constant) Global Competitiveness
ANOVAa
Model Sum of
Squares
Df Mean Square F Sig
1
Regression 005 1 005 338 571b
Residual 209 13 016
Total 214 14
a Dependent Variable Customer Satisfaction
b Predictors (Constant) Global Competitiveness
Coefficientsa
Model Unstandardized
Coefficients
Standardized
Coefficients
T Sig
B Std Error Beta
1 (Constant) -522 1375 -379 711
Global Competitiveness 216 372 159 582 571
a Dependent Variable Customer Satisfaction
Source Field Data (2015)
Table 47 shows the results of the analysis done to establish the effect of global
competitiveness on the customer satisfaction levels The results show that global
competitiveness had a weak positive relationship with customer satisfaction This finding
is supported by the fact that the mean global competitiveness index was neither strong
nor weak at 3698 Global competitiveness explained 25 percent (R2 = 0025) of
customer satisfaction levels with the remaining 975 percent accounted for by other
factors implemented in the public sector The F-value for the model was 0338 and the
derived p-value was 0571 Since the derived p-value was greater than 005 the
indication was that global competitiveness had no significant relationship with customer
satisfaction
114
45 Intervening Effect of Political Stability on the Relationship between
Performance Measurement (Improvement) and Customer Satisfaction
The second objective of the study was to establish the intervening effect of political
stability on the relationship between performance contracting and measurement and
customer satisfaction in the services delivered by Kenyalsquos public sector Hypothesis two
was formulated as
H2 There is no significant intervening effect of political stability on the relationship
between performance contracting and measurement and public service delivery in Kenya
The results of the analysis conducted to establish the intervening effect of political
stability on the relationship between performance measurement and customer satisfaction
are shown in Table 48 The results show that political stability explained an additional
49 percent (Δ R2 = 0049) on the direct effect of performance measurement on customer
satisfaction The change in the F-value caused by the intervening effect was 2712 and
was not significant since the derived p-value of 0126 was greater than 005 The F-value
for the intervening model was 21825 and the derived p-value was 0000 Since the
derived p-value was less than 005 with table value of 2145 as compared to a calculated
value of 6530 the hypothesis was rejected suggesting that political stability has a
significant intervening effect on the relationship between performance measurement and
customer satisfaction The performance measurement variable had a t-value of 6530 and
was statistically significant while the effect of political stability had a t ndash value of ndash 1647
although not statistically significant
115
Table 48 Intervening Effect of Political Stability
Model Summary
Model R R Square Adjusted
R
Square
Std Error of the
Estimate
Change Statistics
R
Square
Change
F
Change
df1 df2 Sig F
Change
1 858a 736 715 06599 736 36176 1 13 000
2 886b 784 748 06203 049 2712 1 12 126
a Predictors (Constant) Performance Measurement
b Predictors (Constant) Performance Measurement Political Stability
ANOVAa
Model Sum of
Squares
Df Mean Square F Sig
1
Regression 158 1 158 36176 000b
Residual 057 13 004
Total 214 14
2
Regression 168 2 084 21825 000c
Residual 046 12 004
Total 214 14
a Dependent Variable Customer Satisfaction
b Predictors (Constant) Performance Measurement
c Predictors (Constant) Performance Measurement Political Stability
Coefficientsa
Model Unstandardized
Coefficients
Standardized
Coefficients
T Sig
B Std Error Beta
1 (Constant) -755 173 -4376 001
Performance Measurement 389 065 858 6015 000
2
(Constant) -1119 274 -4081 002
Performance Measurement 399 061 880 6530 000
Political Stability -257 156 -222 -1647 126
Source Field Data (2015)
A model equation of the intervening effect of political stability on the relationship
between performance measurement and customer satisfaction is described in equation
42
C Customer satisfaction = - 1119 + 0399 Performance Improvement - 0 257 Political
Stability helliphelliphelliphelliphelliphelliphelliphelliphelliphelliphelliphelliphelliphelliphelliphelliphelliphelliphelliphelliphelliphelliphelliphelliphelliphelliphellipEquation 42
116
This shows that a unit change in performance improvement impelled by performance
measurement will result in customer satisfaction changing by a factor of 0399 The unit
change in Political Stability contributes negatively to the customer satisfaction by a factor
of 0257 though not statistically significant In the absence of performance measurement
and political stability a constant customer satisfaction of negative 1119 would be
realized
46 Moderating Effect of Global Competitiveness on the Relationship between
Performance Measurement and Customer Satisfaction
The third objective of the study was to establish the moderating effect of global
competitiveness on the relationship between performance contracting and measurement
and customer satisfaction in the services delivered by Kenyalsquos public sector Hypothesis
three was formulated as
H3 There is no significant moderating effect of global competitiveness on the
relationship between performance contracting and public service delivery in Kenya
The results of analysis carried out to establish the moderating effect of global
competitiveness on the relationship between performance measurement and customer
satisfaction are shown in Table 49 The results show that global competitiveness
explained an additional 07 percent (Δ R2 = 0007) on the direct effect of performance
measurement on customer satisfaction The change in the F-value caused by the
moderating effect was 0343 and was not significant since the derived p-value of 0569
was greater than 005 Since the derived p-value was greater than 005 the hypothesis
was supported and therefore failed to be rejected The performance measurement variable
had a t-value of 5789 and was statistically significant while the effect of global
competitiveness was positive although not statistically significant
117
Tale 49 Moderating Effects of Global Competitiveness
Model Summary
Model R R
Square
Adjusted
R
Square
Std Error of the Estimate Change Statistics
R Square
Change
F
Change
df1 df2 Sig F
Change
1 858a 736 715 06599 736 36176 1 13 000
2 862b 743 700 06772 007 343 1 12 569
a Predictors (Constant) Performance Measurement
b Predictors (Constant) Performance Measurement Global Competitiveness
ANOVAa
Model Sum of
Squares
Df Mean Square F Sig
1
Regression 158 1 158 36176 000b
Residual 057 13 004
Total 214 14
2
Regression 159 2 080 17346 000c
Residual 055 12 005
Total 214 14
a Dependent Variable Customer Satisfaction
b Predictors (Constant) Performance Measurement
c Predictors (Constant) Performance Measurement Global Competitiveness
Coefficientsa
Model Unstandardized Coefficients Standardized
Coefficients
t Sig
B Std Error Beta
1
(Constant) -755 173 -4376 001
Performance
Measurement 389 065 858 6015 000
2
(Constant) -1178 743 -1585 139
Performance
Measurement 386 067 850 5789 000
Global
Competitiveness 117 199 086 586 569
Source Field Data (2015)
A model equation of the moderating effect of global competitiveness on the relationship
between performance measurement and customer satisfaction impelled by performance
measurement is described in equation 43
Customer Satisfaction = -1178 + 0386 Performance Improvement + 0117 Global
Competitiveness helliphelliphelliphelliphelliphelliphelliphelliphelliphelliphelliphelliphelliphelliphelliphelliphelliphelliphelliphelliphelliphelliphellip Equation 43
118
This shows that a unit change in performance improvement will result in customer
satisfaction changing by a factor of 0386 The unit change in global Competitiveness
will result in a change in customer satisfaction by 0117 though not statistically
significant In the absence of performance measurement and global Competitiveness
customer satisfaction will change by negative 1178
47 Joint Effect of Performance Measurement Political Stability and Global
Competitiveness on Customer Satisfaction
The fourth objective of the study was to establish the joint effect of political stability and
global competitiveness on the relationship between performance contracting and
measurement and customer satisfaction in the services delivered by Kenyalsquos public
sector Hypothesis four was formulated as
H4 There is no significant joint effect of political stability and global competitiveness on
the relationship between performance contracting and measurement and public service
delivery in Kenya
The results of the analysis carried out to establish the joint effect of performance
measurement political stability and global competitiveness on customer satisfaction are
shown in Table 410 The results show that performance measurement political stability
and global competitiveness were positively related to customer satisfaction The joint
effect of the three independent variables explained 785 percent (R2 = 0785) of customer
satisfaction levels with the remaining 215 percent accounted for by other factors
implemented in the public sector The F-value for the model was 13380 and the derived
p-value was 0001 Since the derived p-value was less than 005 with table value of 2145
as compared to a calculated value of 6213 the hypothesis was rejected hence
119
performance measurement political stability and global competitiveness had jointly a
significant relationship with customer satisfaction The performance measurement
variable had a t-value of 6213 and was statistically significant Political stability and
global competitiveness on the other hand were found to individually have negative effects
on customer satisfaction The negative effects were however not statistically significant
Table 410 Joint Effect of Performance Measurement Political Stability Global
Competitiveness on Customer Satisfaction
Model Summary
Model R R Square Adjusted R Square Std Error of the
Estimate
1 886a 785 726 06471
a Predictors (Constant) Global Competitiveness Performance Measurement Political Stability
ANOVAa
Model Sum of
Squares
Df Mean Square F Sig
1
Regression 168 3 056 13380 001b
Residual 046 11 004
Total 214 14
a Dependent Variable Customer Satisfaction
b Predictors (Constant) Global Competitiveness Performance Measurement Political Stability
Coefficientsa
Model Unstandardized
Coefficients
Standardized
Coefficients
t Sig
B Std
Error
Beta
1
(Constant) -1010 720 -1404 188
Performance
Measurement 401 065 883 6213 000
Political Stability -271 185 -235 -1464 171
Global
Competitiveness -036 217 -026 -165 872
a Dependent Variable Customer Satisfaction
Source Field Data (2015)
A model equation of the joint effect relationship is described in equation 44
Customer Satisfaction = -101 + 0401 Performance Improvement ndash 0271 Political
Stability ndash 0036 Global Competitiveness helliphelliphelliphelliphellip helliphelliphelliphelliphelliphelliphellipEquation 44
120
The equation demonstrates that a unit change in performance improvement intervened
and mediated respectively by political stability and global competitiveness will result in
customer satisfaction changing by a factor of 0401 In the absence of performance
measurement political stability and global competitiveness customer satisfaction will
change by negative 101 In the study of the joint effect of political stability and global
competitiveness on the relationship between performance contracting and measurement
and public service delivery it was found that for a unit percentage change in political
stability there would be a 0271 decrease in customer satisfaction while a unit
percentage change in global competitiveness would result in a decrease of 0036in
customer satisfaction although both were individually not statistically significant
48 Summary of Tests of Hypotheses
Table 411 shows the summary of the tests of the hypotheses The results show that three
of the studylsquos hypotheses were supported while one hypothesis went unsupported
Table 411 Summary of Tests of Hypotheses
Hypothesis Empirical Evidence R2 F
H1 There is no significant relationship between
performance contracting and measurement and
public service delivery in Kenya
Rejected there4 there as
a significant
relationship
0736 36176
H2 There is no significant intervening effect of
political stability on the relationship between
performance contracting and measurement and
public service delivery in Kenya
Rejected there4 there
was a significant
effect
0784 2712
H3 There is no significant moderating effect of
global competitiveness on the relationship
between performance contracting and
measurement and public service delivery in
Kenya
Failed to be rejected
there4 proposition was
accepted
0743 0343
H4 There is no significant joint effect of political
stability and global competitiveness on the
relationship between performance contracting
and measurement and public service delivery in
Kenya
Rejected there4 there
was a significant
joint effect
0785 1338
Source Field Data (2015)
121
Hence the conclusions from the findings along with R2 and F values are summarized as
indicated in the table below
Table 412 Conclusion from Findings
Hypothesis R2 F
H1 There is no significant relationship between performance
contracting and measurement and public service delivery in Kenya
0736 36176
H2 There is no significant intervening effect of political stability on the
relationship between performance contracting and measurement
and public service delivery in Kenya
0784 2712
H3 There is no significant moderating effect of global competitiveness
on the relationship between performance contracting and
measurement and public service delivery in Kenya
0743 0343
H4 There is no significant joint effect of political stability and global
competitiveness on the relationship between performance
contracting and measurement and public service delivery in Kenya
0785 1338
Source Field Data (2015)
49 Discussion of the Findings
The study brought out interesting inferences on the relationship between performance
contracting and measurement and public service delivery in Kenya The finding that
measurement was highly correlated with both improvement in performance and customer
satisfaction did not come as a huge surprise and vindicates both the observation by
Osborne et al (1992) that ―what gets measured gets done and the statement by Brown
et al (2001) that people make decisions and do their work at least partly based on how
their performance is measured and evaluated As a result they tend to improve in
performance aspects that will be measured and rewarded rather than in un-measured
aspects even if these do not necessarily support organizational goals and customer
satisfaction It also supports statements by Nathan (2009) that the utility of performance
management practices is predicated on sound performance measurement system and the
latter should be seen as a prerequisite for effective management and that performance
122
management practices will continue to be questionable unless they are rooted in a
performance measurement system Moreover there is a distinct linkage between
organizational performance and excellence in public service delivery It is also consistent
with the findings of research by Martinez amp Kennerley (2005) that performance
measurement and management systems deliver superior results and focus peoples
attention on what is important to an organization propel business improvement improve
customer satisfaction increase productivity align operational performance with strategic
objectives align people behaviors towards continuous improvement and improve
company reputation
The effects of political stability have been documented in both Kenya and the Kingdom
of Lesotho The fortunes of Kenya as evidenced by growth in real GDP plummeted
steeply following the 2007-2008 post-election skirmishes which fomented widespread
political instability pitting communities against each other The growth rates including
the post-election period are indicated in Appendix III Business activity in Lesotho was
severely albeit gradually affected by political instability resulting from polarization in a
loose coalition government Political stability is closely intertwined with the quality of
political governance with poor governance precipitating instability and vice versa As had
been the case in the Kingdom of Lesotho between 2012 and early 2015 the Republic of
Kenya was under the governance of a loose coalition of parties that did not agree on
many fronts between 2008 and early 2013
The most curious findings were that outside the relationship between performance
contracting and measurement and public service delivery political stability and global
competitiveness on their own did not have significant effect on customer satisfaction
That even within the relationship only political stability had a significant relationship
123
This is somewhat surprising considering the impact political instability had on economic
growth and performance in Kenya in 2008 and considering further ras observed earlier in
the study that improvement in organizational performance informs improvement in
service delivery It would be expected too that improvement in global competitiveness
would moderate the performance of an economy This was not the case as brought out in
the study
Overall the outcomes of the study should be of practical interest to governments desirous
to improve public sector performance practitioners in the field of performance
contracting and measurement and public service delivery academicians and the public as
beneficiaries of public services as the following chapter indicates
410 Chapter Summary
This chapter presented the research findings and the corresponding interpretations based
on the objectives and hypothesis It presented the findings in a chronological order based
on study hypothesis relating the findings with the previous literature Discussion of the
major findings was also presented
Composite data of study variables were also tested and interpreted using mean scores
coefficients of variations and significance levels Varied outcomes were noted Most of
the variables had moderately high rankings with statistically significant levels meaning
that performance contracting and measurement explained the variation in service delivery
in public service
124
CHAPTER FIVE
SUMMARY CONCLUSIONS AND RECOMMENDATIONS
51 Introduction
This chapter includes a summary of the findings of the study along with interpretation of
the results further discussion of the findings the conclusions made from the findings
limitations of the study and suggestions for further research The findings and
conclusions which have important implications for public policy formulation and
implementation management of mainly public but also private sector organizations
academicians general practitioners and significantly the operations research community
are based on the research objectives and hypotheses
A number of the findings and conclusions are consistent with both the empirical work
carried out in this area and the theoretical assertions captured in both the introduction to
the study and the literature review Some of the findings may also however have been
influenced by the unique peculiarities of the Kenyan situation and could conceivably
differ with other empirical and academic work to this extent
The specific objectives of the study were the following to determine the relationship
between performance contracting and measurement and public service delivery in Kenya
to establish the intervening effect of political stability on the relationship between
performance contracting and measurement and public service delivery in Kenya to
establish the moderating effect of global competitiveness on the relationship between
125
performance contracting and measurement and public service delivery in Kenya and to
establish the joint effect of political stability as well as global competitiveness on the
relationship between performance contracting and measurement and public service
delivery in Kenya Four hypotheses were drawn from the above objectives and from the
conceptual framework and accepted on the basis largely of significance as evidenced by
the various statistical tests
52 Summary of the Findings
The research study was focused on the relationship between performance contracting and
measurement on the one hand and public service delivery on the other as intervened and
moderated by respectively political stability and global competitiveness Performance
contracting as practiced and implemented in the public service in Kenya is essentially a
performance management measurement and improvement system The essence of the
system is that it ensures measuring and improving the performance of all key factors by
focusing on multiple management perspectives which include finance and stewardship
operations service delivery and non-financial and dynamicqualitative aspects and using
weighted and composite scores to measure the performance This is consistent with the
statements by Hayes and Clark that ―In reality the productivity a firm achieves is a
function of how efficiently it uses all its inputs ndash labor capital technology and energy ndash
to produce outputs (Hayes and Clark 1986) By introducing the intervening and
moderating variables focusing on a large population of diverse public agencies the study
set itself aside from the empirical studies referred to earlier in the study Inclusion of
these distinctions was deliberate as attempts to address knowledge gaps and addition to
the existing stock of knowledge in the field
126
The key finding was that performance measurement is critical to improvement in public
service delivery and accounts for or explains 736 percent of improvement in service
delivery with a unit change in measurement of performance resulting in a change of
0389 in customer satisfaction Other findings were that both political stability and global
competitiveness had significant effects on the relationship between performance
improvement ndash which is the outcome of performance contracting and measurement - on
the one hand and service delivery on the other Deterioration in political stability affects
service delivery adversely while improvement in global competitiveness has a positive
effect on service delivery The converse obtains as true when the intervening and
moderating variables are moving in opposite directions Taken together the three
independent variables explained 785 percent (R2 = 0785) of customer satisfaction levels
with the remaining 215 percent accounted for by other factors implemented in the public
sector The study established further that on their own individually both political stability
and global competitiveness had no significant relationship with service delivery and
would therefore not significantly affect customer satisfaction
Preliminary findings had indicated that all the four variables ndash customer satisfaction
performance measurement political stability and global competitiveness were related but
not perfectly Performance measurement was singled out as the most highly correlated
with customer satisfaction (R = 0858) and the relationship was significant at 99 percent
confidence level This clearly underscores the importance of performance measurement
in the improvement of both performance and customer satisfaction Again this is
consistent with the contention by Brown et al (2001) that ―Measurement is not only a
way of determining what has already happened which is like driving by looking in the
127
rear-view mirrorlsquo but is also a way of getting people to act in ways that will bring about
desired future outcomes It probably came as little surprise that the public sector in Kenya
had an average customer satisfaction index of 027779 implying that 72 percent of
customers were dissatisfied with public service delivery Performance measurement had
the highest variability (SD = 027255) across the public sector made up of ministries
state corporations local authorities and tertiary institutions Political stability was found to
be weak with a mean of -131533 on a scale of -25 (very weak) and 25 (very strong)
Global competitiveness on the other hand was found to be average of 3698 on a scale of
1 (very low) and 7 (very competitive)
53 Conclusion
The preliminary findings pointed out that customer satisfaction performance
measurement political stability and global competitiveness are related but not perfectly
Based on the research findings it can be concluded that performance measurement has a
significant effect on customer satisfaction Secondly it can be concluded that political
stability has an intervening effect on the relationship between performance measurement
and customer satisfaction Further global competitiveness has a moderating effect on the
relationship between performance measurement and customer satisfaction although on
their own political stability and global competitiveness have no significant effect on
customer satisfaction
54 Implications of the Study Findings
The following are the implications of this study for the various constituents including the
government at the policy formulation and implementation levels the public as the
customer and consumer of government services and the academic and operations
management fraternity and practitioners
128
541 Implications for Public Policy Formulation and Implementation
The study findings have important implications for future policy formulation and
execution in the public sector This is because the study has clearly brought out the key
variables the management of the public sector needs to put higher resources and effort
into in the pursuit of improved performance of the public service and increasing
efficiency in the exploitation and use of public resources Top of the variables with the
most significant relationship with service delivery and customer satisfaction was
performance measurement which explained 736 percent of customer satisfaction levels
implying as in the words of caution by Nathan (2009) then keep boomeranging that ―hellip
performance measurement should not be confused with performance management but
should instead be seen as a prerequisite for effective management Further that ―hellip the
value of performance management practices will continue to be questionable unless they
are rooted in a performance measurement system that continuously feeds decision
making as well as produces evidence and supports communication of value added
(Nathan 2009) Clearly too performance measurement within the context of
performance contracting facilitates improvement in service quality vindicating
Druckerlsquos (1999) statements that if it canlsquot be measured it canlsquot be managed what gets
measured gets watched and what gets watched gets done It would accordingly serve
governments well in the pursuit of performance improvement that all forms of
performance should be subjected to measurement As Osborne et al (1992) contends
―what gets measured gets done
129
The effects of the intervening and moderating factors cannot also be wished away The
study brings out that political stability had a positive albeit weak relationship with
customer satisfaction explaining 18 percent of customer satisfaction levels while
global competitiveness also had a weak positive relationship with customer satisfaction
explaining 25 of customer satisfaction levels The implication here is that the status
of political stability has a role in defining the direction customer satisfaction assumes
The core essence of political stability is the quality of governance Improvement in the
quality of governance which largely defines political stability impacts positively on
service delivery and combines with performance measurement to improve customer
satisfaction Decline in political stability (political instability) precipitates the converse
principally because it affects performance adversely This stark reality has begun to show
its glare in the performance of the tourist industry in the Kingdom of Lesotho This tiny
mountain kingdom experienced serious political turmoil following the formation of a
loose coalition government after the May 2012 general elections The situation
deteriorated in June 2014 leading to the collapse of the coalition an unscheduled
prorogation of parliament and ultimate Southern African Development Community
(SADC) mediated agreement to hold early elections in February 2015
According to a statement issued by the public relations manager of the Lesotho Tourist
Development Corporation (LTDC) to the local media ―The tourism industry is feeling
the pinch of a drastic decline in the inflow of tourists as well as decreased spending by
both corporate and individual consumers owing to the political and security instability
rocking the mountain kingdom Despite the LTDC efforts in marketing Lesotho as a
tourist and investment destination political turmoil had left the sector reeling Businesses
130
have reported a downturn in revenue for lodging food events and other hospitality
services In Kenya political instability following the 20072008 post-election skirmishes
resulted in sharp decline in economic growth from a high of 71 in 2007 to a measly
17 in 2008 and a proportionally sharp decline in aggregate performance of the public
service (Appendices VII and IX)
On the other hand improvement in global competitiveness when taken together with
performance measurement induces improvement in service delivery and increases
customer satisfaction and vice versa It should finally be noted that the joint effect of the
three variables working together that is measurement premised on improved governance
and global competitiveness have a significantly dominant effect on customer satisfaction
542 Implications for the Customer
The constituency most affected by the performance of the government is essentially the
citizen who is also the tax payer The brunt of flawed service delivery is borne fully by
the citizen while improvement in service delivery serves to improve customer
satisfaction underwrite demonstrable value on the tax shilling and build trust in
government When a government is able to identify and manage the factors that influence
and affect service delivery it is better able to relate with the citizen and to improve
customer satisfaction with public services
Moreover identifying the key factors affecting performance helps in not only focusing of
public resources in the right areas but also refocusing of managerial effort to address
customer-centric issues This will ensure a government that as Clinton (1995) states has
a lower cost and a higher quality of service and one that changes along with the people it
131
serves in order to cure the anxiety and alienation many people feel toward their
government Clinton (1995) adds for good measure that people will regain confidence in
government if we make it work better That there is need to make quality management
the culture of government so that no future administration can fail to embrace it
543 Implications for the Academic Community
A number of postulates by practitioners and writers in the field of performance
management measurement and improvement have been largely vindicated by the
findings of the study while others have failed to find accommodation The findings of the
study vindicate the assertion by Nutt (2008) In a study carried out in 2008 Nutt
compared the success of organizational decisions among three groups and found that
those who made decisions based on the use of quantified performance data were
significantly more successful than those who made decisions on the basis of personal
―hunches or feelings or on the basis of consensus of opinions of others This does not
suggest that the two latter perspectives do not have their utility rather it suggests that
they must be triangulated with independently verifiable performance data The robustness
of performance management including its capacity to influence performance is therefore
up - scaled by rooting it in a system that quantifies performance and provides evidence-
based data
Nutt (2007) opines that beyond implementing research findings to improve performance
there is a critical requirement to implement evidence-gathering practices into
performance management Nutt (2007) cites a variety of studies that indicate intelligence
gathering is the most overlooked step of the decision making process It can be safely
concluded therefore that performance measurement is at the heart of managing and
132
improving performance (Rummler 2004) yet according to the research it is often
overlooked (Clark amp Estes 2000 Guerra-Loacutepezamp Leigh 2009) As Garvin (1993) states
―hellipif something cannot be measured it cannot be managed Lebas (1995) goes to the
extreme of negating the existence of performance management without measurement
Performance management ―hellipis instrumental for businesses in providing feedback to
employees allocating resources adopting a long - term perspective continuously
improving the organization improving communication and motivating employees
(Sinclair amp Zairi 1995) Martinez and Kennerley (2005) argued that performance
measurement and management systems deliver superior results and have the following
positive effects focus peoples attention on what is important to an organization propel
business improvement improve customer satisfaction increase productivity align
operational performance with strategic objectives improve people satisfaction align
people behaviors towards continuous improvement and improve company reputation
At the expense of redundancy there is need to reflect on the views of Nathan (2009) that
performance measurement should not be confused with performance management but
should instead be seen as a prerequisite for effective management Further that ―hellip the
value of performance management practices will continue to be questionable unless they
are rooted in a performance measurement system that continuously feeds decision
making as well as produces evidence and supports communication of value added He
proceeds to state that the first condition to improve and ultimately achieve business
excellence and which must be an attribute of an effective Performance Management
System is provision for an elaborate system for performance measurement and
evaluation This helps in establishing progress towards goals By knowing the real path
133
for excellence an organization can identify where to improve and how its limited
resources can be more effectively used for this improvement Aguinis (2007) Aguinis
Joo and Gottfredson (2011) Biron Farndale and Paauwe (2011) Hantula (2011)
Nankervis and Compton (2006) Pulakos and OlsquoLeary 2011) contend however that
although organizational use of performance management systems is widespread
dissatisfaction among both management and employees is also high and the value added
questionable at best They proceed to argue that performance management has the
potential to generate significant value for organizations but it is frequently ineffective is
often viewed skeptically by employees typically requires a significant investment of
resources and capital and may actually undermine strategic improvement when
implemented poorly (Aguinis 2007 2009 Biron et al 2011 Pulakos amp OlsquoLeary 2011)
These contentions can however be traced back to both poor measurement of important
performance indicators and consequently poor alignment to performance management
interventions
Performance measurement is a central mechanism in both assessment and evaluation
which provides the required data for identifying the most appropriate interventions to
measurably improve performance (Guerra-Loacutepez 2008 2010) The robustness of
performance management including its capacity to influence performance is therefore up
- scaled by rooting it in a system that quantifies performance and provides evidence based
data Nutt (2007) opines that beyond implementing research findings to improve
performance there is a critical requirement to implement evidence-gathering practices
into performance management
134
The findings of the study appear to be largely consistent with the conclusions in three of
the past four related studies cited in this report but contradicts the findings of the fourth
study The studies their objectives and findings are shown in Appendix X The apparent
divergence in the studieslsquo findings notwithstanding the study brings out the essence and
critical role that measurement has on performance improvement leading ultimately to
improvement in service delivery and customer satisfaction
From a public policy perspective the findings point to the importance of formulating
deliberate national policies that allow for the development and employment of strong
performance management measurement and improvement policies and systems by
governments Further it is important to keep in mind the affirmation by Nathan (2009)
that ―hellip the value of performance management practices will continue to be questionable
unless they are rooted in a performance measurement system that continuously feeds
decision making as well as produces evidence and supports communication of value
added in addition to the statement by Brown et al 2001 that ―Measurement is not only
a way of determining what has already happened which is like driving by looking in the
rear-view mirrorlsquo but is also a way of getting people to act in ways that will bring about
desired future outcomes Deliberate measurement of performance should therefore be
the core attribute of public sector performance management systems
55 Limitations of the Study
The obvious limitations of the study relate to the weaknesses of cross-sectional study
designs that cross-sectional designs only provide a snapshot of analysis so there is
always the possibility that a study could have differing results if another time-frame had
been chosen Further that the studies cannot be utilized to establish cause and effect
135
relationships Other limitations were occasioned by the dismantling of particularly
ministerial structures by the constitution of 2010 The constitution drew clear lines
between the functions of the national government and the newly established county
governments and this affected the structuring and functioning of the residual 18
ministries significantly relative to the earlier government structure which was organized
around 46 ministries and accounting departments
The subsequent lumping together of several ministerial functions resulted in complex
functional tradeoffs and triangulation of functions This meant that it became difficult to
identify any one earlier ministerial performance contract with the emergent ministries
thereby curtailing the possibility of obtaining coherent survey information or conducting
meaningful performance trend analysis The other limitation was to do with lack of a
standardized tool for measuring customer satisfaction leaving external consultants to
devise and use often disparate measurement tools Poor understanding and appreciation
of the precepts of the concept and essence of customer satisfaction led occasionally to
review of customer satisfaction scores
56 Suggestions for Further Research
The study findings reveal a number of questions that still need to be addressed It will be
recalled for example that the study established that performance measurement explains
736 percent of customer satisfaction levels Political stability explains 18 percent while
global competitiveness explains 25 percent The three variables explain 785 percent of
customer satisfaction levels Further research is required to establish what other factors
could explain the remainder of the customer satisfaction level that was not explained by
the above variables
136
In addition it emerged that on their own political stability and global competitiveness do
not individually have an effect on customer satisfaction This comes as a surprise
because the default perception is that a country going through political turmoil
precipitated by poor governance would in the same vein record lower performance and
service delivery levels Equally the default expectation in a situation where global
competitiveness is either improving or declining would be that performance and service
delivery would assume a concomitant direction These contradictions require further
research
The study was carried out for a period that the government in Kenya was a loose political
coalition where project implementation and the process of governance were often
interposed by constant coalition squabbles It may be apt to establish whether the findings
of the study would have been different with a unitary government or a more solid
coalition
137
REFERENCES
Aguinis H (2007) Performance management Upper Saddle River NJ Pearson
Education Inc
Aguinis H Joo H amp Gottfredson R K (2011) Why we hate performance
managementmdash and why we should love it Business Horizons 54 503ndash507
Aisen A amp Veiga F J (2011) IMF Working Paper How Does Political Instability
Affect Economic Growth International Monetary Fund Working paper
WP1112
Alesina A Ozler S Roubini N amp Swagel P (1992) Political Instability and Economic
growth Journal OF Economic Growth 1(2) 189-211
Amaratunga Beldry amp Majani (2001) From intention to action A theory of planned
behaviour citato in Zani B Cicognani E (2000) Psicologiadellasalute Il
Mulino Bologna
Anderson E W (1994) Customer Satisfaction and Word-of-Mouth Journal of Service
Research 1(1) 5-17
Anderson E W Fornell C amp Rust R T (1994) Customer Satisfaction Productivity
and Profitability Difference between Goods and Services Marketing Science
16(2)
Arnberg M (1996) Informing Clients Statements of Service Information and Service
Standards in OECD (1996) pp 245-264
Baldrige P E (2011) Baldrige performance excellence the foundation for national
malcolm bridge national quality award NIST Planning Report 01-3
Banker R D Charnes A amp Cooper W W (1984) Some models for estimating
technical and scale inefficiencies in data development analysis Management
Science 30(9) 1078-1092
138
Banks R L amp Wheelwright S C (1979) Operations versus strategy plusmn trading
tomorrow for today Harvard Business Review MayJune 112-20
Behn R (2001) Rethinking Democratic Accountability Washington Brookings
Institution
Bennett W (1990) Repairing the news a case study of the news paradigm Journal of
Communication 35(2) 50-68
Bereiter C amp Scardamalia M (1993) Surpassing ourselves an inquiry into the nature
and implications of expertise Chicago Open Court
Bird S M Cox D Harvey G Tim H amp Smith P C 2003) Performance indicators
good bad and ugly report of the royal statistical society working party on
performance monitoring in the public service London Royal Statistical Society
Biron M Farndale E amp Paauwe J (2011) Performance management effectiveness
Lessons from world leading firms The International Journal of Human Resource
Management 22 1294ndash1311
Bititci U Garengo P Doumlrfler V amp Mendibil K (2009) Performance measurement
questions for tomorrow SIOM Research Paper Series (October)
Bititci U (2011) Performance Measurement Challenges for Tomorrow International
Journal of Management Reviews 14(3) 305 ndash 327
Bititci U Carrie A S amp McDevitt L (1997) Integrated performance measurement
systems a development guide International Journal of Operations and
Production Management 17(5) 522-534
Blalock A B (1999) Evaluation Research and the Performance Management
Movement From Estrangement to Useful Integration Evaluation 5(2) 117 - 149
139
Boland T amp Fowler A (2000) A Systematic Perspective of performance management in
public sector organizations The International Journal of Public Sector
Management 13(June) 15
Boulding K F (1956) General systems theory The skeleton of science Management
Science 2 197-208
Boulding W (1990) Commentary on Unobservable Effects and Business Performance
Do Effects Really Matter Marketing Science 9 (Winter) 88-91
Bourne M Neely A Mills J amp Platts K (2003) Implementing performance
measurement systems a literature review International Journal of Business
Performance and Management 5(1) 1-24
Bransford J D Brown A L Cocking amp R R (Eds) (2000) How people learn
Brain mind experience and school Washington DC National Academy Press
Braverman E amp Kuntz M (2012) Innovation in government India and Estonia New
Delhi McKinsey amp Company
Broeckling J (2010) Performance Measurement Theory and Practice Research Paper
Marquette University
Brown S Blackmon K Paul Cousins P amp Maylor H (2001) Operations
Management ndash Policy Practice and Performance Improvementrdquo Paper Back
Buckley W (Ed) (1968) Modern systems research for the behavioral scientist
Hawthorne NY Aldine de Gruyter
Buffa E S (1980) Research in operations management Journal of Operations
Management 1(1) 1-8
Buzachero V V Phillips J Phillips P Pamp Phillips Z L (2013) Proving ROI Value
of Healthcare Education and Training Simulation Programs Measuring ROI in
140
Healthcare Tools and Techniques to Measure the Impact and ROI in Healthcare
Improvement Projects and Programs 2013
Bynoe I (1996) Beyond the citizens charter new directions for social rights London
IPPR
Center for Public Policy Studies (2012) Political Stability ndash an advantage or a curse
Chan Y L (2004) Performance measurement and adoption of balanced scorecards A
survey of municipal governments in the USA and Canada International Journal
of Public Sector Management 17(23) 204-221
Charnes A Cooper W W amp Rhodes (1978) Measuring efficiency of decision-making
units European Journal of Operations Research 2(6) 429-44
Chase R B (1980) A classification and evaluation of research in operations
management Journal of Operations Management 1(1) 9-14
Cho Y amp Yoon SW (2010) Theory development and convergence of human resource
fields Implications for human performance technology Performance
Improvement Quarterly 23 39ndash56
Citizens Charter Raising the Standard (1991) White Paper Cm 1599 London HMSO
Citizens First EU Rights on Equal Opportunities Buying Goods and Services and
Travelling (1997)
httpeuropaeuintconundg15 enupdatecitizen1035htm Brussels
Civil Service Reforms CAB (03)115 (2004) Cabinet Memorandum on civil service
reforms Government of Kenya Cabinet Office
Clark R E amp Estes F (2000) A proposal for the collaborative development of
authentic performance technology Performance Improvement 39 48ndash53
141
Claus L amp Briscoe D (2009) Employee performance management across borders A
review of relevant academic literature International Journal of Management
Reviews 11 175-196
Clinton B (1995) Forward to Vice President Al Gorersquos Common Sense Government
works better and costs less New York Random House
Corte-Real I (1996) Current and Future Developments in Quality Initiatives in the
Portuguese Public Administration in OECD (1996) 39-47
Covaleski W R (2006) Institutions and organizations Thousand Oaks Sage
Publications
Craig CE amp Harris CR (1973) Total productivity measurement at the firm level
Sloan Management Review 14(3) 13 ndash 29
Crosby P B (1972) Quality is free New York McGraw Hill
Cunningham K amp Ricks M (2004) Why measure Stanford Social Innovation Review
2(1) 44-51
Cyert M amp March J (2002) The pursuit of organizational intelligence Oxford
Blackwell
Danks S (2013) Performance measurement systems and culture an integrative literature
review Learning and Performance Quarterly 2(1) 30-44
Davenport T H (1993) Process innovation reengineering work through information
technology Cambridge MA Harvard Business School Press
De Vaus D A (2001) Research Design in Social Research London SAGE
Deadrick D L amp Gibson P A (2009) Revisiting the researchndashpractice gap in HR A
longitudinal analysis Human Resource Management Review 19 144ndash153
142
Deming W E (1982) Quality productivity and competitive position Cambridge MA
MIT Center for Advanced Engineering Study
Deming W E (1986) Out of the crisis Cambridge MA MIT Press
Den Hartog D N Boselie P amp Paauwe J (2004) Performance management A model
and research agenda Applied Psychology 53 556ndash569
Developing Service Charters (1997) httpwwwdistgovauconsumer
chartersdevelophtmoverviewhtml Canberra
Dixon JR Nanni A J amp Vollmann T E (1990) The New Performance Challenge
Measuring Operations for World-class Competition Homewood Ill Dow Jones-
Irwin drive performance Harvard Business Review 70(1) 71-79
Dixon J amp Bitton F (2005) Researching performance measurement system
implementation DOI 101111j1365-
Dresner M E amp Windle R J (1992) Airport dominance and yields in the US airline
industry Logistics and Transportation Review 28(4) 319ndash339
Dresner M amp Xu K (1995)Customer service customer satisfaction and corporate
performance in the service sector Journal of Business Logistics 16 (1) 23-40
Drucker P (1954) The practice of management New York Harper
Drucker P (1990) Control Controls and Management in C P Bonini R K Jaedieke
and H M Wagner Management Controls New Directions in Basic Research
McGraw
Drucker P (1999) Management challenges for the 21st Century Taylor amp Francis Ltd
Drucker P F (1964) Managing for results economic tasks and risk-taking decisions
New York Harper Collins
143
Drucker P F (1990) The emerging theory of manufacturing Harvard Business Review
68(3) 94-102
Eccles Robert G Jr (1991) The Performance Measurement Manifesto Harvard
Business Review 69(1)
Edwin L amp Latham P G (1990) A Theory of Goal Setting and Task Performance
New York Prentice Hall
Farrell D amp Goodman A (2013) Government by design four principles for a better
public sector Waltham MA Mackinsey amp Company
Feigenbaum AV (1961) Total Quality Control New York McGraw Hill
FitzGerald J M amp FitzGerald A F (1973) Fundamentals of systems theory New
York Wiley
Fitzgerald L Johnston R Brignall TJ Silvestro Ramp Voss C (1991)Performance
Measurement in Service Businesses London The Chartered Institute of
Management Accountants
Fletcher J L (1993) Patterns of high performance Discovering the ways people work
best San Francisco Berret-Koehler Publishers
Flynn N (1990) Public sector management London HarvesterWheatsheaf
Fornell Claesamp Lehman Donald R (1994) Customer Satisfaction Market Share and
Profitability Journal of Marketing 56(July) 53-66
Fornell Claes (1992) A National Customer Satisfaction Barometer The Swedish
Experience Journal of Marketing January 1-21
Franco-Santos M Kennerley M Micheli P Martinez V Mason S Marr B Gray
D amp Neely A (2007) Towards a definition of a business performance
144
measurement system International Journal of Operation and Production
Management 27(8) 784-801
Fry TD amp Cox J F (1989) Manufacturing performance local versus global measures
Production and Inventory Management Journal 2nd Quarter 52-56
Fuller T (1661) English preacher historian and scholar London Institute OF
Historical Research
Garvin D A (1993) Manufacturing strategic planning California Management Review
35(4) 85-106
Garvin D A (1987) Competing on the eight dimensions of quality Harvard business
Review 65(6) 101-9
Gates S (1999) Aligning strategic performance measures and results New York The
Conference Board
Geniat M A amp Libert F H (2002) Communicating and Controlling Strategy an
Empirical Study of the Effectiveness of the Balanced Scorecard Journal of
Management Accounting Research 13
Ghalayini A M amp Noble J S (1996) The changing basis of performance measurement
International Journal of Operations and Production Management 16(8) 63-80
Ghasemi A amp Zahediasl S (2012) Normality tests for statistical analysis a guide for
non-statisticians International Journal of Endocrinology and Metabolism 10(2)
486-489
Gore Al (1995) Common Sense Government Works better and costs less New York
Random House
Gradous D B (Ed) (1989) Systems theory applied to human resource development
Alexandria VA American Society for Training and Development
145
Griliches Z (1971) Price indices and price change Cambridge MA Harvard
University Press
Guerra-Loacutepez I (2008) Performance evaluation Proven approaches for improving
program and organizational performance San Francisco CA Jossey-Bass
Guerra-Loacutepez I (2010) Performance measurement and management systems Hoboken
NJ John Wiley amp Sons
Guerra-Loacutepez I amp Hutchinson A (2013) Measurable and continuous performance
improvement The development of a performance measurement management and
improvement system Performance Improvement Quarterly 26(2) 159-173
Guerra-Loacutepez I amp Leigh H (2009) Are performance improvement professionals
measurably improving performance What PIJ and PIQ have to say about the
current use of evaluation and measurement in the field of performance
improvement Performance Improvement Quarterly 22 97ndash110
Halachmi A(2002) Performance Measurement and Government Productivity
Work Study 51(2) 63 ndash73
Halachmi A amp Bouckaert G (1995) Re-engineering in the Public Sector International
Review of Administrative Sciences 61(3) 323 - 327
Hall J (2009) Cross-Sectional Survey Design Health knowledge Cross-Sectional
Study Wikipedia
Hall J (2009) Cross-sectional survey design in encyclopedia of survey research
methods Thousand Oaks CA Sage
Harbor J L (2009) The basics of performance measurement New York NY
Productivity Press
146
Hayes R H Garvin D A (1982) Managing as if tomorrow mattered Harvard Business
Review 60(3) 70-79
Hayes R H amp Clark K B (1986) Why some factories are more productive than others
Harvard Business Review 64(5) 66-73
Hayes R H Abernathy W J (1980) Managing our way to economic decline Harvard
Business Review 62 95-101
Hergenhahn B R amp Olson M H (1993) An introduction to theories of learning (4th
ed) Englewood Cliffs NJ Prentice Hall
Hofstede G (1981) Management control of public and not for profit activities
Accounting Organizations and Society 6(3) 193-211
Hofstede G (1981) Management control of public and not for profit activities
Accounting Organizations and Society 6 (3) 193-211
Hubbard DW (2010) How to measure anything Finding the value of intangibles in
business Hoboken NJ Wiley
Hudson M M (2006) Performance management and service delivery in the department
of Water affairs and forestry (DWAF) Postgraduate thesis paper university of
South Africa
Hudson M Smart A amp Bourne M (2000) Theory and Practice in SME performance
measurement systems International Journal of Operations and Production
Management 21(8) 1096 -1115
Ilgen D R amp Klein H J (1990) Individual motivation and performance cognitive
influences on effort and choice San Francisco Jossey Bass
Jerry L H (2010) The Basics of Performance Measurement 2nd
edition International
Journal of Production Research 48(12)
147
Johnson C amp Talbot C (2006) The UK Parliament and Performance Challenge or
Challenged American Review of Public Administration under review
Johnson H T (1975) Management accounting in an early integrated industrial E I du
Pont de Nemours Powder Company 1903ndash1912 Business History Review 44(2)
184ndash204
Johnson H T amp Kaplan R S (1987) Relevance lost the rise and fall of management
accounting Boston MA Harvard Business School Press
Johnson HT amp Kaplan R S (1987) Relevance lost the rise and fall of management
accounting Boston MA Harvard Business School Press
Johnson HT (1972) Early cost accounting for internal management control Lyman
Mills in the 1850s Business History Review 46(4) 466ndash474
Johnson HT (1978) Management accounting in an early multidivisional organization
General Motors in the 1920s Business History Review 52(4) 490ndash517
Johnson HT (1981) Towards an understanding of nineteenth century cost accounting
The Accounting Review 56(3) 510ndash518
Juran JM (1988) Juranrsquos Quality Control Handbook 4th
ed New York McGraw Hill
Kaplan R amp Norton D (1996) Using the balanced scorecard as a strategic management
system Harvard Business Review Jan ndash Feb 75-85
Kaplan R S amp Norton DP (1992) The balanced scorecard measures that drive
performance Boston MA Harvard Business School Press
Kaplan R S amp Norton DP (2004) The strategy-focused organization how balanced
score-card companies thrive in the new business environment Boston M
Harvard Business School Press
148
Kaplan R S (1983) Accounting lag the obsolescence of cost accounting system
California Management Review Winter 174-199
Kaplan R S Norton DP (1992) The balanced scorecard ndash measures that drive
performance Harvard Business Review 70(1) 71-79
Keegan D P (1989) Are your performance measures obsolete Management
Accounting June 134-47
Kennedy J F (1962) Address given at Rice University Public Papers of the Presidents
of the United States 1 669-670
Kennerley M amp Neely A (2002) A framework of the factors affecting the evolution of
performance measurement systems International Journal of Operations and
Production Management 22 1222-1245
Kobia M amp Mohammed N (2006) Towards an effective Delivery of Public Services in
Africa Kenyan experience with performance contracting Arusha Tanzania
AAPAM annual round table conference
Kravchuck R amp Schack R (2006) Performance contracting rating tool and its use in
budget process Public Performance amp Management Review 30 351-368
Kumar S (1994) Research methodology A step-by-step guide for beginners 2nd
edition Australia Pearson Education
Kurien G P amp Qureshi M N (2011) Study of performance measurement practices in
supply chain management International Journal of Business Management and
Social Sciences 2(4) 19-34
Lancaster K (1979) Variety Equity and Efficiency New York Columbia University
Press
149
Landes D S (2000) Revolution in time clocks and the making of the modern world
Revised and Enlarged Edition Harvard University Press
Langdon D G (2000) Aligning performance improving people systems and
organisations San Francisco Calif Jossey-Bass Pfeifer
Lebas MJ (1995) Performance measurement and performance management The
International Journal of Productivity amp Performance Management 41(1-3) 23-
35
Lefton R E Buzzotta VR Sherberg M amp Karraker D L (1977) Effective
motivation through performance appraisal Canada John Wiley amp Sons Inc
Letts C Ryan W amp Grossman A (1997) Virtuous capital What foundations can
learn from venture capitalists Harvard Business Review 75(2) 36-44
Light P (2000) Making nonprofits work A report on the tides of nonprofit management
reform Washington DC Brookings Institution Press
Locke E (1968) Toward a theory of task motivation and incentives Organizational
Behaviour on Human Performance 3 157-89
Lynch R amp Cross K (1991) Measure up yardstick for continuous improvement
Oxford Blackwell
Maisel L (2001) Performance measurement practices survey results American Institute
of Certified Public Accountants Management 5(1) 1-24
Manchafalo M (2014) Public Relations Manager Lesotho Tourism Development
Corporation Lesotho Times (23rd
October 2014 p17) Tourism sector still
reeling from instability
March J G amp J P Olsen (1989) Rediscovering institutions and the organizational
basis of politics Oxford Maxwell Macmillan International
150
Martinez V amp Kennerley (2005) What is the value of using performance measurement
and management systems government by design Mike Centre for Business
Performance Cranfield School of Management
Maslow AH (1943) A theory of human motivation Psychological Review 50(4) 370ndash
96
Mayo E (1933) The Human Problems of an Industrialized Civilization New York
Macmillan Co
McGregor D (2011) Management education in the network economy its context
content and organization Organizational Dynamics 29 (3) 221ndash225
McKenna S amp Richardson J amp Manroop L (2011) Alternative paradigms and the
study and practice of performance management and evaluation Human Resource
Management Review 21(2) 148-157
McNair C J amp Mosconi W (1987) Measuring performance in an advanced
manufacturing environment Management Accounting 69(1) 8-31
McNair CJ Lynch R L amp Cross K F (1990) Do financial and non-financial
measures have to agree Management Accounting 28-36
Medori Damp Steeple D (2000) A framework for auditing and enhancing performance
measurement systems International Journal of Operation and Production
Management 20(5) 520-533
Meyer J W amp Rowan B (1977) Institutional organizations Formal structure as myth
and ceremony American Journal of Sociology 83 340-363
Mezey M (1979) Comparative Legislatures Durham NC Duke University Press
Modell S (2001) Performance measurement myths in the public sector a research note
Financial Accountability amp Management 20 39-55
151
Mudel M (1987) Measuring Total Productivity of Manufacturing Organizations White
Plains NY Unipub-Kraus International
Mugenda O M amp Mugenda A G (2003) Research methods Qualitative and
qualitative approaches Nairobi African Centre for Technology Studies
Multimedia Development Corporation (2007) Flagship Applications Retrieved
December 2007 from httpwwwmscmalaysiamytopic12073046901815
Mundel M (1987) Measuring total productivity of manufacturing organizations White
Plains NY Unipub-Kraus International
Murray CH (1990) The Civil Service Observed Dublin IPA
Mutahaba G (2010) Performance management monitoring measurement and
evaluation Research paper written for African Union Conference of African
Ministers for Public Service
Nathan RP (2009) Pointcounterpoint Journal of Policy Analysis and Management
26(1) 496ndash516
Neely A D Gregory M J Platts K W (1995) Performance measurement system
design A literature review and research agenda Journal of Operation and
Production Management 25(12) 1228-1263
Neely A (1999) The performance measurement revolution why now and where next
International Journal of Operations and Production Management 19 (2) 205-28
Neely A (2007) Business performance measurement (unifying theory and integrating
practice) Cambridge Cambridge University Press
Neely A D Gregory M J amp Platts KW (1995) Performance measurement system
design A literature review and research agenda Journal of Operation and
Production Management 15(4) 1228-1263
152
Neely A Adams C amp Kennerley M (2002) Performance prism the scorecard for
measuring and managing stakeholder relationships London Financial Times
Prentice Hall
Neely A Adams C amp Kennerley M (2007) Business performance measurement
Unifying theory and integrating practice Cambridge Cambridge University
Press
Neely A Mills J Platts K Richards H Gregory M Bourne M amp Kennerley M
(2000) Performance measurement system design developing and testing a
process-based approach Journal of Operation and Production Management
20(10) 1119-1145
Neely AD (2005) The revolution of performance measurement research agenda for
next International Journal of Operations and Production Management 25(12)
1264-1277
Neely AD Mills JF Platts KW Gregory MJ and Richards AH (1994)
Realizing strategy through measurement International Journal of Operations and
Production Management 14(3) 140-152
Neely AD Wilson J (1992) Measuring product goal congruence an exploratory
study International Journal of Operations and Production Management 12(4)
45-52
Norton P E (1998) Parliaments and Governments in Western Europe Oxford
Routledge
Nunnally JC (1978) Psychometric theory 2nd ed New York McGraw-Hill
Nutt PC (2007) Intelligence gathering for decision making Omega 35(5) 604ndash622
Nutt PC (2008) Investigating the success of decision making processes Journal of
Management Studies 45 425ndash455
153
OECD (1987) Administration as Service the Public as Client Paris
OECD (1996) Responsive Government Service Quality Initiatives Paris
OECD (2005) OECD Factbook 2005 Economic Environmental and Social Statistics
OECD Publishing
OECD-PUMA (1997) In Search of Results Performance Management Practices Paris
OECD
OECD-PUMA (1999) Performance Contracting ndash lessons from performance
contracting case studies a framework for public sector performance contracting
Paris OECD
Oliver C (1991) Sustainable competitive advantage Combining institutional and
resource-based views Strategic Management Journal 18 697-713
Osborne D amp Gaebler T (1992) Reinventing Government How the entrepreneurial
spirit is transforming the public sector New York Penguin Books USA Inc 375
Hudson Street
Osborne D amp Plastrik P (1997) Banishing Democracy The Five Strategies for
Reinventing Government New York Penguin Books USA Inc 375 Hudson
Street
OShea D (1992) Customer Care in the Public Sector Administration 40(3) 234-247
Otley DT (1999) Performance management a framework for management control
systems research Management Accounting Research 10(4) 363-382
Pasteur L (1822 - 1895) French chemist
Peters G B (1999) Institutional theory in political science London and New York
Pinter
154
Peters G B (1999) Institutional Theory in Political Science London and New York
Pinter
Pfeffer J amp Salancik G R (2008) The effect of CEOs on firm performance Strategic
Management Journal 29(12) 1357ndash1367
Pochard M (1996) Current and future developments in service quality initiatives the
situation in France OECD 49-57
Poister T (2004) Performance Monitoring In JS Wholey H Hatryamp K Newcomer
(Eds) Handbook of practical program evaluation San Francisco John Wileyamp
Sons
Poister T H (2003) Measuring Performance in Public and Non-profit Organizations
San Francisco CA Jossey ndash Bass
Pollitt C amp Bouckaert G (eds) (1995) Quality improvement in European public
services concepts cases and commentary London Sage
Pollitt C (2006) Performance information for democracy - the missing link
Evaluation 12(1)
Porter M (1990) The Competitive Advantage of Nations Harvard Business Review
Pulakos E D amp OlsquoLeary R S (2011) Why is performance management broken
Industrial and Organizational Psychology 4 146ndash164
Radin B (2006) Challenging the performance movement Accountability complexity
and democratic values Washington DC Georgetown University Press
Reichheld Fredrick F amp Sasser Earl W (1990) Zero defections quality comes to
services Harvard Business Review 68(5) 105ndash111
Rummler GA (2004) Serious performance consulting According to Rummler Silver
Spring MD International Society for Performance Improvement
155
Rynes SL Giluk TL amp Brown KG (2007) The very separate worlds of academic
and practitioner periodicals in human resource management Implications for
evidence-based management Academy of Management Journal 50(5) 987ndash1008
Salamon L (2003) The resilient sector The state of nonprofit America Washington
DC Brookings Institution Press
Santori PR amp Anderson AD (1987) Manufacturing performance in the 1990s
measuring for excellence Journal of Accountancy 164(5) 41-147
Schmenner RW ampVollmann T E (1998) Performance measures gaps false alarms
and the usual suspectslsquo International Journal of Operations and Production
Management 14(2) 58ndash69
Schonberger R J (1982) Japanese Manufacturing Techniques New York Macmillan
(1986) World Class Manufacturing New York Macmillan
Schonberger R J (1990) Creating a Chain of Customers London Guild Publishing
Sekaran U (2000) Applied business research qualitative and quantitative methods
Australia John Wiley amp Sons Australia Ltd
Senge PM (1990) The fifth discipline the art and practice of learning organization
New York Doubleday
Sinclair D amp Mohamed Z (1995) Business process re-engineering and process
management A survey of current practice and future trends in integrated
management Business Process Re-engineering amp Management Journal 1(1) 8 ndash
30
Sinclair D amp Mohamed Z (1995) Effective process management through performance
measurement Part III-an integrated model of total quality-based performance
measurement Business Process Re-engineering amp Management Journal 1(3)
50-65
156
Skinner W (1969) Manufacturing missing link in corporate strategy Harvard Business
Review 47(3) 136-45
Skinner W (1974) The decline fall and renewal of manufacturing Harvard Business
Review47(3) 138-145
Slack N (1983) Flexibility as a manufacturing objective International Journal of
Operations and Production Management 3(3) 5ndash13
Slack N (1987) The flexibility of manufacturing systems International Journal of
Operations and Production Management 7(4) 35-45
Slack N (1991) The Manufacturing Advantage Achieving Competitive Manufacturing
Operations International Journal of Operations and Production Management
3(3) 4-13
Smith PC (1995) Assessing the performance off NHS hospital trusts the role of
―hardand ―soft information International Journal of Health Policy and
Management (IJHPM)
Smith P (1995) On the unintended consequences of publishing performance data in the
public sector International Journal of Public Administration 18(2) 277 - 310
Spitzer DR (2007) Transforming performance measurement rethinking the way we
measure and drive organizational success New York NY Amacom
Stalk G (1988) Time the next source of competitive advantage Harvard business
Review 66(4) 41-51
Steele J amp Seargeant J (1997) Does consultation work Swindon ESRC
Sullivan M (1993) The antecedents and consequences of customer satisfaction for
firms Marketing Science 12(2) 125-143
157
Swanson R A (1999) The foundations of performance improvement and implications
for practice Berrett Koehler San Francisco
Talbot C (2004) Executive Agencies have they improved management in government
Public Money and Management 24(2)
Talbot C (2005) Performance Oxford Oxford University Press
Talbot C (2006) Performance regimes and institutional contexts Comparing Japan
UK and USA Paper for the International Symposium on Policy Evaluation24-25th
June 2006 Tokyo Ministry of Internal Affairs and Communications
Taylor FW (1911) The Principles of Scientific Management New York Harper
Brothers
Thorpe R amp Beasley T (2004) The characteristics of performance management
research Implications and challenges International Journal of Productivity and
Performance Management 53(4) 334ndash344
Thurow L (993) Head to headThe coming economic battle between Japan Europe and
America New York Warner Books
Tomlinson CA Kaplan S N Renzulli J S Purcell J Leppien J amp Burns D
(2002) The parallel curriculum A design to develop high potential and challenge
high-ability learners Thousand Oaks CA Corwin Press
Treasury Board of Canada Secretariat (1995) Declaration of Quality Services Principles
Ottawa
Trivedi P (1994) Memorandum of understanding ndash an approach to improving Public
enterprise performance International Management Publishers
Trochim William MK (2006)Research Methods Knowledge Base Edition 3 New
York Cengage Learning
158
Trosa S (1995) Quality in the French Public Service in Pollitt and Bouckaert 58-68
Turney PBB amp Anderson B (1989) Accounting for continuous improvement Sloan
Management Review 30(2) 37-47
White SH (2005) Beyond numbers making data work for teachers and school leaders
Englewood CO Lead + Learn Press
Whittaker JB (2001)Balanced Scorecard in the federal government Management
ConceptsVirginia Vienna
Wholey J S Hatry HP amp Newcomer KE (2010) Handbook of practical program
evaluation (3rd
ed) San fransisco CA Jossey-Bass
Williams D (2002) Before performance measurement Administration Theory Praxis
24(3) 457-486
Wiske M S (Ed) (1998) Teaching for understanding Linking research with practice
San Francisco Jossey-Bass
Zikmund W G Babin B J Carr J C amp Griffin M (2010)Business research
methods 8th
Edition South-Western Cangage Learning
159
APPENDICES
Appendix ITypes of Performance Contracts
Types of Performance Contracts
French Approach Signaling System
Philippines Korea Pakistan France Senegal China
Cote
dlsquoIvoire India Bolivia Gambia United
Kingdom
Benin
160
Appendix II Model Performance Contract Framework
This Performance Contract (hereinafter referred to as ―Contract) is entered into between
the Government of the Republic Kenya (hereinafter referred to as ―GoK) represented by
the Permanent Secretary Secretary to the Cabinet and Head of Public Service of PO
BOX helliphellipNairobi( together with its assignees and successors) of the one part and the
Permanent SecretaryAccounting Officer MinistryDepartment of helliphelliphelliphelliphellip
(Hereinafter referred to as the ―the Permanent SecretaryAccount Officer) (together
with its assignees and successors) of PO BOX helliphellipof the other part
WHEREAS
The Government is committed to ensuring that public offices are well managed and cost
less in delivering efficient and quality service to the public
The Government recognizes that MinistriesDepartments hold vital key to improving
performance and restoring the faith of the Kenyan people in their government
The purpose of this performance contract is to establish clarity and consensus about
priorities for the MinistrylsquosDepartmentlsquos management
This contract represents a basis for continuous improvement as we reinvent our
government to meet the needs and expectations of the Kenyan people
From this contract should flow the program and management priorities of the
MinistryDepartment
NOW THEREFORE the parties hereto agree as follows
Part I
Vision Mission and Strategic Objectives
161
(a) Vision of the MinistryDepartment
Ideal picture of the future
(b) Mission of the MinistryDepartment
Focuses attention on the main purpose of the organization
Aligns the organizational goals priorities and practices
(c) Strategic Objectives of MinistryDepartment
Objectives should be linked to National policy documents such Vision 2030
MTPSector Performance Standards etc
Specific easily understood attainable measurable time bound
Quantitative qualitative commercial non-commercial static dynamic
Not many avoid repetitions contradictions and overlaps
Only outcome (not process) objectives to be included
Include all critical objectives
Part II
Commitments and Responsibilities of
Permanent SecretaryAccounting Officer
Developing and implementing strategic plans in the MinistryDepartment
Ensuring strategic plans are linked to National policy documents such as Vision
2030
MTP Sector Performance Standards etc
Ensuring appropriate work plans are developed on the basis of the strategic plans
Developing comprehensive performance targets
Assigning weights to performance indicators
Signing performance contract with the Permanent SecretarySecretary to the
Cabinet and Head of Public Service
Ensuring achievement of the agreed targets
Preparing employees in the organization for the desired changes in working
styles attitudes and work ethics
Part III
Commitments and Obligations of the Government
Assistance required from Government should reflect assistance which is not
within the Ministrylsquos mandate eg implementation of laws and increase in
funding are already within the mandate of the MinistryDepartment
162
Government to ensure that public officers suspected of corrupt practices step
down to allow room for investigations
Part IV
Frequency of Monitoring and Information Flow
Modalities of information flow
Frequency of monitoring
Part V
Duration of the Performance Contract
The Performance Contract will run for one financial year
Part VI
Signing of Performance Contract
Signed
Permanent Secretary helliphelliphelliphelliphelliphelliphelliphelliphelliphelliphelliphelliphelliphellipDatehelliphelliphelliphelliphelliphelliphelliphellip
MinistryDepartment
Permanent SecretarySecretary to the Cabinet and Head of Public Service
helliphelliphelliphelliphelliphelliphelliphelliphelliphelliphelliphelliphelliphelliphelliphelliphelliphelliphelliphelliphelliphelliphelliphellipDatehelliphelliphelliphelliphelliphelliphellip
Counter-signed
Honorable MinisterhelliphelliphelliphelliphelliphelliphelliphelliphelliphelliphelliphelliphelliphelliphelliphellipDatehelliphelliphelliphelliphelliphelliphellip
Ministry of helliphelliphelliphelliphelliphelliphelliphelliphelliphelliphelliphelliphelliphelliphelliphelliphelliphelliphelliphelliphelliphelliphelliphelliphelliphelliphelliphellip
Endorsed
Rt Hon Prime MinisterhelliphelliphelliphelliphelliphelliphelliphelliphelliphelliphelliphelliphelliphellipDatehelliphelliphelliphelliphelliphellip
163
Appendix III Performance Contract Matrix
Pre
vio
us
YR
YR
(-1
)
Cu
rren
t S
tatu
s
YR
(0
)
Tar
get
CRITERION VALUES
CRITERIA CATEGORY
UN
IT
WT
Ex
cell
ent
(10
0-2
40
)
Ver
y G
oo
d
(24
0-3
00
)
Go
od
(30
0-3
60
)
Fai
r
(36
0-4
00
)
Po
or
(40
0-5
00
)
Ach
iev
emen
t
Raw
Sco
re
Wei
gh
ted
Sco
re
A Finance amp Stewardship
Indicators
Weight Sub total 20
B Service Delivery
Indicators
Weight Sub total 25
C Non-Financial
Indicators
Weight Sub total 15
D Operations
Indicators
Weight Sub total 25
E DynamicQualitative
Indicators
Weight sub total 10
Corruption Eradication
Weight Sub Total 5
Total 100
164
Appendix IV Citizensrsquo Service Delivery Charter
NO SERVICESGOODS REQUIREMENTS
TO OBTAIN
SERVICESGOODS
COST TIMELINE
ldquoCommitment to Courtesy and Excellence in Service Deliveryrdquo
Any service that does not conform to the above standards or any officer who does
not live up to commitment to courtesy and excellence in Service Delivery should be
reported to
a The PSAccounting OfficerCEOMDPrincipal etc of thePublic
Institutionhelliphelliphelliphelliphelliphelliphelliphelliphelliphelliphelliphelliphelliphelliphelliphelliphelliphellip
b The Ombudsmanhelliphelliphelliphelliphelliphelliphelliphelliphelliphelliphelliphellip
( hot lines should be provided in both cases)
165
Appendix V Development Expenditure as percent of Total Expenditure
Year
Total
Expenditure
(KShs)
Development
Exp (Ksh)
of
Total
1985 23460315340 6465672280 2756
1960 1986 24251325220 6181978960 2549
1961 1987 32047230000 9243656600 2884
1962 1988 35085856880 8172045840 2329
1963 1989 25198432660 8137262760 3229
1964 1172514580 304853540 2600 1990 46597584460 15253518460 3273
1965 1293680940 293489420 2269 1991 52062813760 16554960120 3180
1966 1451390600 313083420 2157 1992 49192306140 12997333480 2642
1967 1520725720 354863860 2334 1993 60444018440 17028725780 2817
1968 1762987760 421116880 2389 1994 77100084320 20536529560 2664
1969 1982475480 517499200 2610 1995 101197860140 26128312520 2582
1970 2361298140 645595900 2734 1996 117168533300 27687733540 2363
1971 2925507060 951134580 3251 1997 127793434640 27318969900 2138
1972 3515487500 1076110060 3061 1998 143768064220 24143694540 1679
1973 3947293760 1261806400 3197 1999 158176703040 20293558020 1283
1974 4486642320 1353172740 3016 2000 144179487740 19581211360 1358
1975 5738597500 1853214120 3229 2001 198518350917 33366819993 1681
1976 7044472220 2492318720 3538 2002 204554850864 27821518058 1360
1977 7772655300 2455179240 3159 2003 219744483248 32529594082 1480
1978 12052295900 4917358520 4080 2004 250629375925 36188116860 1444
1979 13198473140 4401866620 3335 2005 280226382275 40181462390 1434
1980 14742599440 4640910260 3148 2006 336719420465 61812300804 1836
1981 17408358340 5657858600 3250 2007 407946769898 105839813298 2594
1982 19978315720 5842147120
2924
2008
32815607394
42
653430948415
1983 19607417640 4653162580 2373
1984 21533866490 5559417430 2582
Source Ministry of Finance
166
Appendix VI Development Expenditure vs GDP Growth at Market Prices
Source Ministry of Finance Auditor- General
-10
-5
0
5
10
15
20
-
20
40
60
80
100
120
GD
P a
t M
ark
et P
rice
s (P
erec
ent)
Dev
elop
men
t E
xp
end
itu
re (
Bil
lion
s K
Sh
s)
Calender Years
Development Expenditure
167
Appendix VII GDP Trend
GDP
growth
rate (at
factor
cost)
GDP
growth
rate (at
mkt
price)
1960 1985 51 18
1961 1986 55 96
1962 1987 49 75
1963 1988 51 64
1964 68 69 1989 51 66
1965 24 26 1990 42 36
1966 105 103 1991 21 17
1967 46 58 1992 05 -05
1968 77 90 1993 02 20
1969 64 82 1994 30 34
1970 69 113 1995 48 50
1971 57 91 1996 46 50
1972 65 146 1997 24 03
1973 65 20 1998 18 34
1974 41 93 1999 14 21
1975 12 -48 2000 -02 05
1976 56 04 2001 12 45
1977 86 98 2002 12 05
1978 77 100 2003 31 29
1979 50 12 2004 39 51
1980 40 45 2005 52 58
1981 60 15 2006 56 64
1982 39 25 2007 62 71
1983 25 -10 2008 09 17
1984 09 37
Source Ministries of Finance and Planning
168
Appendix VIII Economic Growth (percent 2001-2010)
Source Performance Evaluation results Office of the Prime Minister
0
1
2
3
4
5
6
7
8
2002 2003 2004 2005 2006 2007 2008 2009 2010
04
28
43
58
63
71
17
26
56
Appendix VII Economic Growth (percent 2002 ndash 2010)
Year
169
Appendix IX Public Service Aggregate Performance
Source Performance Evaluation results Office of the Prime Minister
Mea
n C
om
po
site
Sco
rin
g
0355
0360
0365
0370
0375
0380
0385
0390
0395
200506 200607 200708 200809 200910 201011
170
Appendix X Economic Performance for selected Countries
No Country Area
Sqkm
Popul
(mil)
GDP
(US$
TrilBil)
GDP
Per
Capita
(US$)
Life
Exp
(Yrs)
Unemployment
Below
poverty
line
1 Japan 377915 127 5981 Tri 46973 83 36 16
2 UK 242900 63 2450 Tri 39459 80 69 14
3 S Korea 99678 49 1164 Tri 31753 81 35 15
4 Singapore 697 54 277 bil 51709 82 18 NA
5 Malaysia 329750 25 304 Bil 10304 74 31 38
DRC 2345410 696 667 Bil 237 46 NA 71
Tanzania 945078 477 249 Bil 578 59 NA 36
Lesotho 30355 254 2448 Bil 1380 49 25 573
Kenya 582650 40 379 Bil 1008 60 42 50
Nigeria 923768 160 5099 Bil 1631 53 279 70
S Africa 1219090 549 408 Bil 8078 56 247 50
SourceCIA World Factbook 2013 Lesotho MDG Report 2013
171
Append XI Previous Related Studies
1 2 3 4
Researcher Kai Chieh HU Assistant
Professor Department of
Business Administration
Soochow University Taipei
Taiwan
William JEN Professor
Department of Transportation
Technology and Management
National Chiao Tung University
Hsinchu Taiwan
Eugene W Anderson Claes
Fornell amp Roland T Rust
School of Business
Administration The University
Michigan Ann Arbor
Michigan 48109-1234
Owen Graduate School of
Management Vanderbilt
University Nashville
Tennessee 37203
Hudson Moloto Maila Public
Management University of South
Africa
Adams B Steven Yan Dong
Martin Dresner Robert H
Smith School of Business
University of Maryland
College Park MD 20742
Study Exploring the Antecedents of
Satisfaction and Loyalty for
Freight Shipping Industry in
Taiwan From the Viewpoint of
Business Customers
To investigate whether there are
conditions under which there
are tradeoffs between customer
satisfaction and firm
productivity
Performance management and
service delivery in the Department
of water affairs and forestry
(DWAF)
Investigate the linkages
between customer service
customer satisfaction and firm
performance in the US airline
industry
Year 2010 1994 2006 2012
Objective Establish the effects of service
quality and relational
performance on customer
satisfaction and loyalty in a
business-to-business context
Establish the links between
customer satisfaction and
productivity
Establish the role of performance
management as a pre-condition for
organizational performance and
improved public service delivery
To investigate moderating
variables that may influence the
linkage between customer
satisfaction and performance
notably market power and
market concentration
Methodolo
gy
Adopted business customers
of freight shipping companies
in Taiwan as its sample
Collected data via a self-
administered questionnaire
Structural equation modeling
was used to verify the fitness of
Used measures of customer
satisfaction provided by the
Swedish Customer Satisfaction
Barometer from 1989 to
1992Tradeoffs hypothesis was
tested using a statistical model
Used a series of methodological
Researcher used empirical data such
as the departmental strategic plan
and the annual report official and
unofficial documents in the
department articles as well as
newspaper reports in order to do
content analysis The information
Used a model that first
estimates complaints and then
the estimated value for
complaints is used in the second
equation in a two stage least
square (2SLS) methodology
that corrects for the
172
the theoretical model and the
causal relationships and inputs
among variables
approaches to address potential
sources of bias for example to
control for unobserved fixed
effects the efficacy of
transforming the specifications
in the model was considered p-
differencing was considered to
investigate the possibility of
serial correlation and the
instrumental variables approach
was applied to control for
potential measurement error
and random effects
was spread on a BSC to measure
the organisationlsquos performance in
terms of service delivery to
eliminate biases the researcher
opted to ―complement this with a
strong theoretical base (also termed
the authority argument) and a
coherent convincing argument
based on both empirical evidence
and the researcherlsquos understanding
and logic It is in this articulated
interpretation that the understanding
and explanation of the phenomenon
lie ndash not in the presentation of
organized and rearranged data
(Henning 20047)
endogeneity between the
complaints and the other
customer service measures
Model allowed for
nonlinearities in the relationship
between customer service and
customer satisfaction to account
for diminishing marginal
returns to customer service
Findings Analytical results showed that
customer loyalty was
influenced by the level of
satisfaction
Additionally relational
performance and service quality
are significant predictors of
satisfaction relational
performance is an antecedent of
service quality and satisfaction
and its influence on satisfaction
is greater than that of service
quality
The association between
changes in customer
satisfaction and changes in
productivity is positive for
goods but negative for
services While both customer
satisfaction and productivity are
positively associated with
Return on Investment (ROI) for
goods and services the
interaction between the two is
positive for goods but
significantly less so for
services This means that
simultaneous attempts to
increase both customer
satisfaction and productivity are
likely to be more challenging in
The conclusion drawn by the
researcher is that the introduction of
performance management in
DWAF has not brought about the
desired impact on service delivery
Market concentration
moderates the relationship
between satisfaction and
profitability for US airlines
Airlines that operate in
concentrated markets have
fewer incentives to satisfy their
customers than airlines that
operate in more competitive
markets
173
service oriented operations
This implies further that
services exhibit ―tradeoffs
while goods do not given that
the increases (decreases) in
customer satisfaction are
associated with decreases
(increases) in productivity for
services
Gaps to be
filled
Establishing effect of
organizational performance on
customer satisfaction
Exploring other antecedents to
and predictors of customer
satisfaction
Establishing the effect of
selected intervening and
mediating variables on the
linkage between customer
satisfaction and productivity
Establishing that performance
measurement leads to performance
improvement which leads in turn
to higher customer satisfaction
Introducing different
intervening and moderating
variables on relationship
between customer satisfaction
and performance
Establishing that the converse
obtains that is performance
affects customer satisfaction