Performance Comparisons for Mobile County Schools Public Affairs Research Council of Alabama...
66
Performance Comparisons for Mobile County Schools Public Affairs Research Council of Alabama November 4, 2010
-
Upload
desmond-janet -
Category
Documents
-
view
215 -
download
2
Transcript of Performance Comparisons for Mobile County Schools Public Affairs Research Council of Alabama...

Performance Comparisons for Mobile County Schools
Public Affairs Research Council of Alabama November 4, 2010

The PARCA Approach
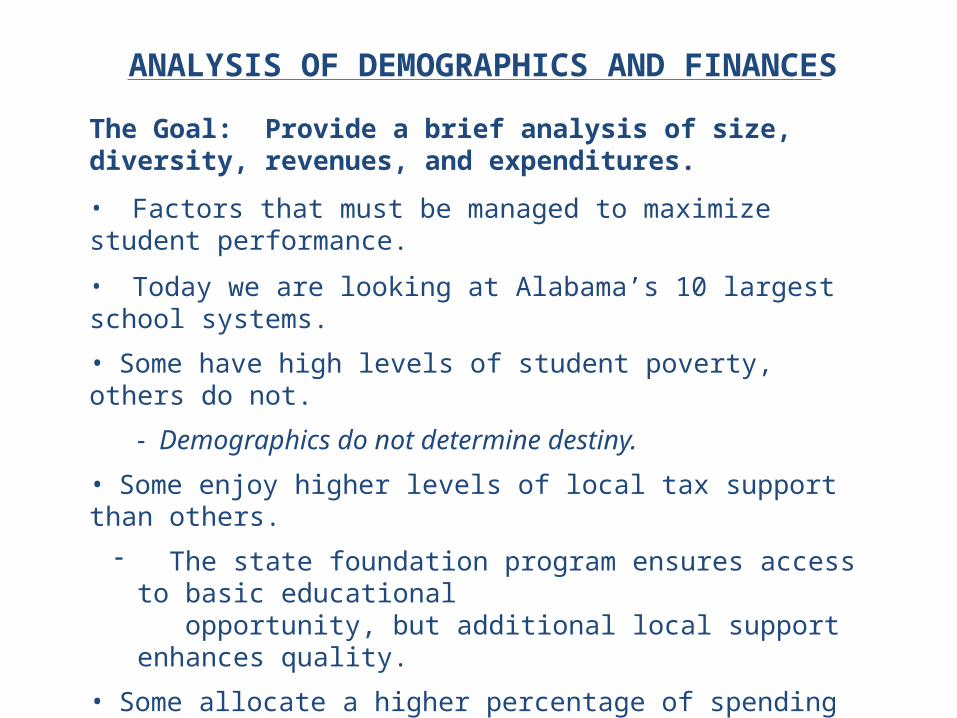
ANALYSIS OF DEMOGRAPHICS AND FINANCES
The Goal: Provide a brief analysis of size, diversity, revenues, and expenditures.
• Factors that must be managed to maximize student performance.
• Today we are looking at Alabama’s 10 largest school systems.
• Some have high levels of student poverty, others do not.
- Demographics do not determine destiny.
• Some enjoy higher levels of local tax support than others.- The state foundation program ensures access to basic educational
opportunity, but additional local support enhances quality.
• Some allocate a higher percentage of spending to instructional activities than others.
ANALYSIS OF ARMT RESULTS
The Goal: Engage the System and Community in a process focused on improving student performance.
• A positive process that celebrates successes while recognizing areas of focus for improvement.• Two important principles:
1. All students can learn at high levels. Demographics do not determine destiny.
- Set expectations high.
- Develop improvement goals.
2. All schools can improve. Every performance number can change for the better. Labels are inappropriate.
- Recognize where we are at the start of the process.
- Focus on how to improve from there.
THE WAY WE LOOK AT THE DATA
The Method: Easily Understood Comparisons
• The best way to engage the community: comparisons all can understand.
- Straightforward comparisons create common understanding.
- Complicated methods deny transparency.
- Recognizing multiple levels of performance avoids labeling.• Data are readily available, but improvement-oriented perspectives are scarce.
- Measure where we are, in terms of high expectations.
- Celebrate successful performance.
- Use the data to raise questions and suggest where to focus.
- Set goals for improvement.

ANALYZING STUDENT PERFORMANCE
The Focus: Subgroup Performance
• Subgroup analysis ensures that we focus on success for all students.
- Goal: Close the gaps between subgroups,
- By bringing all performance to the highest level.• Focus first on the major student subgroups in the school system.
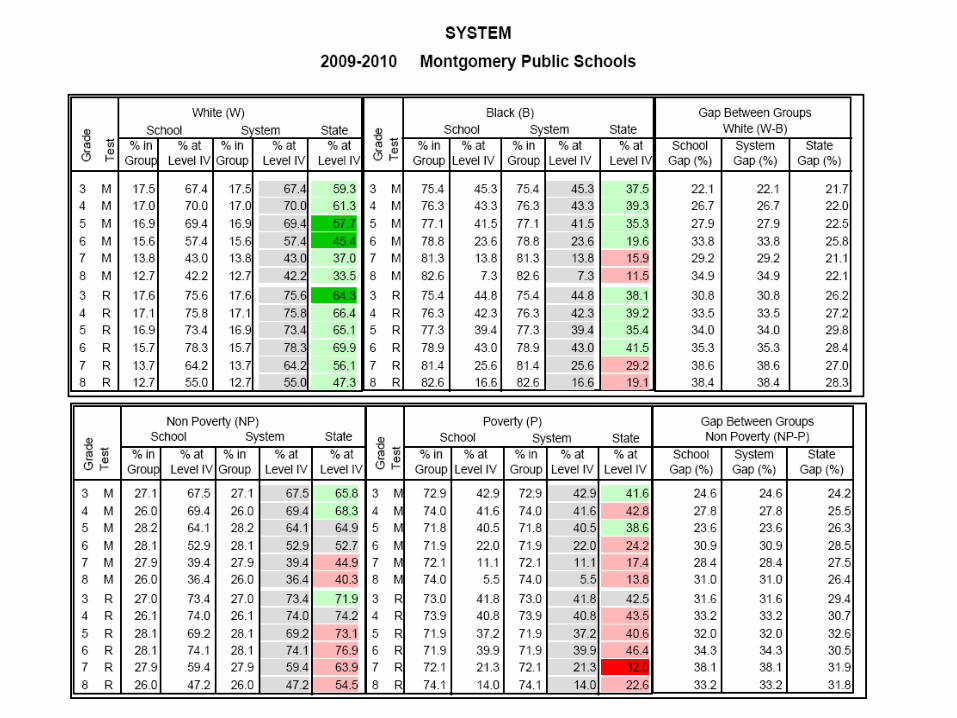
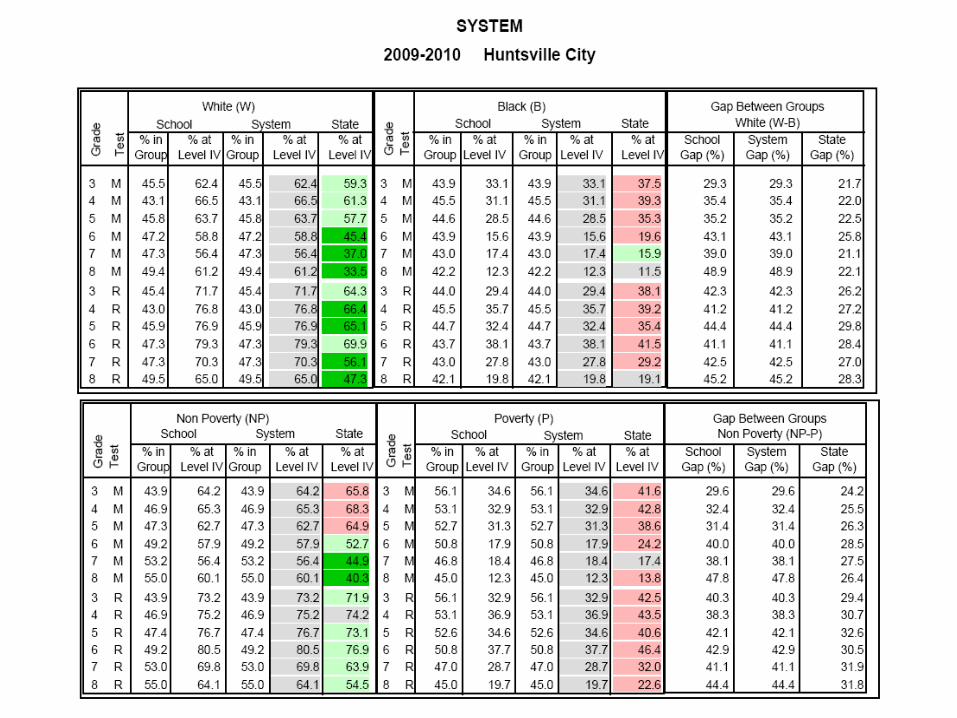
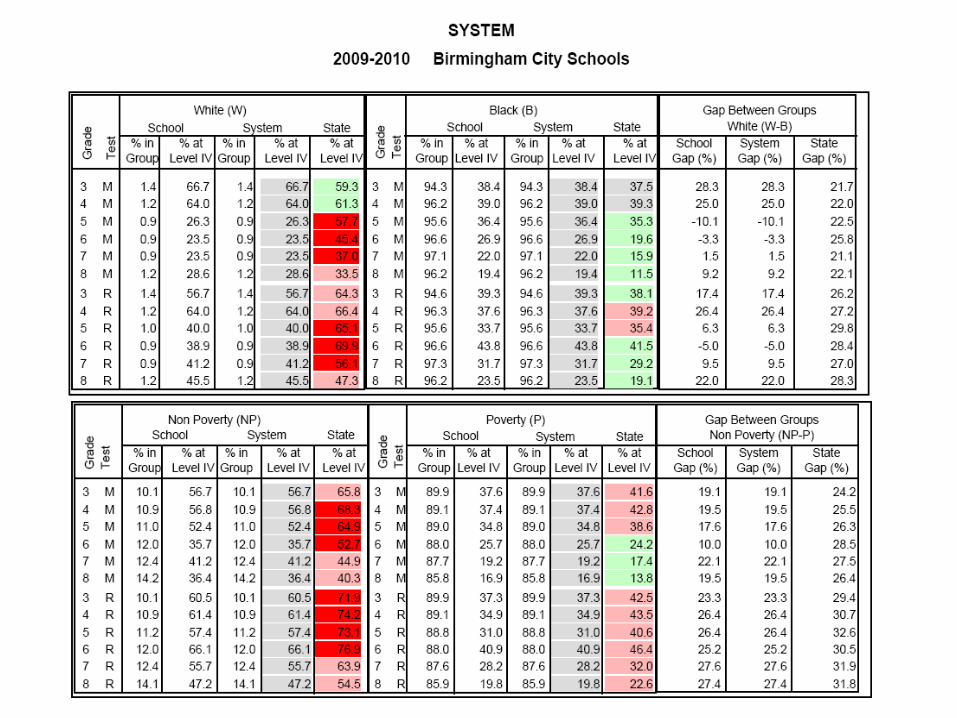
- White – Black, Non-Poverty – Poverty are the major subgroups in Alabama.
- Measure each subgroup against its statewide benchmark, as a starting comparison.
- Measure the gaps between subgroups in the same way.
- Move to higher benchmarks as improvement occurs.
SETTING HIGH STANDARDS
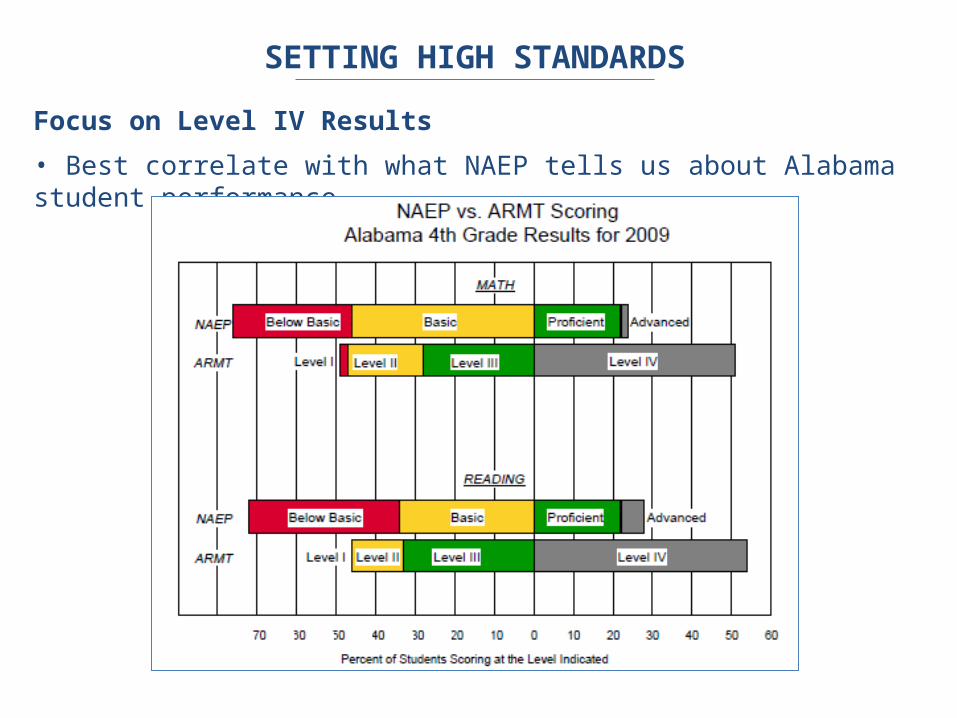
Focus on Level IV Results
• Best correlate with what NAEP tells us about Alabama student performance.
AVOIDING LABELS
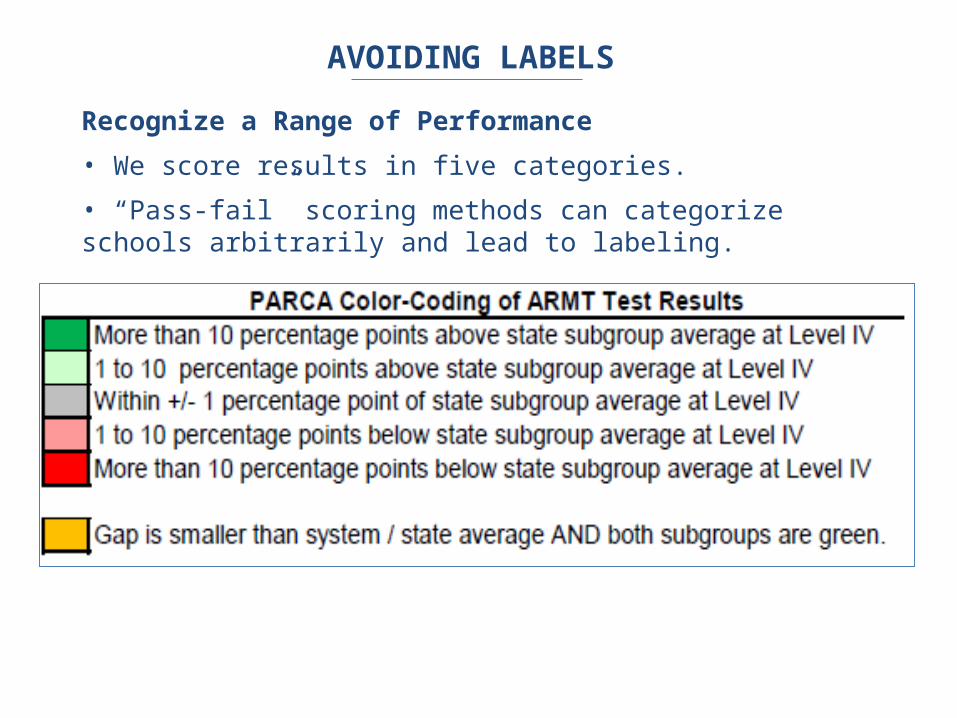
Recognize a Range of Performance
• We score results in five categories.
• “Pass-fail” scoring methods can categorize schools arbitrarily and lead to labeling.

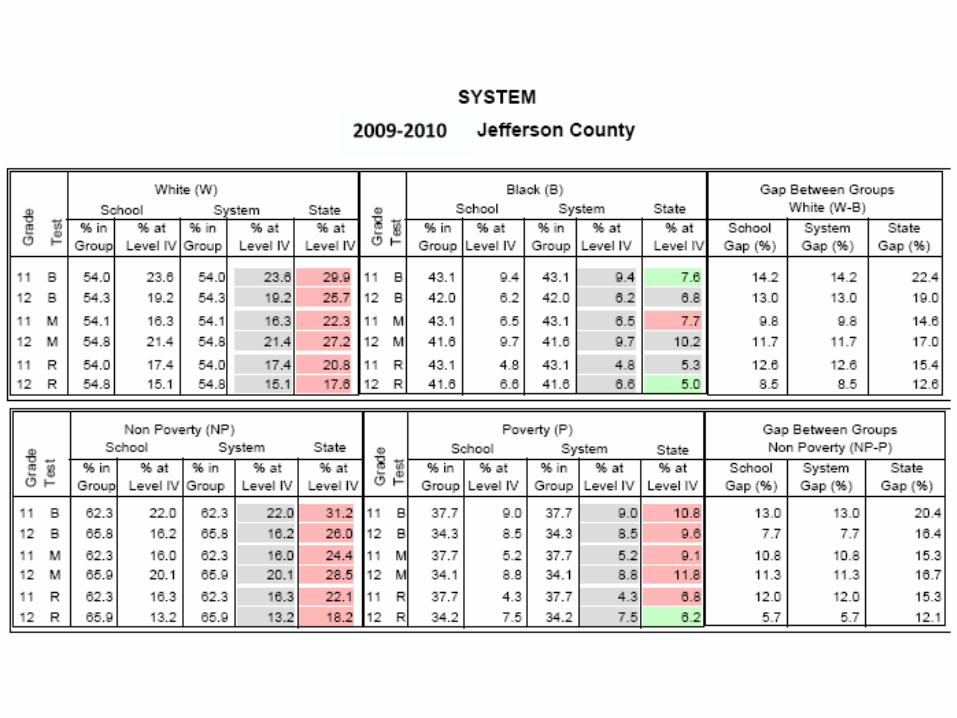
Demographic Comparisons
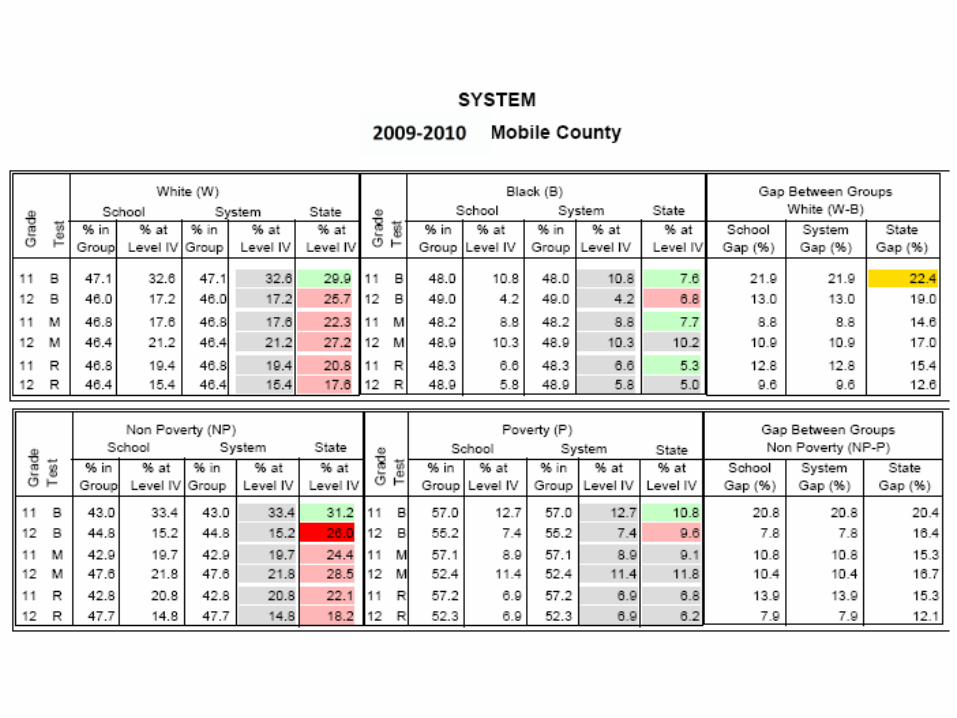
Mobile Co.
Jefferson Co.
Montgomery Co.
Shelby Co.
Baldwin Co.
Birmingham
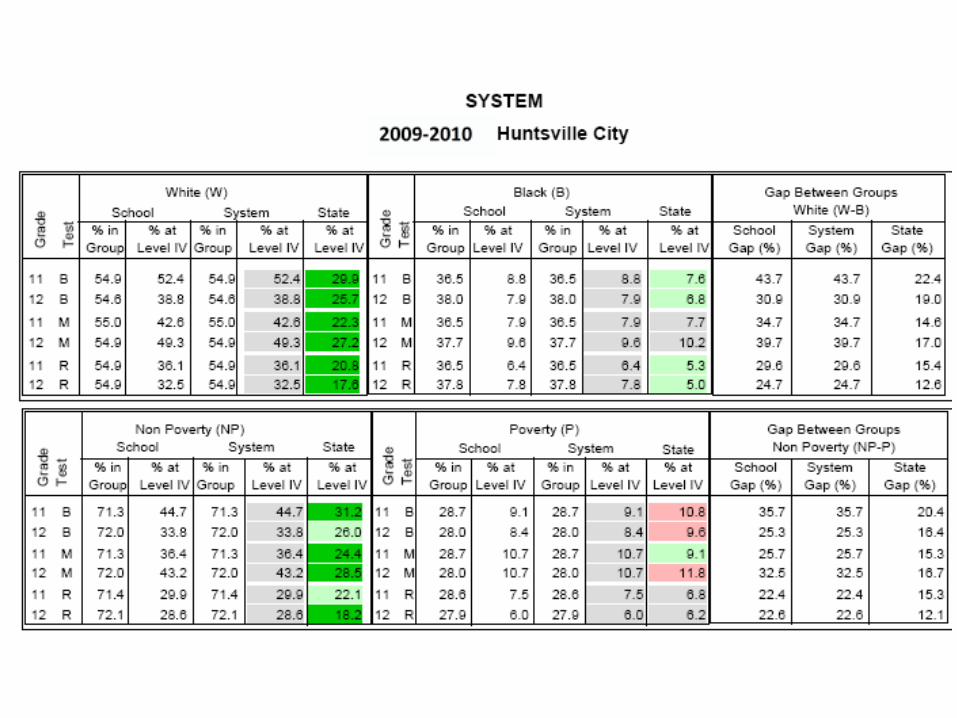
Huntsville
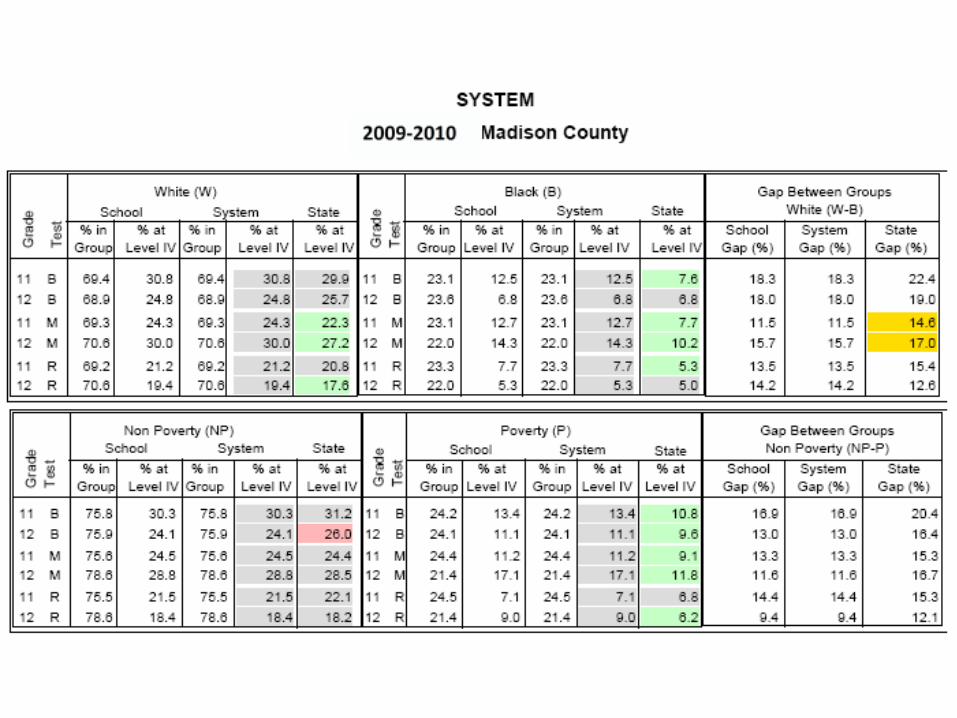
Madison Co.
Tuscaloosa Co.
Hoover
0 10,000 20,000 30,000 40,000 50,000 60,000
Students in ADM, 2010 School Year

Birmingham
Montgomery Co.
Mobile Co.
Tuscaloosa Co.
Jefferson Co.
Huntsville
Baldwin Co.
Madison Co.
Shelby Co.
Hoover
0 10 20 30 40 50 60 70 80 90
Free/Reduced Lunch Percentage, 2010

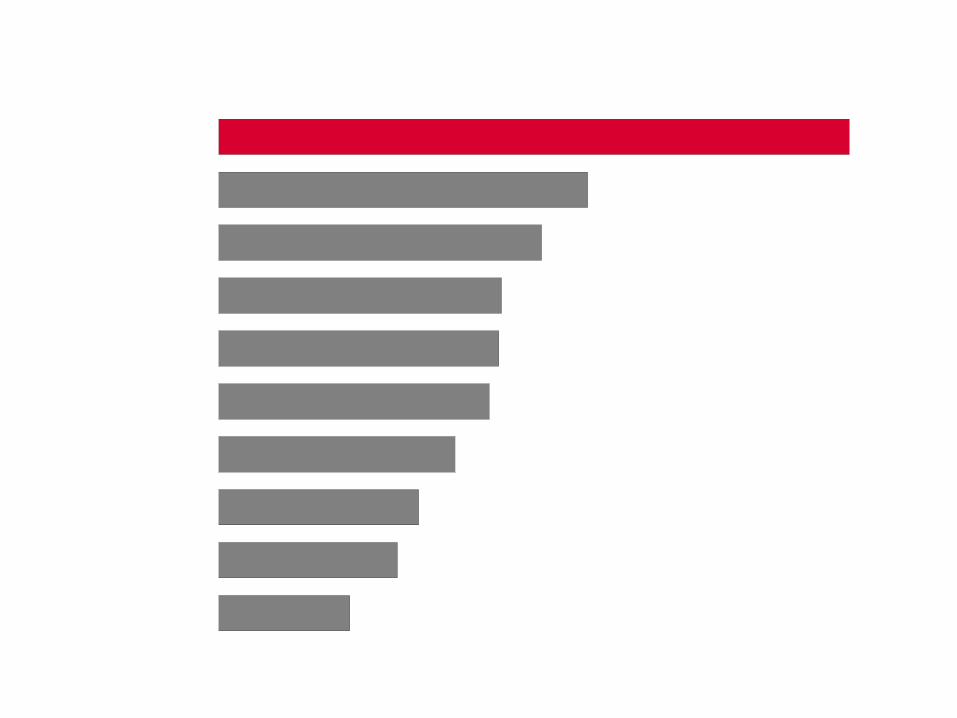
Financial Comparisons
Hoover*
Birmingham
Jefferson Co.
Shelby Co.
Mobile Co.*
Huntsville
Madison Co.
Baldwin Co.*
Montgomery Co.
Tuscaloosa Co.
0 10 20 30 40 50
Local Property Tax Rates for Schools
*Higher of 2 tax districts.

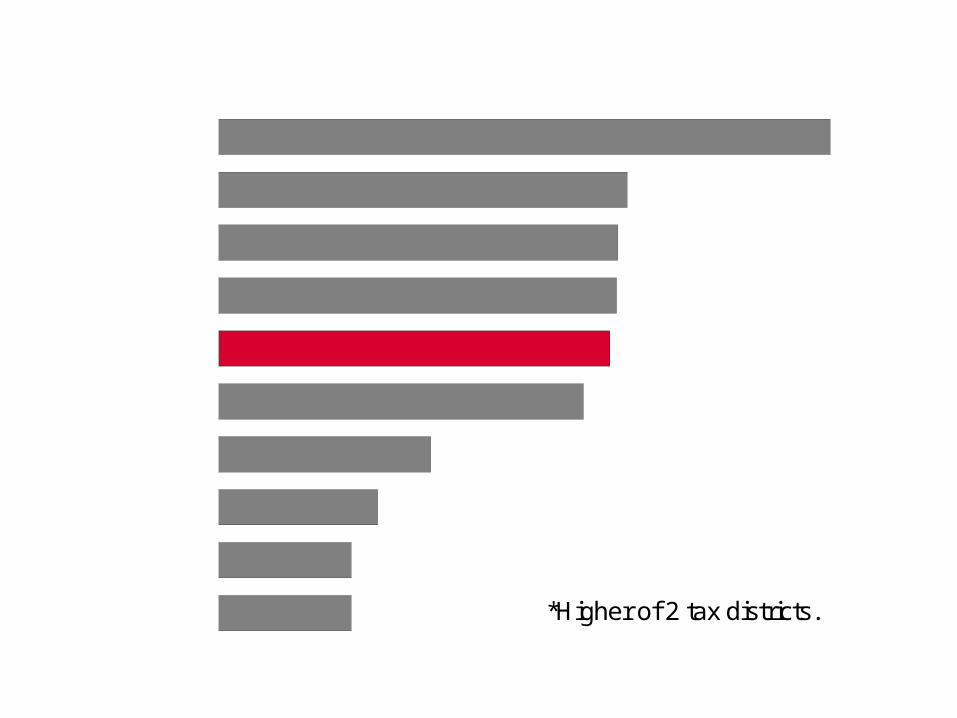
Hoover
Birmingham
Huntsville
Mobile Co.
Jefferson Co.
Montgomery Co.
Shelby Co.
Baldwin Co.
Madison Co.
Tuscaloosa Co.
$0$1,000
$2,000$3,000
$4,000$5,000
$6,000$7,000
$8,000$9,000
$10,000
Core Expenditures Per Student, 2010

Central Administration4.4% Facil ity O & M
10.3%
Instructional Support19.0%
Instruction66.3%
Typical System at $7,998 Core Spending Level(85 / 15)

Central Administration6.4%
Facil ity O & M13.6%
Instructional Support15.6%
Instruction64.4%
Mobile Co. at $8,143 Spending Level(81 / 19)

Tuscaloosa Co.
Shelby Co.
Jefferson Co.
Madison Co.
Baldwin Co.
Huntsville
Montgomery Co.
Hoover
Birmingham
Mobile Co.
50 60 70 80 90
Instruction-Related Expenditure Percentage, 2010

System-Level ARMT Comparisons

Mobile vs. State Benchmarks
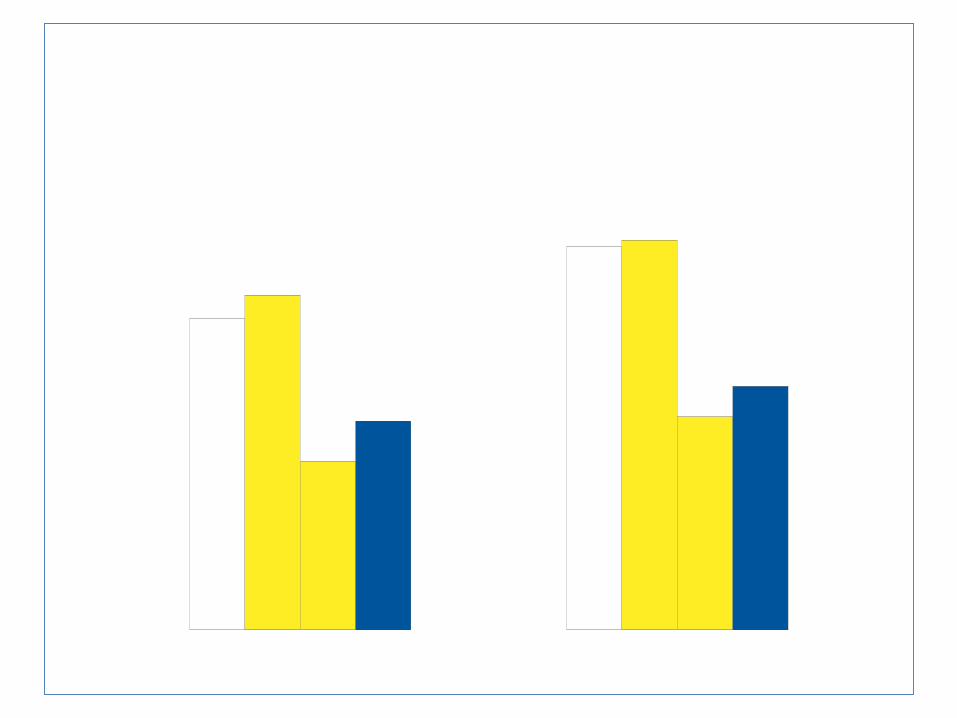
Math Reading0
10
20
30
40
50
60
70
80 Non-Pov State Non-Pov Mobile Co Pov State Pov Mobile Co
2010 ARMT Results in Math and ReadingPercent of Students at Level IV, Grades 3-8

Gr. 3 Gr. 4 Gr. 5 Gr. 6 Gr. 7 Gr. 80
10
20
30
40
50
60
70
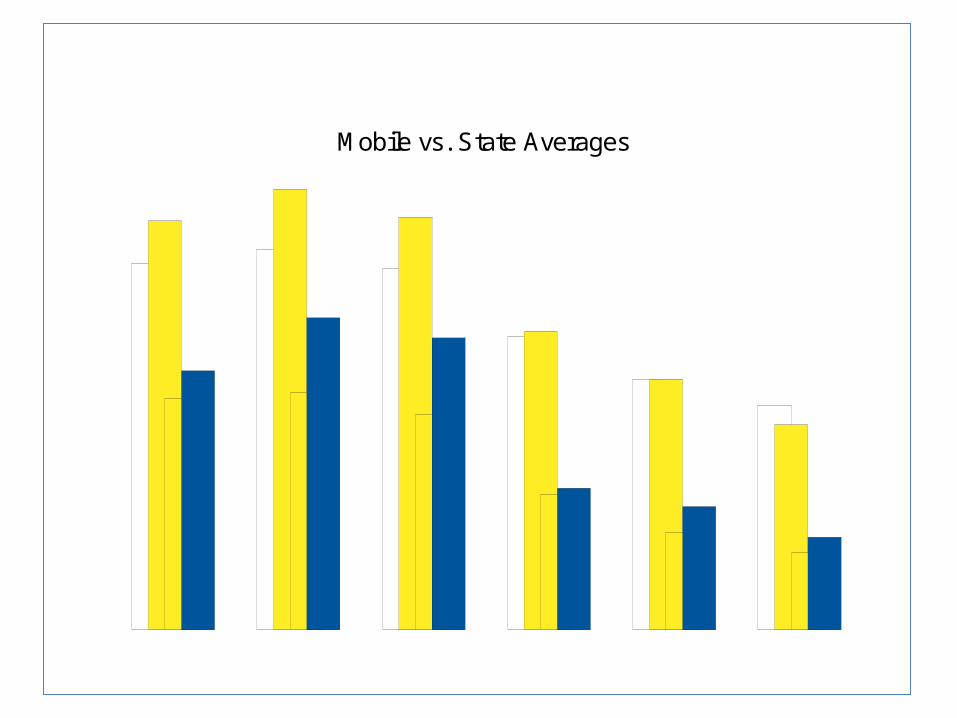
80 White State White Mobile Black State Black Mobile
2010 ARMT Results in MathPercent of Students at Level IV
Mobile vs. State Averages
Gr. 3 Gr. 4 Gr. 5 Gr. 6 Gr. 7 Gr. 80
10
20
30
40
50
60
70
80
Non-Pov State Non-Pov Mobile Pov State Pov Mobile
2010 ARMT Results in MathPercent of Students at Level IV
Mobile vs. State Averages

Gr. 3 Gr. 4 Gr. 5 Gr. 6 Gr. 7 Gr. 80
10
20
30
40
50
60
70
80
White State White Mobile BlackState Black Mobile
2010 ARMT Results in ReadingPercent of Students at Level IV
Mobile vs. State Averages

Gr. 3 Gr. 4 Gr. 5 Gr. 6 Gr. 7 Gr. 80
10
20
30
40
50
60
70
80
Non-Pov State Non-Pov Mobile Pov State Pov Mobile
2010 ARMT Results in ReadingPercent of Students at Level IV
Mobile vs. State Averages
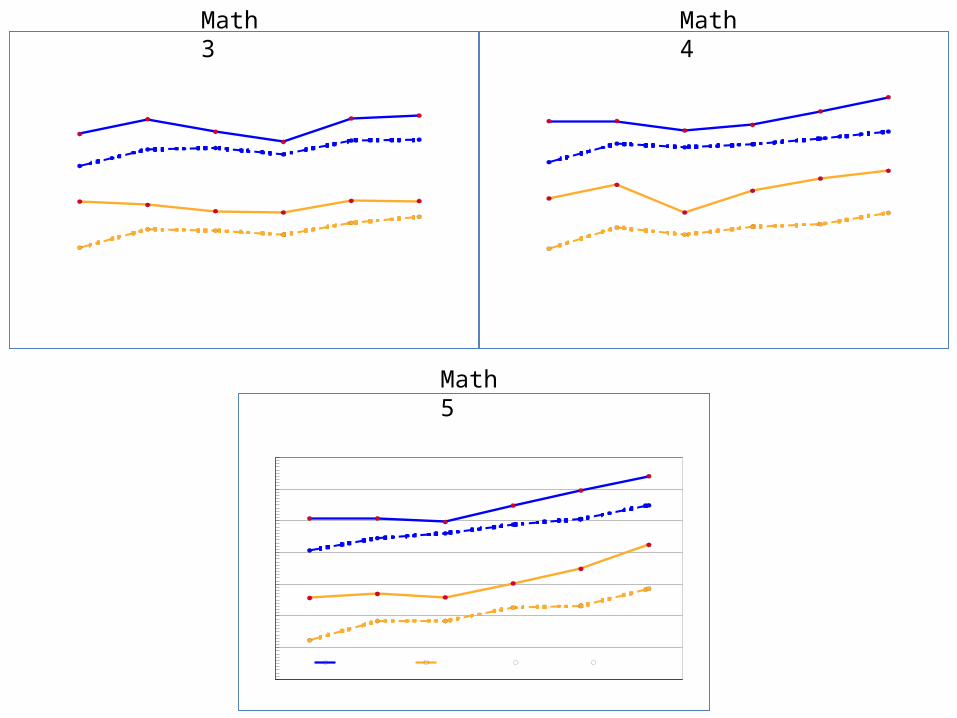
Math 3 Math 4
Math 5
2005 2006 2007 2008 2009 201010
20
30
40
50
60
70
80
Mobile Co N-P Mobile Co P State N-P State P
Trend in ARMT Results for MathPercent of 3rd Graders at Level IV
2005 2006 2007 2008 2009 201010
20
30
40
50
60
70
80
Mobile Co N-P Mobile Co P State N-P State P
Trend in ARMT Results for MathPercent of 4th Graders at Level IV
2005 2006 2007 2008 2009 201010
20
30
40
50
60
70
80
Mobile Co N-P Mobile Co P State N-P State P
Trend in ARMT Results for MathPercent of 5th Graders at Level IV

Math 6 Math 7
Math 8
2005 2006 2007 2008 2009 20100
10
20
30
40
50
60
70Mobile Co N-P Mobile Co P State N-P State P
Trend in ARMT Results for MathPercent of 6th Graders at Level IV
2005 2006 2007 2008 2009 20100
10
20
30
40
50
60
70Mobile Co N-P Mobile Co P State N-P State P
Trend in ARMT Results for MathPercent of 7th Graders at Level IV
2005 2006 2007 2008 2009 20100
10
20
30
40
50
60
70Mobile Co N-P Mobile Co P State N-P State P
Trend in ARMT Results for MathPercent of 8th Graders at Level IV
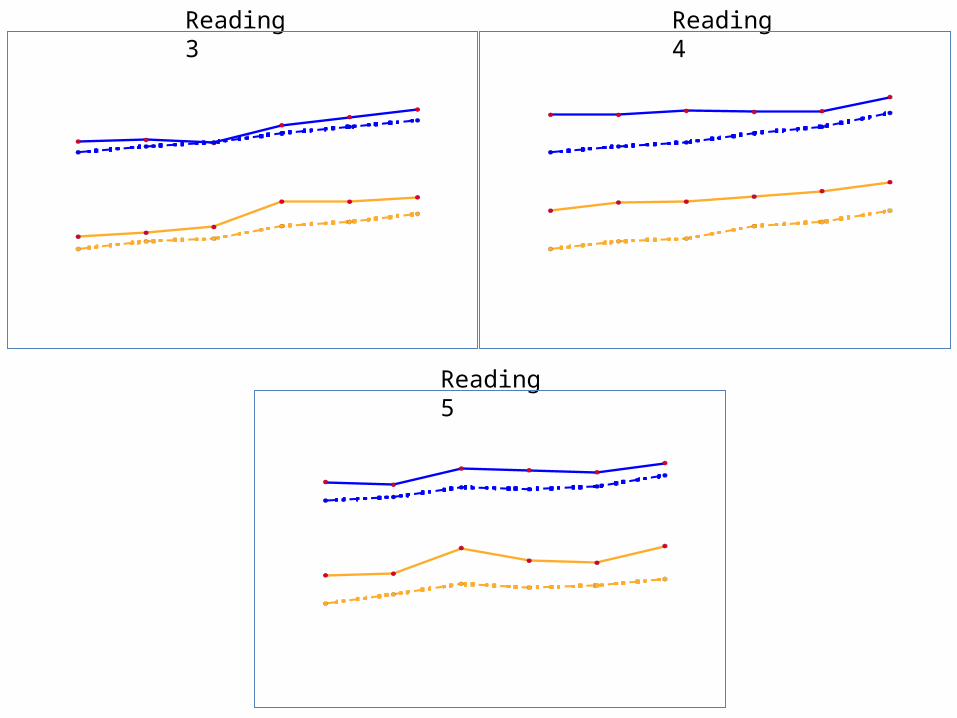
Reading 3 Reading 4
Reading 5
2005 2006 2007 2008 2009 201010
20
30
40
50
60
70
80
Mobile Co N-P Mobile Co P State N-P State P
Trend in ARMT Results for ReadingPercent of 3rd Graders at Level IV
2005 2006 2007 2008 2009 201010
20
30
40
50
60
70
80
Mobile Co N-P Mobile Co P State N-P State P
Trend in ARMT Results for ReadingPercent of 4th Graders at Level IV
2005 2006 2007 2008 2009 201010
20
30
40
50
60
70
80
Mobile Co N-P Mobile Co P State N-P State P
Trend in ARMT Results for ReadingPercent of 5th Graders at Level IV
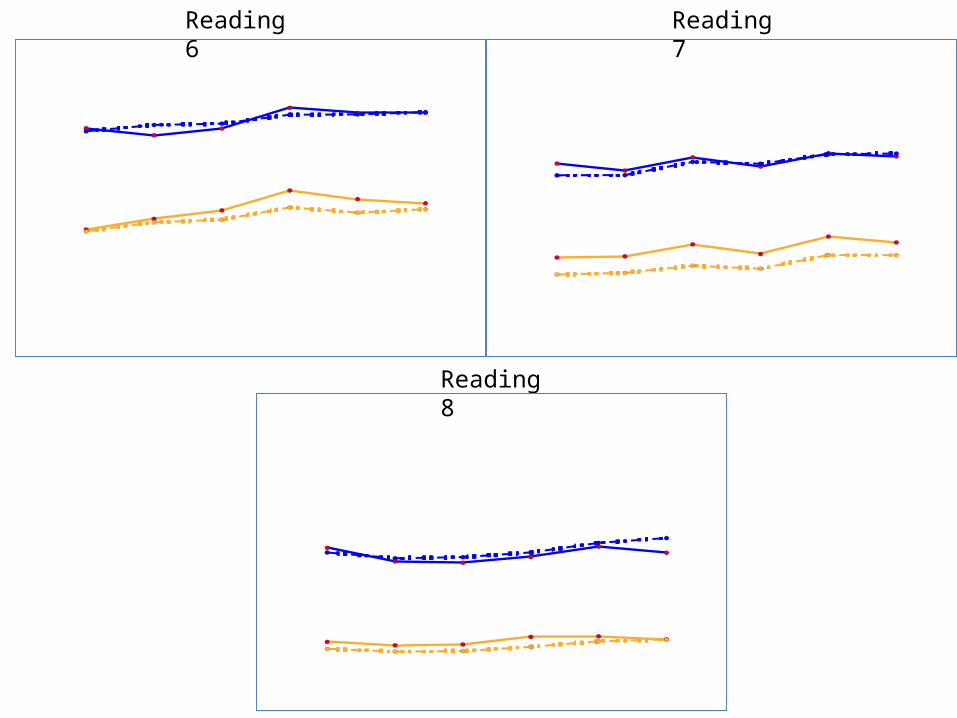
Reading 6 Reading 7
Reading 8
2005 2006 2007 2008 2009 201010
20
30
40
50
60
70
80
Mobile Co N-P Mobile Co P State N-P State P
Trend in ARMT Results for ReadingPercent of 6th Graders at Level IV
2005 2006 2007 2008 2009 201010
20
30
40
50
60
70
80
Mobile Co N-P Mobile Co P State N-P State P
Trend in ARMT Results for ReadingPercent of 7th Graders at Level IV
2005 2006 2007 2008 2009 201010
20
30
40
50
60
70
80Mobile Co N-P Mobile Co P State N-P State P
Trend in ARMT Results for ReadingPercent of 8th Graders at Level IV

Mobile vs. Other Systems


Baldwin Co. (42% FRL)
Madison Co. (31% FRL)
Hoover (19% FRL)
Mobile Co. (68% FRL)
Shelby Co. (29% FRL)
Montg'y Co. (71% FRL)
Huntsville (46% FRL)
Birmingham (86% FRL)
Jefferson Co. (47% FRL)
Tuscaloosa Co. (51% FRL)
0%10%
20%30%
40%50%
60%70%
80%90%
100%
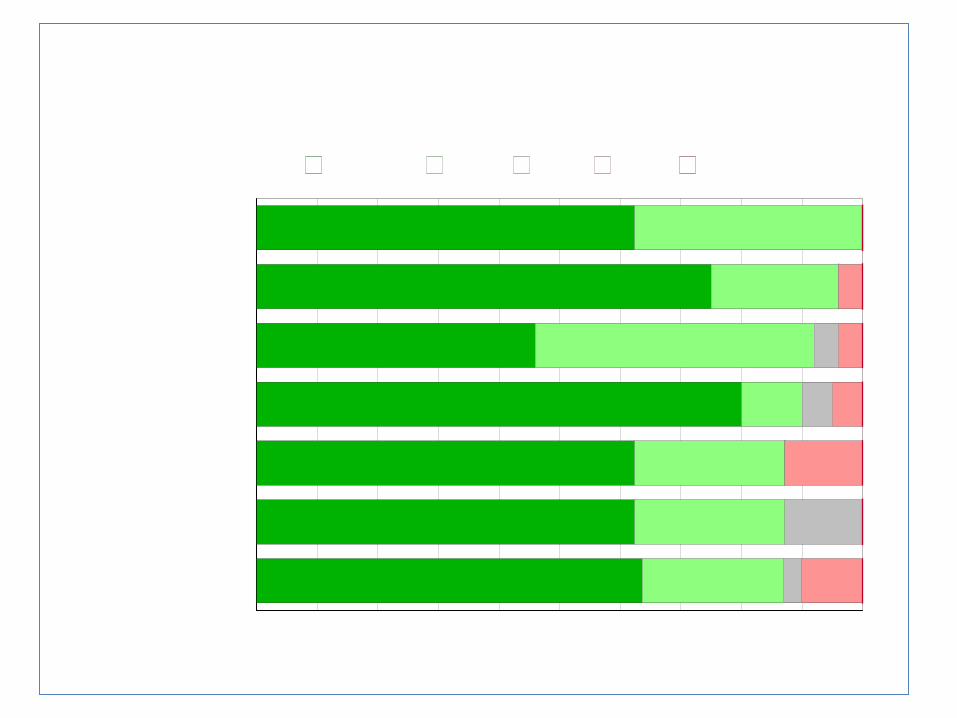
10+ Above Above Equal Below 10+ Below
2010 ARMT Results at Level IVSystem Compared to State Benchmarks

SUMMARY OF ARMT RESULTS FOR GRADES 3-5, SPRING 2010 COMPARISON OF GRADE 3-5 ARMT RESULTS FOR 2008 - 2010Ranked by Percent of Results Above Statewide Subgroup Averages ("Green") Percent of Results Above Statewide Subgroup Averages ("Green")
School Results for All Four Student SubgroupsSystems Green Gray Red Total % Green Gold % Gold
Mobile Co. 24 0 0 24 100% 11 92%Baldwin Co. 21 0 3 24 88% 7 58%Madison Co. 18 2 4 24 75% 8 67%Montgomery Co. 17 3 4 24 71% 0 0%Hoover 12 4 8 24 50% 0 0%Huntsville 8 1 15 24 33% 0 0%Shelby Co. 7 8 9 24 29% 0 0%Jefferson Co. 5 2 17 24 21% 0 0%Birmingham 4 2 18 24 17% 0 0%Tuscaloosa Co. 0 4 20 24 0% 0 0%

SUMMARY OF ARMT RESULTS FOR GRADES 6-8, SPRING 2010 COMPARISON OF GRADE 6-8 ARMT RESULTS FOR 2008 - 2010Ranked by Percent of Results Above Statewide Subgroup Averages ("Green") Percent of Results Above Statewide Subgroup Averages ("Green")
School Results for All Four Student SubgroupsSystems Green Gray Red Total % Green Gold % Gold
Hoover 23 1 0 24 96% 0 0%Baldwin Co. 20 1 3 24 83% 4 33%Madison Co. 18 4 2 24 75% 5 42%Shelby Co. 18 4 2 24 75% 5 42%Huntsville 13 3 8 24 54% 0 0%Birmingham 9 0 15 24 38% 0 0%Mobile Co. 8 11 5 24 33% 0 0%Montgomery Co. 8 1 15 24 33% 0 0%Jefferson Co. 4 2 18 24 17% 0 0%Tuscaloosa Co. 0 1 23 24 0% 0 0%
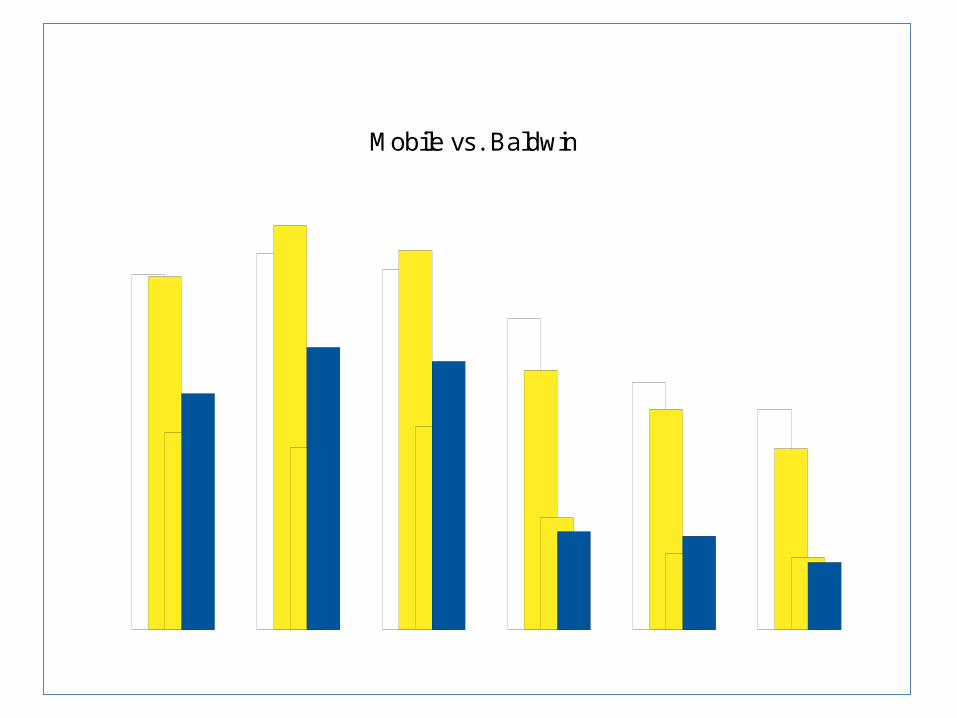
Gr. 3 Gr. 4 Gr. 5 Gr. 6 Gr. 7 Gr. 80
10
20
30
40
50
60
70
80 White Baldwin White Mobile Black Baldwin Black Mobile
2010 ARMT Results in MathPercent of Students at Level IV
Mobile vs. Baldwin
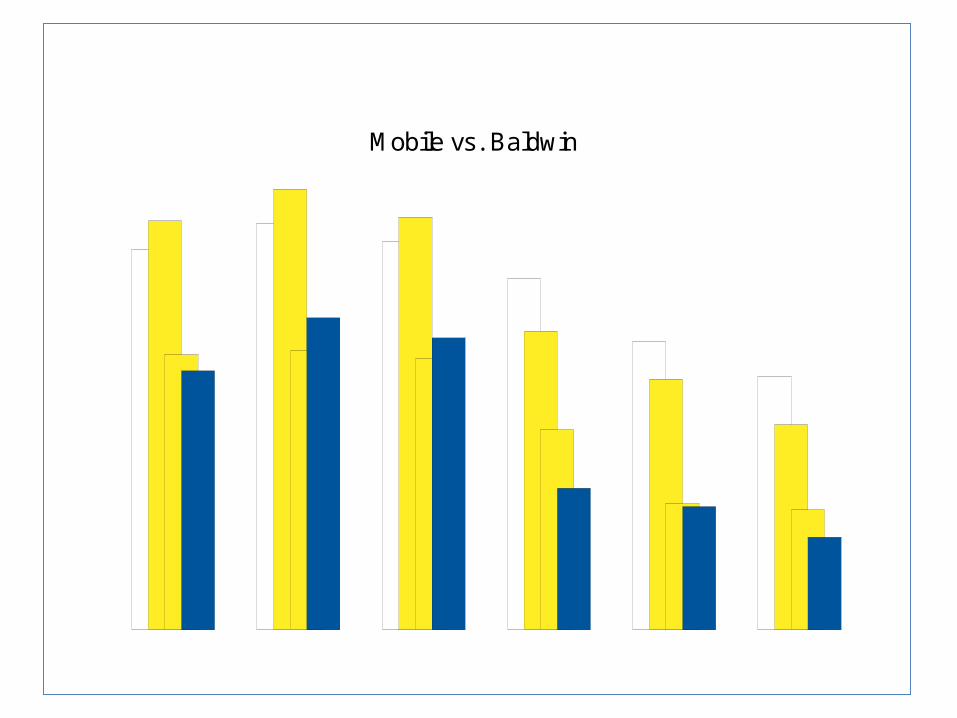
Gr. 3 Gr. 4 Gr. 5 Gr. 6 Gr. 7 Gr. 80
10
20
30
40
50
60
70
80
Non-Pov Baldwin Non-Pov Mobile Pov Baldwin Pov Mobile
2010 ARMT Results in MathPercent of Students at Level IV
Mobile vs. Baldwin
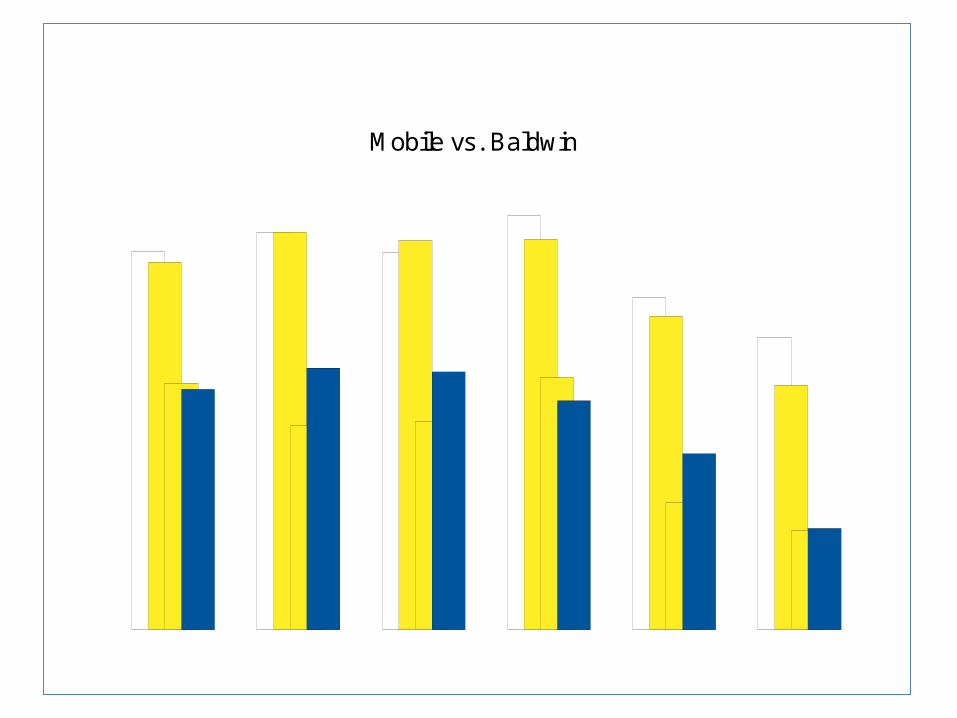
Gr. 3 Gr. 4 Gr. 5 Gr. 6 Gr. 7 Gr. 80
10
20
30
40
50
60
70
80 White Baldwin White Mobile Black Baldwin Black Mobile
2010 ARMT Results in ReadingPercent of Students at Level IV
Mobile vs. Baldwin
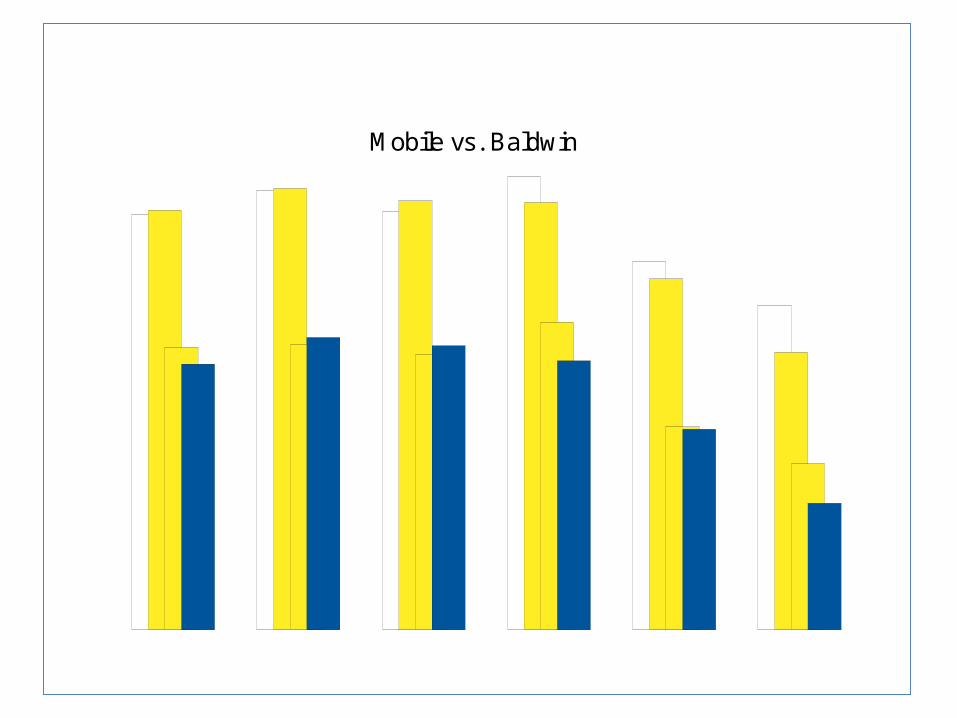
Gr. 3 Gr. 4 Gr. 5 Gr. 6 Gr. 7 Gr. 80
10
20
30
40
50
60
70
80
Non-Pov Baldwin Non-Pov Mobile Pov Baldwin Pov Mobile
2010 ARMT Results in ReadingPercent of Students at Level IV
Mobile vs. Baldwin


School-Level ARMT Comparisons

Chickasaw (3)Clark-Shaw (4-8)
E Coll ier (3-5)G Hall (3-5)
Phil l ips Prep (6-8)W H Council (3-5)
Dickson (3-5)W C Griggs (3-5)Dauphin Is . (3-5)
O'Rourke (3-5)Hutchens (3-5)Holloway (3-5)
McDavid-Jones (3-5)Old Shell Creative (3)
M B Austin (3-5)
0%10%
20%30%
40%50%
60%70%
80%90%
100%
10+ Above Above Equal Below 10+ Below
2010 ARMT Results at Level IV for Mobile Co.Top 20% of Schools Compared to State Benchmarks
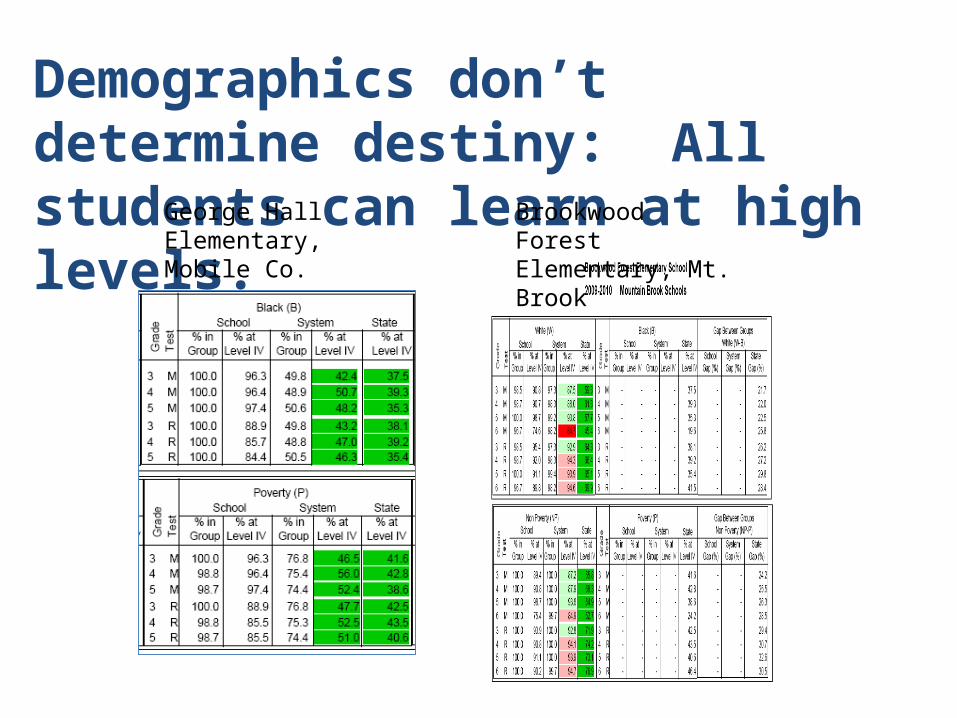
Demographics don’t determine destiny: All students can learn at high levels.
George Hall Elementary, Mobile Co.
Brookwood Forest Elementary, Mt. Brook
Fairhope (4-5)
Spanish Fort (6-8)
Gulf Shores (3-6)
Rockwell (3-5)
Fairhope (6-8)
Fairhope (3)
Elberta (4-8)
0%10%
20%30%
40%50%
60%70%
80%90%
100%
10+ Above Above Equal Below 10+ Below
2010 ARMT Results at Level IV for Baldwin Co.Top 20% of Schools Compared to State Benchmarks

ASHGE Comparisons

Hoover
Huntsvil le
Shelby Co.
Baldwin Co.
Madison Co.
Montgomery Co.
Birmingham
Mobile Co.
Jefferson Co.
Tuscaloosa Co.
0%10%
20%30%
40%50%
60%70%
80%90%
100%
10+ Above Above Equal Below 10+ Below
2010 AHSGE Results at Level IVSystem Compared to State Benchmarks


Enrollment by Grade and Graduates
1st2nd
3rd4th
5th6th
7th8th
9th10th
11th12th
Completers
30,000
40,000
50,000
60,000
70,000 Class of 2007 Class of 2008 Class of 2009 Class of 2010
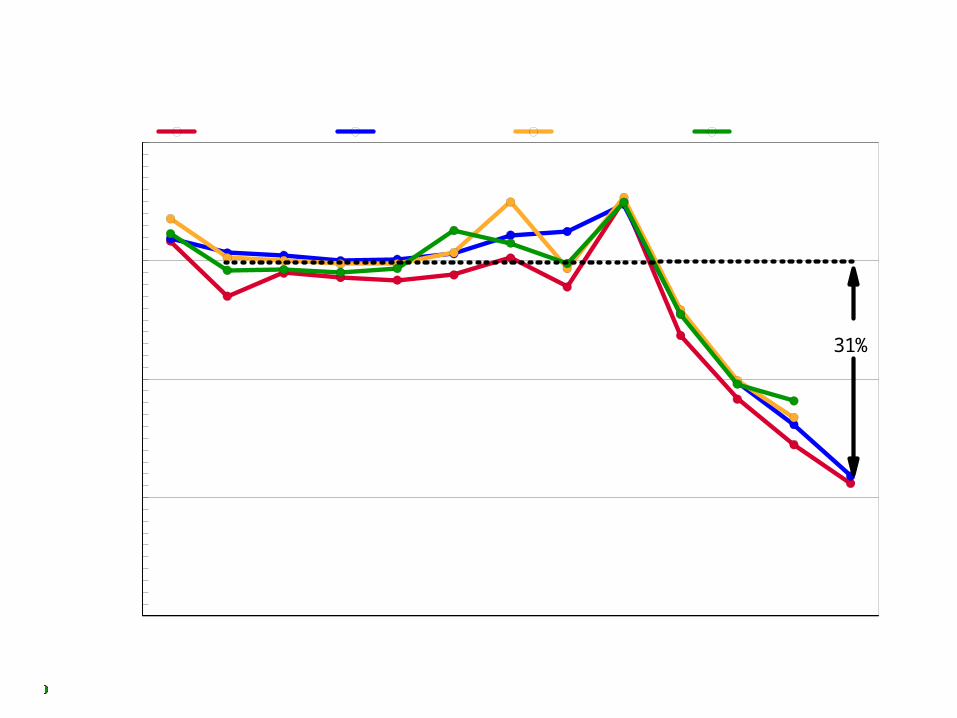
Statewide ADM by Grade and GraduatesLast Four Class Cohorts
31%
1st2nd
3rd4th
5th6th
7th8th
9th10th
11th12th
Completers
1,000
2,000
3,000
4,000
5,000
6,000
7,000 Class of 2007 Class of 2008 Class of 2009 Class of 2010
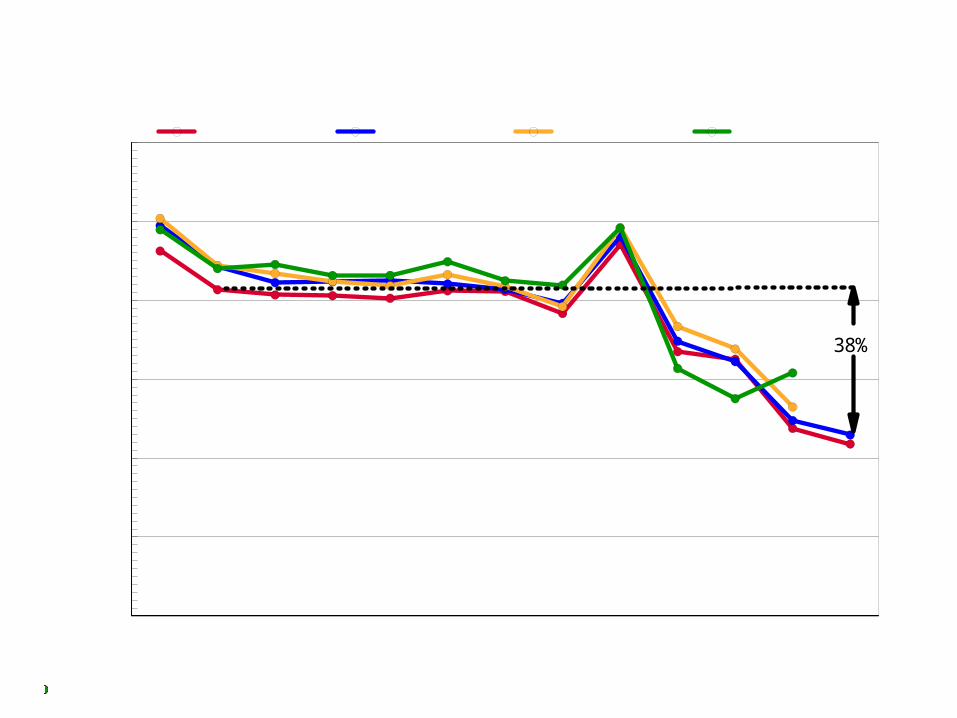
Mobile ADM by Grade and GraduatesLast Four Class Cohorts
38%

http://parca.samford.edu