Performance Based Seismic Design of Reinforced … · International Journal of Engineering Research...
11
International Journal of Engineering Research & Technology (IJERT) ISSN: 2278-0181 Vol. 1 Issue 5, July - 2012 Performance Based Seismic Design of Reinforced Concrete Bridges Bhruguli Gandhi 1 , Dr.B.J.Shah 2 1 P. G. Student, Applied Mechanics Department, 2 Associate Professor, Applied Mechanics Department, L. D. College of Engineering, Ahmedabad ABSTRACT For earthquake resistant design, performance Based Design (PBD) is a modern approach. It is an attempt to evaluate the performance of structure under unexpected seismic events. PBD is the extension of limit-state design to cover the complex range of issues such as excessive displacement, rotation, damages, functionality etc. The PBD can be performed on new as well as existing bridges. The performance of such bridges in the event of earthquake can be evaluated using predictive analysis. This paper presents related aspects of performance based seismic design of new bridges. Performance criteriaprescribed by various agencies of advanced countries in the form of codes and guidelines are discussed in this paper. Nonlinear static pushover analysis is used to determine the capacity of section during earthquake loading. Both ordinary and important bridges are designed as per PBD approach considering different seismic parameters like zone factor and soil types and various design parameters like base shear, base moments, % of reinforcement in the pier etc. are determined and comparison is made in the form of charts and tables. Keywords: bridge, nonlinear analysis, pushover analysis, seismic force, performance based design I Introduction: Good and efficient transportation system is one of the important systemsof networking for any nation. Bridges are important components within the transportation systems. The road bridges are designed in our country as per IRC codes, where working stress method is used. Recently IRC has introduced new code covering limit state design of various components of bridges. While determining the seismic force, IRC has prescribed the same formula as mentioned in IS:1893-2007, except change in response reduction factor. The response reduction factor is one of the important factor in determination of design seismic force, which is mainly decided based on amount of ductility introduced in the structure. The bridges are generally placed in two categories: Ordinary and Important. An Important Bridge is defined as any bridge satisfying one or more of the following: (1) required to provide post-earthquake life safety; such as access to emergency facilities. (2) time for restoration of functionality after closure would create a major economic impact, and (3) formally designated as critical by a local emergency plan, whereas other type is known as ordinary bridge. Considering the importance of bridges, it is essential to adequately design new bridges and assess the response of existing bridges in areas subjected to earthquake hazards. The extensive damage of highway bridges in the 1989 Loma Prieta, 1994 Northridge and 1995 Hyogo-ken Nanbu earthquakes together with the research, triggered as a consequence of the recent earthquakes have led to significant advance in bridge seismic design and retrofitting. For this the traditional seismic coefficient method is being replaced with the ductility design method, which is based on nonlinear analysis of structure. In this paper, a new bridge is designed as per IRC, then nonlinear static pushover analysis is performed to check the desired performance criteria prescribed as per ARC-40 guideline. The revision is made in the design parameters till desired performance criteria satisfy. Both ordinary and important bridges are designed considering variation in different seismic parameters like zone factor, response reduction factor, soil foundation factor and various design parameters like base shear, base moment, % of reinforcement in the pier etc. are evaluated and comparisonis shown in the form of tables and charts. II Performance based design “A Performance based design is a process in which performance requirements are translated and integrated into a bridge design.” These criteria differ from traditional codes in that they correlate levels of damage noted in laboratory testing and real earthquake damage to quantifiable material properties and design parameters. 1 www.ijert.org 1
-
Upload
duongthuan -
Category
Documents
-
view
216 -
download
0
Transcript of Performance Based Seismic Design of Reinforced … · International Journal of Engineering Research...

International Journal of Engineering Research & Technology (IJERT) ISSN: 2278-0181
Vol. 1 Issue 5, July - 2012
Performance Based Seismic Design of Reinforced Concrete Bridges Bhruguli Gandhi
1, Dr.B.J.Shah
2
1P. G. Student, Applied Mechanics Department,
2Associate Professor, Applied Mechanics Department,
L. D. College of Engineering, Ahmedabad
ABSTRACT
For earthquake resistant design, performance Based Design (PBD) is a modern approach. It is an attempt to evaluate the performance of structure under unexpected seismic events. PBD is the extension of limit-state design to cover the complex range of issues such as excessive displacement, rotation, damages, functionality etc. The PBD can be performed on new as well as existing bridges. The performance of such bridges in the event of earthquake can be evaluated using predictive analysis. This paper presents related aspects of performance based seismic design of new bridges. Performance
criteriaprescribed by various agencies of advanced countries in the form of codes and guidelines are
discussed in this paper. Nonlinear static pushover analysis is used to determine the capacity of section during earthquake loading. Both ordinary and important bridges are designed as per PBD approach
considering different seismic parameters like zone factor and soil types and various design parameters
like base shear, base moments, % of reinforcement in the pier etc. are determined and comparison is made in the form of charts and tables. Keywords: bridge, nonlinear analysis, pushover analysis, seismic force, performance based design
I Introduction:
Good and efficient transportation system is one of the important systemsof networking for any nation. Bridges
are important components within the transportation systems. The road bridges are designed in our country as per IRC codes, where working stress method is used. Recently IRC has introduced new code covering limit
state design of various components of bridges. While determining the seismic force, IRC has prescribed the same formula as mentioned in IS:1893-2007, except change in response reduction factor. The response
reduction factor is one of the important factor in determination of design seismic force, which is mainly
decided based on amount of ductility introduced in the structure. The bridges are generally placed in two categories: Ordinary and Important. An Important Bridge is defined as any bridge satisfying one or more of
the following: (1) required to provide post-earthquake life safety; such as access to emergency facilities. (2)
time for restoration of functionality after closure would create a major economic impact, and (3) formally designated as critical by a local emergency plan, whereas other type is known as ordinary bridge. Considering
the importance of bridges, it is essential to adequately design new bridges and assess the response of existing bridges in areas subjected to earthquake hazards. The extensive damage of highway bridges in the 1989 Loma
Prieta, 1994 Northridge and 1995 Hyogo-ken Nanbu earthquakes together with the research, triggered as a
consequence of the recent earthquakes have led to significant advance in bridge seismic design and retrofitting. For this the traditional seismic coefficient method is being replaced with the ductility design method, which is
based on nonlinear analysis of structure. In this paper, a new bridge is designed as per IRC, then nonlinear static pushover analysis is performed to check the desired performance criteria prescribed as per ARC-40 guideline. The revision is made in the design parameters till desired performance criteria satisfy. Both ordinary and important bridges are designed considering variation in different seismic parameters like zone factor, response reduction factor, soil foundation factor and various design parameters like base shear, base moment, % of reinforcement in the pier etc. are evaluated and comparisonis shown in the form of tables and charts.
II Performance based design
“A Performance based design is a process in which performance requirements are translated and integrated into a bridge design.” These criteria differ from traditional codes in that they correlate levels of damage noted in laboratory testing and real earthquake damage to quantifiable material properties and design parameters.
1
www.ijert.org 1

International Journal of Engineering Research & Technology (IJERT) ISSN: 2278-0181
Vol. 1 Issue 5, July - 2012
Seismic design codes currently in use are prescribed-based and focus on the capacity of members satisfying strength and serviceability requirements. Current design methods are limited in designing the structure to a particular seismic load level and not at all the possible load levels. On the other hand, the performance based design approach is objective based rather than the existing design approaches which are prescribed based [Ghobarah 2001]. Using the performance based design approach, bridge columns can be designed to particular damage levels for different earthquake motions. Following are the codes and manuals used for performance based seismic design of bridges. AASHTO: The AASHTO bridge design specifications focused on the following basic concepts: • Hazard to life should be minimized; • Bridges may suffer damage, but should have a low probability of collapse due to earthquake motions; • Functioning of essential bridges should be maintained; • The design ground motions should have a low probability of being exceeded during the normal lifetime of
the bridge (10 percent probability of being exceeded in 50 years, or a 475-year-return period); • The provisions should be applicable to all of the United States; and • The ingenuity of design should not be restricted. Caltrans: The 1990 Caltrans Code has provisions similar to the ATC-6 recommendations, but the ARS elastic response spectrum is based on a maximum credible event (10 percent probability of being exceeded in 250 years). Caltrans spectra are elastic, and elastic moments may be reduced by reduction factors (“Z” factors). NCHRP 12-33 / AASHTO LRFD specification: NCHRP (National Cooperative Highway Research Program)
Project 12-33 has been adopted by AASHTO as a comprehensive Load and Resistance Factor Design (LRFD) Bridge specification which will eventually replace the AASHTO specification (AASHTO, 1996). It was the intention of the committee developing the new AASHTO LRFD Code to move as much of the existing AASHTO seismic code as possible into the new code and at the same time up-date the technical portions to take advantage of new developments (Roberts and Gates, 1991). The primary areas where updates were included are as follows: Soft Soil Sites: The dramatic amplification that can occur on soft ground was demonstrated by the Mexico
City Earthquake of 1985 and the Loma Prieta Earthquake of October 1989. The pro-posed LRFD Bridge Specification introduces separate Soil Profile Site Coefficients and Seismic Response Coefficients (response spectra) for soft soil conditions.
Importance Considerations: Three levels of importance are defined in the new code (as opposed to two levels in the current code): “Critical,” “Essential,” and “Other.” The importance level is used to specify the
degree of damage permitted by changing the force reduction factors (R). For “critical” facilities, the reduction factors are set at 1.5 to maintain nearly elastic response under the seismic event. For “essential” facilities the reduction factors vary from 1.5 to 3.5 for various bridge components, and for “other” facilities the reduction factor varies from 2.0 to 5.0 for various bridge components. (AASHTO, 1994)
ATC-32: The Applied Technology Council (ATC) has proposed changes as follows: • Consideration of two design earthquakes, under certain circumstances: Safety Evaluation Earthquake, and
Functional Evaluation Earthquake. • Caltrans currently uses design spectra (ARS curves) that are a product of maximum expected bedrock
acceleration (A), normalized rock response (R), and soil amplification spectral ratio (S). New “ARS” design spectra developed as part of ATC-32 better represent high ground accelerations produced by different sources with different earthquake magnitudes.
• Current seismic procedures, including those of Caltrans, emphasize designing for assumed seismic forces that, when adjusted by response modification factors to account for ductility, lead to an acceptable design. In actuality, relative displacements are the principal seismic response parameter that determines the performance of the structure. Although the ATC-32 document retains a force design approach, it utilizes new response modification factors (factor Z) and modeling techniques that more accurately consider displacements.
Performance Objectives: Acceptable seismic performance criteria for bridge structures must satisfy both safety and economic conditions. Clearly requiring all bridges to be serviceable immediately after an earthquake may not be economically feasible. At the same time it is well recognized that preventing bridge collapse and possible loss of life can and must be achieved. The principles used in the development of AASTHO provisions were:
1. The design ground motion must have a low probability of being exceeded during the normal lifetime of the bridge ( 10% probability of being exceeded in 50 years or a 475-year return period)
2. The bridge must have a low probability of collapse due to the design ground motion. 3. Structural damage is acceptable as long as it does not result in collapse or loss of life and where possible,
damage that does occur should be readily detectable and accessible for inspection and repair. Small and
2
www.ijert.org 2
International Journal of Engineering Research & Technology (IJERT) ISSN: 2278-0181
Vol. 1 Issue 5, July - 2012
moderate earthquakes should be resisted within the elastic range of the structural component without significant damage.
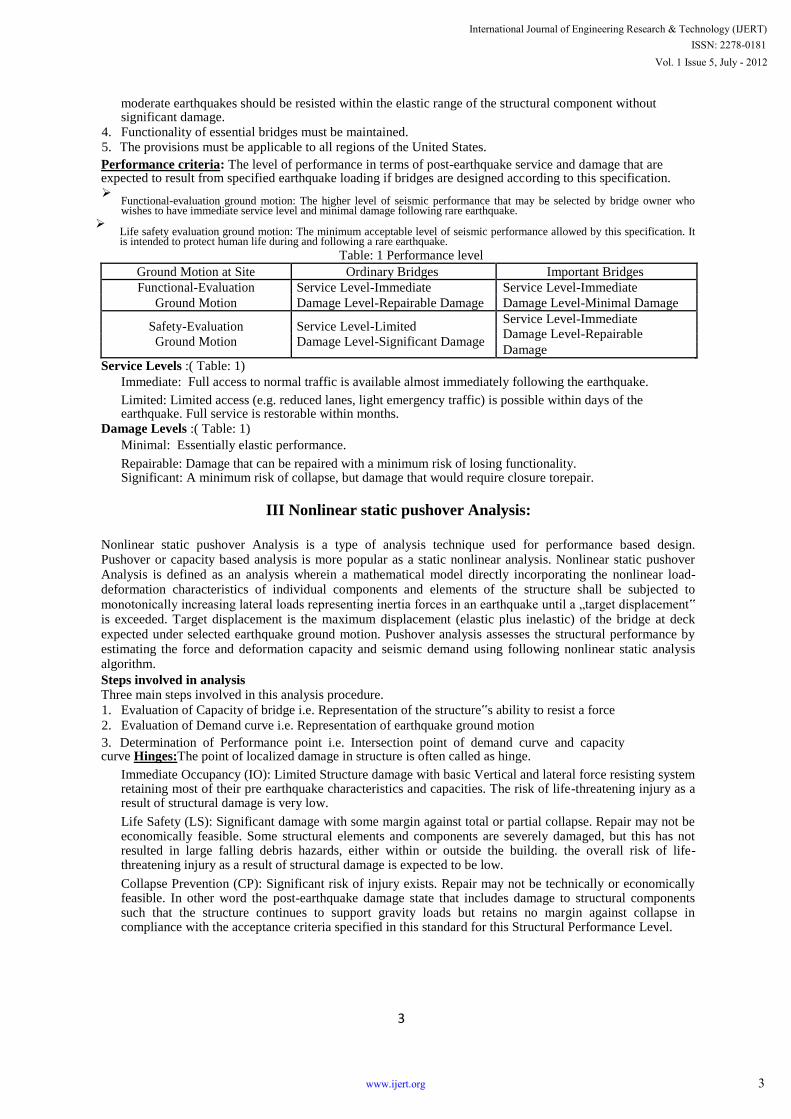
4. Functionality of essential bridges must be maintained. 5. The provisions must be applicable to all regions of the United States. Performance criteria: The level of performance in terms of post-earthquake service and damage that are expected to result from specified earthquake loading if bridges are designed according to this specification. Functional-evaluation ground motion: The higher level of seismic performance that may be selected by bridge owner who
wishes to have immediate service level and minimal damage following rare earthquake.
Life safety evaluation ground motion: The minimum acceptable level of seismic performance allowed by this specification. It is intended to protect human life during and following a rare earthquake.
Table: 1 Performance level
Ground Motion at Site Ordinary Bridges Important Bridges
Functional-Evaluation Service Level-Immediate Service Level-Immediate
Ground Motion Damage Level-Repairable Damage Damage Level-Minimal Damage
Safety-Evaluation Service Level-Limited Service Level-Immediate
Damage Level-Repairable
Ground Motion Damage Level-Significant Damage
Damage
Service Levels :( Table: 1) Immediate: Full access to normal traffic is available almost immediately following the earthquake. Limited: Limited access (e.g. reduced lanes, light emergency traffic) is possible within days of the earthquake. Full service is restorable within months.
Damage Levels :( Table: 1) Minimal: Essentially elastic performance. Repairable: Damage that can be repaired with a minimum risk of losing functionality. Significant: A minimum risk of collapse, but damage that would require closure torepair.
III Nonlinear static pushover Analysis:
Nonlinear static pushover Analysis is a type of analysis technique used for performance based design. Pushover or capacity based analysis is more popular as a static nonlinear analysis. Nonlinear static pushover Analysis is defined as an analysis wherein a mathematical model directly incorporating the nonlinear load-deformation characteristics of individual components and elements of the structure shall be subjected to monotonically increasing lateral loads representing inertia forces in an earthquake until a „target displacement‟ is exceeded. Target displacement is the maximum displacement (elastic plus inelastic) of the bridge at deck expected under selected earthquake ground motion. Pushover analysis assesses the structural performance by estimating the force and deformation capacity and seismic demand using following nonlinear static analysis algorithm. Steps involved in analysis Three main steps involved in this analysis procedure. 1. Evaluation of Capacity of bridge i.e. Representation of the structure‟s ability to resist a force 2. Evaluation of Demand curve i.e. Representation of earthquake ground motion 3. Determination of Performance point i.e. Intersection point of demand curve and capacity curve Hinges:The point of localized damage in structure is often called as hinge.
Immediate Occupancy (IO): Limited Structure damage with basic Vertical and lateral force resisting system retaining most of their pre earthquake characteristics and capacities. The risk of life-threatening injury as a result of structural damage is very low. Life Safety (LS): Significant damage with some margin against total or partial collapse. Repair may not be economically feasible. Some structural elements and components are severely damaged, but this has not resulted in large falling debris hazards, either within or outside the building. the overall risk of life-threatening injury as a result of structural damage is expected to be low. Collapse Prevention (CP): Significant risk of injury exists. Repair may not be technically or economically feasible. In other word the post-earthquake damage state that includes damage to structural components such that the structure continues to support gravity loads but retains no margin against collapse in compliance with the acceptance criteria specified in this standard for this Structural Performance Level.
3
www.ijert.org 3

International Journal of Engineering Research & Technology (IJERT) ISSN: 2278-0181
Vol. 1 Issue 5, July - 2012
Figure-1 Force deformation for push over Hinges Figure-2 performance point
Where, C = Strength Degradation C-D = Initial failure of the component D-E = Residual Resistance Performance point :Figure-2 shows performance point. In performance based design response of structure is considered beyond elastic limit as opposed to code based approach. The intersection of the pushover capacity and demand spectrum curves defines as the “performance point”. Allowable tolerance is considered within 5% of the displacement of the trial performance point. Using the Performance Point or Target Displacement, the global response of the structure and individual component deformations are compared with specific performance goals for bridge as per ATC 40 criteria. For this paper, the acceptable seismic performance criteria for bridge structures must satisfy safety and here it is achieved in the form of hinges. In any case hinges should not go for a particular stage beyond life safety.
IV. PROBLEM DESCRIPTION
This paper describes the effect of Performance based seismic design on the development of new design bridge. This paper describes the effect of nonlinear analysis on the development of new design bridge. A two lane reinforced concrete slab and girder type bridge of 20 m span is considered for performance based seismic design. Following data are taken in the design.
Figure: 3 Bridge model
Design Data : Type of bridge: concrete T beam Material: Concrete – (M25 grade), Steel – Fe 500. Modulus of elasticity Ec of concrete is taken as
5000 No of lane -2 Support condition: fixed at pier and pinned at abutment Height of bridge: 8.5 m Load considered: Dead load
Super imposed dead load Live load as per IRC-6: (class 70 R & class A) Seismic force: Values as per IS: 1893 part 3
4
www.ijert.org 4

International Journal of Engineering Research & Technology (IJERT) ISSN: 2278-0181
Vol. 1 Issue 5, July - 2012
Impact Factor -1.0(for ordinary bridge) Impact Factor -1.5(for important bridge) Reduce Reduction Factor -3.0
Super structure data: Span of slab –20 m No of
girder – 3 Width of Deck – 10.9 m Diaphragm thickness: 0.3 m
Sub structure data: Pier cap section: 2.5 *1.2 m Pier cap
length: 10.0 m Pier section: diameter -1.2 meter (soil-1 and soil-2) for zone-III
1.5 meter (soil-1 and soil-2) for zone-IV 1.7 meter (soil-1 and soil-2) for zone-V
Abutment section - 1.0m * 5.5 m Length of Abutment - 9.15m
For soil type-3, the assumed diameter of the pier section for different zone was not found adequate for important bridge and hence it is revised to fulfil the design criteria. Modeling of Bridge: Linear and nonlinear static pushover analysis, both are is performed using SAP2000 software. Fig-3 Indicate the schematic models of Bridge. Following steps are performed for performance based seismic design of bridges using SAP2000.
1. First of all, bridge shall be designed considering different loads and load combinations as per IRC code and design various components of it.
2. Analyze the same bridge for pushover loading 3. Pushover analysis provides status of hinge formations at critical locations. 4. Push over curve by some modification provides performance point.
5. The performance point provides Teff and stage number and from that base shear and displacement can be obtained.
V. RESULTS OF ANALYSIS
After performing analysis in the SAP 2000 software, various parameters related to seismic design like base shear and base moment in pier, % of reinforcement in pier are obtained and comparison is shown, which are as follows:
Figure: 3 Hinge formations
From nonlinear analysis, inelastic deformation capability of a bridge can be determined which depends on localized damage (hinges formation) in bridge. Here the hinge is formed up to the life safety level. Beyond this level there isn‟t any hinge formation
5
www.ijert.org 5

International Journal of Engineering Research & Technology (IJERT) ISSN: 2278-0181
Vol. 1 Issue 5, July - 2012
Figure: 5 Performance point After analysis by the super imposing demand curve with ATC-40 capacity curve we got performance point. From this performance point (figure: 3) we got Teff (0.375) which is between step 1 and 2(Table: 3) Performance point is obtained by superimposing demand curve with ATC-40 capacity curve. From this performance point (figure: 3), Teff (0.375) can be obtained, which is between step 1 and 2(Table: 3)
Table 3 Pushover Curve Demand Capacity – by ATC40 TABLE: Pushover Curve Demand Capacity - ATC40 - push
Step Teff Beff Sd Sa Sd Sa
Alpha PFPhi
Capacity Capacity Demand Demand
m m
0 0.30341 0.05 0 0 0.02287 1 1 1
1 0.30341 0.05 0.02273 0.99392 0.02287 1 0.70709 0.76356
2 0.463 0.27338 0.05801 0.98823 0.02513 0.42799 0.75255 0.85076
3 0.59455 0.27657 0.09637 1.09752 0.03058 0.3482 0.7152 0.84418
4 0.6857 0.28639 0.13164 1.12706 0.03473 0.29736 0.73317 0.86112
5 0.71357 0.28387 0.14701 1.16228 0.03628 0.28686 0.72534 0.85825
From table 4, we can see that for step 1 and 2 hinges form beyond LS (life safety) is zero. For step 1 and 2 we should consider the displacement and base shear force.
Table 4 : Pushover Curve-(displacement vs. base shear) TABLE: Pushover Curve - push
Step Displacem Base
AtoB BtoI IOt LStoC CPto Cto Dto Beyond
Total
ent Force O oLS P C D E E
m
KN
0 0.005498 0 14 0 0 0 0 0 0 0 14
1 0.022853 6719.481 13 1 0 0 0 0 0 0 14
2 0.054853 7110.615 13 0 1 0 0 0 0 0 14
3 0.086853 7505.078 13 0 1 0 0 0 0 0 14
4 0.118853 7900.695 13 0 0 1 0 0 0 0 14
5 0.131668 8060.573 13 0 0 0 0 1 0 0 14
6 0.131647 8051.42 13 0 0 0 0 1 0 0 14
6
www.ijert.org 6

International Journal of Engineering Research & Technology (IJERT) ISSN: 2278-0181
Vol. 1 Issue 5, July - 2012
A. BASE SHEAR
Table: 5 Base shears for nonlinear analysis Base shear for nonlinear analysis
SOIL-1 SOIL-2 SOIL-3
Ordinary Important Ordinary Important Ordinary Important
Z=.16 871.885 920.064 1027.79 1402.743 1226.74 1709.912
z=.24 1209.05 1381.922 1103.28 1955.302 1637.67 2659.526
z=.36 2833.09 2973.609 3089.33 3533.594 5944.83 7110.615
Base shear force at the end of pier for all the three zones are shown in Table 7.From results it can be seen that base shear for soil-1 (rocky soil) is lowest for all the zones and for soil-3 (soft soil) it is highest.
80007
65 4
3 21
Ordinary
IMPOR
TANT
Ordinary
IMPORT
ANT
Ordinary
IM
PORTA
NT
SOIL-1 SOIL-2 SOIL-3
Base force for nonlinear analysis
Figure: 6 Base Shears
40000 35000 30000 25000 20000 15000 10000
5000 0
Linear
nonline
ar
linear
nonline
ar
linear
nonline
ar
linear
nonline
ar
linear
nonline
ar
linear
nonline
ar
OrdinaryImportantOrdinaryImportantOrdinaryImportant
SOIL-1 SOIL-2 SOIL-3
Z=.16
z=.24
z=.36
Z=.16
z=.24
z=.36
Moment at the Base of pier Muy
Figure :7 Moment at the Base of pier
7
www.ijert.org 7

International Journal of Engineering Research & Technology (IJERT) ISSN: 2278-0181 Vol. 1 Issue 5, July - 2012
B. BASE MOMENT Table 5: Moment at the Base of pier (Muy)
Moment at the Base of pierMuy
SOIL-1 SOIL-2 SOIL-3
Ordinary Important Ordinary Important Ordinary Important
Linear nonlinear linear nonlinear linear nonlinear linear nonlinear linear nonlinear linear nonlinear
Z=.16 2300.61 5625.09 3435.91 7818.805 3118.03 6818.37 4662.05 9631.39 3821.92 8235.87 5734.42 11746.1
z=.24 3666.97 7610.98 5485.46 11795.02 4976.28 7997.48 7449.43 12556.04 6103.74 11175.6 9486.9 17567.3
z=.36 5672.24 18277 8493.36 30522.59 7703.44 18277.8 11540.2 30889.482 9452.54 22784.6 14327.2 39975
Moment at the end of pier for all the three zones and for ordinary and important bridges are shown in Table 8.From results it can be seen that moment for soft soil is much more higher than rocky soil.
C. %Reinforcement in Pier Table 6 : % Reinforcement in Pier
% of Reinforcement in pier
SOIL-1 SOIL-2 SOIL-3
Ordinary Important Ordinary Important Ordinary Important
linear nonlinear linear nonlinear linear nonlinear linear nonlinear linear nonlinear linear nonlinear
Z=.16 1.5 3 2.375 4.25 2.25 3.75 3 4.5 2.75 4 3 4.1
z=.24 2.25 3.5 3 4.625 2.8125 3.875 3.5 4.75 3.25 4 3.875 5.25
z=.36 3.5 4.75 3.75 5.75 3.625 4.75 4.25 5.75 3.75 5 4.25 6
% reinforcement necessary for pier for all the three zones are shown in Table 7.From results it can be seen that for zone-V, soil type-3 maximum reinforcement is needed.
8
www.ijert.org 8

International Journal of Engineering Research & Technology (IJERT) ISSN: 2278-0181
Vol. 1 Issue 5, July - 2012 6 5 4 3 2 1 0
linear
nonline
ar
linear
nonline
ar
linear
nonline
ar
linear
nonline
ar
linear
nonline
ar
linear
nonlinea
r
Ordinary Important Ordinary Important Ordinary Important
SOIL-1 SOIL-2 SOIL-3
% of reinforcement in pier
Figure :8 Reinforcement in Pier
VI. CONCLUSIONS
Z=.16
z=.24
z=.36
The advantages of PBSD over the methodologies used in the current seismic design code are summarized as the following six key issues: The current design practices in Bridge design are sufficient for normal ordinary bridges where the impact due to seismic activity is not serious. However for important bridges there is a definite need for improving the design process. Performance Based Design (PBD) takes into consideration multi-level seismic hazards, limited inelastic deformation. This analytical approach determines the structural behaviour including the nonlinear behaviour and strives to meet the prescribed performance objectives at the optimum life-cycle cost. 1. As seen in a graph base shear force is lowest in soil type-1 and highest in soil type-3. 2. Even base shear is more for important bridged and less in ordinary bridges. 3. Moment at the Base of pier for Zone-V is highest. From the graph we can see that for ordinary bridge and
important bridges the difference of moment for linear analysis varies from 49.0% to 51.0%. For nonlinear analysis the moment differs by 38% to 75%
4. Moment for soft soil is much higher than rocky soil. For linear analysis for soil type-1 and type-2 the difference is nearly 49% and for soil type-3 it varies from 50% to 55%. For nonlinear analysis soil type-1 moment varies from 38% to 67%, soil type-2 it is 41% to 69% and for soil type -3 it differs from 42% to 75%.
5. From results it can be seen that for zone-3, zone-4 and zone-5 in case of soil type-3, we increase the diameter of pier because for the same diameter of pier in case of soil type-1 and soil type-2, the design reinforcement exceeded beyond the permissible limit given by the code for soil type-3.
VII. REFERENCES FarzedNaeim, The Seismic Design handbook, 2nd Edition, Kluwer Academic Publishers, Boston, London, 2001.
Andreas J. Kappos and Georgios Panagopoulos, “Performance-Based Seismic Design of 3D R/C Buildings
Using Inelastic Static and Dynamic Analysis procedures”, ISET Journal of earthquake Technology, Paper No. 444, Vol. 41, No.1, March 2004 pp. 141-158
IS1893: (Part I)-2002, “Criteria for Earthquake Resistant Design of Structures”, Bureau of Indian Standards,
New Delhi, June 2002.
IS1893:“Criteria for Earthquake Resistant Design of Structures”, (Part 3) Bridges And Retaining Wall, Bureau of Indian Standards, New Delhi, June 2002.
Applied Technology Council (ATC)-32-1, “Seismic Evolution and Retrofit of Concrete Building”, Report No. SSC 96-01, Volume I, Applied Technology Council, California, November,1996.
9
www.ijert.org 9

International Journal of Engineering Research & Technology (IJERT) ISSN: 2278-0181
Vol. 1 Issue 5, July - 2012 IS: 456-2000, “Plain and Reinforced Concrete-code of Practice” Bureau of Indian Standards, New Delhi, 2000.
Anil K. Chopra, “DYNAMICS OF STRUCTURES-Theory and applications to Earthquake engineering” 3rd
edition, University of California at Berkeley, 2008. Park R., and Paulay T., Reinforced Concrete structure, Wiley-Interscience, 1974.
Federal Emergency Management Agency (FEMA)-356, “Prestandard and Commentary for the Seismic
Rehabilitation of Building”, FEMA 356/November 2000, Building Seismic Safety Council, Washington, D.C., 2000.
Applied Technology Council (ATC)-40, “Seismic Evolution and Retrofit of Concrete Building”, Report
No.SSC 96-01, Volume I, Applied Technology Council, California, November,1996. Moghadam, H. and Hajirasouliha, I. (2006). “An investigation on the accuracy of pushover analysis for estimating
the seismic deformation of braced steel frames”. Journal of Constructional Steel Research. 62, 343-351.
Xue Q, Chia-Wei Wu, Cheng-Chung Chen, Kuo-Ching Chen, 2007, Civil and Hydraulic Engineering Research Center, Sinotech Engineering Consultants Inc., Taiwan, The draft code for performance-based seismic design of buildings in Taiwan. Available online at www.sciencedirect.com, Engineering Structures 30 (2008)
1535-1547
SAP 2000 manual, “Three Dimensional Static and Dynamic Analysis and Design of Structures”, AND videos. Computer and Structure Inc. Berkeley, USA.
QiangXue∗, Cheng-Chung Chen “Performance-based seismic design of structures: a direct displacement-based approach”. Available online at www.sciencedirect.com 2003
Jiro Fukui & Masahiro Shirato “Performance-based specifications for Japanese highway bridges” Structures
Research Group, JAPAN
Amy Floren and JamshidMohammadi “performance-based design approach in seismic analysis of bridges” ASCE journal.
NCHRP 12-49, Comprehensive Specification for the Seismic Design of Bridges, Revised LRFD Design Specifications (Seismic Provisions), third draft of specifications and commentary march 2, 2001
Section 5, ANALYSIS, from CALTRAN seismic design criteria , June 2006, version 1.4
Gregory G. Deierlein& Andrei M. Reinhorn& Michael R. Willford “Nonlinear Structural Analysis For Seismic Design” A Guide for Practicing Engineers, NEHRP Seismic Design Technical Brief No. 4, NIST GCR 10-917-5
Christopher Rojahn, Ronald L. May es, and Ric hard V. Nutt “Recommendations for Improved AASHTO Bridge Design Specifications” Nceer Bulletin Volume 11, Number 3, July 1997.
10
www.ijert.org 10


![Treasures of the Lake Zway Churches and Monastery, South ...soeagra.com/ijert/ijertmarch2015/6.pdf · IJERT Volume 6 [1] 2015 49 | P a g e © 2015 Society of Education, India Treasures](https://static.fdocuments.in/doc/165x107/5b57da177f8b9a527f8b6ecb/treasures-of-the-lake-zway-churches-and-monastery-south-ijert-volume-6.jpg)