
LISNAHARNEY WINDFARM Ref: K2013/0181/F Our Reasons for its Refusal.

AD_________________ Award Number: W81XWH-06-1-0181 TITLE: Analysis of Ethnic Admixture in Prostate Cancer PRINCIPAL INVESTIGATOR: Cathryn H. Bock, Ph.D. CONTRACTING ORGANIZATION: Wayne State University Detroit, Michigan 48202-3622 REPORT DATE: December 2006 TYPE OF REPORT: Annual PREPARED FOR: U.S. Army Medical Research and Materiel Command Fort Detrick, Maryland 21702-5012 DISTRIBUTION STATEMENT: Approved for Public Release; Distribution Unlimited The views, opinions and/or findings contained in this report are those of the author(s) and should not be construed as an official Department of the Army position, policy or decision unless so designated by other documentation.

REPORT DOCUMENTATION PAGE Form Approved
OMB No. 0704-0188 Public reporting burden for this collection of information is estimated to average 1 hour per response, including the time for reviewing instructions, searching existing data sources, gathering and maintaining the data needed, and completing and reviewing this collection of information. Send comments regarding this burden estimate or any other aspect of this collection of information, including suggestions for reducing this burden to Department of Defense, Washington Headquarters Services, Directorate for Information Operations and Reports (0704-0188), 1215 Jefferson Davis Highway, Suite 1204, Arlington, VA 22202-4302. Respondents should be aware that notwithstanding any other provision of law, no person shall be subject to any penalty for failing to comply with a collection of information if it does not display a currently valid OMB control number. PLEASE DO NOT RETURN YOUR FORM TO THE ABOVE ADDRESS. 1. REPORT DATE (DD-MM-YYYY)01-12-2006
2. REPORT TYPEAnnual
3. DATES COVERED (From - To)30 Nov 2005 – 29 Nov 2006
4. TITLE AND SUBTITLE
5a. CONTRACT NUMBER
Analysis of Ethnic Admixture in Prostate Cancer 5b. GRANT NUMBER W81XWH-06-1-0181
5c. PROGRAM ELEMENT NUMBER
6. AUTHOR(S)
5d. PROJECT NUMBER
Cathryn H. Bock, Ph.D. 5e. TASK NUMBER
E-Mail: [email protected]
5f. WORK UNIT NUMBER
7. PERFORMING ORGANIZATION NAME(S) AND ADDRESS(ES)
8. PERFORMING ORGANIZATION REPORT NUMBER
Wayne State University Detroit, Michigan 48202-3622
9. SPONSORING / MONITORING AGENCY NAME(S) AND ADDRESS(ES) 10. SPONSOR/MONITOR’S ACRONYM(S)U.S. Army Medical Research and Materiel Command
Fort Detrick, Maryland 21702-5012 11. SPONSOR/MONITOR’S REPORT NUMBER(S) 12. DISTRIBUTION / AVAILABILITY STATEMENT Approved for Public Release; Distribution Unlimited
13. SUPPLEMENTARY NOTES
14. ABSTRACT Evidence for a genetic component to prostate cancer is strong, however few genes have been identified, and most of the genetic risk remains undefined. To date, multiple traditional genome scans and linkage analyses have been performed, and several susceptibility loci and candidate genes have been identified. The goal of this research proposal is to use a novel approach to gene discovery, admixture mapping, to identify potential prostate cancer susceptibility genes in a group of African American men. Admixture mapping has greater power to detect genetic effects than traditional genome linkage scans. Recently, Freedman et al. published results from an admixture mapping study of prostate cancer in 1,597 African American men which detected a susceptibility region on chromosome 8q24. In the current study, approximately 900 samples from 2 case-control study of prostate cancer are being genotyped for ancestry informative markers across the genome, using a similar marker panel to that used by Freedman et al. Regions showing strong linkage using the admixture mapping approach will be followed by future studies using fine mapping with a denser set of informative markers in the regions of interest and candidate gene studies. After 12 months, the project is on time with completion of the targeted tasks outlined in the Statement of Work for the project’s first year, and is on track to complete all tasks within the next 12 months, as planned.
15. SUBJECT TERMS Prostate cancer, admixture mapping
16. SECURITY CLASSIFICATION OF:
17. LIMITATION OF ABSTRACT
18. NUMBER OF PAGES
19a. NAME OF RESPONSIBLE PERSONUSAMRMC
a. REPORT U
b. ABSTRACTU
c. THIS PAGEU
UU
23
19b. TELEPHONE NUMBER (include area code)
Standard Form 298 (Rev. 8-98)Prescribed by ANSI Std. Z39.18

Table of Contents
Cover……………………………………………………………………………………1 SF 298……………………………………………………………………………..……2
Introduction…………………………………………………………….…………....4
Body…………………………………………………………………………………….4 Key Research Accomplishments………………………………………….………5 Reportable Outcomes……………………………………………………………….6 Conclusions…………………………………………………………………………..6 References………………………………………………………………………….…6 Appendices……………………………………………………………………………7
3

INTRODUCTION: Evidence for a genetic component to prostate cancer is strong, however few genes
have been identified, and most of the genetic risk remains undefined. To date, multiple traditional genome scans and linkage analyses have been performed, and several susceptibility loci and candidate genes have been identified, including HPC1, HPCX, HPC20, CAPB, PCAP, RNASEL, HPC2/ELAC2, and MSR1. Traditional genome scans using information from prostate cancer families, however, have generally not included enough African American families to provide adequate statistical power to detect linkage. The goal of this research proposal is to use a novel approach to gene discovery, admixture mapping, to identify potential prostate cancer susceptibility genes in a group of African American men. Admixture mapping has greater power to detect genetic effects than traditional genome linkage scans. Recently, Freedman et al. published results from an admixture mapping study of prostate cancer in 1,597 African American men which detected a susceptibility region on chromosome 8q24 (manuscript included in Appendix) (1). In the current study, approximately 900 samples from 2 case-control study of prostate cancer are being genotyped for ancestry informative markers across the genome, using a similar marker panel to that used by Freedman et al. The admixture mapping analyses will be performed using ADMIXMAP and ANCESTRYMAP statistical programs. Regions showing strong linkage using the admixture mapping approach will be followed by future studies using fine mapping with a denser set of informative markers in the regions of interest and candidate gene studies. BODY: After 12 months, the project is on time with completion of the targeted tasks outlined in the Statement of Work for the project’s first year, and is on track to complete all tasks within the next 12 months, as planned. Almost all of Task 1 is completed, and Task 2 activities have been started. Task 3 activities are not slated to commence until month 20. The details of progress within each Task are as follows. Task 1. To obtain genotype information for all study subjects (Months 1-18):
a. Prepare batches of DNA and ship to ParAllele, starting with samples from controls (Months 1-17).
b. ParAllele to perform Genotyping and transmit results to Dr. Bock (Months 2-18).
DNA samples for approximately 530 cases and 380 controls were
prepared for genotyping, and shipped to the laboratory. In addition to the approximately 250 cases and 100 controls from HFHS, we also included approximately 280 cases and 280 controls from Dr. Rick Kittles’ prostate cancer case control study (described in Bonilla et al., (2) included in the appendix) (with IRB approval), thereby more than doubling our sample size. For quality control, DNA samples from 30 CEPH individuals were included so that their genotype results could be compared with those publicly available through HapMap. Because ParAllele was out of business when we were ready to genotype, we used a panel of 1536 ancestry informative SNPs developed by David Reich at the Broad Institute for use on the Illumina BeadStation platform. Earlier versions of
4

this panel were used in the Freedman et al. prostate cancer admixture mapping study (1). This panel has very high reliability and success rate in Dr. Reich’s lab, and after running 80% of the samples in the Wayne State University Genomics Core Laboratory, there were only two samples that were not typable on their first run, and >95% of the markers had excellent results. The two samples that did not provide reliable results will be re-run with the last batch of samples in January, 2007. It is anticipated that all of the genotyping will be completed and the results provided to the PI in January, 2007. Thus, all of Task 1 should be completed by the end of January, 2007, within the timeframe outlined in the Statement of Work. Task 2. To identify candidate prostate cancer susceptibility loci using mapping by
admixture linkage (MALD) (Months 1-22). a. Set up database and preliminary ADMIXMAP program (Months 1-6). b. Perform preliminary analyses and refine ADMIXMAP program
(Months 6-18). c. Calculate final LOD scores and 95% confidence intervals for
regions that show possible linkage (Months 18-22). d. Where necessary, extend the score test and likelihood ratio tests in
ADMIXMAP to test for gene-environment interactions. (Months 20-22).
The ADMIXMAP software was successfully set up on a local computer,
and the PI successfully ran a test data set through the program. We will begin performing preliminary analyses in late January or early February, 2007, within the timeframe outlined in the Statement of Work. We will also send the genotype data to Dr. David Reich, the senior author of the recent report on prostate cancer admixture mapping results (1). He is an expert in this area, and has agreed to run our data through his ANCESTRYMAP program, which will allow us to directly compare our results with those he published. We anticipate that the analyses outlined in Task 2 will be completed according to the stated times.
Task 3. Final Analyses and Report Writing, Months 20-24:
a. A final report describing the mapping findings and any gene-environment interactions will be prepared (months 20-24).
We anticipate accomplishing Task 3 on schedule, after completing Task 2.
KEY RESEARCH ACCOMPLISHMENTS:
• Prostate cancer case and control DNA samples from African American men from two case control studies were prepared to for genotyping and shipped to the lab for genotyping. The number of samples for genotyping was more than double the expected number of originally anticipated samples.
• An improved panel of 1536 ancestry informative markers was identified and purchased for use in genotyping the samples.
5

• Genotyping of all samples is 80% complete, and the results have been provided to the PI.
• Genotyping is expected to be 100% complete and all final results transmitted to the PI by Jan 31, 2007.
• ADMIXMAP Software (http://www.ucd.ie/genepi/admixmap/index.html) was installed successfully, and test data was successfully run through the program.
• A new collaborator, David Reich, joined the project and has agreed to provide his expertise in admixture mapping and also to run the data through his admixture mapping program, ANCESTRYMAP (3). IRB approval was obtained to provide him with the genotype data.
• Initial analyses in ADMIXMAP and ANCESTRYMAP will be performed beginning in late January or early February, 2007 to identify potential candidate regions for prostate cancer susceptibility genes.
REPORTABLE OUTCOMES: A database of genotype information on 80% of the subjects has been established, however the project has not yet reached the point in its timeline when any reportable outcomes regarding prostate cancer risk can be stated. These will be forthcoming as the data is analyzed early in 2007. CONCLUSION: This study is on track with its Statement of Work goals and timeline; the sample size is more than double the anticipated number, genotyping is almost completed with high quality of results obtained to date, and the analysis programs are in place to be run. Because genotyping will need to be completed before definitive analyses can be run, there are not yet specific conclusions regarding prostate cancer susceptibility loci available from this project. REFERENCES: 1. Freedman ML, Haiman CA, Patterson N, McDonald GJ, Tandon A, Waliszewska
A, Penney K, Steen RG, Ardlie K, John EM, Oakley-Girvan I, Whittemore AS, Cooney KA, Ingles SA, Altshuler D, Henderson BE, Reich D. Admixture mapping identifies 8q24 as a prostate cancer risk locus in African-American men. Proc Natl Acad Sci U S A 2006;103(38):14068-14073.
2. Bonilla C, Panguluri RK, Taliaferro-Smith L, Argyropoulos G, Chen G, Adeyemo AA, Amoah A, Owusu S, Acheampong J, Agyenim-Boateng K, Eghan BA, Oli J, Okafor G, Abbiyesuku F, Johnson T, Rufus T, Fasanmade O, Chen Y, Collins FS, Dunston GM, Rotimi C, Kittles RA. Agouti-related protein promoter variant associated with leanness and decreased risk for diabetes in West Africans. International journal of obesity (2005) 2006;30(4):715-721.
3. Patterson N, Hattangadi N, Lane B, Lohmueller KE, Hafler DA, Oksenberg JR, Hauser SL, Smith MW, O'Brien SJ, Altshuler D, Daly MJ, Reich D. Methods for high-density admixture mapping of disease genes. American journal of human genetics 2004;74(5):979-1000.
APPENDICES: 2 articles attached
6

Admixture mapping identifies 8q24 as a prostatecancer risk locus in African-American menMatthew L. Freedmana,b,c, Christopher A. Haimanc,d, Nick Pattersonb,c, Gavin J. McDonaldb,e, Arti Tandonb,e,Alicja Waliszewskab,e,f, Kathryn Penneyb, Robert G. Steene,g, Kristin Ardlieb,h, Esther M. Johni,j,Ingrid Oakley-Girvani,j, Alice S. Whittemorej, Kathleen A. Cooneyk,l, Sue A. Inglesd, David Altshulerb,e,m,n,Brian E. Hendersond, and David Reichb,e,o
aDepartment of Medical Oncology, Dana–Farber Cancer Institute, Boston, MA 02115; bProgram in Medical and Population Genetics, Broad Institute ofHarvard and Massachusetts Institute of Technology, Cambridge, MA 02142; dDepartment of Preventive Medicine, Keck School of Medicine, University ofSouthern California, Los Angeles, CA 90089; Departments of eGenetics and mMedicine and gBiopolymers Facility, Harvard Medical School, Boston, MA 02115;fLaboratory of Molecular Immunology, Center for Neurologic Disease, Brigham and Women’s Hospital, Boston, MA 02115; hGenomics Collaborative, Divisionof SeraCare Life Sciences, Inc., Cambridge, MA 02139; iNorthern California Cancer Center, Fremont, CA 94538; jDepartment of Health Research and Policy,Stanford University School of Medicine, Stanford, CA 94305; kDepartments of Medicine and Urology and lComprehensive Cancer Center, University ofMichigan, Ann Arbor, MI 48109; and nCenter for Human Genetic Research and Department of Molecular Biology, Massachusetts General Hospital,Boston, MA 02114
Communicated by Eric S. Lander, Broad Institute, Cambridge, MA, July 12, 2006 (received for review May 24, 2006)
A whole-genome admixture scan in 1,597 African Americans identi-fied a 3.8 Mb interval on chromosome 8q24 as significantly associatedwith susceptibility to prostate cancer [logarithm of odds (LOD) � 7.1].The increased risk because of inheriting African ancestry is greater inmen diagnosed before 72 years of age (P < 0.00032) and maycontribute to the epidemiological observation that the higher risk forprostate cancer in African Americans is greatest in younger men (andattenuates with older age). The same region was recently identifiedthrough linkage analysis of prostate cancer, followed by fine-map-ping. We strongly replicated this association (P < 4.2 � 10�9) but findthat the previously described alleles do not explain more than afraction of the admixture signal. Thus, admixture mapping indicatesa major, still-unidentified risk gene for prostate cancer at 8q24,motivating intense work to find it.
association � human genetics
Prostate cancer is the most common noncutaneous malig-nancy among U.S. men, with an estimated 234,460 new cases
and 27,350 deaths in 2006 (1). African Americans have the highestincidence of prostate cancer in the United States, �1.6-foldhigher than European Americans (http:��jncicancerspectrum.oxfordjournals.org�cgi�statContent�cspectfstat;18). The higherrisk (2–4) prompted the hypothesis that genetic factors in partaccount for this difference. If there are genetic risk variants thatdiffer substantially in frequency across populations, admixturemapping should have power to detect them.
The idea of admixture mapping is to screen through thegenome of populations of mixed ancestry such as AfricanAmericans (5), searching for regions where the proportion ofDNA inherited from either the ancestral European or Africanpopulation is unusual compared with the genome-wide average.Admixture mapping requires a relatively small number of mark-ers for a whole-genome scan: a couple of thousand, rather thanthe hundreds of thousands estimated to be necessary in nonad-mixed populations (5, 6). Because the mixture between Euro-pean and West-African populations occurred within the past 15generations (5), stretches of DNA with contiguous Europeanand African ancestry have not had much time to break upbecause of recombination and typically extend millions of basepairs. Admixture mapping therefore studies highly selected SNPsevery few million base pairs (Mb), rather than every fewthousand as with linkage disequilibrium mapping.
Although admixture mapping was first proposed �50 yearsago (7) and has good power to detect risk variants that arestrikingly different in frequency across populations (6, 8), it hasnot been practical until recently. Appropriate panels of markers(5), combined with analytical methods (8–10), made possible the
first admixture scans (11, 12) in 2005. Here, we describe awhole-genome admixture scan focusing on prostate cancer, adisease that has long been considered a test case for admixturemapping because of its marked difference in incidence ratesacross populations. We identify a highly significant association at8q24. The same broad region has recently been implicated inprostate cancer by Amundadottir et al. (13). In addition toproviding independent evidence of a locus at 8q24, the presentstudy provides two pieces of information. First, we show anassociation with earlier age of diagnosis. Second, we show thatthe alleles identified in the previous study are insufficient toexplain more than a small fraction of the admixture signal. Thus,the causative alleles remain to be identified.
ResultsWe studied 1,597 prostate cancer cases and 873 controls, themajority of which were participants in the Multiethnic Cohortstudy (14) (810 cases and 730 controls) (Table 5, which ispublished as supporting information on the PNAS web site). Theother samples came from six studies, including studies thatspecifically ascertained cases with high-grade tumors, advanced-stage disease, diagnosis at a young age, or occurrence in a familywith multiple affected individuals (15–17) (Table 1). The presentstudy was designed to include more cases than controls, becauseadmixture mapping works by comparing the proportion ofancestry in cases to the rest of their own genomes. In principle,controls are not needed (6, 8); however, we included controlsbecause they are useful for follow-up analyses (8).
All 2,470 samples (1,597 cases and 873 controls) were geno-typed by using one of two panels of markers chosen to be highlydifferent in frequency between West Africans and EuropeanAmericans (5). A total of 1,792 samples were genotyped in the‘‘phase 1’’ panel [previously used in a scan for multiple sclerosisgenes (12)] and 1,266 SNPs passed quality filters and were usedin analysis (Table 6, which is published as supporting informationon the PNAS web site). The remaining 678 samples were typedin a second-generation ‘‘phase 2’’ panel that extracts moreinformation per SNP; 1,365 SNPs passed quality filters and wereused in analysis. The analysis combines information from bothpanels into a single logarithm of odds (LOD) score statistic at
Conflict of interest statement: No conflicts declared.
Abbreviations: LOD, logarithm of odds; OR, odds ratio.
cM.L.F., C.A.H., and N.P. contributed equally to this work.
oTo whom correspondence should be addressed at: Department of Genetics, HarvardMedical School, New Research Building, 77 Avenue Louis Pasteur, Boston, MA 02115.E-mail: [email protected].
© 2006 by The National Academy of Sciences of the USA
14068–14073 � PNAS � September 19, 2006 � vol. 103 � no. 38 www.pnas.org�cgi�doi�10.1073�pnas.0605832103

each locus; observations �5 are considered strongly indicative ofa disease locus (8). Formal significance is assessed by Bayesianmethods. We take 10 to the power of the LOD score and averageacross points spaced every centimorgan across the genome. If thegenome average is �100, then the Bayesian odds in favor of adisease locus is 100:1, and we interpret the data as showingsignificant evidence of a disease gene (8).
An initial admixture scan of 1,303 African-American prostatecancer cases produced a peak LOD score of 2.2 at 8q24. Thesignal was higher in a secondary analysis of individuals with ayounger age at diagnosis, with the peak LOD score rising to 3.8in the individuals who were �68 years of age (the thresholdgiving the strongest evidence of association). After genotyping294 additional cases and 15 additional SNPs at 8q24 to obtainbetter local information about ancestry (see Materials andMethods), the peak LOD score increased to 4.1 in all cases andas high as 8.4 in the 1,176 who were diagnosed at �72 years ofage. To correct for inflation of the score because of choosing theage threshold that gave the strongest significance, we integratedthe evidence for association over an evenly spaced range ofcutoffs (see Materials and Methods and Table 7, which is pub-lished as supporting information on the PNAS web site). Thisanalysis yielded a peak LOD score of 7.1 (Fig. 1). Averaging 10to the power of the LOD scores at equally spaced pointsgenome-wide, we obtained a genome-wide average score of�19,000, exceeding the threshold of 100 for significance (8).After correcting for multiple hypothesis testing [by dividing by 4,because we tested four phenotypes (age, grade, stage, andfamilial disease) and focused on the one giving the strongest
evidence], the odds in favor of a disease locus still greatlyexceeded the threshold of 100 for significance.
The analysis in the previous paragraph used age of diagnosis asa covariate but did not directly test whether men with younger ageof diagnosis have higher risk at 8q24 than older men. To formallytest this hypothesis, we exploited the fact that ANCESTRYMAPsoftware (see ref. 8 and http:��genepath.med.harvard.edu��reich)assigns scores for association to each individual separately (e.g.,individual factors such as �0.02, 0.12) and then sums over allindividuals to produce the total LOD score (Table 2). We rank-ordered the 1,588 cases in the scan for whom we had age informa-tion from youngest to oldest (Fig. 2). If the locus is not associatedwith age of diagnosis, the cumulative LOD should increase steadilyto reach the total as additional samples are added. In fact, it risesto 5.4 LOD points above expectation at 71 years of age. To testwhether this rise is significant, we permuted the data, reassigningages of onset to different individuals (so that, in the randomizeddata, there could be no relationship between age of onset and allelicvariation). In 1,000,000 permutations, only 318 showed a change inLOD score compared with the expectation exceeding the observed5.4 (P � 0.00032). Repeating the analysis with a subset of samplesobtained from a single prospective cohort [804 cases of AfricanAmericans with prostate cancer from the Multiethnic Cohort(MEC) Study], the association to age was also significant (P �0.0011). These results indicate that there is a formally significantassociation of prostate cancer to ordering by age. We did not detectany associations when a similar analysis was applied to othersubphenotypes: stage, grade, or family history (Supplemental Note
Table 2. Admixture scan summaries
No. ofcases
No. ofcontrols
Peak LODscore
All prostate cancer cases 1,597 873 4.07High grade (Gleason score �7) 316 873 2.68Advanced stage (regional or metastatic cancer) 414 873 2.81Family history (prostate cancer in a first-degree relative) 281 873 1.86Age of diagnosis of �72 years and high-density genotyping at 8q24 1,176 873 8.39*Drop out every even marker from run no. 5 to demonstrate independence of markers used 1,176 873 8.95*Drop out every odd marker from run no. 5 to demonstrate independence of markers used 1,176 873 6.65*Diagnosis at �72 years of age, high density and best model of 1.54-increased risk because of
African ancestry1,176 873 9.39*
Integrating over age-of-diagnosis cutoffs as a formal test for statistical significance 1,597 873 7.14*
*Indicates a scan that meets formal criteria for genome-wide statistical significance.
Table 1. Characteristics of cases and controls from seven sources
Source Location Cases Controls
Cases,% Euro.� 1 SE
Controls,% Euro.� 1 SE
Mean agediagnosis(range)
% withGleasonscore �7
% withnon-localtumors
% withprostate cancer
in a first-degree relative
Decrease inpeak LOD if
these samplesare removed*
Multiethnic Cohort CA & HI 810 730 23.57 � 0.50 25.42 � 0.57 68 (46–85) 18 15 12 2.58L.A. County Men’s
Health StudyCA 366 107 22.34 � 0.83 26.37 � 2.13 63 (42–88) 28 39 21 1.37
Study Early OnsetProstate Cancer
CA 104 — 20.89 � 1.37 — 60 (45–65) 31 49 14 1.01
PCGP MI 103 — 19.50 � 1.01 — 55 (40–86) 11 29 39 1.15Flint Men’s Health
StudyMI 85 — 18.05 � 1.21 — 65 (47–77) 12 28 15 0.06
Bay Area Men’sHealth Study
CA 82 36 19.06 � 1.52 20.13 � 2.15 64 (44–78) 25 94 28 1.16
GenomicsCollaborative
All U.S. 47 — 16.16 � 1.51 — 62 (39–81) 14 38 28 0.57
Combined samples 1,597 873 22.11 � 0.36 25.32 � 0.55 65 (39–88) 21 29 18 7.14
PCGP, Prostate Cancer Genetics Project; Euro., European.*To assess how much each of the seven cohorts contributes to the signal of association, we removed each from the main admixture scan (run no. 9 in Table 2)and assessed how the peak LOD score at 8q24 changes. All seven cohorts contribute positively.
Freedman et al. PNAS � September 19, 2006 � vol. 103 � no. 38 � 14069
GEN
ETIC
S

1 in Supporting Text, which is published as supporting informationon the PNAS web site).
To explore how much of the increased incidence of prostatecancer in African-American men might be explained by African(as compared with European) ancestry at 8q24, we evaluated therisk for individuals carrying zero, one, and two chromosomeswith African ancestry at the locus. Each African-derived chro-mosome is associated with �1.54-fold increased risk in youngerindividuals (90% credible interval 1.38–1.74) (SupplementalNote 2). We also estimated the proportion of control sampleswith zero, one, and two African-derived chromosomes, respec-tively (6.4%, 37.8%, and 55.8%, respectively). Extrapolating tothe broader African-American population, the prostate cancerincidence in all African Americans IALL is higher than theincidence IEE in individuals who inherited two European-derivedchromosomes at the locus by a factor of [(0.064) (1) �(0.378)(1.54) � 0.558(1.542)] � 1.969. Thus, the fraction of allprostate cancer incidence for African Americans �72 years ofage that could be explained by ancestry at this locus is (IALL �IEE)�IALL � 1 � (1�1.969) � 49% (with a 90% credible intervalof 39–59%). Thus, if it were possible to develop a treatment thatreduced prostate cancer risk in the African-American popula-tion to the level that is seen in men who carry two copies of 8q24inherited from recent European ancestors, the rate of prostatecancer would decrease by �49%. The total risk for prostatecancer that can be attributed to 8q24 in African-American men
Fig. 1. Summary of results for the whole-genome admixture scan and characteristics of the 8q24 peak of association. (a) We present the LOD score at equallyspaced points across the genome. The chromosome 8 peak is marked by a rise to 7.14. (b) We can use the data to calculate a probability distribution for the positionof the peak. It aligns with the microsatellite and SNP recently associated with prostate cancer by Amundadottir et al. (13) (dashed line). (c) The 95% credibleinterval spans 3.8 Mb (125.68–129.48 Mb in build 35 of the human reference sequence) and contains nine known genes, including the c-MYC oncogene (diagramtaken from http:��genome.ucsc.edu) (data from the May 2004 genome assembly).
Fig. 2. To formally test for a relationship between age of onset and contri-bution to the chromosome 8 locus, we rank-ordered the individuals by age ofonset and then calculated a score for increasing age cutoffs. The score rises to5.40 above the expectation for 1,176 individuals diagnosed at �72 years ofage. To evaluate whether this rise is unexpected, we permuted the data1,000,000 times, randomizing scores with respect to individuals’ ages of onset(guaranteeing that there is no relationship between age of diagnosis andcontribution to the evidence of association). In only 318 of 1,000,000 permu-tations did we see a rise as high as in our data (P � 0.00032).
14070 � www.pnas.org�cgi�doi�10.1073�pnas.0605832103 Freedman et al.

�72 years of age is still greater, because alleles at 8q24 increaseprostate cancer risk even in chromosomes of entirely Europeanorigin (13). Thus, 8q24 has a major effect on population risk ofprostate cancer, especially in younger African Americans.
Using the LOD scores at 8q24, we also calculated a posteriorprobability distribution to estimate the position of the disease-causing variants (see Fig. 1b and Materials and Methods). The95% credible interval spans 3.80 Mb, from 125.68–129.48 Mb inbuild 35 of the human genome reference sequence (13.9 cM) andcontains nine known genes (Fig. 1c). However, the admixturescan does not provide information about which gene or alleleswithin the locus confer risk.
Independently of this study, Amundadottir et al. (13) reportedan SNP allele [A at rs1447295; odds ratio (OR) � 1.51; P � 1.0 10�11] and a microsatellite allele (�8 at DG8S737; OR � 1.62;P � 2.7 10�11) that map to the same region as the admixturepeak (at 128.546 Mb and 128.554 Mb, respectively) and arehighly associated with prostate cancer. The effect of the �8 allelewas observed in European and African Americans, whereas theA allele effect was detected only in European-derived popula-tions. The authors did not show, however, that either allele wascausally involved in disease but instead suggested that they wereboth in linkage disequilibrium with an as-yet-unidentified causalvariant. They also did not identify which gene in the region mightbe responsible for prostate cancer risk.
To directly compare the results of the two studies, we testedthe previously associated alleles in the African-American casesand controls [excluding samples from Michigan, because theyoverlap those studied by Amundadottir et al. (13); see Materialsand Methods]. The goal was to test whether the �8 allele atDG8S737 contributes to disease risk in African Americansbeyond the risk that can be accounted for by the admixturesignal. (Supplemental Note 3). We were concerned that thepreviously detected association in African Americans byAmundadottir et al. (13) (P � 0.0022, estimated OR of 1.60)might simply reflect an admixture signal across a large region(because of systematic differences in ancestry between cases andcontrols across several million base pairs of 8q24) and thus mightnot provide fine-mapping information in African Americans.Although Amundadottir et al. (13) tested for mismatching ofcases and controls in overall proportion of ancestry, they did notcontrol for a local rise in African ancestry throughout 8q24 incases but not controls. Such a rise would be expected to causethousands of alleles in the region that just happen to be morefrequent in African Americans (including the microsatellite �8allele) to show association with prostate cancer. When wecorrect for this effect in the African-American samples from thepresent study (Supplemental Note 3), we find that the contribu-tion of the �8 allele to risk is nonsignificant (P � 0.22) (Table3). The OR of 0.93–1.17 (95% credible interval) also rules outthe OR � 1.60 reported in African-Americans (13).
We next expanded the replication analysis to the four eth-nicities in the MEC other than African Americans, by genotyp-ing rs1447295 in 1,614 prostate cancer cases and 1,547 controlsfrom these populations. The evidence for association is signifi-cant overall (P � 4.2 10�9), as well as separately in each group:Japanese Americans (P � 0.00034), Native Hawaiians (P �0.00015), Latino Americans (P � 0.0014), and European Amer-icans (P � 0.022) (Table 4). This analysis replicates the associ-ation identified by Amundadottir et al. (13), although we did nottest for the possible confounding factor of population stratifi-cation. Interestingly, we do not replicate the association to tumorgrade (Gleason �8 vs. Gleason �8; P � 0.47) reported byAmundadottir et al. (13).
These results confirm the finding of Amundadottir et al. (13)that the 8q24 locus is important in prostate cancer. However, thealleles they reported do not explain the admixture signal (Sup-plemental Note 4 and Table 3). The specific variants causing
increased risk for prostate cancer in African American becauseof 8q24 thus remain to be identified.
DiscussionWe have used admixture mapping to identify a locus at 8q24 thatsubstantially affects risk for prostate cancer. We highlight fourfindings.
First, this study shows that admixture mapping can be apowerful and practical way to map genetic variants for complexdisease (5, 18). The results motivate the application of admixturemapping to other disorders, especially those like prostate cancerin which incidence varies across populations. These results alsohighlight the scientific value of studies to find disease genes inspecific ethnic groups, such as African Americans.
Second, we show that the 8q24 locus contributes to a majorincreased risk for prostate cancer in African Americans withAfrican ancestry at 8q24. The difference between these individ-uals and African Americans with European ancestry at 8q24explains a large proportion of prostate cancer in younger AfricanAmericans. If one could intervene medically to reduce the riskfor prostate cancer in African Americans �72 years of age towhat would be expected if all African Americans had Europeanancestry at the locus, the incidence in men �72 years of agewould decrease by approximately 49%. We also show that theadmixture signal at 8q24 cannot be explained by the allelesidentified by Amundadottir et al. (13); instead, there must bemajor, unmapped risk alleles at the locus.
Third, we detect a highly significant association of 8q24 withage. This finding is intriguing because it is known epidemiolog-ically that the differential incidence of prostate cancer in Africanversus European Americans is greater at younger ages and isattenuated with older age (ref. 19; http:��jncicancerspectrum.oxfordjournals.org�cgi�statContent�cspectfstat;18). Surveil-lance, Epidemiology, and End Results (SEER) Program registrydata indicate that, for men diagnosed at �55 years of age,African Americans have a 2.27-fold higher rate than EuropeanAmericans, but the ratio decreases to 1.48-fold for men diag-nosed at �75 years of age (19). Genetic variation at 8q24 may beresponsible for part of this effect.
Fourth, we identify a 3.8-Mb interval containing nine knowngenes that is likely to harbor variant(s) explaining the admix-ture peak. This is a tractable region for follow-up analysis.Somatic genetic data independently highlight the 8q24 regionas one of the most frequently amplified regions in prostatecancer tumors (20, 21). The c-MYC oncogene, a key regulatorin cellular proliferation, lies within the peak. Overexpressionof c-MYC has been shown to induce tumors in mice and tocreate a cancer phenotype in benign prostatic epithelium (22,23). It is possible that c-MYC could be the gene responsible forthe prostate cancer risk, but no structural or regulatory varianthas yet been identified.
Follow-up work will be necessary to identify the as-yet-undiscovered causal risk variant(s) at 8q24. Ultimately, discov-ering the causal gene(s) at 8q24 may translate into better
Table 3. Allelic association tests in African Americans adjustingfor local rise in African ancestry
Cases Controls P value OR (95% CI)
A allele at rs1447295 989 804 0.15 1.05 (0.95–1.16)�8 allele at DG8S737 966 797 0.22 1.05 (0.93–1.17)Haplotype of A and �8* 902 776 0.31 1.03 (0.90–1.18)
Cases diagnosed at �72 years of age and all controls. P values are one-tailed, testing for the previously associated allele (14) being more common(Supplemental Note 3). CI, confidence interval.*For the haplotype test, we phased the cases and controls together, beforecarrying out the association analysis.
Freedman et al. PNAS � September 19, 2006 � vol. 103 � no. 38 � 14071
GEN
ETIC
S

understanding of prostate cancer and may play a role in strat-egies for screening of the population and identifying new targetsfor treatment and prevention.
Materials and MethodsSamples. Samples were derived from seven sources (Table 1). Thelargest number came from the Multiethnic Cohort (MEC), aprospective cohort that began in 1993 and is still ongoing, whichascertains prostate cancer cases and controls by linking todatabases from the California Cancer Registry, the Los AngelesCounty Cancer Surveillance Program, and the Hawaii CancerRegistry (14). The samples used in the admixture scan were allAfrican-American cases and controls; however, for the valida-tion genotyping of the rs1447295 SNP, we also genotypedprostate cancer cases and controls from four other ethnicities inthe MEC: European Americans, Latino Americans, JapaneseAmericans, and Native Hawaiians. The second largest number ofsamples came from the Los Angeles County Men’s Health Study(1999–2002), which was enriched for individuals with advanced-stage or high-grade prostate cancer, as identified through hos-pitals and private histopathology laboratories in Los AngelesCounty. The Bay Area Men’s Health Study (15) (1997–2000) wasenriched for individuals with regional- or distant-stage disease.The Study of Early Onset Prostate Cancer (1993–1995) wasbased in the San Francisco–Oakland Bay Area and included onlyindividuals with histologically confirmed prostate cancer whowere �66 years of age at diagnosis. The Genomics Collaborative,Ltd. samples were obtained from consenting individuals under-going surgery for prostate cancer throughout the U.S. and wereprovided to this study at no cost by means of an academiccollaboration. The Flint Men’s Health Study samples (1996–2002) were obtained through a case-control study of prostatecancer in Genesee County, Michigan. The University of Mich-igan Prostate Cancer Genetics Project (PCGP) samples wereobtained from an ongoing family-based study of prostate cancersusceptibility. PCGP cases have a family history of prostatecancer or early age at diagnosis defined as �55 years of age (weanalyzed data only from the man with the youngest age ofdiagnosis in each family). We note that both the Flint Men’sHealth Study and PCGP samples (16, 17) overlap with thosestudied by Amundadottir et al. (13). The samples were providedby K.A.C. for replication purposes blinded to the locus understudy. The results reported here, which also use a different typeof information to localize disease genes (admixture linkagedisequilibrium), are thus fully independent.
Genotyping. The phase 1 and phase 2 panels of SNPs were bothgenotyped by using the Illumina BeadLab genotyping platform(24) [supplemented for phase 1 by Sequenom MassARRAYgenotyping (25)]. At the 8q24 peak, we genotyped an additional15 SNPs using Sequenom technology to extract maximal infor-mation about ancestry [these SNPs were chosen to have highfrequency differentiation between the European and West-
African populations (5) based on data from the Human Hap-lotype Map (26)]. We used previously described protocols toremove SNPs that did not perform well in genotyping, that werein linkage disequilibrium with each other in the ancestralEuropean and West-African populations, or that did not seem tohave appropriate intermediate frequencies in the African Amer-icans compared with the ancestral populations (12). Thers1447295 genotyping was carried out by using the AppliedBiosystems Inc. (ABI, Foster City, CA) Assay-on-Demand tech-nology following the manufacturer’s recommended protocol,and all of the African Americans were also genotyped atrs1447295 by using Sequenom technology. The DG8S737 geno-typing was carried out by using ABI True Allele PCR Premix,with 5-pmol forward (5-6FAM-TGATGCACCACAGAAAC-CTG-3) and 5-pmol reverse (5-GTTTCAAGGATGCAGCT-CACAACA-3) primers, and 60 ng of DNA per reaction.Reactions were analyzed on an ABI3730xl DNA Analyzer.Samples were scored by the ABI GeneMapper V3.7 software,with all genotypes confirmed by an experienced technician. Tocheck the microsatellite genotyping results, we compared 168samples that overlapped between this study and that of Amunda-dottir et al. (13) (data provided by K.A.C.); only five comparisonswere inconsistent.
Admixture Analysis. We used the ANCESTRYMAP software (8)to carry out the screens for association with prostate cancer.ANCESTRYMAP calculates a statistic for association at everyposition in the genome, under a prespecified family of riskmodels, calculating the likelihood of the data at the locus underan average of disease models versus the likelihood of the data ifthe locus has nothing to do with disease (the log base 10 of thisis the LOD score). For most runs, we assume equally likelymodels of 0.3-, 0.4-, 0.6-, 0.7-, 0.8-, 1.2-, 1.5-, and 2-fold increasedrisk because of each copy of a European allele. This family ofmodels reflects the hypothesis that African-derived alleles aremore likely to confer risk but also tests for the alternativepossibility. To obtain an overall assessment of the evidence fora disease locus anywhere in the genome, we average the factorsfor association at each point separately, providing a genome-wide assessment of whether there is a locus in the genomeaffecting risk.
Admixture Scan Accounting for Age of Diagnosis. We carried out anadmixture scan taking into account the possibility that individualswith a younger age of diagnosis contribute a more powerfuladmixture signal, while not inappropriately inflating the signal ofassociation by picking the cutoff giving the strongest signal. We ran22 independent scans for all individuals in the data set withdiagnosis at �50, �53, �56, �57, �59, �60, �61, �62, �63, �64,�65, �66, �67, �69, �70, �71, �73, �74, �75, �76, and �78years of age, as well as all cases (Table 7). Approximately 73 newsamples were added in for each consecutive run. We then averaged
Table 4. rs1447295 association in the Multiethnic Cohort
Group within theMultiethnic Cohort
No. of samplesFrequency ofA allele, %
P value(one-tailed)
OR(95% confidence interval)Cases Controls Cases Controls
Native Hawaiians 70 68 37.0 16.2 0.00015 3.02 (1.66–5.50)*Japanese Americans 449 465 23.8 17.2 0.00034 1.48 (1.18–1.86)*Latino Americans 640 567 13.5 9.5 0.0014 1.48 (1.14–1.91)*European Americans 455 447 13.1 10.0 0.022 1.35 (1.01–1.80)*All samples together 1,614 1,547 4.2 10�9 1.36 (1.22–1.51)†
*OR estimated by using logistic regression adjusted for age.†OR estimated by using logistic regression adjusted for age as well as ethnicity.
14072 � www.pnas.org�cgi�doi�10.1073�pnas.0605832103 Freedman et al.

the genome scores for association, which gives a statistically ap-propriate assessment of the evidence for association.
Permutation Analysis to Test Whether Some Phenotypes ContributeUnduly to the Signal of Association at 8q24. To test whether thecorrelation of the 8q24 admixture association with a phenotypeis significant, we carried out permutation analyses, consideringseparately the effect of stage of disease, grade of tumor, familyhistory, and age of diagnosis (Fig. 2 and Supplemental Note 1).For each phenotype, we rank-ordered individuals by their valuesof the phenotype. We then calculated a cumulative LOD scoreat SNP rs780321 (used to mark the peak) for all individuals beloweach cutoff. We recorded the greatest excess or shortfall of thecumulative LOD score compared with the expectation if itincreased linearly. We then wrote a PERL script to randomlypermute the values of the phenotype over the samples, elimi-nating any relationship between the phenotype and score. A Pvalue was calculated as the fraction of 1,000,000 permutationsthat produced a score for association as extreme as the data.
Inferring the Position of the Disease Locus. To infer the position ofthe disease locus, we note that the LOD scores at each point ofthe genome can be taken to the power of 10 to give the relativeprobability of that locus containing the disease allele. Afternormalization, this calculation provides a probability distribu-
tion for the position of the locus. A 95% credible interval isobtained from the central area under the peak (Fig. 1c).
We thank the men with and without prostate cancer who participated inthis study, Eric Lander and two reviewers for comments and criticism,Loreall Pooler and David Wong from the University of SouthernCalifornia Genomics Laboratory for help with sample handling andgenotyping, Courtney Montague at Harvard Medical School for assis-tance with genotyping, and the National Center for Research ResourcesCenter for Genotyping and Analysis at the Broad Institute, withoutwhich this work would not have been possible. The genotyping for thiswork was supported by National Institutes of Health (NIH) GrantCA63464 (to B.E.H., C.A.H., D.A., and D.R.). M.L.F. was supported bya Department of Defense Health Disparity Training-Prostate ScholarAward (DAMD 17-02-1-0246), by a Howard Hughes Medical Institutephysician postdoctoral fellowship, and by Dana–Farber�Harvard Part-ners Cancer Care Prostate Specialized Programs of Research Excellence(SPORE). N.P. was supported by NIH Career Transition AwardHG02758. E.M.J. and S.A.I. were supported by California CancerResearch Program Grants 99-00527V-10182 and 99-00524V-10258, re-spectively. The Flint Men’s Health Study was supported by the Universityof Michigan SPORE in Prostate Cancer (CA69568), the University ofMichigan Department of Urology, and the University of MichiganComprehensive Cancer Center. K.A.C. was supported by NIH AwardsCA69568 and CA79596, and I.O.-G. and A.S.W. were supported by NIHAward CA67044. D.A. is a Charles E. Culpeper Scholar of the Rock-efeller Brothers Fund and a Burroughs Wellcome Fund Clinical Scholarin Translational Research. D.R. is the recipient of a Burroughs Well-come Career Development Award in the Biomedical Sciences.
1. Jemal A, Siegel R, Ward E, Murray T, Xu J, Smigal C, Thun MJ (2006) CACancer J Clin 56:106–130.
2. Bunker CH, Patrick AL, Konety BR, Dhir R, Brufsky AM, Vivas CA, Becich MJ,Trump DL, Kuller LH (2002) Cancer Epidemiol Biomarkers Prev 11:726–729.
3. Freedland SJ, Isaacs WB (2005) Prostate 62:243–252.4. Simard J, Dumont M, Labuda D, Sinnett D, Meloche C, El-Alfy M, Berger L,
Lees E, Labrie F, Tavtigian SV (2003) Endocr Relat Cancer 10:225–259.5. Smith MW, Patterson N, Lautenberger JA, Truelove AL, McDonald GJ,
Waliszewska A, Kessing BD, Malasky MJ, Scafe C, De Jager PL, et al. (2004)Am J Hum Genet 74:1001–1013.
6. McKeigue PM (1997) Am J Hum Genet 60:188–196.7. Rife DC (1954) Am J Hum Genet 6:26–33.8. Patterson N, Hattangadi N, Lane B, Lohmueller KE, Hafler DA, Oksenberg
JR, Hauser SL, Smith MW, O’Brien SJ, Altshuler D, et al. (2004) Am J HumGenet 74:979–1000.
9. Hoggart CJ, Shriver MD, Kittles RA, Clayton DG, McKeigue PM (2004) AmJ Hum Genet 74:965–978.
10. Montana G, Pritchard JK (2004) Am J Hum Genet 75:771–789.11. Zhu X, Luke A, Cooper RS, Quertermous T, Hanis C, Mosley T, Gu CC, Tang
H, Rao DC, Risch N, et al. (2005) Nat Genet 37:177–181.12. Reich D, Patterson N, De Jager PL, McDonald GJ, Waliszewska A, Tandon
A, Lincoln RR, DeLoa C, Fruhan SA, Cabre P, et al. (2005) Nat Genet37:1113–1118.
13. Amundadottir LT, Sulem P, Gudmundsson J, Helgason A, Baker A, AgnarssonBA, Sigurdsson A, Benediktsdottir KR, Cazier JB, Sainz J, et al. (2006) NatGenet 38:652–658.
14. Kolonel LN, Henderson BE, Hankin JH, Nomura AM, Wilkens LR, Pike MC, StramDO, Monroe KR, Earle ME, Nagamine FS (2000) Am J Epidemiol 151:346–357.
15. John EM, Schwartz GG, Koo J, Van Den Berg D, Ingles S (2005) Cancer Res65:5470–5479.
16. Cooney KA, Strawderman MS, Wojno KJ, Doerr KM, Taylor A, Alcser KH,Heeringa SG, Taylor JM, Wei JT, Montie JE, et al. (2001) Urology 57:91–96.
17. Cooney KA, McCarthy JD, Lange E, Huang L, Miesfeldt S, Montie JE,Oesterling JE, Sandler HM, Lange K (1997) J Natl Cancer Inst 89:955–959.
18. Kittles RA, Chen W, Panguluri RK, Ahaghotu C, Jackson A, Adebamowo CA,Griffin R, Williams T, Ukoli F, Adams-Campbell L, et al. (2002) Hum Genet110:553–560.
19. Whittemore AS, Keller JB, Betensky R (1991) J Natl Cancer Inst 83:1231–1235.
20. van Duin M, van Marion R, Vissers K, Watson JE, van Weerden WM, SchroderFH, Hop WC, van der Kwast TH, Collins C, van Dekken H (2005) GenesChromosomes Cancer 44:438–449.
21. Visakorpi T, Kallioniemi AH, Syvanen AC, Hyytinen ER, Karhu R, TammelaT, Isola JJ, Kallioniemi OP (1995) Cancer Res 55:342–347.
22. Ellwood-Yen K, Graeber TG, Wongvipat J, Iruela-Arispe ML, Zhang J,Matusik R, Thomas GV, Sawyers CL (2003) Cancer Cell 4:223–238.
23. Williams K, Fernandez S, Stien X, Ishii K, Love HD, Lau YF, Roberts RL,Hayward SW (2005) Prostate 63:369–384.
24. Fan JB, Oliphant A, Shen R, Kermani BG, Garcia F, Gunderson KL, HansenM, Steemers F, Butler SL, Deloukas P, et al. (2003) Cold Spring Harbor SympQuant Biol 68:69–78.
25. Tang K, Fu DJ, Julien D, Braun A, Cantor CR, Koster H (1999) Proc Natl AcadSci USA 96:10016–10020.
26. The International HapMap Consortium (2005) Nature 437:1299–1320.
Freedman et al. PNAS � September 19, 2006 � vol. 103 � no. 38 � 14073
GEN
ETIC
S

The Prostate 66:546 ^556 (2006)
E-Cadherin Polymorphisms andHaplotypes InfluenceRisk for ProstateCancer
Carolina Bonilla,1,2 Tshela Mason,2 Layron Long,2 Chiledum Ahaghotu,2,3
Weidong Chen,2 Aiqiu Zhao,2 Aoua Coulibaly,2 Frankly Bennett,4
William Aiken,4 Trevor Tullock,4 Kathleen Coard,4 Vincent Freeman,5,6
and Rick A. Kittles1,2,3*1HumanCancerGenetics,Comprehensive Cancer Center,TheOhio StateUniversity,Columbus,Ohio
2NationalHumanGenomeCenter,College ofMedicine,HowardUniversity,Washington,DC3DivisionofUrology,HowardUniversityHospital,Washington,DC
4TropicalMetabolismResearch Institute,UniversityoftheWest Indies,Mona,Kingston, Jamaica,West Indies5Divisionof EpidemiologyandBiostatistics, Schoolof PublicHealth,Universityof Illinoisat Chicago,Chicago, Illinois
6DepartmentofUrology, LoyolaUniversity Stritch SchoolofMedicine,Maywood, Illinois
BACKGROUND. The E-cadherin (CDH1) gene has been implicated in prostate cancer (PCA)risk, however, the exact mechanism is unknown. Several polymorphisms, such as the C/Avariant�160 base pairs from the transcription start site, in theCDH1 gene promoter region havebeen associated with cancer risk, mainly in European descent populations.METHODS. We screened the entire coding region and 3.0 kilobases of the CDH1 promoter forpolymorphisms in 48 African Americans using dHPLC. Twenty-one (21) polymorphisms wereobserved. Four polymorphisms, including �160C/A, were genotyped in a genetic associationstudy using incident PCA cases (N¼ 427) and unaffected controls (N¼ 337) of similar age fromthree different ethnic groups consisting of African Americans, Jamaicans, and EuropeanAmericans.RESULTS. We observed a significantly higher frequency of the�160A allele among EuropeanAmerican PCA patients (27.5%) compared to the control group (19.7%) (P¼ 0.04). Moreimportantly, among men of European ancestry under the age of 65 who possess the �160 Aallele there was over three times increased risk for prostate cancer (P¼ 0.05). Also, the AACThaplotype bearing the �160A allele was significantly associated with PCA in EuropeanAmericans (P¼ 0.04).CONCLUSIONS. Our data indicate that CDH1 likely is a low-penetrant PCA susceptibilitygene, however, population differences in linkage disequilibrium within the CDH1 gene regionmay influence the effect of susceptibility alleles such as �160A. Prostate 66: 546–556, 2006.# 2005 Wiley-Liss, Inc.
KEY WORDS: CDH1; prostate cancer; African Americans; single nucleotide poly-morphisms (SNP); tumor suppressor; haplotypes
INTRODUCTION
Prostate cancer (PCA) is one of the most commonmalignancies among men in developed countries [1].Risk factors for PCA development include advancedage, ethnicity, and a positive family history. To date,a few susceptibility genes have been identified,although no major predisposition locus has beenobserved so far [2]. Thus, it has been suggested thatlow-penetrance susceptibility genes with higher
Grant sponsor: NIH; Grant numbers: RR03048-13S1, 1U54CA91431-01; Grant sponsor: Department of Defense (to RAK); Grant numbers:DAMD17-00-1-0025, DAMD 17-02-1-0067; Grant sponsor: Depart-ment of Defense (to VF); Grant number: DAMD17-00-1-0029.
*Correspondence to: Rick A. Kittles, PhD, Human Cancer Genetics,Comprehensive Cancer Center, The Ohio State University, 494Tzagournis Medical Research Facility, 420 W. 12th Avenue,Columbus, OH 43210. E-mail: [email protected] 28 August 2005; Accepted 27 September 2005DOI 10.1002/pros.20374Published online 21 December 2005 in Wiley InterScience(www.interscience.wiley.com).
� 2005 Wiley-Liss, Inc.

population frequencies may be relevant in the deter-mination of PCA risk in combination with environ-mental factors [3]. Several common, low penetrantgenes have been identified as potential PCA suscept-ibility genes. These candidate genes include SRD5A2(MIM 607306), CYP3A4 (MIM 124010), CYP3A5 (MIM605325), VDR (MIM 601769), and E-cadherin (MIM192090).
E-cadherin (CDH1) is an adhesion glycoproteinfound in epithelial tissues where it promotes cell–cellunions known as adherens junctions [4]. As malignantcells show poor adhesion properties in addition to lossof differentiated epithelial morphology and increasedcellular motility, it has been proposed that CDH1 mayplay a role in tumor initiation and progression [4]. Infact, loss of CDH1 expression is believed to be thefundamental step in the disruption of tight intercellularcontact that leads to the invasive andmetastatic state oftumors [5]. Earlier studies have provided evidence for arole of CDH1 as a tumor suppressor in several humancancers, where loss or reduced expression of CDH1 hasbeen demonstrated [6–8]. Among the mechanismsresponsible for aberrant CDH1 expression are lossof heterozygosity, promoter hypermethylation, andsomatic and germline mutations. Germline mutationsin CDH1 are present in about one-third of familiesaffected of hereditary diffuse gastric cancer syndrome(HDGC) [9], and have been shown to affect cell motilityand invasion [10]. In lobular breast cancer, completeloss of E-cadherin expression is a characteristic of about80% of the carcinomas, where CDH1 mutations arefairly frequent [11]. In turn, hypermethylation of CpGislands in the CDH1 promoter leading to decreasedgene expression has been found in bladder, breast,colon, liver, oral, and prostate cancers [12]. Further-more, analysis of methylation levels in the CDH1promoter of PCA cell lines has shown that methylationof CDH1 correlates with tumor progression [13].
The CDH1gene is located at 16q22.1 and consists of16 exons spanning approximately 100 kb of genomicDNA. Several polymorphisms, germline and somaticmutations have been identified within its codingregions [9,14,15]. A �160C/A polymorphism in thepromoter was described by Li et al. [13], who reportedreduced transcriptional activity of�70% of the A allelecompared to the C allele. Further research revealed thatthe A allele conferred a modest increased risk of PCAin European populations [16–18]. Yet, no associationbetween �160C/A genotype and tumor progressionor metastasis was evident among Slovenians [18].In Japanese, conflicting results were reported [19,20].However, no studies have explored the relationship ofCDH1 variants with susceptibility to cancer in popula-tions of African descent. Given that prostate cancerexhibits a higher prevalence in African descent
populations compared to the European Americanpopulation, wewere interested in establishingwhethersequence variants in CDH1 could explain in part theelevated risk.
The objective of this study was to screen the CDH1gene for additional sequence polymorphisms inmen ofAfrican descent and test for CDH1 effects on PCA riskby performing case-control association analyses inAfrican Americans, European Americans, and Jamai-cans of African descent. Our results reveal modesteffects of the �160C/A allele on PCA risk amongEuropean Americans. In addition it is likely that CDH1alleles vary in their effect on PCA risk due to theinfluence of other linked functional polymorphismsand possibly other genes (gene–gene interactions).
MATERIALSANDMETHODS
Study Populations
Unrelated men were enrolled from three sites forgenetic association studies of risk factors for PCA. AllPCA cases were between 40 and 85 years of age andwere diagnosed with PCA within a year prior torecruitment. The first group of men consisted of 231African Americans (119 PCA patients and 112 malecontrols) recruited from the Washington, DC areathrough the Division of Urology at the HowardUniversity Hospital and/or PCA screening at theHoward University Cancer Center. Unaffected AfricanAmerican male volunteers were enrolled amongindividuals undergoing regular physical exams at theDivision of Urology at Howard University Hospitaland/or men participating in screening programs forPCA at the Howard University Cancer Center. Thescreening programwas demographically similar to thepatient population seen in the Division of Urologyclinics. The recruitment of controls occurred concur-rently with individuals recruited with PCA. Mean ageof the African American PCA patients was 65.1� 0.9and among controls 67.2� 1.1.
The second group consisted of PCA cases and ageand ethnicity matched controls (89 PCA patients and123 unaffected male controls). All men in this groupwere of African descent and resided on the Caribbeanisland of Jamaica. The Jamaican men were recruitedfrom the University Hospital of the West Indies inKingston, Jamaica during the year 2000. Each casesubject was diagnosed with prostate carcinoma by apathologist. Men free of prostate cancer were alsorecruited from prostate cancer screening programs onthe island. Mean age of the Jamaican PCA patients was67.1� 1.4 and among controls 65.4� 1.0.
The third group consisted of 321 European Amer-ican men (219 PCA patients and 102 unaffected malecontrols) recruited from the Chicago metropolitan area
CDH1and Prostate Cancer Risk 547

through a department of urology at a single academicinstitution (Loyola University Medical Center). Allcases were men diagnosed with clinically localizedPCA and awaiting radical prostatectomy. Clinicallyevaluated healthy male controls of European ancestrywere also recruited from the Chicago metropolitanarea. Mean age of the PCA patients was 61.0� 0.6 andamong controls 63.9� 1.0.
Blood samples were collected from each subject.Clinical characteristics including Gleason grade, pros-tate specific antigen (PSA), and age at diagnosis wereobtained frommedical records. Disease aggressivenesswas defined as ‘‘low’’ (Gleason grade <7) or ‘‘high’’(Gleasongrade�7).All controls hadPSA levels<4.0 ng/ml and normal digital rectal exams (DRE) (Table I).Individuals diagnosedwith benign prostatic hyperpla-sia (BPH)were not considered in this analysis. HowardUniversity Institutional Review Board approved thestudy and written consent was obtained from allsubjects.
SNPDiscovery
Genomic DNA was isolated from lymphocytesusing standard proteinase K digestion, cell lysis,protein precipitation, and DNA precipitation. A totalof 3,000 base pairs upstreamof theATGstart site and all16 exons of CDH1 were screened for DNA sequence
variation by denaturing high-performance liquid chro-matography (dHPLC) using the WaveTM DNA frag-ment analysis system (Transgenomic, Omaha, NE)according to the manufacturer’s instructions. Informa-tion about the primers and PCR conditions used toamplify CDH1 promoter and exon fragments are avail-able upon request.
Genomic DNA from 48 African American indivi-duals (24 cases and 24 controls) was used for SNPdetection, and four SNPs were selected to be typed inthe combined population set. These variants includedtwo within the promoter region (�1004A/T and�160C/A) and two within intron 1 (IVS1þ 5C/G andIVS1þ 6T/C).
Genotyping
CDH1 �1004 SNP was genotyped by direct sequen-cing using anABI 377DNAsequencer (PEBiosystems).The promoter SNP �160C/A was genotyped byrestriction endonuclease digestion and conventionalagarose gel electrophoresis. Polymerase chain reaction(PCR) primers and protocol, as well as digestion condi-tions, were previously reported by Verhage et al. [16].
Genotyping of CDH1 variants IVS1þ 5C/G andIVS1þ 6T/C was performed using PyrosequencingTM
(Pyrosequencing, AB, Uppsala, Sweden) accordingto standard protocols with the PSQ96 automated
TABLE I. Characteristics of Study Populations
Population trait Cases Controls
All populationsNumber of subjects 427 337Mean age in years� SEa 63.5� 0.5 66.0� 0.6Mean serum PSA in ng/ml� SEb 94.9� 21.0 1.1� 0.1Gleason grade �7 (%) 185 (58) —
African AmericansNumber of subjects 119 112Mean age in years� SE 65.1� 0.9 67.2� 1.1Mean serum PSA in ng/ml� SEb 55.1� 16.2 1.1� 0.1Gleason grade �7 (%) 28 (44) —
European AmericansNumber of subjects 219 102Mean age in years� SEa 61.0� 0.6 63.9� 1.0Mean serum PSA in ng/ml� SEb 20.8� 8.9 1.2� 0.8Gleason grade �7 (%) 105 (61) —
JamaicansNumber of subjects 89 123Mean age in years� SE 67.1� 1.2 65.4� 1.0Mean serum PSA in ng/ml� SEb 123.1� 37.2 1.0� 0.4Gleason grade �7 (%) 52 (65) —
aMean age difference between cases and controls significant at P� 0.05.bSerum PSA measured at time of diagnosis for cases and at most recent clinical visit for controls.
548 Bonilla et al.

Pyrosequencing instrument [21]. Fragments wereamplified using the following forward and reverseprimers:CDH1-P1F 50-AGACTCCAGCCCGCTCCA-30 and CDH1-P1R 50-biotin- GGC CCG AAT GCG TCCCT-30. The following pyrosequencing primer was usedto genotype both intronic variants: CDH1-P1pyro 50-CTG CTG CTG CAG GTA-30. All samples weregenotyped twice directly from genomic DNA. ControlDNAs of known genotype were also included. Thecontrol genotypes were confirmed by direct DNAsequencing. Genotypes from the repeat assays were100% concordant with initial genotypes. Presumedalterations in the transcription factor binding sites dueto each variant were predicted using the gene regula-tion website (http://www.gene-regulation.com) [22].
Statistical Analysis
Genotype and allele frequencies were calculatedfor each population. Frequency differences betweenpopulations and between patients and controls withinpopulations were examined by contingency tableanalysis. Hardy–Weinberg equilibrium was evaluatedin each group using a Chi-square test.
Binomial logistic regression was performed usingSPSS software (v.11) to test for association of CDH1genotypes with disease status. We analyzed allpopulations combined, with adjustment for ethnicityand age, and each population separately controlling forage. In addition, we used SAS/Genetics (SAS Institute,Cary, NC) to perform an allele and genotype case-control test and a linear trend test. Specifically, thegenotype test evaluates dominant effects of alleles,whereas the allele and the linear trend tests assessadditive allelic effects.
Haplotype reconstruction and assessment of haplo-type frequency differences between cases and controls,aswell as pairwise linkage disequilibrium for each pairof SNPs, were obtained using SAS/Genetics, whichimplements an EM algorithm [23–25]. Two-sidedPearson Chi-square, odds ratios, and P-values weredetermined for the most frequent haplotypes (>5%)from comparisons between cases and controls using allpopulations combined and each particular population.
Additional analyses involved testing for associationof CDH1 polymorphisms and PCA susceptibility afterstratification of the sample by age (<60/�60 and<65/�65 years), as well as evaluating the association ofCDH1genotypes andhaplotypeswithGleasongrade inPCA patients.
RESULTS
A description of the clinical populations studied isprovided in Table I. Significant differences inmean agebetween cases but not between controls are observed,
with European American cases being about 5 yearsyounger on average than African American andJamaican cases (P< 0.001). Mean age differs signifi-cantly between cases and controls only in EuropeanAmericans and the combined sample (P� 0.05). Therealso appears to be substantial differences in the meanPSA between the three samples. African Americancases have statistically higher PSA values than Eur-opean American cases; in addition, Jamaican PSAvalues tended to be significantly higher than AfricanAmericans (P< 0.001). The significant differences inPSA levels between each group suggest that we maypotentially be comparing different PCA disease phe-notypes with respect to stage, however, the percentageof cases with Gleason grade �7 ranged from 44%among African Americans to 65% among Jamaicans.
We identified 21 polymorphisms in CDH1: 8 in thepromoter, 9 in introns, and 4 in exons. Table II showsthe polymorphisms that were found in the promoter,coding, and non-coding regions of CDH1 and theputative alterations in transcription factor binding sitesor amino acids due to the sequence variant. Three of thepromoter SNPs have been described before; �160C/Aby Li et al. [13] and Nakamura et al. [14], while�1004A/T and �906C/A can be found in dbSNP andHapMap websites. All other promoter SNPs are novelfindings. In addition, we found four new intronicpolymorphisms in introns 1, 3, 9, and 15.
We selected four CDH1 variants to genotype in allpopulations. The promoter SNP�1004A/Twas chosenbecause the T allele eliminates a C/EBPa and a Hbbinding sites and creates aMEB-1 binding site. Anotherpromoter SNP, �160C/A, was selected based on pre-vious literature reports that describe its associationwith several types of cancers, and because it showed aminor allele frequency of �20% in our screeningsample. In addition, intronic polymorphisms IVS1þ5C/G and IVS1þ 6T/Cwere typed because they had amoderate to high minor allele frequency (9 and 16%,respectively), and because they could potentially affectsplicing sites due to their proximity to the exon/intronboundary. Only SNP IVS1þ 6T/C deviated markedlyfrom Hardy–Weinberg equilibrium among Jamaicanpatients (P¼ 0.002). Polymorphisms �1004A/T and�160C/A were moderately out of Hardy–Weinbergequilibrium among African American cases andEuropean American controls, respectively (P< 0.05).
Genotype and variant allele frequencies of the fourselected polymorphisms in the study populations areshown in Table III. Significant differences betweenpopulations were detected for SNPs �1004A/T,IVS1þ 5C/G, and IVS1þ 6T/C. Within each ethnicity,however, there were no differences in prevalence ofallele betweenpatients and controls. On the other hand,SNP �160C/A did not show any difference in allele
CDH1and Prostate Cancer Risk 549

frequency across populations but EuropeanAmericanscases and controls were significantly different in alleleand genotype frequencies (P< 0.05). Jamaican affectedand unaffected subjects differed significantly withrespect to marker IVS1þ 6T/C genotypic frequencies(P¼ 0.02). Despite EuropeanAmerican patients havinghigher frequencies of the �160A allele compared tocontrols of the same ancestry, the logistic regressionanalysis yielded a non-significant result for the age-adjusted analysis of �160C/A genotype and PCA risk(Table IV). The fact that the unadjusted genotype, alleleand linear trend tests revealed modestly significantassociationswith PCA in European Americans is likelydue to the absence of controls who were homozygotefor the polymorphism. For the Jamaican subjects, SNPIVS1þ 6T/C was significantly associated with PCAeven after controlling for age (Table IV). However, thisresult should be interpreted with caution as geno-types among Jamaican patients were noticeably out ofHardy–Weinberg equilibrium. Finally, no associationwith PCA was observed for SNPs �1004A/T andIVS1þ 5C/G in any population (Table IV).
Linkage disequilibrium between pairs of markerswas quite strong across the region in all populations,
especially betweenSNPs�1004A/T, IVS1þ 5C/G, andIVS1þ 6T/C (P< 0.05). Polymorphism �160C/A wasnot significantly linked to �1004A/T in any popula-tion, while it showed significant linkage only to SNPIVS1þ 6T/C in European Americans, and to IVS1þ5C/G in African Americans. SNPs IVS1þ 5C/G andIVS1þ 6T/C were strongly linked in all groups due tothe very small distance between them (1 base pair)(Table V).
Haplotype analysis revealed a greater number ofhaplotypes in the African American (eight haplotypes,five of them common, i.e., >5%) and Jamaican popula-tions (nine haplotypes, four of them common), than inthe European American population (six haplotypes,three of them common). Three haplotypes (ACCT,ACCC, and AACT) comprised �98% of all chromo-somes in European Americans, but only �84% inAfrican Americans and �77% in Jamaicans.
Among all cases combined and controls combined,we observed amarginally significant increased diseaserisk for haplotype AACT (OR¼ 1.5, 95%CI: 1.0–2.2),P¼ 0.05, Table VI). Subset analyses revealed no signi-ficant differences in the distribution of haplotypesamong African American (P¼ 0.79) or Jamaican
TABLE II. Polymorphisms Identif|ed in theCDH1Screeningof AfricanAmericanControls
Positiona Location Polymorphism Frequencyb Effectc Ref./dbSNP rs#
�1004 Promoter A>T 0.07 C/EBPa andHb!MEB-1
rs13335980
�906 Promoter C>A 0.15 No change rs7194355�782 Promoter C>T 0.01 Ap-2a!NF-1 This study�752 Promoter C>T 0.01 C/EBPa!C/EBPb This study�599 Promoter C>T 0.15 No change This study�486 Promoter A insertion 0.10 Deletes C/EBPa This study�479 Promoter G>T 0.02 No change This study�160 Promoter C>A 0.19 68% decreased
transcriptionalactivity
[14,38] rs16260
IVS1þ 5þ 53 Intron 1 C>G 0.09 n/a This studyIVS1þ 6þ 54 Intron 1 T>C 0.16 n/a [39] rs3743674þ110 Intron 1 13 bp deletion 0.10 n/a [40] rs3833051þ123 Intron 1 7 bp insertion 0.05 n/a [40] rs3833051IVS3þ 76 Intron 3 C>A 0.05 n/a This studyIVS4þ 541 Intron 4 G>C 0.04 n/a [41]þ933 Exon 7 C>G 0.07 Leu311Leu [42]IVS9þ 45 Intron 9 G>C 0.13 n/a This studyþ1849 Exon 12 G>A 0.02 Ala617Thr [42]þ1896 Exon 12 C>T 0.05 His632His [42]IVS12–13 Intron 12 T>C 0.05 n/a [43]þ2253 Exon 14 C>T 0.24 Asn751Asn [42]IVS15þ 22 Intron 15 C>T 0.07 n/a This study
SNPs typed in the association study are shown in boldface. n/a, not available.aNumber of base pairs from ATG start codon.bFrequency of polymorphism in 24 African American unaffected controls.cTranscriptional binding site change or amino acid change.
550 Bonilla et al.

(P¼ 0.69) cases and controls. Interestingly, amongEuropean Americans, PCA patients and unaffectedsubjects differed significantlywith respect to haplotypefrequencies (P¼ 0.02). European American PCA casesdisplayed a higher frequency of the single commonhaplotype that carried the�160A variant (AACT), anda lower frequency of the wild-type haplotype (ACCT)compared to controls (Table VI). HaplotypeAACTwasassociated with �2-fold increased risk for PCA in anunadjusted analysis in European Americans (P¼ 0.04).However, after stratifying the sample by age, the effectof the �160A allele on PCA susceptibility was moreapparent among individuals under the age of 65(OR¼ 3.2, 95% CI: 1.0–10.7, P¼ 0.05) than in oldersubjects. In Jamaicans, on the other hand, the associa-tion of SNP IVS1þ 6T/C with disease was stronger inthe �60 group (OR¼ 2.7, 95%CI: 1.3–5.7, P¼ 0.01).
When we stratified all PCA cases according todisease aggressiveness (low grade vs. high gradeGleason score) we did not observe any correlationbetween disease aggression and individual SNPgenotypes or haplotypes in any population (data not
shown). We do note however, the limitations ofstratification of PCA by Gleason grade. These includethe potential within and between-observer variation ingrading, especially across international sites [26–30].Nevertheless, European Americans with more aggres-sive disease (Gleason score �7) showed a significantlyhigher �160A allele frequency than controls (0.29 vs.0.20, respectively, P¼ 0.04).
DISCUSSION
Since Li et al. [13] identified the functional CDH1�160C/A SNP (68% decreased transcription for the Aallele), a number of studies have evaluated the effect ofthis polymorphism on the development and progres-sion of different types of cancer. In a case-control studyof gastric cancer among Taiwanese conducted byWu et al. [44], individuals homozygous for the Avariantwere five times less likely to contract the diseasethan those homozygous for the C wild-type allele.Additionally, the authors did not observe any correla-tion ofCDH1 genotype and tumor stage or lymph node
TABLE III. Genotype andAllele Frequencies (%) ofCDH1Polymorphisms in Prostate CancerCases andControls
SNP
All subjects African Americans European Americans Jamaicans
Cases(N¼ 427)
Controls(N¼ 337)
Cases(N¼ 119)
Controls(N¼ 112)
Cases(N¼ 219)
Controls(N¼ 102)
Cases(N¼ 89)
Controls(N¼ 123)
�1004 A/TAA 89.6 84.8 88.1 84.7 98.6 100.0 69.7 72.4AT 9.5 14.0 10.2 15.3 1.4 0.0 28.1 24.4TT 0.9 1.2 1.7 0.0 0.0 0.0 2.2 3.2T 5.7 8.2 6.8 7.7 0.7 0.0 16.3 15.5
�160 C/ACC 62.2 66.3 68.6 68.4 51.1 60.7 79.0 69.4CA 33.4 31.9 29.4 29.6 42.9 39.3 17.3 27.5AA 4.4 1.8 2.0 2.0 6.0 0.0 3.7 3.1A 21.1 17.7 16.7 16.8 27.5 19.7 12.3 16.8
IVS1þ 5 C/GCC 84.6 77.7 79.5 73.6 97.0 99.0 62.9 64.2CG 14.4 19.9 17.9 24.6 3.0 1.0 36.0 30.8GG 1.0 2.4 2.6 1.8 0.0 0.0 1.1 5.0G 8.2 12.4 11.5 14.1 1.5 0.5 19.1 20.4
IVS1þ 6 T/CTT 56.1 50.4 51.3 50.0 74.8 67.0 20.2 37.5TC 36.8 40.4 38.4 40.0 22.8 32.0 66.3 47.5CC 7.1 9.2 10.3 10.0 2.5 1.0 13.5 15.0C 25.5 29.4 29.5 30.0 13.9 17.0 46.6 38.8
Genotype and allele frequencies of �1004, IVS1þ 5, and IVS1þ 6 differ significantly between population controls (P< 0.001).IVS1þ 5 genotype frequencies differ significantly between cases and controls when all populations are combined (P¼ 0.04).SNP �160 genotype and allele frequencies differ significantly between cases and controls in European Americans (P¼ 0.04).IVS1þ 6 genotype frequencies differ significantly between cases and controls in Jamaicans (P¼ 0.02).
CDH1and Prostate Cancer Risk 551

metastasis. In contrast, Humar et al. [34] described theassociation of themutant A allele with sporadic diffusegastric cancer in Italy. No association was foundbetween �160C/A genotype and risk of stomachcancer in three populations of European origin, namelyCanadians, Germans, and Portuguese [31]. In urothe-lial cancer, however, Japanese individuals carrying theAA genotype had a 2.3-fold increased risk of beingaffected by the disease than CC individuals, althoughno correlation with tumor progression was detected[32]. An association of the A allele with risk fortransitional cell carcinoma of the bladder as well as itscorrelation with malignancy progression was observ-ed among Chinese [33]. Regarding PCA, conflictingresults have been published. Elevated risk for DutchA-carriers was initially described by Verhage et al. [16],with a stronger effect among sporadic cancer cases (�5-fold) than among hereditary cancer patients (�2-fold).An opposite finding was reported by Jonsson et al. [17]using pooled studies from Sweden. There theyobserved an association between hereditary PCA andthe �160C/A genotype so that A-carriers were twicemore likely to develop the disease than CC subjects. Itshould be noted that the association was not observed
for sporadic PCA. The effect of the A allele was foundto be even lower and non-significant, among sporadiccases from a Slovenian population (OR¼ 1.4, 95%CI¼0.9–2.4) [18]. In addition, no significant correlationof genotype and stage of disease was observed in ourstudy. Similarly, risk of PCA, as well as tumorinvasiveness and differentiation were not found to beassociated with CDH1 �160C/A polymorphism inJapanese by Tsukino et al. [20]. On the other hand,Kamoto et al. [19] reported a significant associationbetween advanced prostate cancer and �160C/Agenotype (CAþAA) compared to male controls inJapanese.
In this study, we have identified new polymorph-isms in the promoter and introns of the CDH1 geneamid others already described. In addition to SNP�160C/Awe have genotyped three of these variants ina diverse population of cases and controls consisting ofAfrican Americans, European Americans, and Jamai-cans. Genotype frequency differences between affectedand unaffected individuals were apparent only forSNPs �160C/A and IVS1þ 6T/C in European Amer-icans and Jamaicans, respectively. Particularly, theabsence of individuals homozygous for the �160A
TABLE IV. CDH1Genotypes andRiskof Prostate Cancer
SNP genotype ORa 95% CI P-value
�1004 A/TAA 1.00 ReferenceAll subjects AT/TT 0.93 0.58–1.49 0.75African Americans AT/TT 0.76 0.35–1.64 0.49European Americans AT/TTb — — —Jamaicans AT/TT 1.00 0.54–1.88 0.99
�160 C/ACC 1.00 ReferenceAll subjects CA/AA 0.92 0.62–1.35 0.66African Americans CA/AA 1.07 0.58–1.98 0.82European Americans CA/AA 1.23 0.57–2.64 0.60Jamaicans CA/AA 0.57 0.28–1.15 0.12
IVS1þ 5 C/GCC 1.00 ReferenceAll subjects CG/GG 0.86 0.57–1.31 0.49African Americans CG/GG 0.75 0.40–1.40 0.37European Americans CG/GG 0.56 0.06–5.45 0.62Jamaicans CG/GG 1.01 0.56–1.81 0.99
IVS1þ 6 T/CTT 1.00 ReferenceAll subjects TC/CC 1.22 0.85–1.76 0.28African Americans TC/CC 0.98 0.58–1.66 0.94European Americans TC/CC 0.78 0.35–1.77 0.55Jamaicans TC/CC 2.27 1.19–4.34 0.01
aOR adjusted by age and ethnicity in all subjects and by age in each population.bThis SNP was monomorphic in European American controls.
552 Bonilla et al.
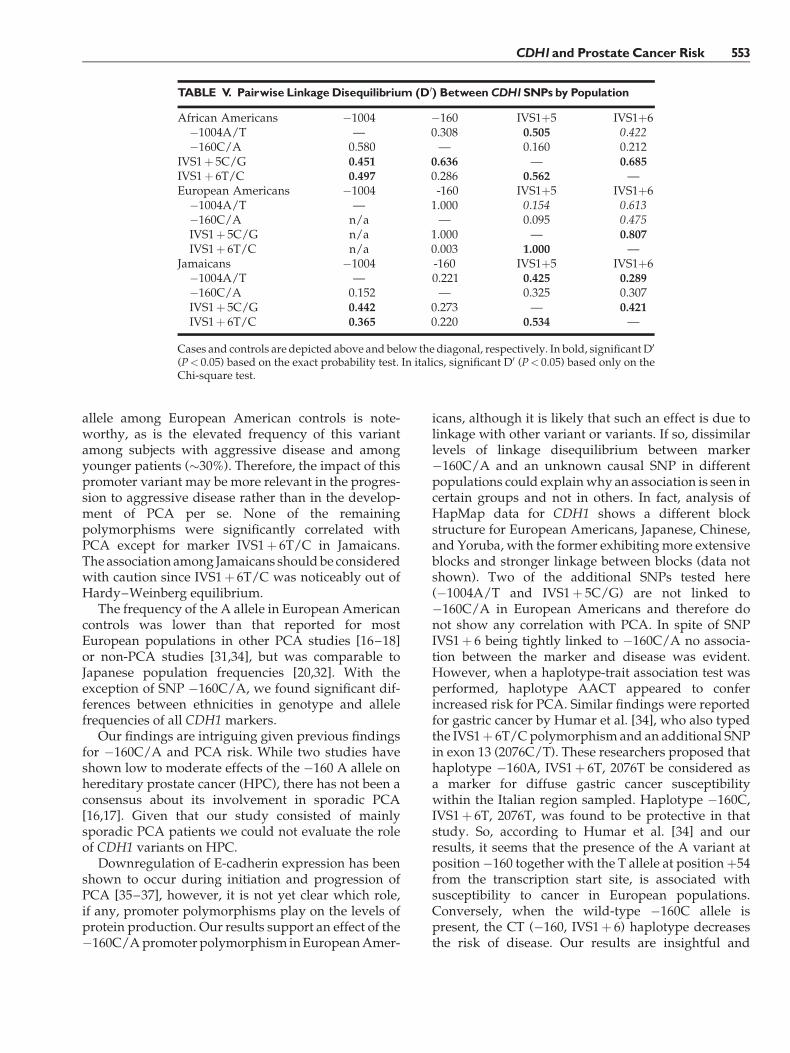
allele among European American controls is note-worthy, as is the elevated frequency of this variantamong subjects with aggressive disease and amongyounger patients (�30%). Therefore, the impact of thispromoter variant may be more relevant in the progres-sion to aggressive disease rather than in the develop-ment of PCA per se. None of the remainingpolymorphisms were significantly correlated withPCA except for marker IVS1þ 6T/C in Jamaicans.The association among Jamaicans shouldbe consideredwith caution since IVS1þ 6T/C was noticeably out ofHardy–Weinberg equilibrium.
The frequency of the A allele in European Americancontrols was lower than that reported for mostEuropean populations in other PCA studies [16–18]or non-PCA studies [31,34], but was comparable toJapanese population frequencies [20,32]. With theexception of SNP �160C/A, we found significant dif-ferences between ethnicities in genotype and allelefrequencies of all CDH1 markers.
Our findings are intriguing given previous findingsfor �160C/A and PCA risk. While two studies haveshown low to moderate effects of the �160 A allele onhereditary prostate cancer (HPC), there has not been aconsensus about its involvement in sporadic PCA[16,17]. Given that our study consisted of mainlysporadic PCA patients we could not evaluate the roleof CDH1 variants on HPC.
Downregulation of E-cadherin expression has beenshown to occur during initiation and progression ofPCA [35–37], however, it is not yet clear which role,if any, promoter polymorphisms play on the levels ofprotein production. Our results support an effect of the�160C/Apromoterpolymorphism inEuropeanAmer-
icans, although it is likely that such an effect is due tolinkage with other variant or variants. If so, dissimilarlevels of linkage disequilibrium between marker�160C/A and an unknown causal SNP in differentpopulations could explainwhy an association is seen incertain groups and not in others. In fact, analysis ofHapMap data for CDH1 shows a different blockstructure for European Americans, Japanese, Chinese,and Yoruba, with the former exhibitingmore extensiveblocks and stronger linkage between blocks (data notshown). Two of the additional SNPs tested here(�1004A/T and IVS1þ 5C/G) are not linked to�160C/A in European Americans and therefore donot show any correlation with PCA. In spite of SNPIVS1þ 6 being tightly linked to �160C/A no associa-tion between the marker and disease was evident.However, when a haplotype-trait association test wasperformed, haplotype AACT appeared to conferincreased risk for PCA. Similar findings were reportedfor gastric cancer by Humar et al. [34], who also typedthe IVS1þ 6T/Cpolymorphism and an additional SNPin exon 13 (2076C/T). These researchers proposed thathaplotype �160A, IVS1þ 6T, 2076T be considered asa marker for diffuse gastric cancer susceptibilitywithin the Italian region sampled. Haplotype �160C,IVS1þ 6T, 2076T, was found to be protective in thatstudy. So, according to Humar et al. [34] and ourresults, it seems that the presence of the A variant atposition�160 together with the T allele at positionþ54from the transcription start site, is associated withsusceptibility to cancer in European populations.Conversely, when the wild-type �160C allele ispresent, the CT (�160, IVS1þ 6) haplotype decreasesthe risk of disease. Our results are insightful and
TABLE V. Pairwise LinkageDisequilibrium (D0) BetweenCDH1SNPsby Population
African Americans �1004 �160 IVS1þ5 IVS1þ6�1004A/T — 0.308 0.505 0.422�160C/A 0.580 — 0.160 0.212
IVS1þ 5C/G 0.451 0.636 — 0.685IVS1þ 6T/C 0.497 0.286 0.562 —European Americans �1004 -160 IVS1þ5 IVS1þ6�1004A/T — 1.000 0.154 0.613�160C/A n/a — 0.095 0.475IVS1þ 5C/G n/a 1.000 — 0.807IVS1þ 6T/C n/a 0.003 1.000 —
Jamaicans �1004 -160 IVS1þ5 IVS1þ6�1004A/T — 0.221 0.425 0.289�160C/A 0.152 — 0.325 0.307IVS1þ 5C/G 0.442 0.273 — 0.421IVS1þ 6T/C 0.365 0.220 0.534 —
Cases and controls are depicted above and below the diagonal, respectively. In bold, significant D0
(P< 0.05) based on the exact probability test. In italics, significant D0 (P< 0.05) based only on theChi-square test.
CDH1and Prostate Cancer Risk 553

suggest that E-cadherin may contribute to PCA risk ina complex manner due to multiple variants, each ofwhich may exhibit differing effects. However, in thefuture, other polymorphisms and haplotypes in theregion should be evaluated in order to quantifypredisposing polymorphisms and the at-risk haploty-pic background.
ELECTRONICDATABASEINFORMATION
Prediction of transcription factor binding sites inthe promoter region of the CDH1 gene was perform-ed using a web-based program: http://www.gene-regulation.com
Online Mendelian Inheritance in Man (OMIM):http://www.ncbi.nih.gov/OMIM [for CDH1 (MIM
192090), CYP3A4 (MIM 124010), CYP3A5 (MIM605325), SRD5A2 (MIM 607306), and VDR (MIM601769)]
dbSNP for SNP information: http://www.ncbi.nlm.nih.gov/dbSNP
HapMap: http://www.hapmap.org/
ACKNOWLEDGMENTS
The authors would like to thank all the men whovolunteered to participate in this genetic study.
REFERENCES
1. SiddiquiE,MumtazF,Gelister J.Understandingprostate cancer.J R Soc Health 2004;124(5):219–221.
TABLE VI. EstimatedCDH1Haplotype Frequencies in ProstateCancerCases andControls andDiseaseRiskby Population
Population/haplotypes Cases (%) Controls (%) ORa 95% CI P-value
All subjectsACCT 54.5 55.3 0.98 0.73–1.30 0.86ACCC 16.7 14.7 1.14 0.77–1.70 0.50ACGC 2.2 4.4 0.46 0.20–1.07 0.07AACT 19.9 14.4 1.46 0.99–2.15 0.05TCGC 4.8 6.8 0.67 0.36–1.24 0.20Rare haplotypesP¼ 0.13b
1.9 4.4 — — —
African AmericansACCT 55.0 56.0 0.94 0.56–1.57 0.80ACCC 17.7 13.5 1.39 0.67–2.85 0.37ACGC 3.8 5.9 0.66 0.20–2.14 0.48AACT 14.9 13.6 1.15 0.55–2.41 0.71TCGC 5.8 7.6 0.72 0.26–1.99 0.52Rare haplotypesP¼ 0.79b
2.8 3.4 — — —
European AmericansACCT 59.2 66.8 0.73 0.45–1.19 0.21ACCC 11.9 13.0 0.92 0.45–1.88 0.82ACGC 0.4 0.5 0.46 0.03–7.48 0.58AACT 26.9 16.2 1.84 1.01–3.36 0.04TCGC 0.2 0.0 — — —Rare haplotypesP¼ 0.02b
1.4 3.5 — — —
JamaicansACCT 42.6 45.8 0.89 0.51–1.54 0.68ACCC 26.4 16.4 1.79 0.91–3.52 0.09ACGC 3.4 6.2 0.50 0.13–1.95 0.31AACT 10.2 13.0 0.75 0.32–1.79 0.52TCGC 14.6 12.0 1.23 0.55–2.74 0.61Rare haplotypesP¼ 0.69b
2.8 6.6 — — —
aOR calculated testing each haplotype against all other haplotypes combined.bP-value for the omnibus test of differences in haplotype frequencies between cases and controls.
554 Bonilla et al.

2. Simard J, Dumont M, Labuda D, Sinnett D, Meloche C, El-AlfyM, Berger L, Lees E, Labrie F, Tavtigian S. Prostate cancersusceptibility genes: Lessons learned and challenges posed.Endocr Relat Cancer 2003;10(2):225–259.
3. Gsur A, Feik E, Madersbacher S. Genetic polymorphisms andprostate cancer risk. World J Urol 2004;21(6):414–423.
4. Pecina-Slaus N. Tumor suppressor gene E-cadherin and its rolein normal and malignant cells. Cancer Cell Int 2003;3(1):17.
5. HazanR,Qiao R, Keren R, Badano I, SuyamaK. Cadherin switchin tumor progression. Ann NY Acad Sci 2004;1014:155–163.
6. Tsutsumida A, Hamada J, Tada M, Aoyama T, Furuuchi K,Kawai Y, Yamamoto Y, Sugihara T, Moriuchi T. Epigeneticsilencing of E- and P-cadherin gene expression in humanmelanoma cell lines. Int J Oncol 2004;25(5):1415–1421.
7. Lin Y, Wu M, Li D, Wu X, Zheng R. Prognostic andclinicopathological features of E-cadherin, alpha-catenin, beta-catenin, gamma-catenin and cyclin D(1) expression in humanesophageal squamous cell carcinoma. World J Gastroenterol2004;10(22):3235–3239.
8. Salon C, Moro D, Lantuejoul S, Brichon Py P, Drabkin H,Brambilla C, Brambilla E. E-cadherin-beta-catenin adhesioncomplex in neuroendocrine tumors of the lung: A suggestedrole upon local invasion and metastasis. Hum Pathol2004;35(9):1148–1155.
9. Oliveira C, Ferreira P, Nabais S, Campos L, Ferreira A, Cirnes L,Castro-Alves C, Veiga I, FragosoM, Regateiro F,Moreira Dias L,Moreira H, Suriano G, Machado J, Lopes C, Castedo S, CarneiroF, SerucaR. E-cadherin (CHD1) andp53 rather than SMAD4 andCaspase-10 germline mutations contribute to genetic predis-position in Portuguese gastric cancer patients. Eur J Cancer2004;40(12):1897–1903.
10. Suriano G, Oliveira M, Huntsman D, Mateus A, Ferreira P,Casares F, Oliveira C, Carneiro F, Machado J, Mareel M, SerucaR. E-cadherin germline missense mutations and cell phenotype:Evidence for the independence of cell invasion on the motilecapabilities of the cells. HumMol Genet 2003;12(22):3007–3016.
11. Sarrio D, Moreno-Bueno G, Hardisson D, Sanchez-Estevez C,Guo M, Herman J, Gamallo C, Esteller M, Palacios J. Epigeneticand genetic alterations ofAPC andCDH1 genes in lobular breastcancer: Relationships with abnormal E-cadherin and cateninexpression and microsatellite instability. Int J Cancer 2003;106(2):208–215.
12. Wheelock M, Johnson K. Cadherins as modulators of cellularphenotype. Annu Rev Cell Dev Biol 2003;19:207–235.
13. Li L, ZhaoH,NakajimaK, OhB, Alves Ribeiro Filho L, Carroll P,Dahiya R. Methylation of the E-cadherin gene promotercorrelates with progression of prostate cancer. J Urol 2001;166(2):705–709.
14. NakamuraA, Shimazaki T, KanekoK, ShibataM,Matsumura T,Nagai M, Makino R, Mitamura K. Characterization of DNApolymorphisms in theE-cadheringene (CDH1) promoter region.Mutat Res 2002;502(1–2):19–24.
15. Berx G, Becker K, Hofler H, van Roy F. Mutations in the humanE-cadherin (CDH1) gene. HumMutat 1998;12(4):226–237.
16. VerhageB, vanHouwelingenK, Ruijter T, KiemeneyL, SchalkenJ. Single-nucleotide polymorphism in the E-cadherin genepromoter modifies the risk of prostate cancer. Int J Cancer2002;100(6):683–685.
17. Jonsson B, AdamiH,HagglundM, BerghA, Goransson I, StattinP, Wilklund F, Gronberg H. �160C/A polymorphism in the E-cadherin gene promoter and risk of hereditary, familial andsporadic prostate cancer. Int J Cancer 2004;109(3):348–352.
18. HajdinjakT, ToplakN.E-cadherinpolymorphism�160C/Aandprostate cancer. Int J Cancer 2004;109(3):480–481.
19. Kamoto T, Isogawa Y, Shimizu Y, Minamiguchi S, Kinoshita H,Kakehi Y,Mitsumori K, Yamamoto S,Habuchi T, Kato T,OgawaO.Associationof a genetic polymorphismof theE-cadheringenewith prostate cancer in a Japanese population. Jpn J Clin Oncol2005;35(3):158–161.
20. Tsukino H, Kuroda Y, Imai H, Nakao H, Qiu D, Komiya Y,Inatomi H, Hamasaki T, Kohshi K, Osada Y, Katoh T. Lack ofevidence for the association of E-cadherin gene polymorphismwith increased risk or progression of prostate cancer. Urol Int2004;72(3):203–207.
21. Panguluri R, Long L, Chen W, Wang S, Coulibaly A, Ukoli F,Jackson A, Weinrich S, Ahaghotu C, Isaacs W, Kittles R. COX-2gene promoter haplotypes and prostate cancer risk. Carcinogen-esis 2004;25(6):961–966.
22. Grabe N. AliBaba2: Context specific identification of transcrip-tion factor binding sites. In Silico Biol 2002;2(1):S1–S15.
23. HawleyM,KiddK.Haplo:Aprogramusing theEMalgorithmtoestimate the frequencies of multi-site haplotypes. J Hered1995;86:409–411.
24. Long J, Williams R, Urbanek M. An E-M algorithm and testingstrategy for multiple-locus haplotypes. Am J Hum Genet 1995;56(3):799–810.
25. Excoffier L, Slatkin M. Maximum-likelihood estimation ofmolecular haplotype frequencies in a diploid population. MolBiol Evol 1995;12:921–927.
26. Bostwick D. Gleason grading of prostatic needle biopsies:Correlation with grade in 316 matched prostatectomies. Am JSurg Pathol 1994;18(8):796–803.
27. Steinberg D, Sauvageot J, Piantadosi S, Epstein J. Correlation ofprostate needle biopsy and radical prostatectomyGleason gradein academic and community settings. Am J Surg Pathol 1997;21(5):566–576.
28. CarlsonG,CalvaneseC,KahaneH, Epstein J.Accuracy of biopsyGleason scores from a large uropathology laboratory: Use of adiagnostic protocol to minimize observer variability. Urology1998;51(4):525–529.
29. Freeman V, Coard K, Wojcik E, Durazo-Arvizu R. Use of theGleason system in international comparisons of prostaticadenocarcinomas in Blacks. Prostate 2004;58(2):169–173.
30. Coard K, Freeman V. Gleason grading of prostate cancer. Am JClin Pathol 2004;122(3):373–376.
31. Pharoah P, Oliveira C, Machado J, Keller G, Vogelsang H, LauxH, Becker K,HahnH, Paproski S, BrownL, Caldas C,HuntsmanD. CDH1 c-160a promotor polymorphism is not associated withrisk of stomach cancer. Int J Cancer 2002;101(2):196–197.
32. Tsukino H, Kuroda Y, Nakao H, Imai H, Inatomi H, Kohshi K,Osada Y, Katoh T. E-cadherin gene polymorphism and risk ofurothelial cancer. Cancer Lett 2003;195(1):53–58.
33. ZhangX,MaX, ZhuQ, Li L, ChenZ, YeZ.Association between aC/A single nucleotide polymorphism of the E-cadherin genepromoter and transitional cell carcinoma of the bladder. J Urol2003;170(4 Pt 1):1379–1382.
34. Humar B, Graziano F, Cascinu S, CatalanoV, RuzzoA,MagnaniM, Toro T, Burchill T, Futschik M, Merriman T, Guilford P.Association of CDH1 haplotypes with susceptibility to sporadicdiffuse gastric cancer. Oncogene 2002;21(53):8192–8195.
35. Rubin M, Mucci N, Figurski J, Fecko A, Pienta K, Day M. E-cadherin expression in prostate cancer: A broad survey usinghigh-density tissue microarray technology. Hum Pathol2001;32(7):690–697.
CDH1and Prostate Cancer Risk 555

36. Kallakury B, Sheehan C, Winn-Deen E, Oliver J, Fisher H,Kaufmann RJ, Ross J. Decreased expression of catenins (alphaand beta), p120CTN, and E-cadherin cell adhesion proteins andE-cadherin gene promoter methylation in prostatic adenocarci-nomas. Cancer 2001;92(11):2786–2795.
37. Wehbi N, Dugger A, Bonner R, Pitha J, Hurst R, Hemstreet Gr.Pan-cadherin as a high level phenotypic biomarker for prostatecancer. J Urol 2002;167(5):2215–2221.
38. Li L, Chui R, SasakiM,NakajimaK, PerincheryG, AuH,NojimaD, Carroll P, Dahiya R. A single nucleotide polymorphism in thee-cadherin gene promoter alters transcriptional activities.Cancer Res 2000;60:873–876.
39. Avizienyte E, LaunonenV, SalovaaraR, Kiviluoto T,Aaltonen L.E-cadherin is not frequently mutated in hereditary gastriccancer. J Med Genet 2001;38(1):49–52.
40. Haga H, Yamada R, Ohnishi Y, Nakamura Y, Tanaka T. Gene-based SNP discovery as part of the Japanese MillenniumGenome Project: Identification of 190,562 genetic variations in
the human genome. Single nucleotide polymorphism. J HumGenet 2002;47(11):605–610.
41. BerxG, Cleton-JansenA,Nollet F, de LeeuwW, van deVijverM,Cornelisse C, van Roy F. E-cadherin is a tumour/invasionsuppressor gene mutated in human lobular breast cancers.EMBO J 1995;14(24):6107–6115.
42. Risinger J, Berchuck A, Kohler M, Boyd J. Mutations of the E-cadherin gene in human gynecologic cancers. Nat Genet1994;7(1):98–102.
43. BerxG, Cleton-JansenA, StrumaneK, de LeeuwW,Nollet F, vanRoy F, Cornelisse C. E-cadherin is inactivated in a majority ofinvasive human lobular breast cancers by truncation mutationsthroughout its extracellular domain.Oncogene 1996;13(9):1919–1925.
44. Wu MS, Huang SP, Chang YT, Lin MT, Shun CT, Chang MC,Wang HP, Chen CJ, Lin JT. Association of the �160C!Apromoter polymorphism of E-cadherin gene with gastriccarcinoma risk. Cancer 2002;94(5):1443–1448.
556 Bonilla et al.


