Performance Based Planning and Federal Target Setting
9
Performance Based Planning and Federal Target Setting Transportation Policy Board April 12, 2018
Transcript of Performance Based Planning and Federal Target Setting

Performance Based Planning and Federal Target Setting
Transportation Policy Board April 12, 2018

Presentation Overview
• Background – Federal Performance Requirements
• Progress to date
• What has PSRC accomplished so far?
• What measures and targets remain to be finalized in 2018?
• How does PSRC go beyond these requirements?

Federal Requirements - Background
MAP-21 and the FAST Act established new emphasis on performance
and outcome based planning
• Required USDOT to establish performance measures in a number of areas
• State DOTs and MPOs to “collaboratively” set targets for these measures
• Regular coordination has been going on between WSDOT and MPOs since 2016
• Target Setting Framework Group – WSDOT and MPO Directors
• Target Setting Working Group and Technical Teams – WSDOT and MPO Staff
• Federal performance measures are specific and prescriptive

Progress to Date
PSRC Board Schedule
Performance Targets Action
Transit Asset Management Approved June 2017
Safety Performance Approved January 2018
Bridge and Pavement Condition Due Fall 2018
System Performance Due Fall 2018
Freight Movement Due Fall 2018
Congestion Mitigation and Air Quality
Improvement Program (CMAQ)
Due Fall 2018

Upcoming Federal Targets
• Bridge Condition – Percentage of state bridges classified as good or poor
• Pavement Condition – Percentage of pavement on the National Highway System
and the Interstate in good or poor condition
• Freight Movement - truck travel time reliability on the Interstate
• System Performance –
• Travel time reliability on the National Highway System
• Traffic congestion – peak hour delay, and percent of non-SOV travel
• Congestion Mitigation and Air Quality Improvement Program - Emissions reduced
from projects funded with CMAQ dollars

PSRC Performance Measures
• How many boardings are occurring every year on the
region’s fixed route transit system?
• How many people have access to a bus or train that
operates every 15 minutes or less?
• How many people walk and bike to get somewhere
everyday?
• How many miles do people travel in a car on an
average day?
• How many hours do people spend sitting in traffic each
year?
1,066,000
1,574,000
Today 2040 Plan
+510,000
+48%
People who walk or Bike
36
4942
Today 2040 Baseline 2040 Plan
Hours spent in traffic
0.0
5.0
10.0
15.0
20.0
25.0
30.0
1990 1995 2000 2005 2010 2015 2020 2025 2030 2035 2040
forecast
Miles driven per day
0m
100m
200m
300m
400m
500m
600m
2005 2010 2015 2020 2025 2030 2035 2040
Fixed Route Transit Annual Boardings
Average Annual Growth Rate 2014 to 2040: 3.6%
Average Annual Growth Rate 2005 to 2014: 2.8%
forecast
Annual Transit Ridership
PSRC has many measures to better tell the story of travel and growth:

• How many hours do trucks spend sitting in
traffic each year?
• How long does it take to drive between key
destinations?
• How long does transit take to get you between
some key destinations?
• How much are regional emissions forecast to
decline?
Freeway Travel Times
Everett to
Seattle
Everett to Bellevue
Bellevue to
Seattle
Tacoma to Seattle
89
101
95
Today
2040 Baseline
2040 Plan
84
105
95
Today
2040 Baseline
2040 Plan
41
43
41
Today
2040 Baseline
2040 Plan
85
95
90
Today
2040 Baseline
2040 Plan
Hours trucks spent in traffic
102
183
155
Today 2040 Baseline 2040 Plan
Today 2020 2025 2030 2035 2040
Limit 2017 - 2025: 1,888 lbs/day
Limit 2026 - 2040: 1,321 lbs/day
PM 2.5
Today 2020 2025 2030 2035 2040
Limit 2017 - 2025: 41,290 lbs/day
Limit 2026 - 2040: 22,880 lbs/day
NOX
Regional Emissions
PSRC Performance Measures
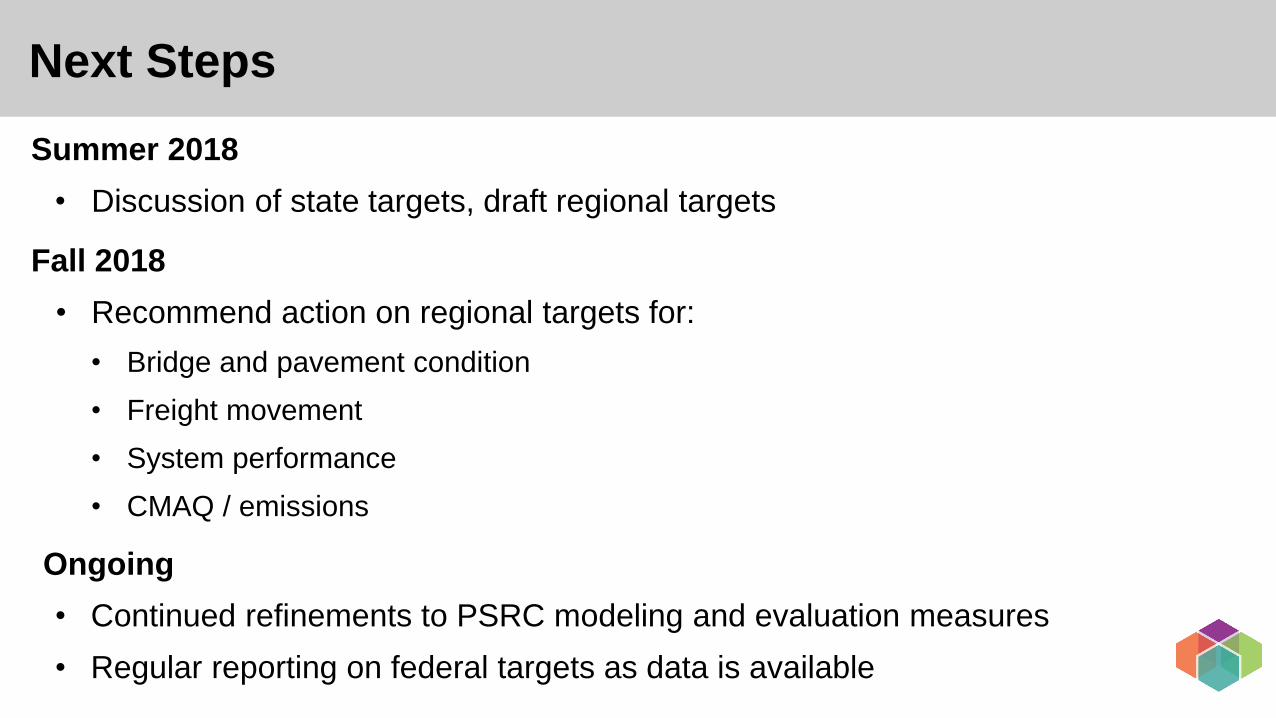
Next Steps
Syste
m
Level A
naly
sis
Summer 2018
• Discussion of state targets, draft regional targets
Fall 2018
• Recommend action on regional targets for:
• Bridge and pavement condition
• Freight movement
• System performance
• CMAQ / emissions
Ongoing
• Continued refinements to PSRC modeling and evaluation measures
• Regular reporting on federal targets as data is available

Thank you.
Sean Ardussi, AICP
Senior Planner
206-464-7080
Craig Helmann
Senior Program Manager - Data
206-389-2889