PERFORMANCE ASSESSMENTS OF THERMOMETER RESISTANCE … · NIST Thermodynamic Metrology Group, ......
20
Michal Chojnacky, Jesse Kosior, Luis Chaves-Santacruz, Greg Strouse NIST Thermodynamic Metrology Group, Sensor Science Division PERFORMANCE ASSESSMENTS OF THERMOMETER RESISTANCE BRIDGES
Transcript of PERFORMANCE ASSESSMENTS OF THERMOMETER RESISTANCE … · NIST Thermodynamic Metrology Group, ......

Michal Chojnacky, Jesse Kosior, Luis Chaves-Santacruz, Greg Strouse NIST Thermodynamic Metrology Group, Sensor Science Division
PERFORMANCE ASSESSMENTS OF THERMOMETER
RESISTANCE BRIDGES

RESISTANCE RATIO BRIDGES
• Fundamental to ITS-90 dissemination • Primary measurement instrument for calibration of SPRTs • Functional SPRT use depends on bridge to determine temperature • AC or DC
NIST disclaimer: Commercial equipment identified in this presentation does not imply recommendation or endorsement by NIST, nor does it imply that identified equipment is the best for the purpose.

BRIDGE ERRORS AND UNCERTAINTIES
• Contributions to overall SPRT measurement uncertainty – ITS-90 fixed point cell realizations – SPRT calibrations and customer use
• Performance-based assessments – Estimate uncertainty contributions – Measure of compliance – does it meet mfg. spec? – NOT used to “calibrate” or “correct” – Incorporated into quality system to ensure lab meets assigned
uncertainties
• Past evaluations (1997, 2002) found 1 in 5 bridges did not meet manufacturer uncertainty specifications

UNCERTAINTY COMPONENTS & ASSESSMENT TOOLS
Ratio Error Measurement Repeatability
Type A Uncertainty RBC
ASL RTU 2-way compliments check
Type A Uncertainty Reference resistor
SPRT TPW or Ga TP
Non-linearity Type B Uncertainties
Type A Uncertainty RBC
ASL RTU 3-way complements check
AC vs. DC frequency dependence AC – Quadrature
AC – Parasitic capacitance DC – thermal EMFs
Reference resistor stability - TCR

UNCERTAINTIES ASSIGNED TO NIST F18 BRIDGES
Uncertainty Com ponent Type NIST NRC
non-linearity A 0.02
ratio error A 0.02 0.03
ac quadrature/frequency
dependenceB 0.01
measurement repeatability A 0.002
Total Uncertainty (k =1) 0.03 0.03
Uncertainties expressed in parts per million
ASL F18
Non-linearity and ratio error are the most statistically significant components
Two-way compliments check • assessment of ratio error • two resistors of nominally the same value (e.g. 100 W) • measurement of normal and reciprocal resistance ratio values
Three-way compliments check • assessment of ratio error and non-linearity • three different resistors (e.g. 10 W, 25 W, 100 W)
ASSESSMENT TOOLS AND TECHNIQUES
2
10)]/)(/(1[()10(
612216 xRRRR
6
100
10
100
10
25
10
100
25
6 10)10( x
R
R
R
R
R
R
R
R
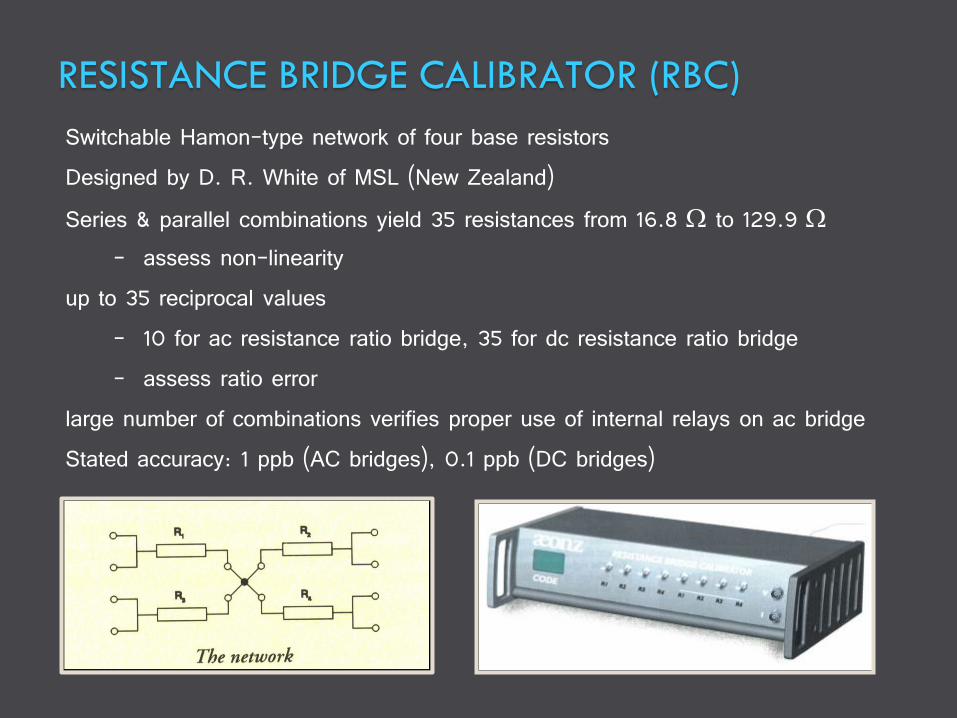
RESISTANCE BRIDGE CALIBRATOR (RBC)
Switchable Hamon-type network of four base resistors Designed by D. R. White of MSL (New Zealand) Series & parallel combinations yield 35 resistances from 16.8 W to 129.9 W
– assess non-linearity up to 35 reciprocal values
– 10 for ac resistance ratio bridge, 35 for dc resistance ratio bridge – assess ratio error
large number of combinations verifies proper use of internal relays on ac bridge Stated accuracy: 1 ppb (AC bridges), 0.1 ppb (DC bridges)

RBC – MANUAL VS. AUTOMATIC Manual RBC
Manual switches, 8+ hrs of hands-on staff time Manual data entry for uncertainty analysis
Stated accuracy: 0.01 ppm (original model) Stated accuracy: 0.1 ppm (current model)
Uncertainty limits tied to ambient temperature control
Automatic RBC Operated via USB to PC
Automatic, unattended measurements Reduction in hands-on staff time
May be kept in a temperature-controlled resistor bath Decreased uncertainty contribution from TCR
Stated accuracy: 0.01 ppm at 100 Ω Electrical switching-induced errors possible:
noise, thermal EMFs (DC)
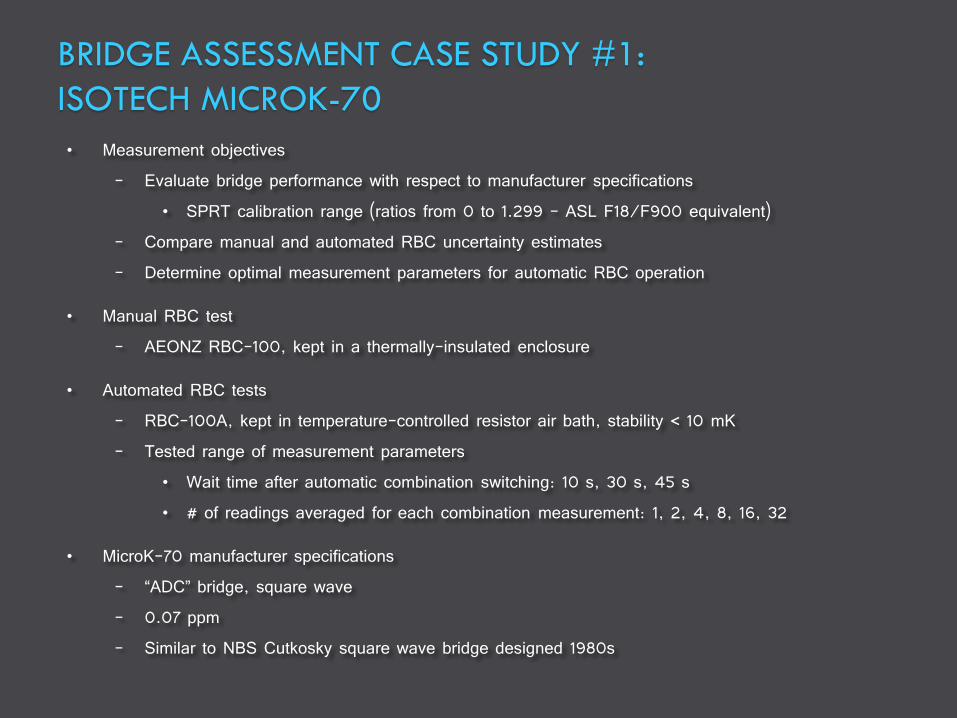
BRIDGE ASSESSMENT CASE STUDY #1:
ISOTECH MICROK-70
• Measurement objectives – Evaluate bridge performance with respect to manufacturer specifications
• SPRT calibration range (ratios from 0 to 1.299 - ASL F18/F900 equivalent) – Compare manual and automated RBC uncertainty estimates – Determine optimal measurement parameters for automatic RBC operation
• Manual RBC test – AEONZ RBC-100, kept in a thermally-insulated enclosure
• Automated RBC tests – RBC-100A, kept in temperature-controlled resistor air bath, stability < 10 mK – Tested range of measurement parameters
• Wait time after automatic combination switching: 10 s, 30 s, 45 s • # of readings averaged for each combination measurement: 1, 2, 4, 8, 16, 32
• MicroK-70 manufacturer specifications – “ADC” bridge, square wave – 0.07 ppm – Similar to NBS Cutkosky square wave bridge designed 1980s

ISOTECH MICROK-70:
COMPARISON OF MANUAL AND AUTOMATED RBC RESULTS
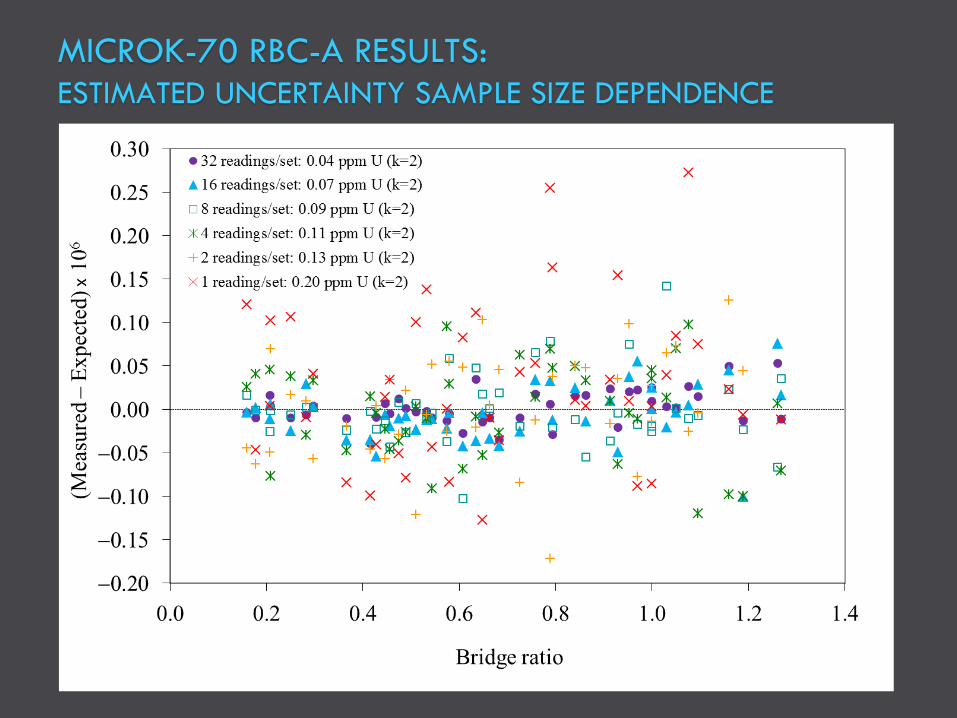
MICROK-70 RBC-A RESULTS:
ESTIMATED UNCERTAINTY SAMPLE SIZE DEPENDENCE

MICROK-70 RBC-A: SUMMARY OF RESULTS
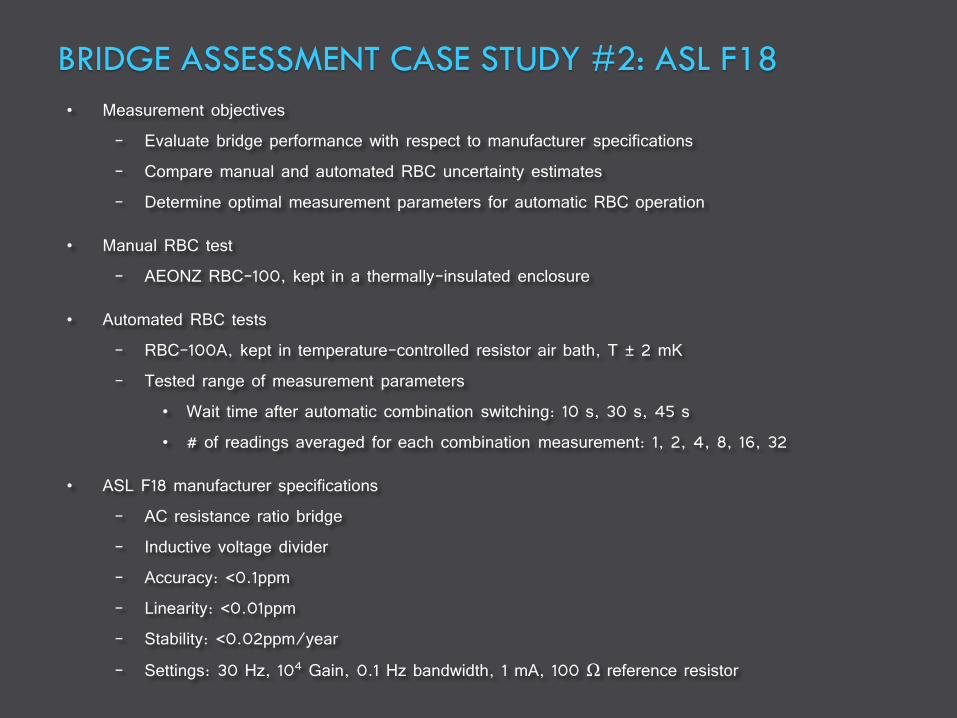
BRIDGE ASSESSMENT CASE STUDY #2: ASL F18
• Measurement objectives – Evaluate bridge performance with respect to manufacturer specifications – Compare manual and automated RBC uncertainty estimates – Determine optimal measurement parameters for automatic RBC operation
• Manual RBC test – AEONZ RBC-100, kept in a thermally-insulated enclosure
• Automated RBC tests – RBC-100A, kept in temperature-controlled resistor air bath, T ± 2 mK – Tested range of measurement parameters
• Wait time after automatic combination switching: 10 s, 30 s, 45 s • # of readings averaged for each combination measurement: 1, 2, 4, 8, 16, 32
• ASL F18 manufacturer specifications – AC resistance ratio bridge – Inductive voltage divider – Accuracy: <0.1ppm – Linearity: <0.01ppm – Stability: <0.02ppm/year – Settings: 30 Hz, 104 Gain, 0.1 Hz bandwidth, 1 mA, 100 Ω reference resistor
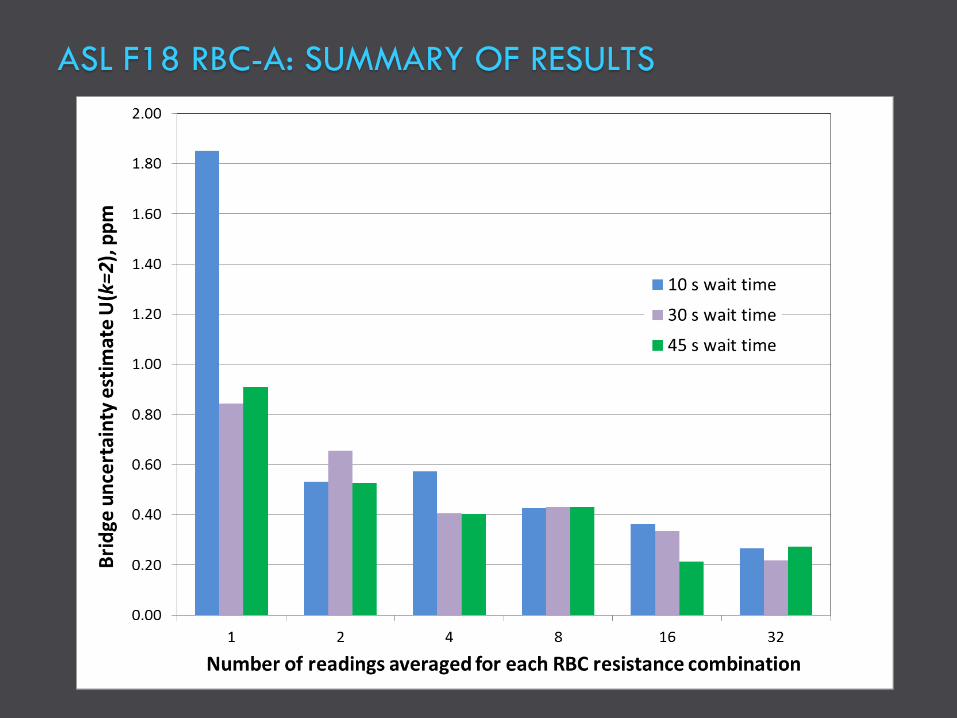
ASL F18 RBC-A: SUMMARY OF RESULTS

ASL F18: MANUAL & AUTOMATED RBC RESULTS
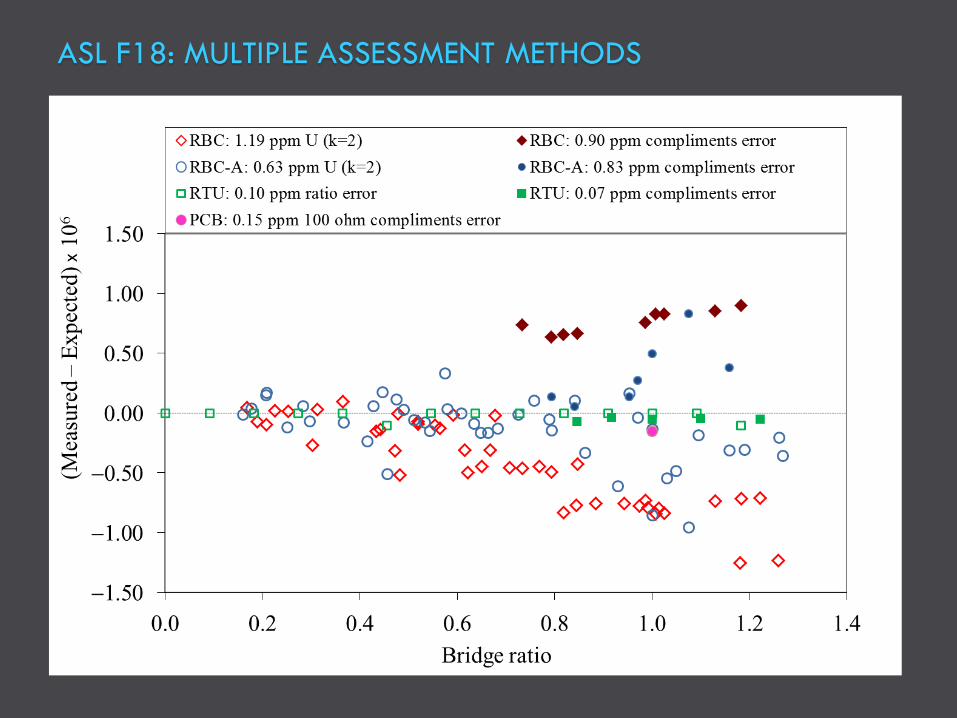
ASL F18: MULTIPLE ASSESSMENT METHODS

ASL F18: RBC ERROR ANALYSIS
0.0 0.2 0.4 0.6 0.8 1.0 1.2 1.4
Reading
-0.35
-0.30
-0.25
-0.20
-0.15
-0.10
-0.05
0.00
0.05
0.10
0.15
0.20
(Fitte
d V
alu
e –
Readin
g)*
1e6
0.0 0.2 0.4 0.6 0.8 1.0 1.2 1.4
Reading
-1.2
-1.0
-0.8
-0.6
-0.4
-0.2
0.0
(Fitte
d V
alu
e –
Readin
g)*
1e6
0.0 0.2 0.4 0.6 0.8 1.0 1.2 1.4
Reading
-1.4
-1.2
-1.0
-0.8
-0.6
-0.4
-0.2
0.0
0.2
(Fitte
d V
alu
e –
Readin
g)*
1e6
σ =4.379E-8 σ =5.867E-7
fit to base ratios only added linear correction
0.0 0.2 0.4 0.6 0.8 1.0 1.2 1.4
Reading
-0.35
-0.30
-0.25
-0.20
-0.15
-0.10
-0.05
0.00
0.05
0.10
0.15
(Fitte
d V
alu
e –
Readin
g)*
1e6
σ =8.225E-8 σ =1.368E-7
fit to base ratios only added linear correction
Manual RBC
Auto RBC 32 rdgs
45 s
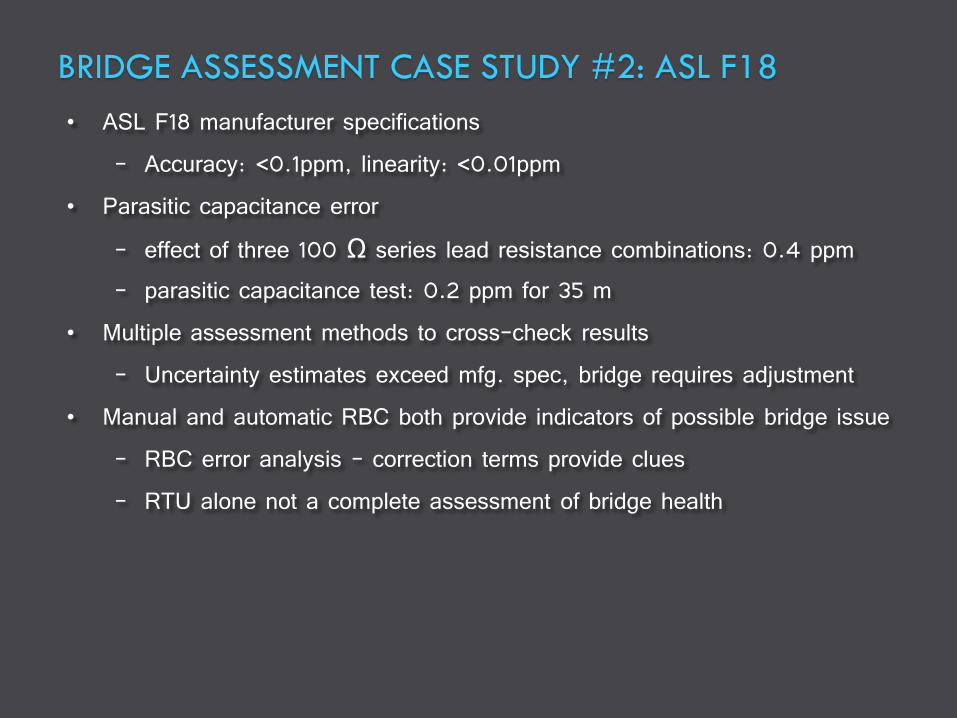
BRIDGE ASSESSMENT CASE STUDY #2: ASL F18
• ASL F18 manufacturer specifications – Accuracy: <0.1ppm, linearity: <0.01ppm
• Parasitic capacitance error – effect of three 100 Ω series lead resistance combinations: 0.4 ppm – parasitic capacitance test: 0.2 ppm for 35 m
• Multiple assessment methods to cross-check results – Uncertainty estimates exceed mfg. spec, bridge requires adjustment
• Manual and automatic RBC both provide indicators of possible bridge issue – RBC error analysis – correction terms provide clues – RTU alone not a complete assessment of bridge health

SUMMARY + NEXT STEPS
• Bridge health assessments critical to ITS-90 dissemination – Out-of-box uncertainty estimates and regular compliance checks – Incorporated into Quality System – RBC provides most complete assessment of ratio error and non-linearity
• Automatic RBC performance comparable to manual unit – Simplified thermal control – Significant savings in hands-on staff time – Planned integration with automated calibration measurement and quality
assurance program • Continued bridge assessment tests with RBC-A
– Last large-scale evaluation in 2002 (NIST/NRC) – 18 bridges – Test multiple units from pool of commercially-available bridge models – Assess current state – ability to meet manufacturer specifications