Performance and Economics of Catalytic Glowplugs and ... · PDF filePerformance and Economics...
55
August 2003 • NREL/SR-540-34286 J.P. Mello, D. Bezaire, S. Sriramulu, and R. Weber TIAX, LLC Cambridge, Massachusetts Performance and Economics of Catalytic Glow Plugs and Shields in Direct Injection Natural Gas Engines for the Next Generation Natural Gas Vehicle Program Final Report National Renewable Energy Laboratory 1617 Cole Boulevard Golden, Colorado 80401-3393 NREL is a U.S. Department of Energy Laboratory Operated by Midwest Research Institute • Battelle • Bechtel Contract No. DE-AC36-99-GO10337
Transcript of Performance and Economics of Catalytic Glowplugs and ... · PDF filePerformance and Economics...
August 2003 • NREL/SR-540-34286
J.P. Mello, D. Bezaire, S. Sriramulu, and R. Weber TIAX, LLC Cambridge, Massachusetts
Performance and Economics of Catalytic Glow Plugs and Shields in Direct Injection Natural Gas Engines for the Next Generation Natural Gas Vehicle Program Final Report
National Renewable Energy Laboratory 1617 Cole Boulevard Golden, Colorado 80401-3393 NREL is a U.S. Department of Energy Laboratory Operated by Midwest Research Institute • Battelle • Bechtel Contract No. DE-AC36-99-GO10337
August 2003 • NREL/SR-540-34286
Performance and Economics of Catalytic Glow Plugs and Shields in Direct Injection Natural Gas Engines for the Next Generation Natural Gas Vehicle Program Final Report J.P. Mello, D. Bezaire, S. Sriramulu, and R. Weber TIAX, LLCCambridge, Massachusetts
NREL Technical Monitor: R. Rehn Prepared under Subcontract No. NDX-2-31070-02
National Renewable Energy Laboratory 1617 Cole Boulevard Golden, Colorado 80401-3393 NREL is a U.S. Department of Energy Laboratory Operated by Midwest Research Institute • Battelle • Bechtel Contract No. DE-AC36-99-GO10337
NOTICE This report was prepared as an account of work sponsored by an agency of the United States government. Neither the United States government nor any agency thereof, nor any of their employees, makes any warranty, express or implied, or assumes any legal liability or responsibility for the accuracy, completeness, or usefulness of any information, apparatus, product, or process disclosed, or represents that its use would not infringe privately owned rights. Reference herein to any specific commercial product, process, or service by trade name, trademark, manufacturer, or otherwise does not necessarily constitute or imply its endorsement, recommendation, or favoring by the United States government or any agency thereof. The views and opinions of authors expressed herein do not necessarily state or reflect those of the United States government or any agency thereof.
Available electronically at http://www.osti.gov/bridge
Available for a processing fee to U.S. Department of Energy and its contractors, in paper, from:
U.S. Department of Energy Office of Scientific and Technical Information P.O. Box 62 Oak Ridge, TN 37831-0062 phone: 865.576.8401 fax: 865.576.5728 email: [email protected]
Available for sale to the public, in paper, from:
U.S. Department of Commerce National Technical Information Service 5285 Port Royal Road Springfield, VA 22161 phone: 800.553.6847 fax: 703.605.6900 email: [email protected] online ordering: http://www.ntis.gov/ordering.htm
Printed on paper containing at least 50% wastepaper, including 20% postconsumer waste
i
Table of Contents List of Figures ................................................................................................................................. ii List of Tables ................................................................................................................................. iv List of Acronyms and Abbreviations.............................................................................................. v 1.0 Executive Summary .............................................................................................................. 1 2.0 Background and Introduction ............................................................................................... 3 3.0 Engine Performance Testing................................................................................................. 5
3.1 Glow Plug Manufacturer ................................................................................................... 7 3.2 Shield Protrusion ............................................................................................................. 10 3.3 Cylinder Bowl Geometry (In-Cylinder Charge Motion)................................................. 13 3.4 Catalyst Coating Placement............................................................................................. 14 3.5 Catalyst Coating Composition......................................................................................... 16 3.6 Emissions Performance of Preferred Embodiment ......................................................... 22
4.0 Characterization of Shield Surfaces.................................................................................... 25 5.0 Microkinetics Modeling...................................................................................................... 28
5.1 The Microkinetics Approach ........................................................................................... 28 5.2 Bistro Model for Pt Catalyst............................................................................................ 28
5.2.1 Network Calibration.................................................................................................. 28 5.2.2 Sensitivity Analysis .................................................................................................. 31
5.2.2.1 Rate controlling Steps............................................................................................ 31 5.2.2.2 Effect on Ignition Delay ........................................................................................ 32 5.2.2.3 Effect of the Initial Condition................................................................................ 34 5.2.2.4 Mass of the Catalytic Shield.................................................................................. 34 5.2.2.5 Effect of Operating Pressure.................................................................................. 35
5.2.3 Implications for catalytic glow plugs........................................................................ 36 5.3 Bistro Model for Pd Catalyst ........................................................................................... 37
5.3.1 Calibration of network for H2-O2 reaction................................................................ 37 5.3.2 Calibration of network for methane oxidation.......................................................... 38
5.3.2.1 Literature Review .................................................................................................. 38 5.3.2.2 Calibration of Bistro Network ............................................................................... 39
5.4 Bistro Model for Ru Catalyst .......................................................................................... 40 5.5 Bistro Model for Pd/Ru Alloy Catalysts ......................................................................... 40 5.6 Comparison with Engine Test Data................................................................................. 40 5.7 Comparison of catalyst networks .................................................................................... 41 5.8 Conclusions and Recommendations Based on Microkinetics Modeling ........................ 42
6.0 Cost Assessment ................................................................................................................. 43 7.0 Conclusions and Future Efforts .......................................................................................... 44
7.1 Conclusions ..................................................................................................................... 44 7.2 Future Efforts................................................................................................................... 45
8.0 References........................................................................................................................... 45
ii
List of Figures Figure 1: Glow plug and shield configurations tested on the DI-NG engine. ................................ 7 Figure 2: Installed hot surface ignition system based on glow plug and shield concept. ............... 8 Figure 3: Comparison of ignition delay using Le-Mark and Kyocera glow plugs (-1 mm protrusion) at idle and 0% EGR......................................................................................... 8 Figure 4: Comparison of Pmax COV using Le-Mark and Kyocera glow plugs (-1 mm protrusion) at idle and 0% EGR......................................................................................... 9 Figure 5: Comparison of ignition delay using Le-Mark and Kyocera glow plugs (-1 mm protrusion) at 2000 rpm/50 N-m and 0% EGR. ................................................................. 9 Figure 6: Comparison of Pmax COV using Le-Mark and Kyocera glow plugs (-1 mm protrusion) at 2000 rpm/50 N-m and 0% EGR. ............................................................... 10 Figure 7: Measured ignition delay using Le-Mark glow plugs with varying protrusion at idle and 0% EGR....................................................................................................................... 11 Figure 8: Measured Pmax COV using Le-Mark glow plugs with varying protrusion at idle and 0% EGR....................................................................................................................... 12 Figure 9: Measured ignition delay using Le-Mark glow plugs with varying protrusion at 2000 rpm/50 N-m and 0% EGR................................................................................................ 12 Figure 10: Measured Pmax COV using Le-Mark glow plugs with varying protrusion at 2000 rpm/50 N-m and 0% EGR................................................................................................ 13 Figure 11: Comparison of piston bowl geometry in the common rail (CR) and pump line nozzle (PLN) engine configurations. ........................................................................... 14 Figure 12: Impact of catalyst coating placement on ignition delay at idle and 0% EGR. ............ 15 Figure 13: Impact of catalyst coating placement on ignition delay at 2000 rpm/50 N-m and 0% EGR. ................................................................................................................................ 15 Figure 14: Impact of catalyst coating composition on ignition delay at idle and 0% EGR.......... 17 Figure 15: Impact of catalyst coating composition on Pmax COV at idle and 0% EGR................ 17 Figure 16: Impact of catalyst coating composition on ignition delay at 2000 rpm/50 N-m. ........ 18 Figure 17: Impact of catalyst coating composition on Pmax COV at 2000 rpm/50 N-m............... 18 Figure 18: Ignition delay as function of Pd concentration on Pd/Ru shields, idle and 0% EGR. 19 Figure 19: Pmax COV as a function of Pd concentration on Pd/Ru shields at idle and 0% EGR.. 19 Figure 20: Ignition delay as function of Pd concentration on Pd/Ru shields, 2000 rpm/50 N-m. 20 Figure 21: Pmax COV as a function of Pd concentration on Pd/Ru shields at 2000 rpm/50 N-m. 20 Figure 22: Ignition delay as function of Pd concentration on Pd/Ru shields,2000 rpm/200 N-m.21 Figure 23: Pmax COV as function of Pd concentration on Pd/Ru shields at 2000 rpm/200 N-m.. 21 Figure 24: Total hydrocarbon emissions from the DI-NG engine using coated and uncoated shields at the AVL 8-mode test conditions. .................................................................................. 23 Figure 25: Combined total hydrocarbon emissions and NOx emissions from the DI-NG engine using coated and uncoated shields at the AVL 8-mode test conditions................ 23 Figure 26: Ignition delay (averaged over the four cylinders) in the DI-NG engine using coated and uncoated shields at the AVL 8-mode test conditions........................................ 24 Figure 27: Pmax COV (averaged over the four cylinders) in the DI-NG engine using coated and uncoated shields at the AVL 8-mode test conditions. ................................................ 24 Figure 28: SEM images of Pt coated shield surfaces from Supplier A and Supplier B (1000x magnification)................................................................................................................... 26
iii
Figure 29: SEM image of a Pd coated shield prior to oven aging (1000x magnification). .......... 26 Figure 30: SEM image of a Pd coated shield after ten minutes of oven aging at 800 oC (1000x magnification)................................................................................................................... 26 Figure 31: SEM image of the 25% Pd/75% Ru coated shield surface after 7-8 hours of operation in the engine.................................................................................................................. 27 Figure 32: Bistro simulations of the effect of initial Pt temperature on ignition of methane/air mixture. This is a characteristic of all catalysts studied. T0 represents the initial surface temperature. .................................................................................................................................. 30 Figure 33: Comparison of experimental and model results for methane ignition temperature over a Pt foil as a function of the initial temperature. The experimental conditions were: stagnation flow around a Pt foil, 6 % reactant mixture diluted by 94 % N2, atmospheric pressure. ............. 30 Figure 34: Sensitivity of the heat release to the reverse rate of the different reactions. Operating conditions for this analysis were 1000 K and 20 atm. ................................................. 32 Figure 35: Schematic describing the state of the Pt catalyst surface at two different temperatures for the conditions given in Figure 33. Operating above the ignition temperature creates open surface sites which allow methane to adsorb and react with oxygen on the catalyst surface....... 32 Figure 36: Rate of rise of the catalyst foil temperature for the results shown in Figure 33. Increase in rate signifies onset of ignition. ................................................................................... 33 Figure 37: Simulation of the ignition delay as a function of the initial surface temperature of the catalyst. Operating conditions: λ = 1.5, and P = 20 atm..................................................... 34 Figure 38: Simulation of methane ignition on a Pt foil: effect of the initial state of the catalyst on the temperature rise. Experiment performed in the HOC regime. Other conditions are as listed in Figure 32. .............................................................................................................. 35 Figure 39: Effect of the shield mass (proportional to the thickness) on the ignition temperature for an equivalence ratio of 0.7 and operation at 20 atm................................................................ 36 Figure 40: Simulations of the effect of pressure on the onset temperature for ignition. Operating conditions for the simulations: equivalence ratio of 0.7 and shield thickness of 50 µm. ............. 36 Figure 41: Comparison of measured and calculated ignition temperatures for ignition of H2-O2 mixtures over a Pd foil. Experimental data were taken from [15], the kinetic parameters corresponding to the best-fit are given in Table 7...................................................... 38 Figure 42: Calibration of the Bistro model for methane oxidation on supported Pd catalysts. Operating pressure was 1 atm and catalyst loading was 200 cm2/cm3 for the simulation. Gas composition was 1% CH4, 20% O2, N2 balance. .......................................................................... 39 Figure 43: Comparison of the measured and calculated ignition delays for two different engine operating conditions and three different shield compositions. For the simulations the shield temperature was assumed to be 1500 K, pressure 46.5 atm for λ = 1.2, shield temperature 1400 K, and pressure 32 atm for λ = 1.4.. ............................................................................................. 41 Figure 44: Comparison of simulations of the ignition delay as a function of the initial surface temperature for different catalyst. Pd/Ru network composition was 50% for each metal. Operating pressure was 20 atm with a λ of 1.5............................................................................. 42
iv
List of Tables Table 1: Comparison of the merits of DI-NG engines relative to PFI-NG and conventional DI diesel engines. ................................................................................................................................. 3 Table 2: Test and development area features of the Westport test facilities. ................................. 6 Table 3: Details of the test matrix for shield protrusion testing. .................................................. 10 Table 4: AVL 8-mode test conditions for the DI-NG engine used in this program. .................... 22 Table 5: Bath conditions used by Supplier A and Supplier B for electroplating Pt to the Incoloy 800 shields. ............................................................................................................ 25 Table 6: Microkinetic network of reactions and calibrated kinetic parameters for the catalytic methane oxidation on Pt. In the network, Pt represents a reaction site on the catalyst. ............... 29 Table 7: Microkinetic network of reactions and list of calibrated kinetic parameters for the catalytic methane oxidation on Pd. In the network, Pd represents a reaction site on the catalyst.37 Table 8: Kinetic parameters used for methane oxidation on Ru................................................... 40 Table 9: Postulated bi-functional mechanism for methane oxidation on Pd/Ru surfaces. ........... 40 Table 10: Cost estimates of three shield design options for catalyst-coated glow plug shields. .. 43
v
List of Acronyms and Abbreviations Au Gold CFD Computational fluid dynamics CNG Compressed natural gas CO Carbon monoxide COV Coefficient of variance CR Common rail CSTR Continuously stirred tank reactor DI Direct injection DI-NG Direct-injection natural gas DOE U.S. Department of Energy EDS Energy dispersive spectroscopy H2 Hydrogen HOC High surface oxygen coverage λ Air/fuel ratio LOC Low surface oxygen coverage N2 Nitrogen NGNGV Next Generation Natural Gas Vehicle NGV Natural gas vehicle NOx Oxides of nitrogen O Oxygen Pd Palladium PFI-NG Port fuel injection natural gas PLN Pump line nozzle Pt Platinum Ru Ruthenium SEM Scanning electron microscopy TDC Top dead center THC Total hydrocarbons
1
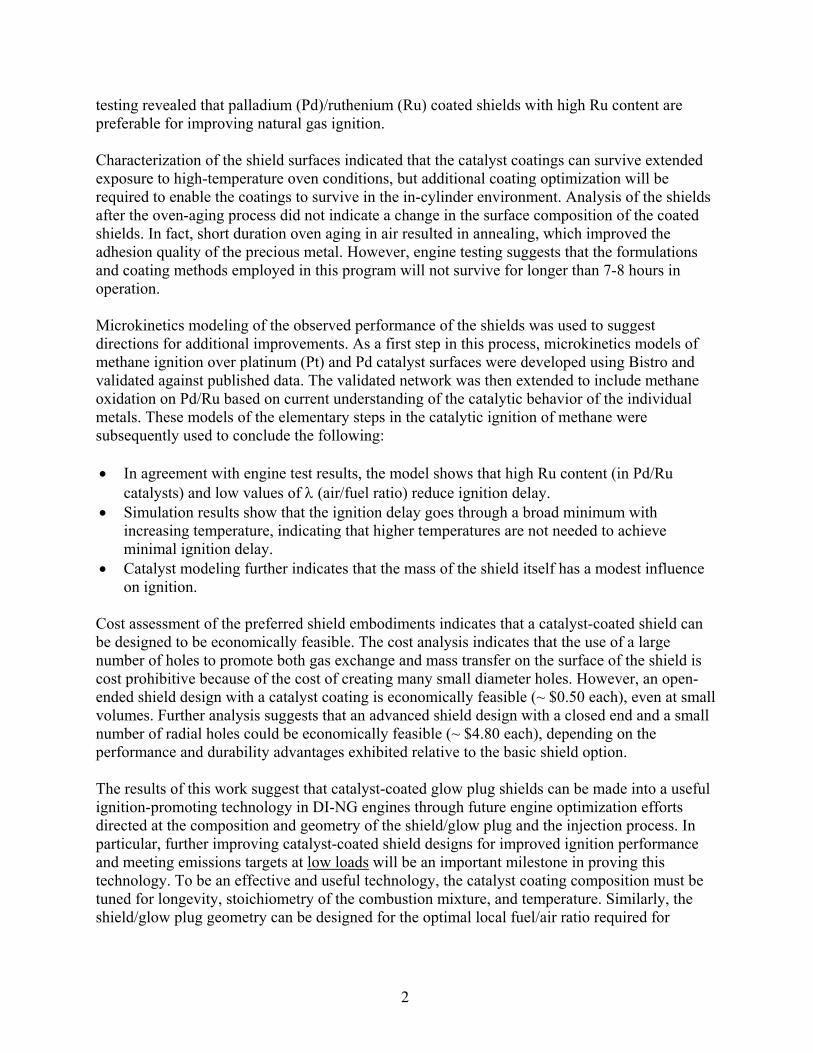
1.0 Executive Summary Natural gas is an abundant domestic fuel. The U.S. Department of Energy (DOE) supports natural gas vehicle (NGV) research and development to help the United States reach its goal of reducing dependence on imported petroleum, as outlined in the Energy Policy Act of 1992. Another benefit of NGVs is that they can reduce emissions of regulated pollutants compared with diesel vehicles. This report details work to improve the ignition system in natural gas engines. The project was sponsored by DOE’s Next Generation Natural Gas Vehicle (NGNGV) activity through the National Renewable Energy Laboratory. Given the low cetane number of natural gas, the method of igniting the fuel/air mixture in a direct-injection natural gas (DI-NG) engine is a critical aspect of the system. Although a variety of possibilities exist, use of hot surface ignition has emerged as a preferred combustion actuating mechanism for realizing the benefits of DI-NG. Key reasons for choosing the hot surface ignition approach include the combustion robustness of a continuous ignition source. Spark ignition was also considered, but, as other investigators have pointed out, it is very difficult to achieve reliable and durable ignition at the very high cylinder pressures (160 bar) typical of modern high-compression-ratio turbocharged diesel engines. Current surface glow plug ignition systems also do not yet meet customer expectations for durability and reliability under continuous use. To advance the current state-of-the-art in natural gas engine technology, a collaborative effort between TIAX LLC, Westport, and Ford focused on assessing the performance and economics of using a catalyst coating to improve the hot surface ignition system in DI-NG engines. Through this program, it was demonstrated that catalyst-coated glow plug shields appear to be a promising and cost-effective means of improving ignition in DI-NG engines and require further optimization to be made practical for engine applications. This conclusion is based on the results of the current program, which spanned 13 months and was executed using a multi-faceted work plan in which catalyst-coated glow plug shields were developed, tested, modeled, and analyzed through efforts in the following areas: • Engine performance testing • Shield surface characterization • Microkinetics modeling • Cost assessment Engine testing performed under this program showed that properly designed and applied shield coatings significantly improve ignition at high loads, while appearing to demonstrate little or no effect at low loads. To make this assessment of catalyst-coated glow plug shields, an engine test matrix was designed to vary several parameters including: • Shield protrusion relative to the glow plug • Cylinder bowl geometry (in-cylinder charge motion) • Glow plug manufacturer and power rating • Catalyst coating composition and location Execution of this test matrix indicated that the effectiveness of the catalyst coatings was significantly improved by coating the inner and outer surfaces of the shields. In addition, engine
2
testing revealed that palladium (Pd)/ruthenium (Ru) coated shields with high Ru content are preferable for improving natural gas ignition. Characterization of the shield surfaces indicated that the catalyst coatings can survive extended exposure to high-temperature oven conditions, but additional coating optimization will be required to enable the coatings to survive in the in-cylinder environment. Analysis of the shields after the oven-aging process did not indicate a change in the surface composition of the coated shields. In fact, short duration oven aging in air resulted in annealing, which improved the adhesion quality of the precious metal. However, engine testing suggests that the formulations and coating methods employed in this program will not survive for longer than 7-8 hours in operation. Microkinetics modeling of the observed performance of the shields was used to suggest directions for additional improvements. As a first step in this process, microkinetics models of methane ignition over platinum (Pt) and Pd catalyst surfaces were developed using Bistro and validated against published data. The validated network was then extended to include methane oxidation on Pd/Ru based on current understanding of the catalytic behavior of the individual metals. These models of the elementary steps in the catalytic ignition of methane were subsequently used to conclude the following: • In agreement with engine test results, the model shows that high Ru content (in Pd/Ru
catalysts) and low values of λ (air/fuel ratio) reduce ignition delay. • Simulation results show that the ignition delay goes through a broad minimum with
increasing temperature, indicating that higher temperatures are not needed to achieve minimal ignition delay.
• Catalyst modeling further indicates that the mass of the shield itself has a modest influence on ignition.
Cost assessment of the preferred shield embodiments indicates that a catalyst-coated shield can be designed to be economically feasible. The cost analysis indicates that the use of a large number of holes to promote both gas exchange and mass transfer on the surface of the shield is cost prohibitive because of the cost of creating many small diameter holes. However, an open-ended shield design with a catalyst coating is economically feasible (~ $0.50 each), even at small volumes. Further analysis suggests that an advanced shield design with a closed end and a small number of radial holes could be economically feasible (~ $4.80 each), depending on the performance and durability advantages exhibited relative to the basic shield option. The results of this work suggest that catalyst-coated glow plug shields can be made into a useful ignition-promoting technology in DI-NG engines through future engine optimization efforts directed at the composition and geometry of the shield/glow plug and the injection process. In particular, further improving catalyst-coated shield designs for improved ignition performance and meeting emissions targets at low loads will be an important milestone in proving this technology. To be an effective and useful technology, the catalyst coating composition must be tuned for longevity, stoichiometry of the combustion mixture, and temperature. Similarly, the shield/glow plug geometry can be designed for the optimal local fuel/air ratio required for
3
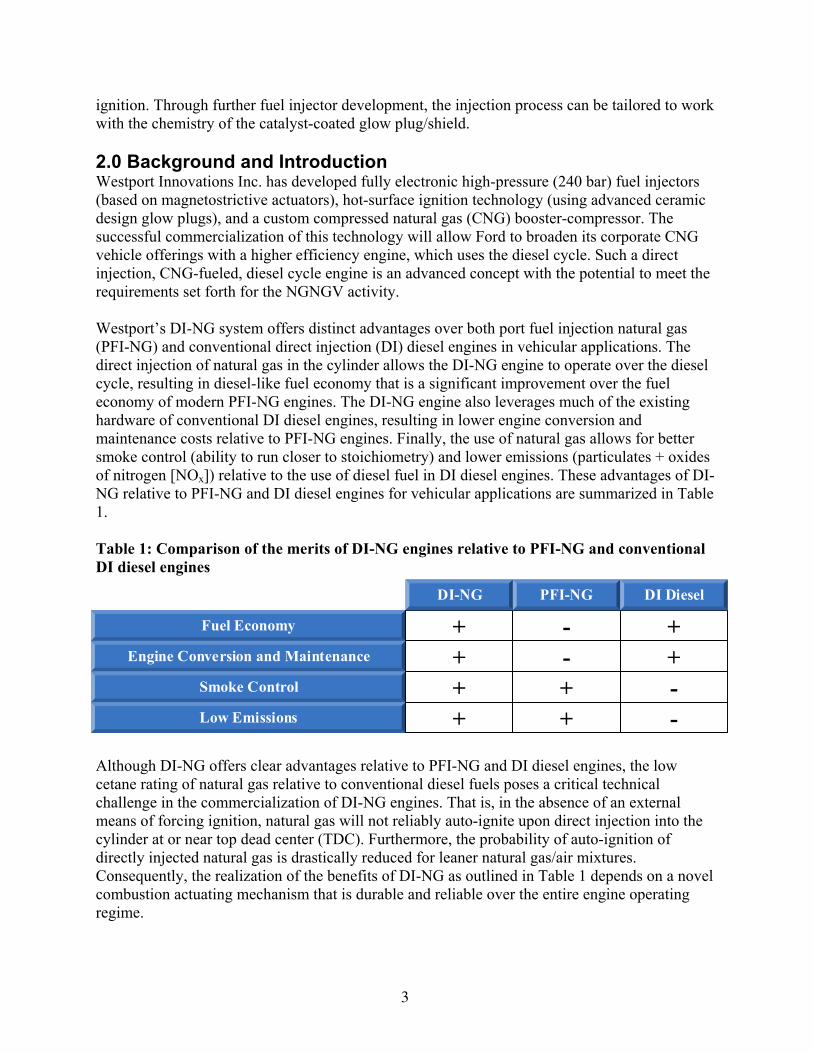
ignition. Through further fuel injector development, the injection process can be tailored to work with the chemistry of the catalyst-coated glow plug/shield. 2.0 Background and Introduction Westport Innovations Inc. has developed fully electronic high-pressure (240 bar) fuel injectors (based on magnetostrictive actuators), hot-surface ignition technology (using advanced ceramic design glow plugs), and a custom compressed natural gas (CNG) booster-compressor. The successful commercialization of this technology will allow Ford to broaden its corporate CNG vehicle offerings with a higher efficiency engine, which uses the diesel cycle. Such a direct injection, CNG-fueled, diesel cycle engine is an advanced concept with the potential to meet the requirements set forth for the NGNGV activity. Westport’s DI-NG system offers distinct advantages over both port fuel injection natural gas (PFI-NG) and conventional direct injection (DI) diesel engines in vehicular applications. The direct injection of natural gas in the cylinder allows the DI-NG engine to operate over the diesel cycle, resulting in diesel-like fuel economy that is a significant improvement over the fuel economy of modern PFI-NG engines. The DI-NG engine also leverages much of the existing hardware of conventional DI diesel engines, resulting in lower engine conversion and maintenance costs relative to PFI-NG engines. Finally, the use of natural gas allows for better smoke control (ability to run closer to stoichiometry) and lower emissions (particulates + oxides of nitrogen [NOx]) relative to the use of diesel fuel in DI diesel engines. These advantages of DI-NG relative to PFI-NG and DI diesel engines for vehicular applications are summarized in Table 1. Table 1: Comparison of the merits of DI-NG engines relative to PFI-NG and conventional DI diesel engines Although DI-NG offers clear advantages relative to PFI-NG and DI diesel engines, the low cetane rating of natural gas relative to conventional diesel fuels poses a critical technical challenge in the commercialization of DI-NG engines. That is, in the absence of an external means of forcing ignition, natural gas will not reliably auto-ignite upon direct injection into the cylinder at or near top dead center (TDC). Furthermore, the probability of auto-ignition of directly injected natural gas is drastically reduced for leaner natural gas/air mixtures. Consequently, the realization of the benefits of DI-NG as outlined in Table 1 depends on a novel combustion actuating mechanism that is durable and reliable over the entire engine operating regime.
Fuel Economy
Engine Conversion and Maintenance
Smoke Control
Low Emissions
++++
--++
++--
DI-NG PFI-NG DI Diesel
4
Currently, hot surface ignition is a preferred means of initiating combustion of natural gas injected at or near TDC. Because DI-NG engines are typically converted from DI diesel engines to leverage both engineering effort and economy of scale, a preferred embodiment for the implementation of hot surface ignition is through the use of the glow plug system. In conventional DI diesel configurations, this glow plug system exists as a starting aid and is not powered once the engine has fully warmed up. However, in a DI-NG engine, the glow plug system is continuously powered during all modes of engine operation, serving as an ignition source for natural gas/air mixtures flowing over the glow plug. The use of continuously powered glow plugs for hot surface ignition in DI-NG engines offers distinct advantages over alternative methods of initiating combustion. Relative to pilot injection of diesel fuel (i.e., a dual-fuel system), hot surface ignition is less expensive to implement and is easier to package. Furthermore, the large area associated with hot surface ignition reduces spatial dependency of the fuel injection pattern, offering a significant advantage over the use of spark ignition. Despite these advantages relative to other combustion actuating mechanisms, the use of hot surface ignition in DI-NG engines requires additional development to meet engine performance specifications for automotive applications. In particular, the hot surface ignition system must be further developed to address two key technical challenges: • Reducing Ignition Delay: Reducing ignition delay1 is required to enable adequate control
over the combustion process such that the combustion stability of the engine can be maintained within limits acceptable to the consumer, and engine-out emissions of unburned hydrocarbons can be minimized. Limiting the ignition delay is also necessary to ensure minimal cycle-to-cycle combustion variability, ensuring that expectations for emissions, engine smoothness, and noise are met.
• Demonstrating Durability: Because conventional glow plug systems are not designed for
continuous use, these systems must be modified to meet automotive performance targets of at least 2,000 hours. Through previous development efforts, Westport has demonstrated that the combination of a ceramic glow plug and a shield offers significant durability improvements relative to the use of a conventional glow plug system consisting of an unshielded conventional metal glow plug. However, further improvements in the durability of the hot surface ignition system will be required prior to commercialization of the DI-NG concept in Class 3 or higher vehicles.
Both of these technical challenges are addressed by lowering the temperature at which ignition of the natural gas/air mixture occurs on the hot surface (estimated to be approximately 1100 ºC or higher without any coating). Thus, the present program focused on developing, testing, modeling, and analyzing catalyst coatings for glow plug shields and ultimately assessing the feasibility of the technology with respect several criteria including: • The ability of the catalyst coatings to further reduce ignition delay • The impact of the catalyst coatings on combustion stability 1 In this report, ignition delay is defined as the time between the start of injection and the start of combustion.
5
• The effect of the catalyst coatings on engine-out emissions • Durability of the catalyst coatings with respect to elevated temperature • Durability of the catalyst coatings under exposure to in-cylinder conditions • Cost of catalyst-coated ignition components • Cost of aftertreatment components To assess the feasibility of catalyst coatings with respect to the above criteria, the present program was organized around a multifaceted approach consisting of efforts in the following areas: • Engine performance testing: To quantify the effect of catalyst-coated glow plugs/shields on
DI-NG engine performance, an engine test program was conducted at steady-state conditions on a 4-cylinder, 1.75 L, turbocharged DI-NG engine at Westport’s engine test facilities.
• Shield surface characterization: Scanning electron microscopy (SEM) and energy dispersive
spectroscopy (EDS) were used by TIAX to non-destructively characterize coated surfaces at interim points in the test cycle to provide information on the physical and chemical changes that accompany exposure to in-cylinder environments.
• Microkinetics modeling: Computational models coupling transport and kinetics were
constructed by TIAX to probe the sensitivity of the ignition process to catalyst composition, catalyst temperature, air/fuel stoichiometry, and fuel composition.
• Cost assessment: Based on the preferred embodiments developed through the combined
experimental and modeling efforts, the costs of the ignition and aftertreatment components required for Class 3 or higher vehicles were estimated and used as the final criteria in assessing the feasibility of catalyst-coated glow plugs/shields.
Each portion of the program outlined above is detailed in the following sections. 3.0 Engine Performance Testing Engine dynamometer testing was performed on a 4-cylinder, 1.75 L, turbocharged DI-NG engine at the Westport test facilities, which are equipped to support CNG and LNG high-pressure fueling systems. In the first round of engine testing, the engine was connected to an absorption (eddy current) dynamometer. In subsequent rounds of engine testing, the engine was connected to a highly transient AC dynamometer.2 The capabilities of the Westport test facilities used in this program are outlined in Table 2.
2 The test program was focused on steady-state engine testing. Therefore, the difference between the two dynamometers is immaterial and is noted herein for completeness.
6
Table 2: Test and development area features of the Westport test facilities For experimental convenience, steady-state engine testing was performed at representative light- and high-load conditions. The glow plug manufacturer and shield protrusion testing reported in Section 3.1 and the emissions performance tests reported in Section 3.5 were performed on multiple cylinders in the engine, and the relative λ was varied. For the remainder of the tests reported below, testing was performed on a single cylinder of the engine to enable multiple tests to be performed in parallel. That is, four different tests were performed in parallel by using a different hardware configuration in each cylinder and examining the combustion characteristics (e.g., ignition delay and combustion stability) in each cylinder individually. To normalize these single cylinder results with respect to cylinder-to-cylinder variations, each configuration of the hot surface ignition system was tested through a voltage sweep at a nominal λ. Each voltage sweep varied from a maximum glow plug voltage of 12.5 V to a minimum glow plug voltage as determined by loss of combustion stability in the cylinder. The engine test matrix executed as part of this program was designed to identify both geometric and chemical means of ignition improvement. Thus, in addition to the study of catalyst coatings, the test program quantified the ignition impact of several engine/shield hardware configurations. As part of the methodology used to guide the test program, it was assumed that preferred catalyst coatings would provide additional ignition improvement over the preferred hardware configuration. Building upon this methodology, the variables examined as part of the current test program included: • Glow plug manufacturer • Shield protrusion relative to the glow plug • Cylinder bowl geometry (in-cylinder charge motion) • Catalyst coating placement • Catalyst coating composition • Emissions performance of the preferred glow plug/shield configuration with the preferred
catalyst coating
• Two test beds equipped with highly transient AC dynamometers and vector drives. Dynamometers installed are AVL 204/8, which have a torque response of 3 ms for 100% load change and a torque measurement accuracy of 0.3%. Rated 220 kW with a maximum speed of 8000 rpm.
• One test bed equipped with an absorption (eddy current) dynamometer, rated at 220 kW and 5000 rpm. • Test bed automation Puma 5 is used in all three test cells for data acquisition and test bed control. • All three test beds are equipped with fuel measurement and conditioning systems, engine coolant, oil and
air conditioning units. • Vehicle and Driver Simulation AVL ISAC 300 attached to dynamic test beds. • Each test bed is equipped with an indicating system for high-speed data acquisition – AVL 619 Indimeter/6
channels. • Temperature, humidity, and pressure control unit for combustion air. • Dedicated AVL 415 s Smoke Meter. • Dedicated Horiba 7500 DEGR gaseous emissions bench. • Dedicated Diesel Engine Particulate Micro Tunnel – Horiba MDLT – 1302. • AVL Concerto V3 software is used for test bed data evaluation, engine mapping/calibration, analysis of the
dynamic test runs, combustion analysis, statistical evaluation, etc.
7
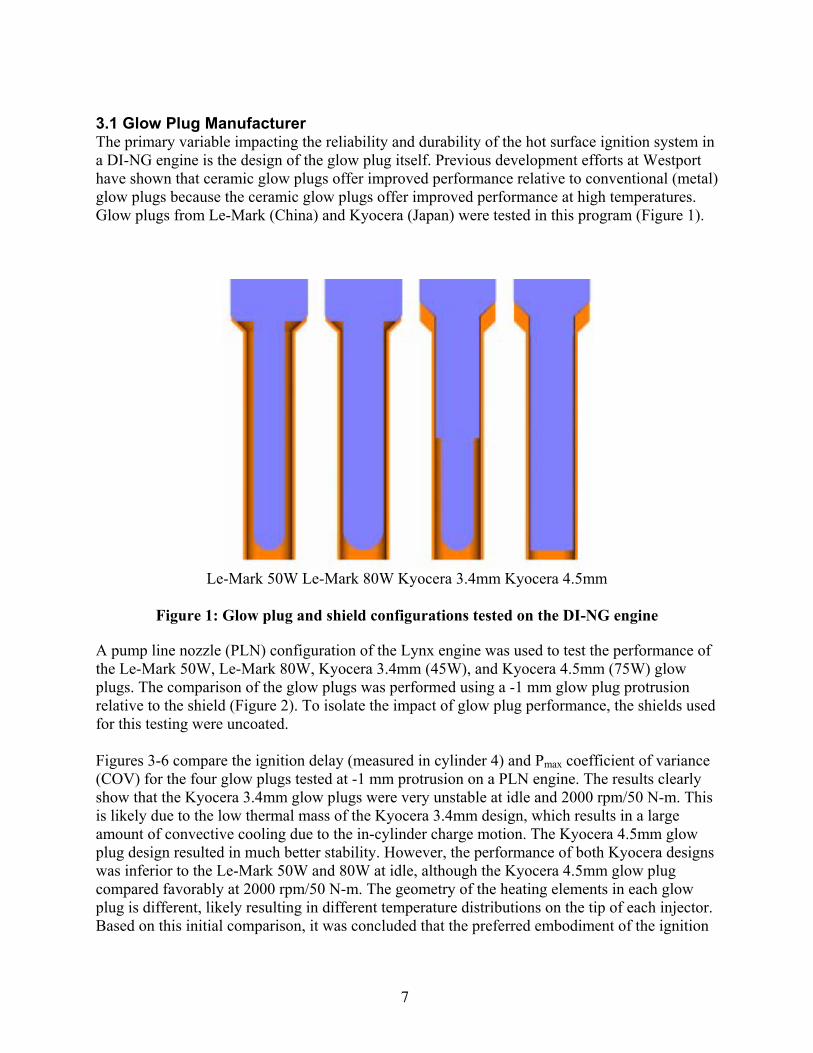
3.1 Glow Plug Manufacturer The primary variable impacting the reliability and durability of the hot surface ignition system in a DI-NG engine is the design of the glow plug itself. Previous development efforts at Westport have shown that ceramic glow plugs offer improved performance relative to conventional (metal) glow plugs because the ceramic glow plugs offer improved performance at high temperatures. Glow plugs from Le-Mark (China) and Kyocera (Japan) were tested in this program (Figure 1).
Le-Mark 50W Le-Mark 80W Kyocera 3.4mm Kyocera 4.5mm
Figure 1: Glow plug and shield configurations tested on the DI-NG engine
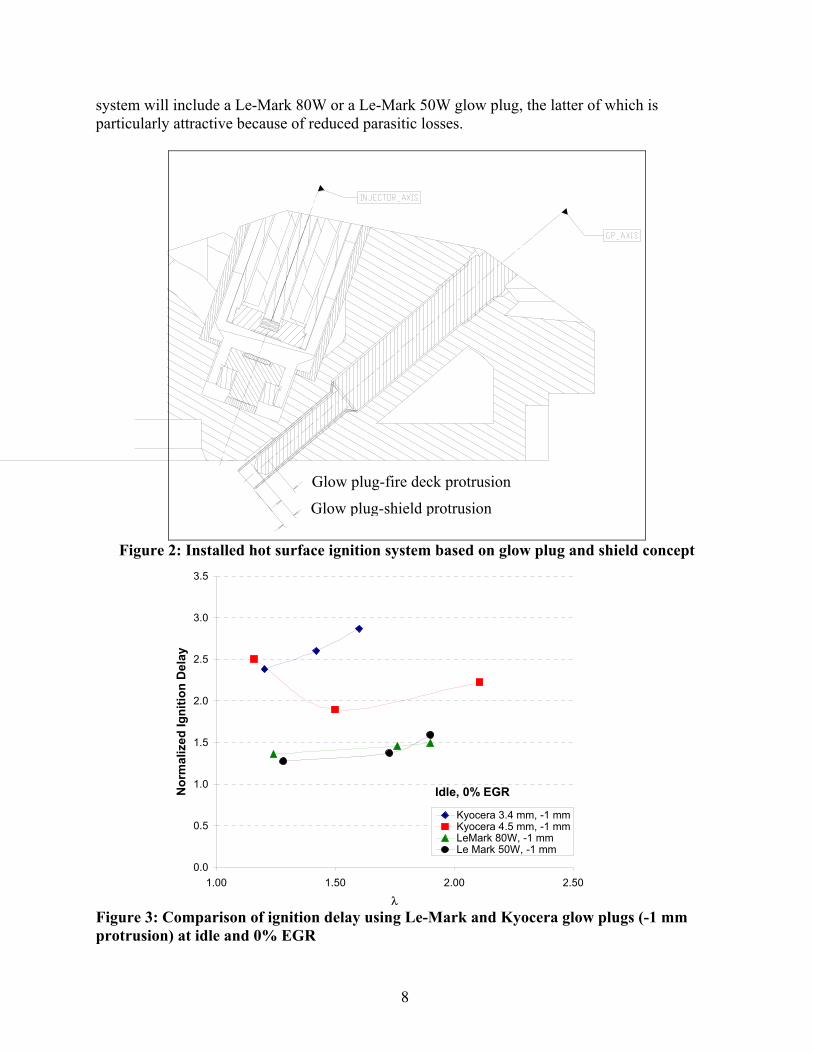
A pump line nozzle (PLN) configuration of the Lynx engine was used to test the performance of the Le-Mark 50W, Le-Mark 80W, Kyocera 3.4mm (45W), and Kyocera 4.5mm (75W) glow plugs. The comparison of the glow plugs was performed using a -1 mm glow plug protrusion relative to the shield (Figure 2). To isolate the impact of glow plug performance, the shields used for this testing were uncoated. Figures 3-6 compare the ignition delay (measured in cylinder 4) and Pmax coefficient of variance (COV) for the four glow plugs tested at -1 mm protrusion on a PLN engine. The results clearly show that the Kyocera 3.4mm glow plugs were very unstable at idle and 2000 rpm/50 N-m. This is likely due to the low thermal mass of the Kyocera 3.4mm design, which results in a large amount of convective cooling due to the in-cylinder charge motion. The Kyocera 4.5mm glow plug design resulted in much better stability. However, the performance of both Kyocera designs was inferior to the Le-Mark 50W and 80W at idle, although the Kyocera 4.5mm glow plug compared favorably at 2000 rpm/50 N-m. The geometry of the heating elements in each glow plug is different, likely resulting in different temperature distributions on the tip of each injector. Based on this initial comparison, it was concluded that the preferred embodiment of the ignition
8
system will include a Le-Mark 80W or a Le-Mark 50W glow plug, the latter of which is particularly attractive because of reduced parasitic losses.
Figure 2: Installed hot surface ignition system based on glow plug and shield concept
Figure 3: Comparison of ignition delay using Le-Mark and Kyocera glow plugs (-1 mm protrusion) at idle and 0% EGR
Glow plug-fire deck protrusion
Glow plug-shield protrusion
0.0
0.5
1.0
1.5
2.0
2.5
3.0
3.5
1.00 1.50 2.00 2.50
λ
Nor
mal
ized
Igni
tion
Del
ay
Kyocera 3.4 mm, -1 mmKyocera 4.5 mm, -1 mmLeMark 80W, -1 mmLe Mark 50W, -1 mm
Idle, 0% EGR
9
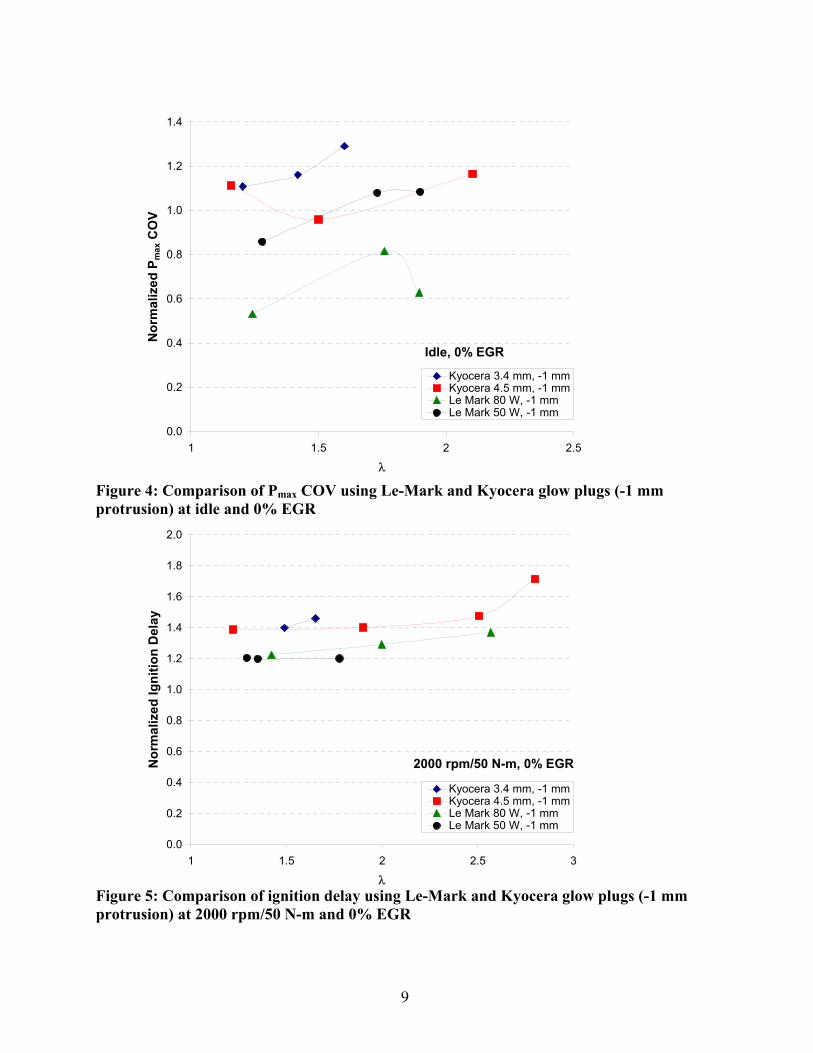
Figure 4: Comparison of Pmax COV using Le-Mark and Kyocera glow plugs (-1 mm protrusion) at idle and 0% EGR Figure 5: Comparison of ignition delay using Le-Mark and Kyocera glow plugs (-1 mm protrusion) at 2000 rpm/50 N-m and 0% EGR
0.0
0.2
0.4
0.6
0.8
1.0
1.2
1.4
1 1.5 2 2.5
λ
Nor
mal
ized
Pm
ax C
OV
Kyocera 3.4 mm, -1 mmKyocera 4.5 mm, -1 mmLe Mark 80 W, -1 mmLe Mark 50 W, -1 mm
Idle, 0% EGR
0.0
0.2
0.4
0.6
0.8
1.0
1.2
1.4
1.6
1.8
2.0
1 1.5 2 2.5 3
λ
Nor
mal
ized
Igni
tion
Del
ay
Kyocera 3.4 mm, -1 mmKyocera 4.5 mm, -1 mmLe Mark 80 W, -1 mmLe Mark 50 W, -1 mm
2000 rpm/50 N-m, 0% EGR
10
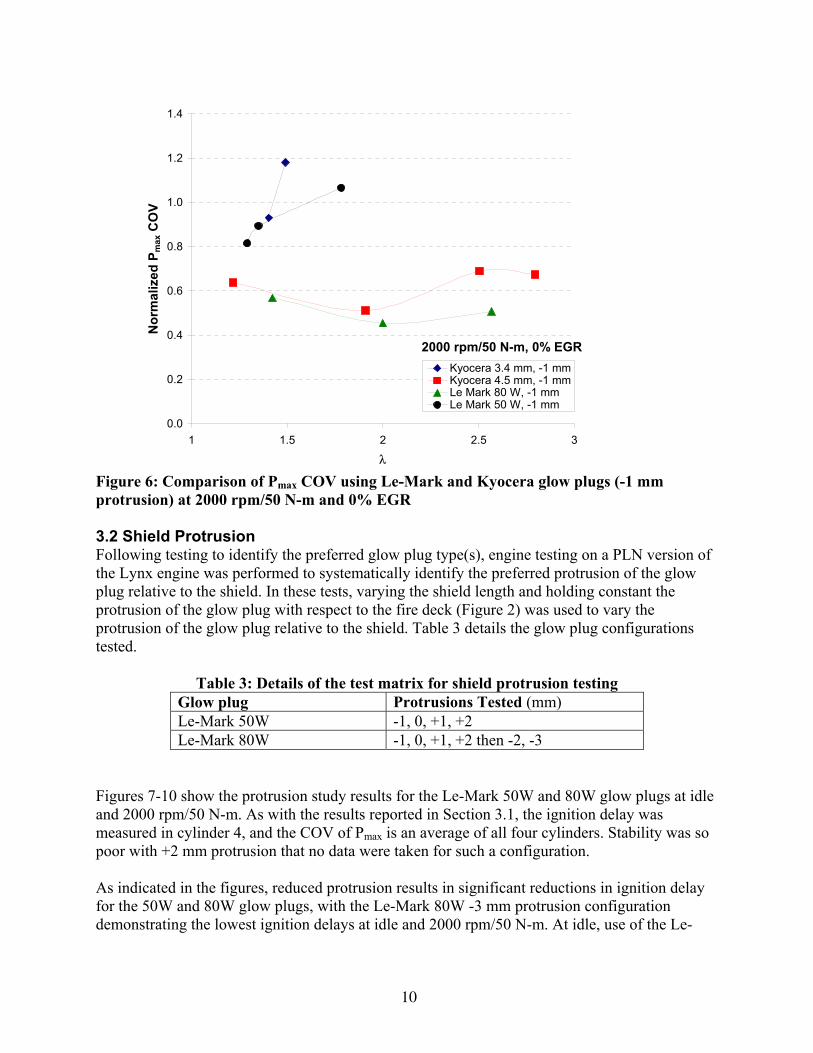
Figure 6: Comparison of Pmax COV using Le-Mark and Kyocera glow plugs (-1 mm protrusion) at 2000 rpm/50 N-m and 0% EGR 3.2 Shield Protrusion Following testing to identify the preferred glow plug type(s), engine testing on a PLN version of the Lynx engine was performed to systematically identify the preferred protrusion of the glow plug relative to the shield. In these tests, varying the shield length and holding constant the protrusion of the glow plug with respect to the fire deck (Figure 2) was used to vary the protrusion of the glow plug relative to the shield. Table 3 details the glow plug configurations tested.
Table 3: Details of the test matrix for shield protrusion testing Glow plug Protrusions Tested (mm) Le-Mark 50W -1, 0, +1, +2 Le-Mark 80W -1, 0, +1, +2 then -2, -3
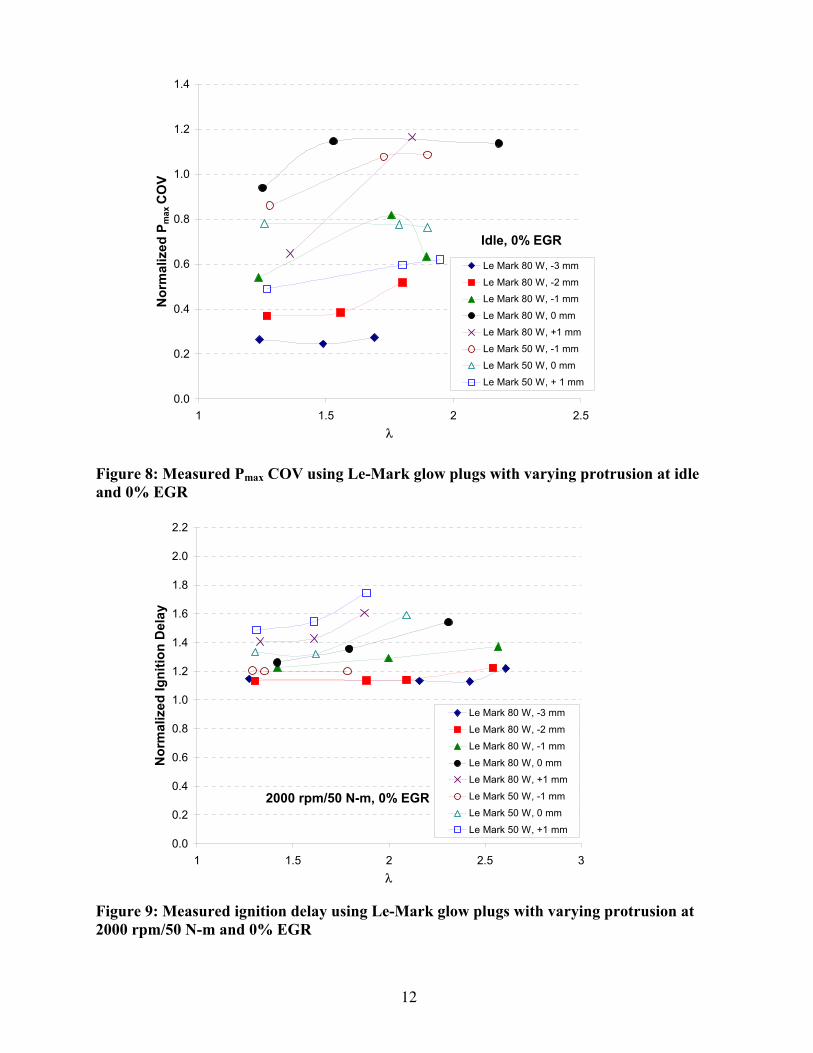
Figures 7-10 show the protrusion study results for the Le-Mark 50W and 80W glow plugs at idle and 2000 rpm/50 N-m. As with the results reported in Section 3.1, the ignition delay was measured in cylinder 4, and the COV of Pmax is an average of all four cylinders. Stability was so poor with +2 mm protrusion that no data were taken for such a configuration. As indicated in the figures, reduced protrusion results in significant reductions in ignition delay for the 50W and 80W glow plugs, with the Le-Mark 80W -3 mm protrusion configuration demonstrating the lowest ignition delays at idle and 2000 rpm/50 N-m. At idle, use of the Le-
0.0
0.2
0.4
0.6
0.8
1.0
1.2
1.4
1 1.5 2 2.5 3
λ
Nor
mal
ized
Pm
ax C
OV
Kyocera 3.4 mm, -1 mmKyocera 4.5 mm, -1 mmLe Mark 80 W, -1 mmLe Mark 50 W, -1 mm
2000 rpm/50 N-m, 0% EGR
11
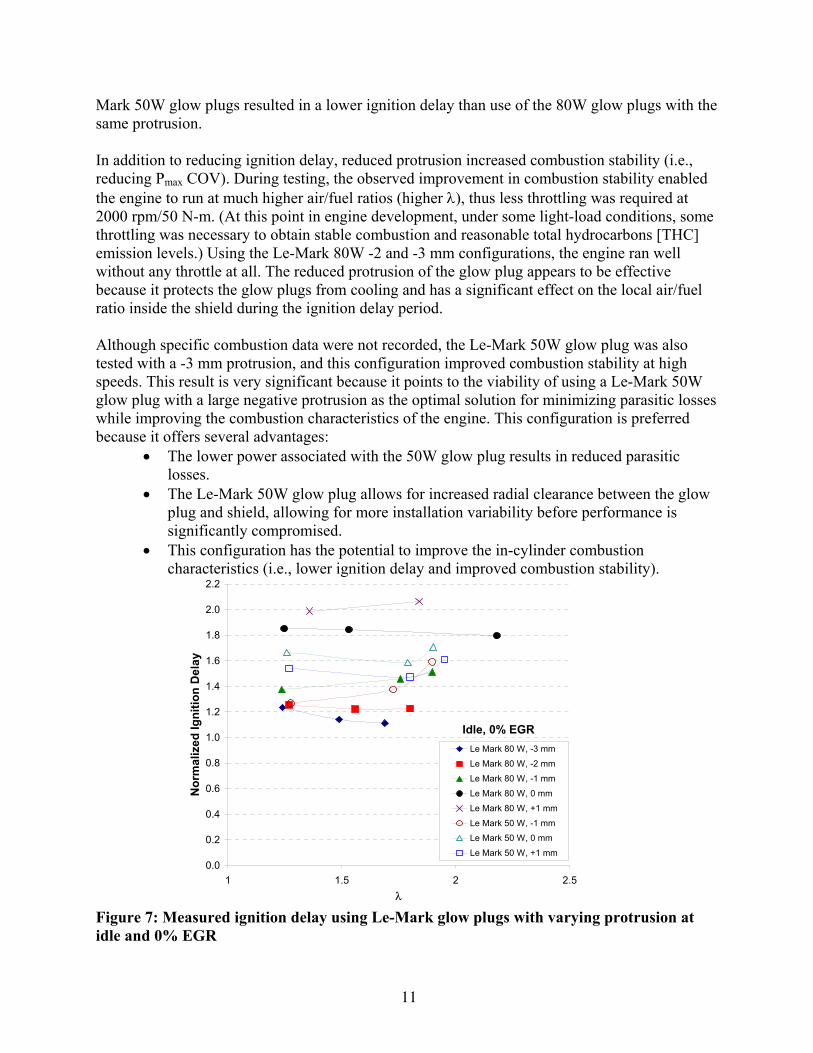
Mark 50W glow plugs resulted in a lower ignition delay than use of the 80W glow plugs with the same protrusion. In addition to reducing ignition delay, reduced protrusion increased combustion stability (i.e., reducing Pmax COV). During testing, the observed improvement in combustion stability enabled the engine to run at much higher air/fuel ratios (higher λ), thus less throttling was required at 2000 rpm/50 N-m. (At this point in engine development, under some light-load conditions, some throttling was necessary to obtain stable combustion and reasonable total hydrocarbons [THC] emission levels.) Using the Le-Mark 80W -2 and -3 mm configurations, the engine ran well without any throttle at all. The reduced protrusion of the glow plug appears to be effective because it protects the glow plugs from cooling and has a significant effect on the local air/fuel ratio inside the shield during the ignition delay period. Although specific combustion data were not recorded, the Le-Mark 50W glow plug was also tested with a -3 mm protrusion, and this configuration improved combustion stability at high speeds. This result is very significant because it points to the viability of using a Le-Mark 50W glow plug with a large negative protrusion as the optimal solution for minimizing parasitic losses while improving the combustion characteristics of the engine. This configuration is preferred because it offers several advantages:
• The lower power associated with the 50W glow plug results in reduced parasitic losses.
• The Le-Mark 50W glow plug allows for increased radial clearance between the glow plug and shield, allowing for more installation variability before performance is significantly compromised.
• This configuration has the potential to improve the in-cylinder combustion characteristics (i.e., lower ignition delay and improved combustion stability).
Figure 7: Measured ignition delay using Le-Mark glow plugs with varying protrusion at idle and 0% EGR
0.0
0.2
0.4
0.6
0.8
1.0
1.2
1.4
1.6
1.8
2.0
2.2
1 1.5 2 2.5λ
Nor
mal
ized
Igni
tion
Del
ay
Le Mark 80 W, -3 mmLe Mark 80 W, -2 mmLe Mark 80 W, -1 mmLe Mark 80 W, 0 mmLe Mark 80 W, +1 mmLe Mark 50 W, -1 mmLe Mark 50 W, 0 mmLe Mark 50 W, +1 mm
Idle, 0% EGR
12
Figure 8: Measured Pmax COV using Le-Mark glow plugs with varying protrusion at idle and 0% EGR Figure 9: Measured ignition delay using Le-Mark glow plugs with varying protrusion at 2000 rpm/50 N-m and 0% EGR
0.0
0.2
0.4
0.6
0.8
1.0
1.2
1.4
1 1.5 2 2.5λ
Nor
mal
ized
Pm
ax C
OV
Le Mark 80 W, -3 mmLe Mark 80 W, -2 mmLe Mark 80 W, -1 mmLe Mark 80 W, 0 mmLe Mark 80 W, +1 mmLe Mark 50 W, -1 mmLe Mark 50 W, 0 mmLe Mark 50 W, + 1 mm
Idle, 0% EGR
0.0
0.2
0.4
0.6
0.8
1.0
1.2
1.4
1.6
1.8
2.0
2.2
1 1.5 2 2.5 3λ
Nor
mal
ized
Igni
tion
Del
ay
Le Mark 80 W, -3 mmLe Mark 80 W, -2 mmLe Mark 80 W, -1 mmLe Mark 80 W, 0 mmLe Mark 80 W, +1 mmLe Mark 50 W, -1 mmLe Mark 50 W, 0 mmLe Mark 50 W, +1 mm
2000 rpm/50 N-m, 0% EGR
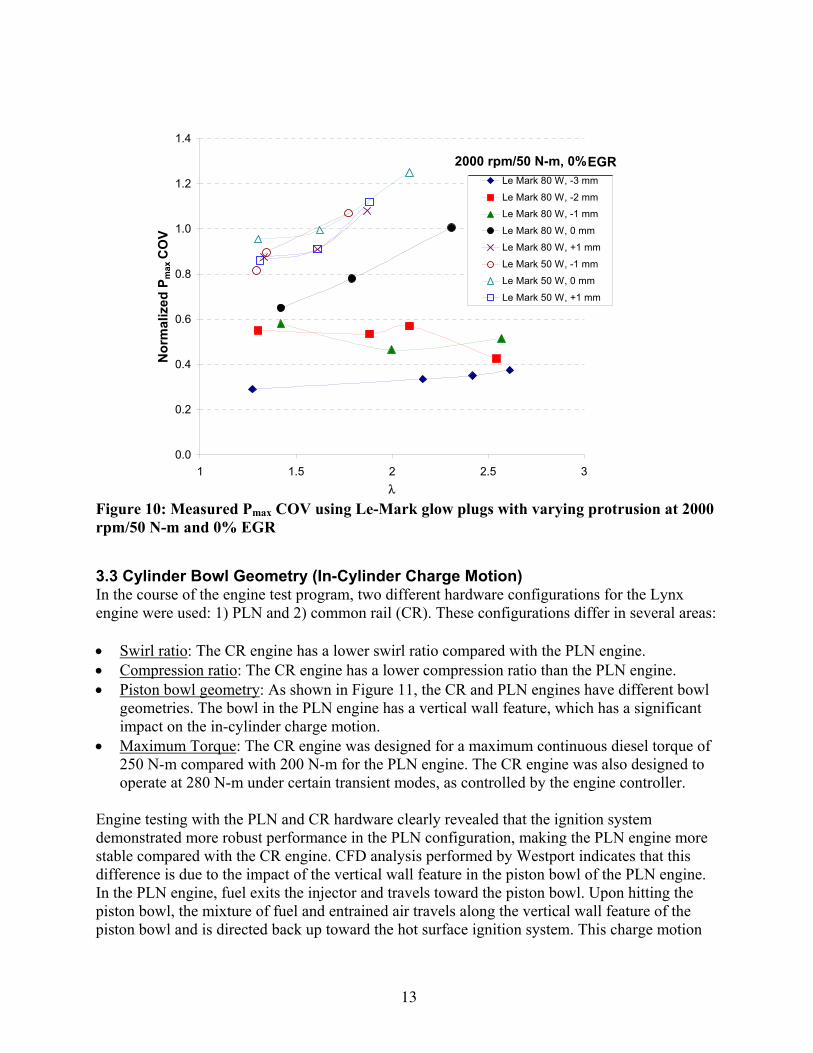
13
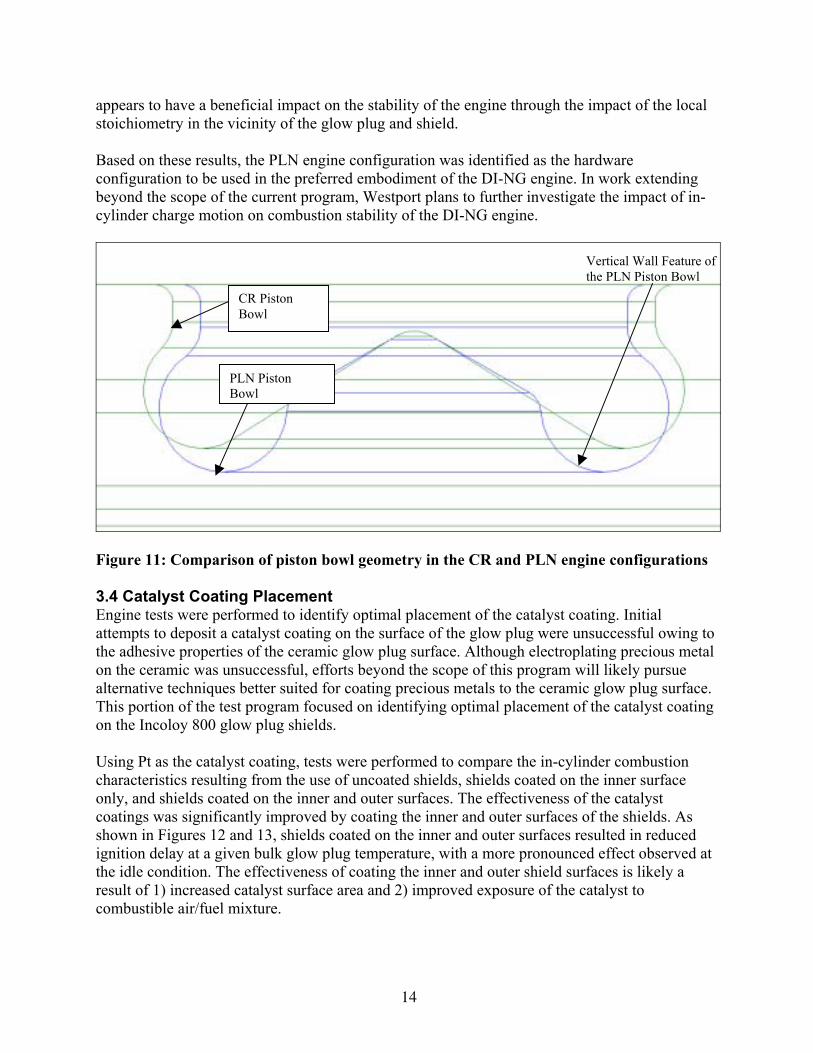
Figure 10: Measured Pmax COV using Le-Mark glow plugs with varying protrusion at 2000 rpm/50 N-m and 0% EGR 3.3 Cylinder Bowl Geometry (In-Cylinder Charge Motion) In the course of the engine test program, two different hardware configurations for the Lynx engine were used: 1) PLN and 2) common rail (CR). These configurations differ in several areas: • Swirl ratio: The CR engine has a lower swirl ratio compared with the PLN engine. • Compression ratio: The CR engine has a lower compression ratio than the PLN engine. • Piston bowl geometry: As shown in Figure 11, the CR and PLN engines have different bowl
geometries. The bowl in the PLN engine has a vertical wall feature, which has a significant impact on the in-cylinder charge motion.
• Maximum Torque: The CR engine was designed for a maximum continuous diesel torque of 250 N-m compared with 200 N-m for the PLN engine. The CR engine was also designed to operate at 280 N-m under certain transient modes, as controlled by the engine controller.
Engine testing with the PLN and CR hardware clearly revealed that the ignition system demonstrated more robust performance in the PLN configuration, making the PLN engine more stable compared with the CR engine. CFD analysis performed by Westport indicates that this difference is due to the impact of the vertical wall feature in the piston bowl of the PLN engine. In the PLN engine, fuel exits the injector and travels toward the piston bowl. Upon hitting the piston bowl, the mixture of fuel and entrained air travels along the vertical wall feature of the piston bowl and is directed back up toward the hot surface ignition system. This charge motion
0.0
0.2
0.4
0.6
0.8
1.0
1.2
1.4
1 1.5 2 2.5 3λ
Nor
mal
ized
Pm
ax C
OV
Le Mark 80 W, -3 mmLe Mark 80 W, -2 mmLe Mark 80 W, -1 mmLe Mark 80 W, 0 mmLe Mark 80 W, +1 mmLe Mark 50 W, -1 mmLe Mark 50 W, 0 mmLe Mark 50 W, +1 mm
2000 rpm/50 N-m, 0% EGR
EGR
14
appears to have a beneficial impact on the stability of the engine through the impact of the local stoichiometry in the vicinity of the glow plug and shield. Based on these results, the PLN engine configuration was identified as the hardware configuration to be used in the preferred embodiment of the DI-NG engine. In work extending beyond the scope of the current program, Westport plans to further investigate the impact of in-cylinder charge motion on combustion stability of the DI-NG engine.
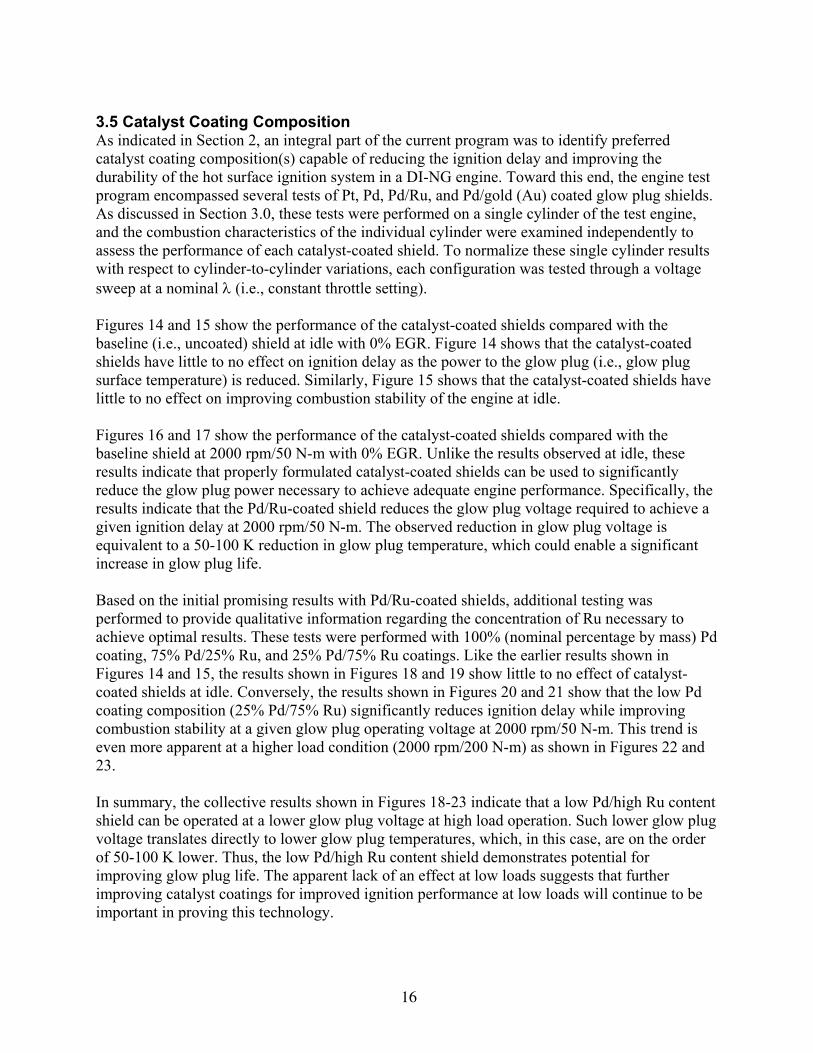
Figure 11: Comparison of piston bowl geometry in the CR and PLN engine configurations 3.4 Catalyst Coating Placement Engine tests were performed to identify optimal placement of the catalyst coating. Initial attempts to deposit a catalyst coating on the surface of the glow plug were unsuccessful owing to the adhesive properties of the ceramic glow plug surface. Although electroplating precious metal on the ceramic was unsuccessful, efforts beyond the scope of this program will likely pursue alternative techniques better suited for coating precious metals to the ceramic glow plug surface. This portion of the test program focused on identifying optimal placement of the catalyst coating on the Incoloy 800 glow plug shields. Using Pt as the catalyst coating, tests were performed to compare the in-cylinder combustion characteristics resulting from the use of uncoated shields, shields coated on the inner surface only, and shields coated on the inner and outer surfaces. The effectiveness of the catalyst coatings was significantly improved by coating the inner and outer surfaces of the shields. As shown in Figures 12 and 13, shields coated on the inner and outer surfaces resulted in reduced ignition delay at a given bulk glow plug temperature, with a more pronounced effect observed at the idle condition. The effectiveness of coating the inner and outer shield surfaces is likely a result of 1) increased catalyst surface area and 2) improved exposure of the catalyst to combustible air/fuel mixture.
Vertical Wall Feature of the PLN Piston Bowl
PLN Piston Bowl
CR Piston Bowl
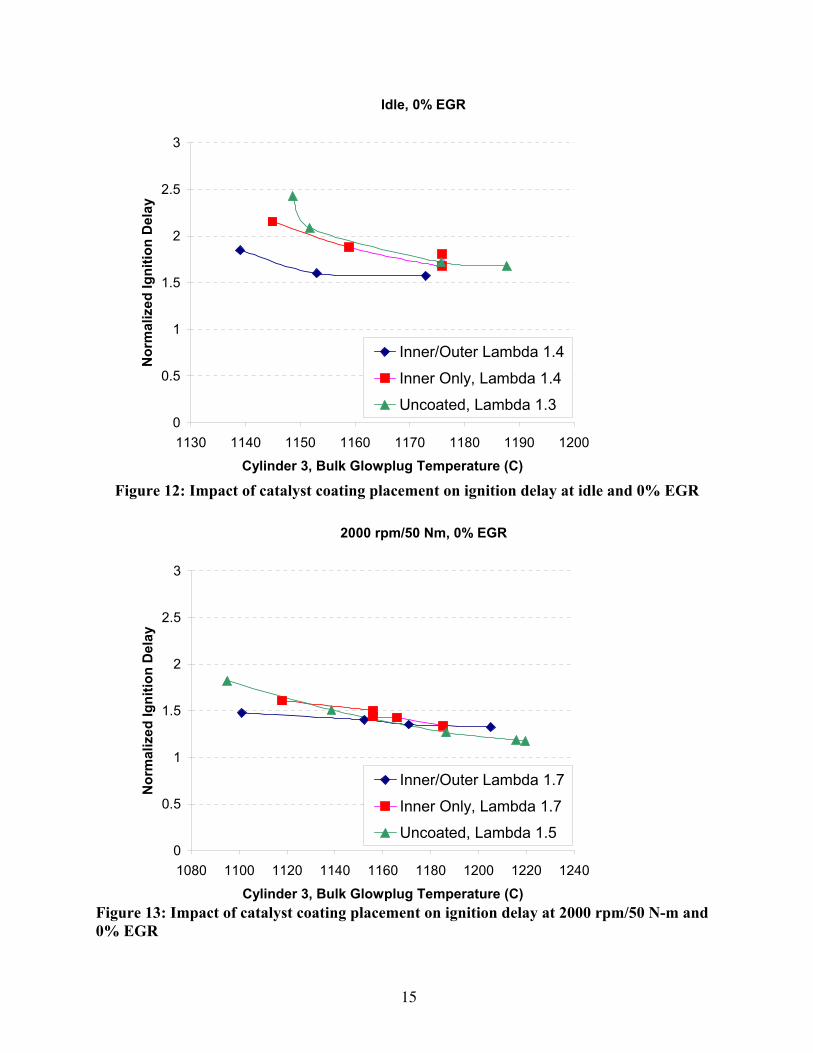
15
Figure 12: Impact of catalyst coating placement on ignition delay at idle and 0% EGR Figure 13: Impact of catalyst coating placement on ignition delay at 2000 rpm/50 N-m and 0% EGR
Idle, 0% EGR
0
0.5
1
1.5
2
2.5
3
1130 1140 1150 1160 1170 1180 1190 1200Cylinder 3, Bulk Glowplug Temperature (C)
Nor
mal
ized
Igni
tion
Del
ay
Inner/Outer Lambda 1.4Inner Only, Lambda 1.4Uncoated, Lambda 1.3
2000 rpm/50 Nm, 0% EGR
0
0.5
1
1.5
2
2.5
3
1080 1100 1120 1140 1160 1180 1200 1220 1240Cylinder 3, Bulk Glowplug Temperature (C)
Nor
mal
ized
Igni
tion
Del
ay
Inner/Outer Lambda 1.7Inner Only, Lambda 1.7Uncoated, Lambda 1.5
16
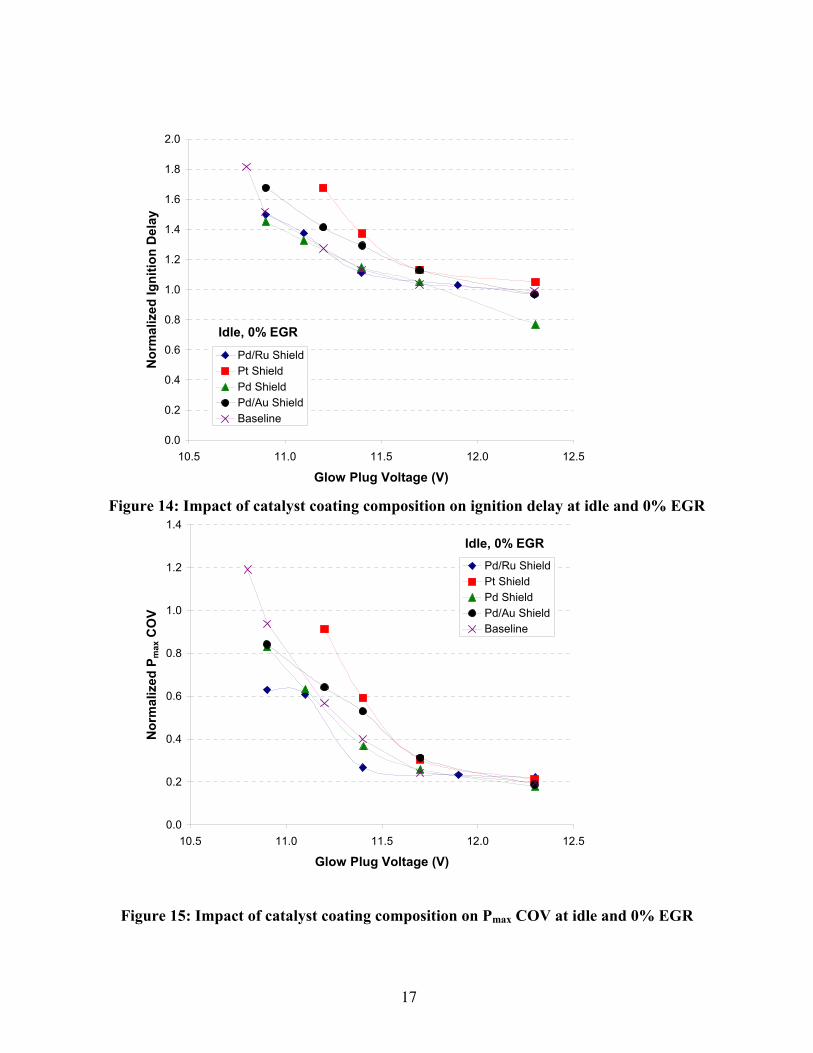
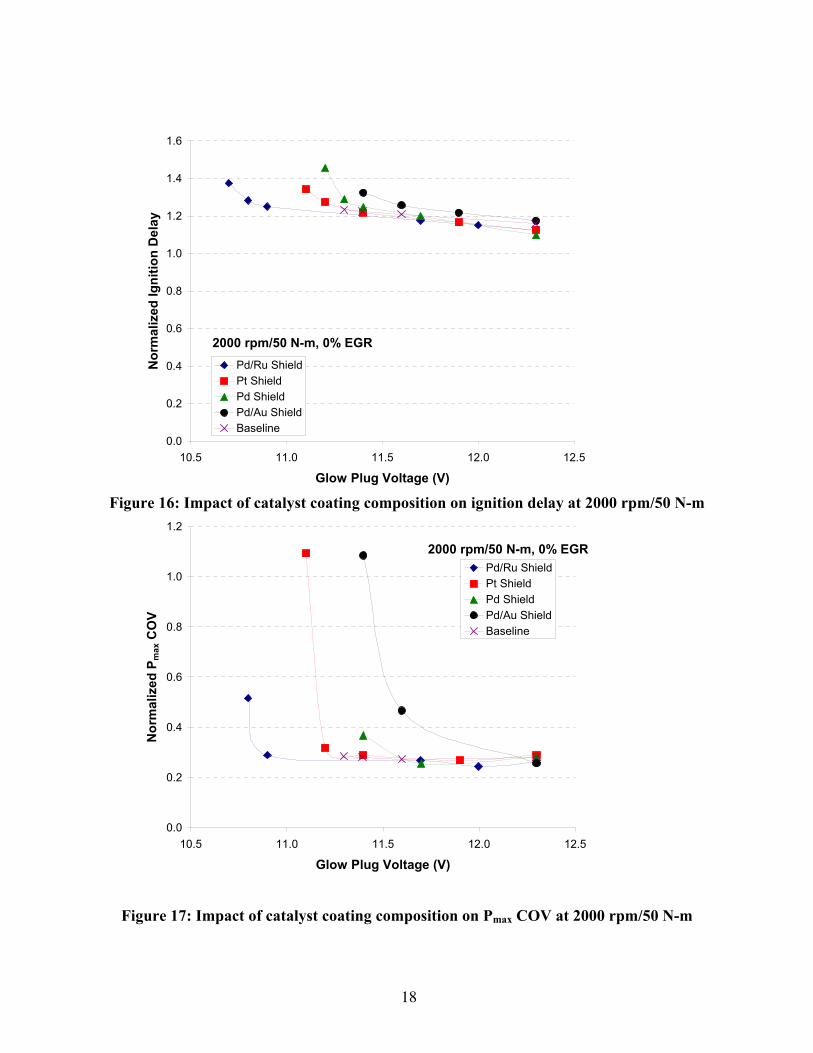
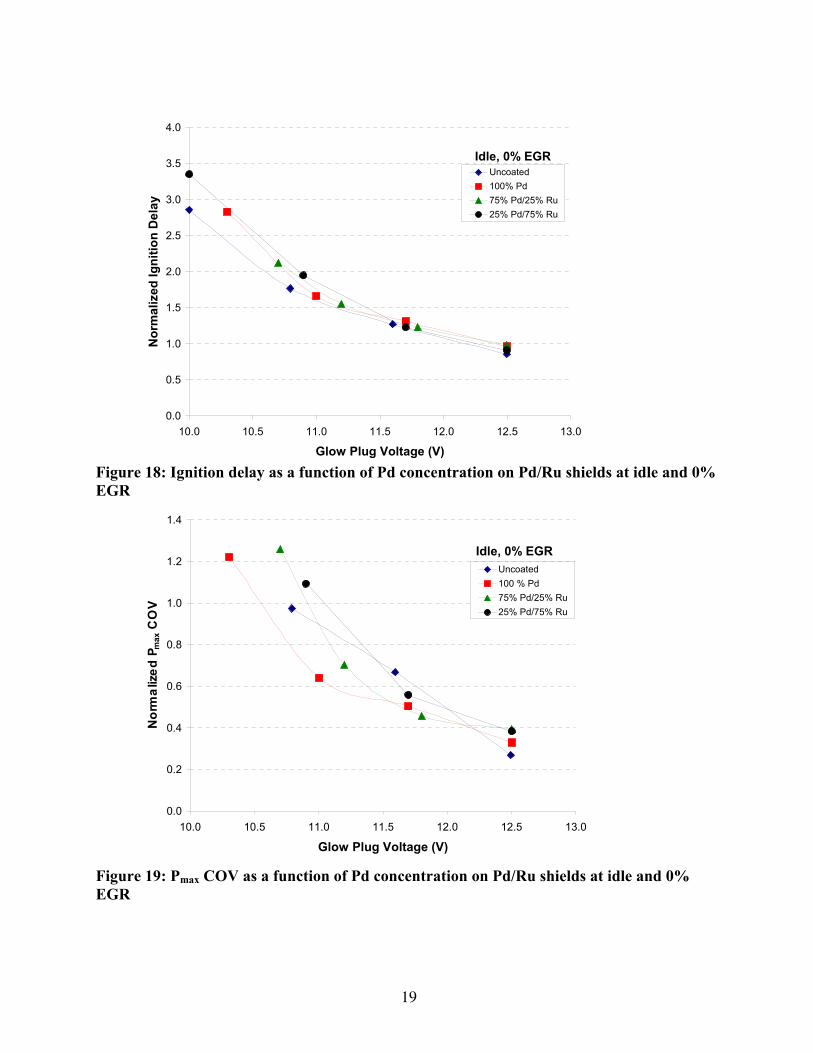
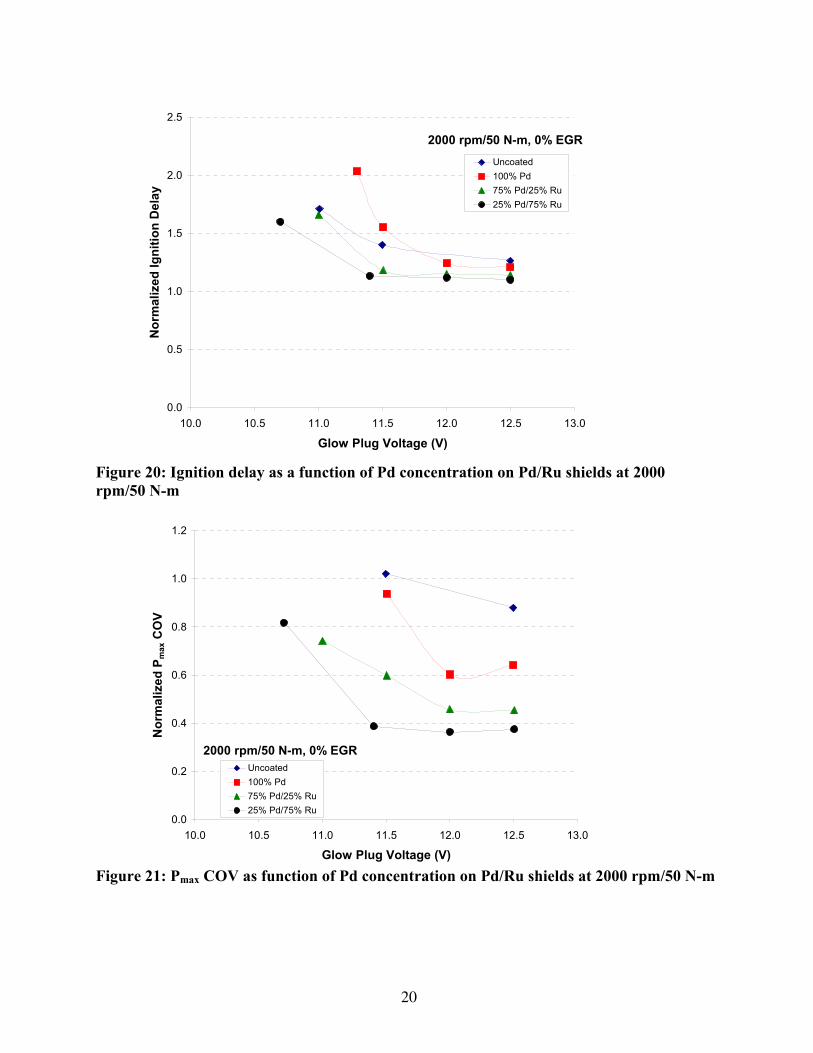
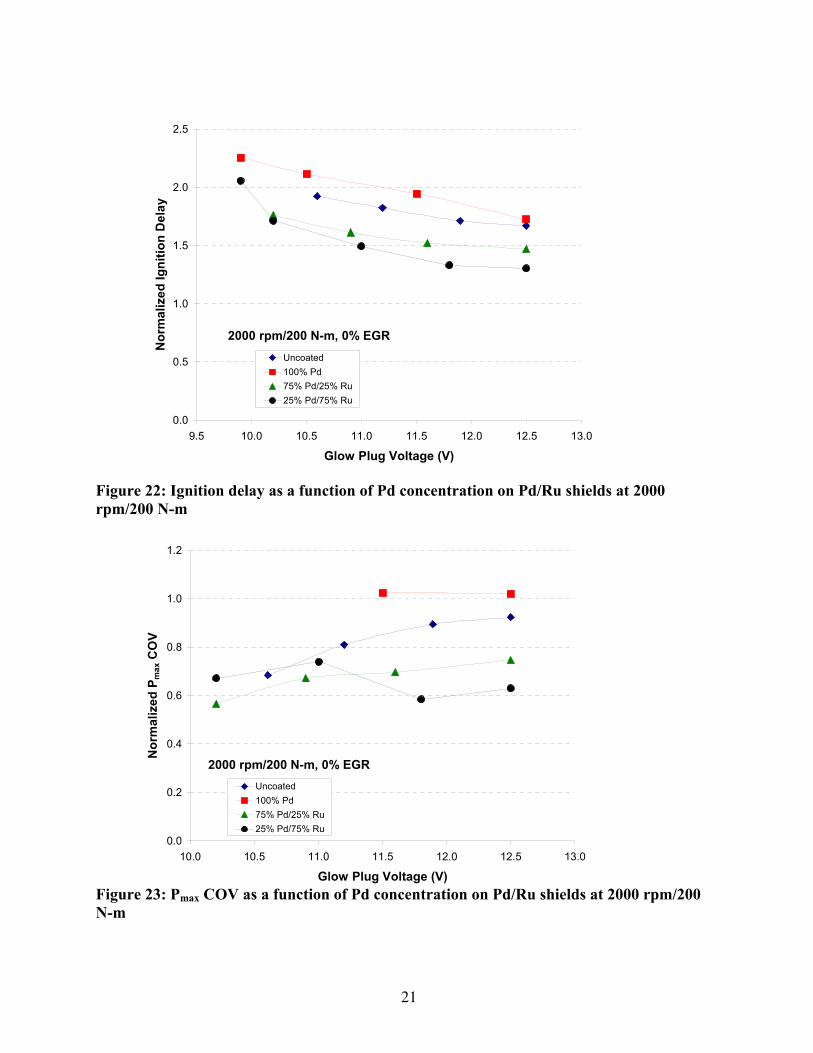
3.5 Catalyst Coating Composition As indicated in Section 2, an integral part of the current program was to identify preferred catalyst coating composition(s) capable of reducing the ignition delay and improving the durability of the hot surface ignition system in a DI-NG engine. Toward this end, the engine test program encompassed several tests of Pt, Pd, Pd/Ru, and Pd/gold (Au) coated glow plug shields. As discussed in Section 3.0, these tests were performed on a single cylinder of the test engine, and the combustion characteristics of the individual cylinder were examined independently to assess the performance of each catalyst-coated shield. To normalize these single cylinder results with respect to cylinder-to-cylinder variations, each configuration was tested through a voltage sweep at a nominal λ (i.e., constant throttle setting). Figures 14 and 15 show the performance of the catalyst-coated shields compared with the baseline (i.e., uncoated) shield at idle with 0% EGR. Figure 14 shows that the catalyst-coated shields have little to no effect on ignition delay as the power to the glow plug (i.e., glow plug surface temperature) is reduced. Similarly, Figure 15 shows that the catalyst-coated shields have little to no effect on improving combustion stability of the engine at idle. Figures 16 and 17 show the performance of the catalyst-coated shields compared with the baseline shield at 2000 rpm/50 N-m with 0% EGR. Unlike the results observed at idle, these results indicate that properly formulated catalyst-coated shields can be used to significantly reduce the glow plug power necessary to achieve adequate engine performance. Specifically, the results indicate that the Pd/Ru-coated shield reduces the glow plug voltage required to achieve a given ignition delay at 2000 rpm/50 N-m. The observed reduction in glow plug voltage is equivalent to a 50-100 K reduction in glow plug temperature, which could enable a significant increase in glow plug life. Based on the initial promising results with Pd/Ru-coated shields, additional testing was performed to provide qualitative information regarding the concentration of Ru necessary to achieve optimal results. These tests were performed with 100% (nominal percentage by mass) Pd coating, 75% Pd/25% Ru, and 25% Pd/75% Ru coatings. Like the earlier results shown in Figures 14 and 15, the results shown in Figures 18 and 19 show little to no effect of catalyst-coated shields at idle. Conversely, the results shown in Figures 20 and 21 show that the low Pd coating composition (25% Pd/75% Ru) significantly reduces ignition delay while improving combustion stability at a given glow plug operating voltage at 2000 rpm/50 N-m. This trend is even more apparent at a higher load condition (2000 rpm/200 N-m) as shown in Figures 22 and 23. In summary, the collective results shown in Figures 18-23 indicate that a low Pd/high Ru content shield can be operated at a lower glow plug voltage at high load operation. Such lower glow plug voltage translates directly to lower glow plug temperatures, which, in this case, are on the order of 50-100 K lower. Thus, the low Pd/high Ru content shield demonstrates potential for improving glow plug life. The apparent lack of an effect at low loads suggests that further improving catalyst coatings for improved ignition performance at low loads will continue to be important in proving this technology.
17
Figure 14: Impact of catalyst coating composition on ignition delay at idle and 0% EGR
Figure 15: Impact of catalyst coating composition on Pmax COV at idle and 0% EGR
0.0
0.2
0.4
0.6
0.8
1.0
1.2
1.4
1.6
1.8
2.0
10.5 11.0 11.5 12.0 12.5
Glow Plug Voltage (V)
Nor
mal
ized
Igni
tion
Del
ay
Pd/Ru ShieldPt ShieldPd ShieldPd/Au ShieldBaseline
Idle, 0% EGR
0.0
0.2
0.4
0.6
0.8
1.0
1.2
1.4
10.5 11.0 11.5 12.0 12.5
Glow Plug Voltage (V)
Nor
mal
ized
Pm
ax C
OV
Pd/Ru ShieldPt ShieldPd ShieldPd/Au ShieldBaseline
Idle, 0% EGR
18
Figure 16: Impact of catalyst coating composition on ignition delay at 2000 rpm/50 N-m
Figure 17: Impact of catalyst coating composition on Pmax COV at 2000 rpm/50 N-m
0.0
0.2
0.4
0.6
0.8
1.0
1.2
1.4
1.6
10.5 11.0 11.5 12.0 12.5
Glow Plug Voltage (V)
Nor
mal
ized
Igni
tion
Del
ay
Pd/Ru ShieldPt ShieldPd ShieldPd/Au ShieldBaseline
2000 rpm/50 N-m, 0% EGR
0.0
0.2
0.4
0.6
0.8
1.0
1.2
10.5 11.0 11.5 12.0 12.5
Glow Plug Voltage (V)
Nor
mal
ized
Pm
ax C
OV
Pd/Ru ShieldPt ShieldPd ShieldPd/Au ShieldBaseline
2000 rpm/50 N-m, 0% EGR
19
Figure 18: Ignition delay as a function of Pd concentration on Pd/Ru shields at idle and 0% EGR Figure 19: Pmax COV as a function of Pd concentration on Pd/Ru shields at idle and 0% EGR
0.0
0.5
1.0
1.5
2.0
2.5
3.0
3.5
4.0
10.0 10.5 11.0 11.5 12.0 12.5 13.0
Glow Plug Voltage (V)
Nor
mal
ized
Igni
tion
Del
ayUncoated100% Pd75% Pd/25% Ru25% Pd/75% Ru
Idle, 0% EGR
0.0
0.2
0.4
0.6
0.8
1.0
1.2
1.4
10.0 10.5 11.0 11.5 12.0 12.5 13.0
Glow Plug Voltage (V)
Nor
mal
ized
P max
CO
V
Uncoated100 % Pd75% Pd/25% Ru25% Pd/75% Ru
Idle, 0% EGR
20
Figure 20: Ignition delay as a function of Pd concentration on Pd/Ru shields at 2000 rpm/50 N-m Figure 21: Pmax COV as function of Pd concentration on Pd/Ru shields at 2000 rpm/50 N-m
0.0
0.5
1.0
1.5
2.0
2.5
10.0 10.5 11.0 11.5 12.0 12.5 13.0
Glow Plug Voltage (V)
Nor
mal
ized
Igni
tion
Del
ayUncoated100% Pd75% Pd/25% Ru25% Pd/75% Ru
2000 rpm/50 N-m, 0% EGR
0.0
0.2
0.4
0.6
0.8
1.0
1.2
10.0 10.5 11.0 11.5 12.0 12.5 13.0
Glow Plug Voltage (V)
Nor
mal
ized
Pm
ax C
OV
Uncoated100% Pd75% Pd/25% Ru25% Pd/75% Ru
2000 rpm/50 N-m, 0% EGR
21
Figure 22: Ignition delay as a function of Pd concentration on Pd/Ru shields at 2000 rpm/200 N-m Figure 23: Pmax COV as a function of Pd concentration on Pd/Ru shields at 2000 rpm/200 N-m
0.0
0.5
1.0
1.5
2.0
2.5
9.5 10.0 10.5 11.0 11.5 12.0 12.5 13.0
Glow Plug Voltage (V)
Nor
mal
ized
Igni
tion
Del
ay
Uncoated100% Pd75% Pd/25% Ru25% Pd/75% Ru
2000 rpm/200 N-m, 0% EGR
0.0
0.2
0.4
0.6
0.8
1.0
1.2
10.0 10.5 11.0 11.5 12.0 12.5 13.0
Glow Plug Voltage (V)
Nor
mal
ized
Pm
ax C
OV
Uncoated100% Pd75% Pd/25% Ru25% Pd/75% Ru
2000 rpm/200 N-m, 0% EGR
22
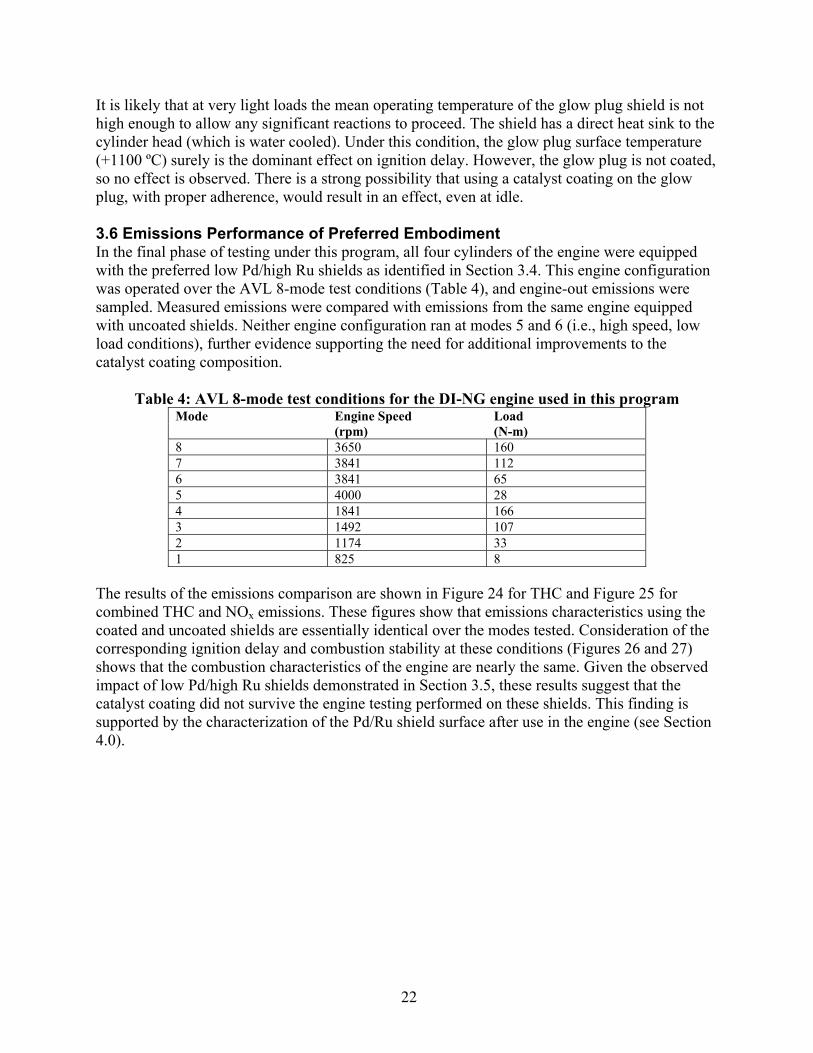
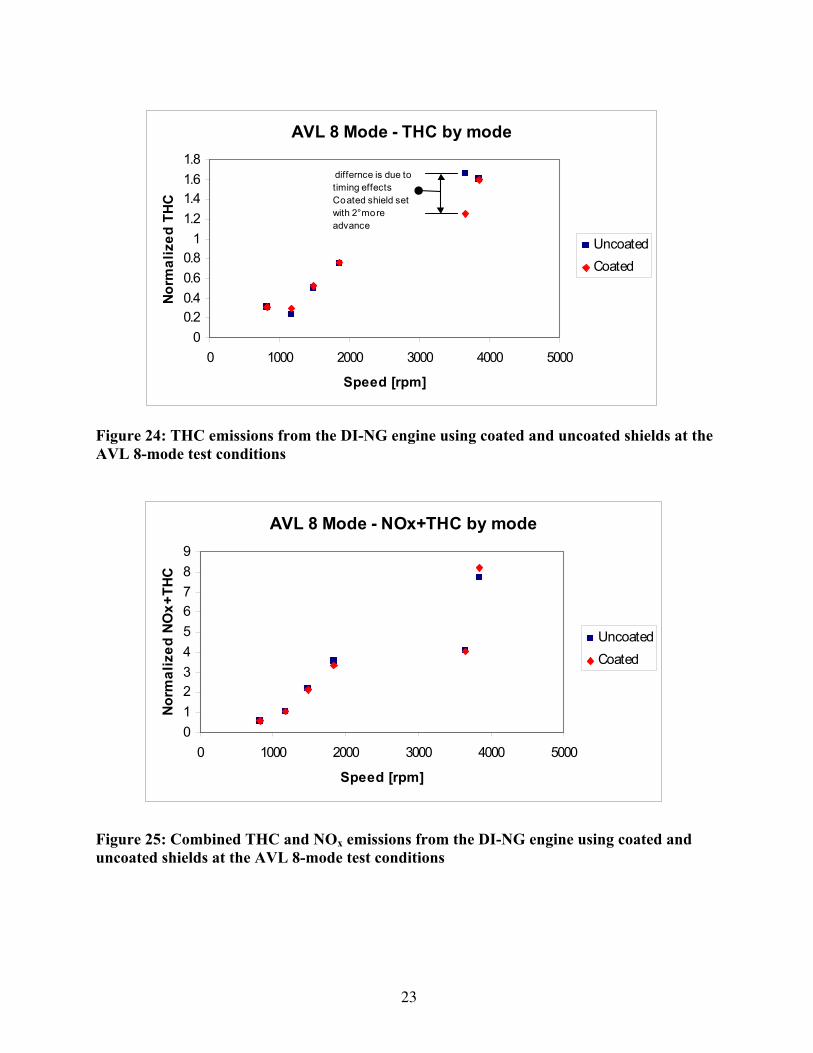
It is likely that at very light loads the mean operating temperature of the glow plug shield is not high enough to allow any significant reactions to proceed. The shield has a direct heat sink to the cylinder head (which is water cooled). Under this condition, the glow plug surface temperature (+1100 ºC) surely is the dominant effect on ignition delay. However, the glow plug is not coated, so no effect is observed. There is a strong possibility that using a catalyst coating on the glow plug, with proper adherence, would result in an effect, even at idle. 3.6 Emissions Performance of Preferred Embodiment In the final phase of testing under this program, all four cylinders of the engine were equipped with the preferred low Pd/high Ru shields as identified in Section 3.4. This engine configuration was operated over the AVL 8-mode test conditions (Table 4), and engine-out emissions were sampled. Measured emissions were compared with emissions from the same engine equipped with uncoated shields. Neither engine configuration ran at modes 5 and 6 (i.e., high speed, low load conditions), further evidence supporting the need for additional improvements to the catalyst coating composition.
Table 4: AVL 8-mode test conditions for the DI-NG engine used in this program Mode Engine Speed Load (rpm) (N-m) 8 3650 160 7 3841 112 6 3841 65 5 4000 28 4 1841 166 3 1492 107 2 1174 33 1 825 8
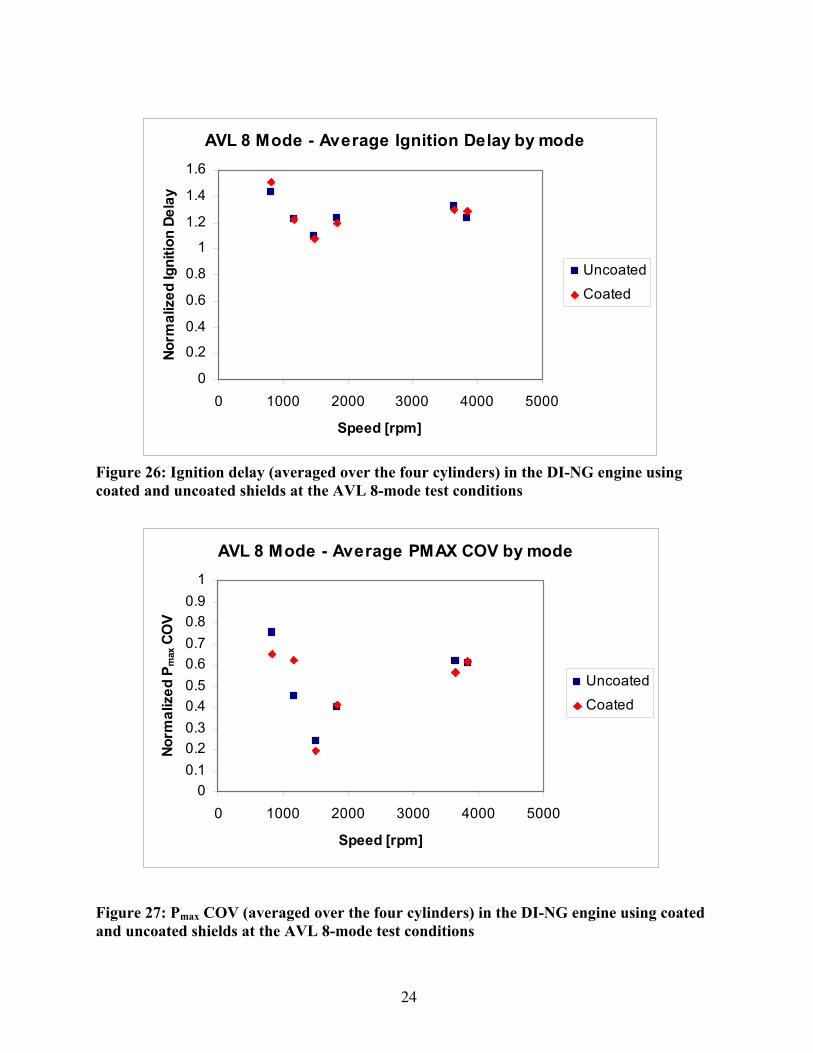
The results of the emissions comparison are shown in Figure 24 for THC and Figure 25 for combined THC and NOx emissions. These figures show that emissions characteristics using the coated and uncoated shields are essentially identical over the modes tested. Consideration of the corresponding ignition delay and combustion stability at these conditions (Figures 26 and 27) shows that the combustion characteristics of the engine are nearly the same. Given the observed impact of low Pd/high Ru shields demonstrated in Section 3.5, these results suggest that the catalyst coating did not survive the engine testing performed on these shields. This finding is supported by the characterization of the Pd/Ru shield surface after use in the engine (see Section 4.0).
23
Figure 24: THC emissions from the DI-NG engine using coated and uncoated shields at the AVL 8-mode test conditions Figure 25: Combined THC and NOx emissions from the DI-NG engine using coated and uncoated shields at the AVL 8-mode test conditions
AVL 8 Mode - THC by mode
00.20.40.60.8
11.21.41.61.8
0 1000 2000 3000 4000 5000
Speed [rpm]
Norm
aliz
ed T
HC
UncoatedCoated
differnce is due to timing effectsCoated shield set with 2° more advance
AVL 8 Mode - NOx+THC by mode
0123456789
0 1000 2000 3000 4000 5000
Speed [rpm]
Norm
aliz
ed N
Ox+
THC
UncoatedCoated
24
Figure 26: Ignition delay (averaged over the four cylinders) in the DI-NG engine using coated and uncoated shields at the AVL 8-mode test conditions Figure 27: Pmax COV (averaged over the four cylinders) in the DI-NG engine using coated and uncoated shields at the AVL 8-mode test conditions
AVL 8 Mode - Average Ignition Delay by mode
0
0.2
0.4
0.6
0.8
1
1.2
1.4
1.6
0 1000 2000 3000 4000 5000
Speed [rpm]
Norm
aliz
ed Ig
nitio
n De
lay
UncoatedCoated
AVL 8 Mode - Average PMAX COV by mode
00.10.20.30.40.50.60.70.80.9
1
0 1000 2000 3000 4000 5000
Speed [rpm]
Norm
aliz
ed P
max
CO
V
UncoatedCoated
25
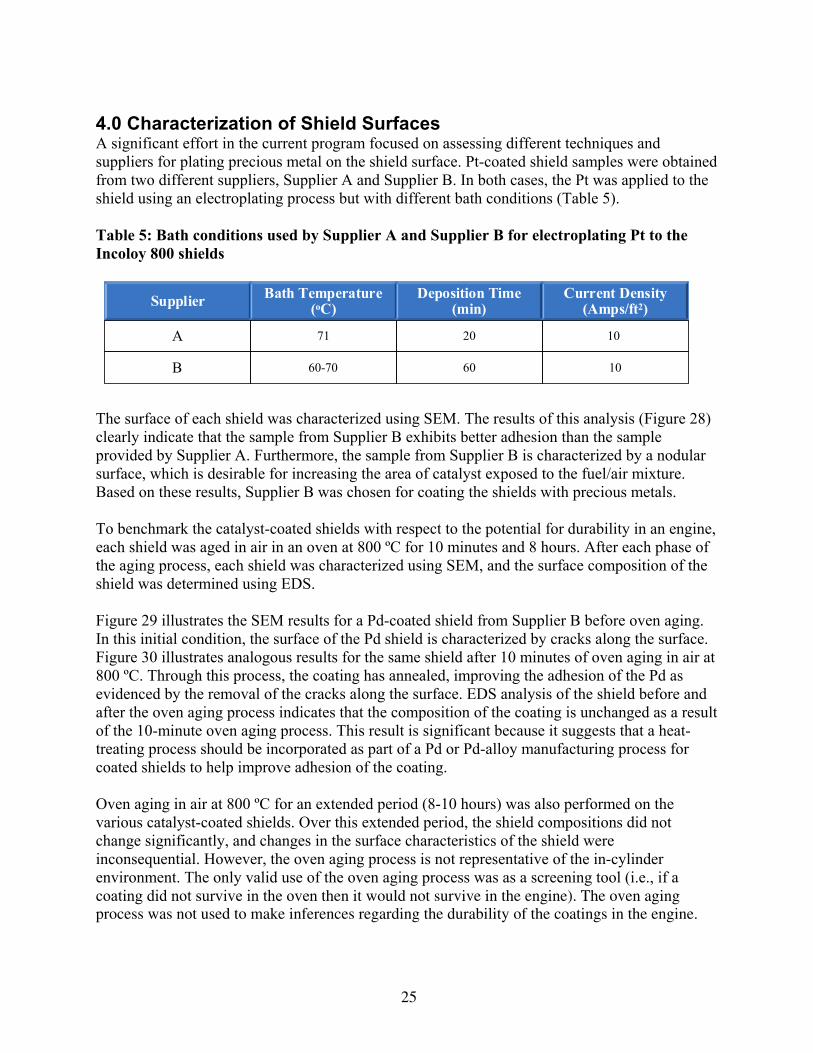
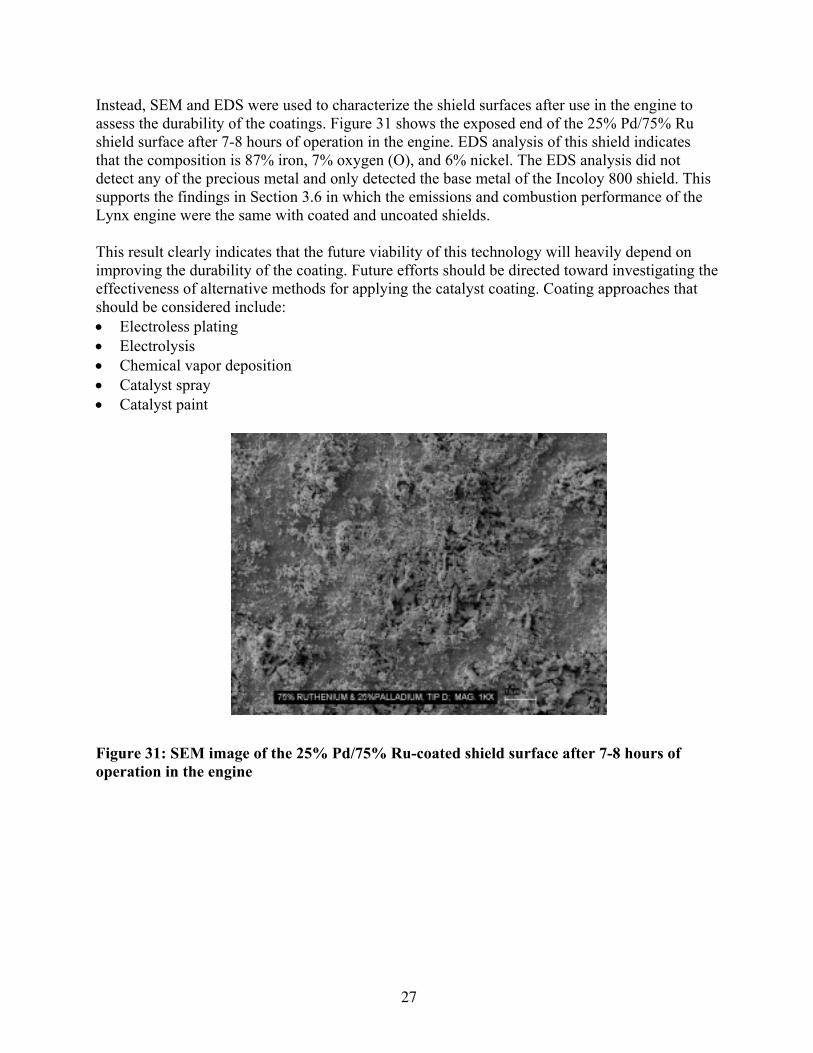
4.0 Characterization of Shield Surfaces A significant effort in the current program focused on assessing different techniques and suppliers for plating precious metal on the shield surface. Pt-coated shield samples were obtained from two different suppliers, Supplier A and Supplier B. In both cases, the Pt was applied to the shield using an electroplating process but with different bath conditions (Table 5). Table 5: Bath conditions used by Supplier A and Supplier B for electroplating Pt to the Incoloy 800 shields The surface of each shield was characterized using SEM. The results of this analysis (Figure 28) clearly indicate that the sample from Supplier B exhibits better adhesion than the sample provided by Supplier A. Furthermore, the sample from Supplier B is characterized by a nodular surface, which is desirable for increasing the area of catalyst exposed to the fuel/air mixture. Based on these results, Supplier B was chosen for coating the shields with precious metals. To benchmark the catalyst-coated shields with respect to the potential for durability in an engine, each shield was aged in air in an oven at 800 ºC for 10 minutes and 8 hours. After each phase of the aging process, each shield was characterized using SEM, and the surface composition of the shield was determined using EDS. Figure 29 illustrates the SEM results for a Pd-coated shield from Supplier B before oven aging. In this initial condition, the surface of the Pd shield is characterized by cracks along the surface. Figure 30 illustrates analogous results for the same shield after 10 minutes of oven aging in air at 800 ºC. Through this process, the coating has annealed, improving the adhesion of the Pd as evidenced by the removal of the cracks along the surface. EDS analysis of the shield before and after the oven aging process indicates that the composition of the coating is unchanged as a result of the 10-minute oven aging process. This result is significant because it suggests that a heat-treating process should be incorporated as part of a Pd or Pd-alloy manufacturing process for coated shields to help improve adhesion of the coating. Oven aging in air at 800 ºC for an extended period (8-10 hours) was also performed on the various catalyst-coated shields. Over this extended period, the shield compositions did not change significantly, and changes in the surface characteristics of the shield were inconsequential. However, the oven aging process is not representative of the in-cylinder environment. The only valid use of the oven aging process was as a screening tool (i.e., if a coating did not survive in the oven then it would not survive in the engine). The oven aging process was not used to make inferences regarding the durability of the coatings in the engine.
Supplier Bath Temperature(oC)
Deposition Time(min)
Current Density(Amps/ft2)
A 71 20 10
B 60-70 60 10
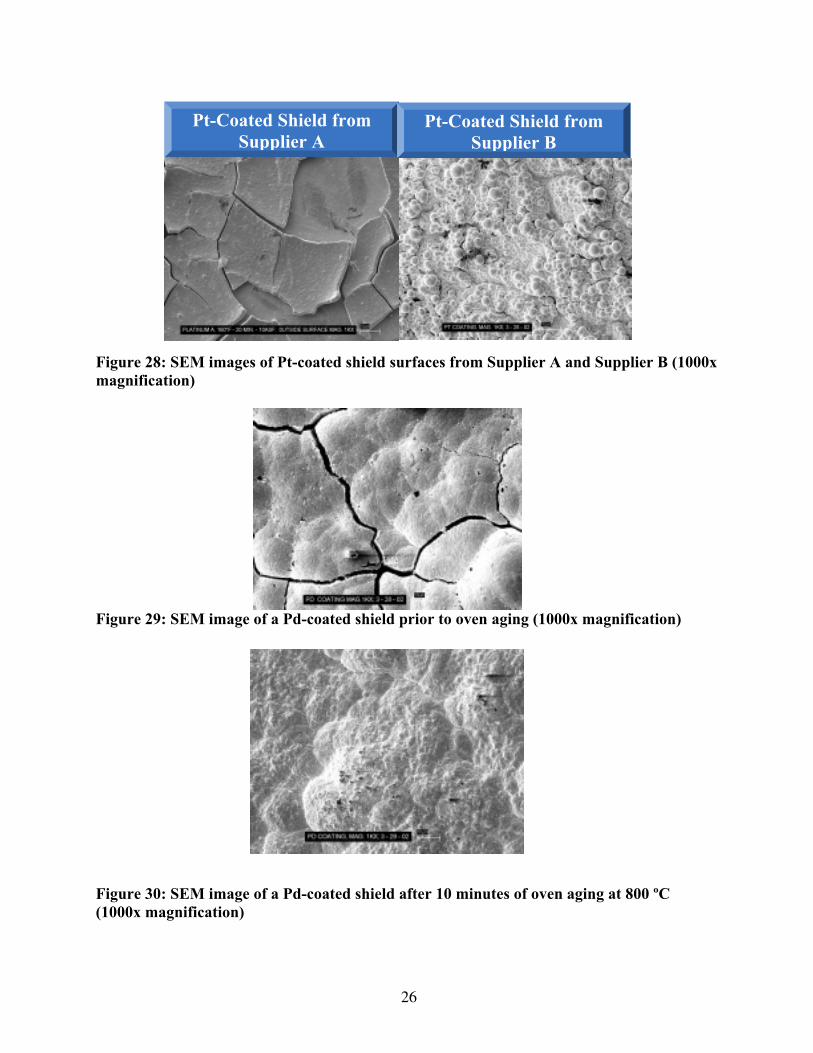
26
Figure 28: SEM images of Pt-coated shield surfaces from Supplier A and Supplier B (1000x magnification) Figure 29: SEM image of a Pd-coated shield prior to oven aging (1000x magnification) Figure 30: SEM image of a Pd-coated shield after 10 minutes of oven aging at 800 ºC (1000x magnification)
Pt-Coated Shield from Supplier A
Pt-Coated Shield from Supplier B
27
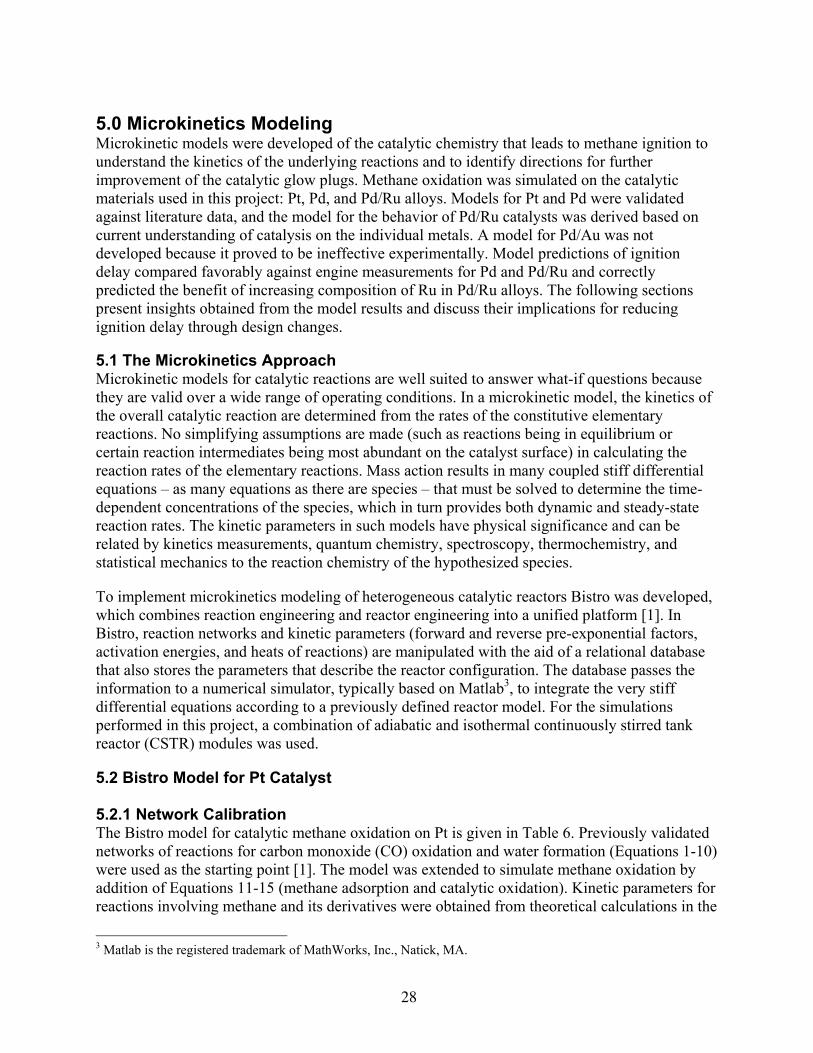
Instead, SEM and EDS were used to characterize the shield surfaces after use in the engine to assess the durability of the coatings. Figure 31 shows the exposed end of the 25% Pd/75% Ru shield surface after 7-8 hours of operation in the engine. EDS analysis of this shield indicates that the composition is 87% iron, 7% oxygen (O), and 6% nickel. The EDS analysis did not detect any of the precious metal and only detected the base metal of the Incoloy 800 shield. This supports the findings in Section 3.6 in which the emissions and combustion performance of the Lynx engine were the same with coated and uncoated shields. This result clearly indicates that the future viability of this technology will heavily depend on improving the durability of the coating. Future efforts should be directed toward investigating the effectiveness of alternative methods for applying the catalyst coating. Coating approaches that should be considered include: • Electroless plating • Electrolysis • Chemical vapor deposition • Catalyst spray • Catalyst paint Figure 31: SEM image of the 25% Pd/75% Ru-coated shield surface after 7-8 hours of operation in the engine
28
5.0 Microkinetics Modeling Microkinetic models were developed of the catalytic chemistry that leads to methane ignition to understand the kinetics of the underlying reactions and to identify directions for further improvement of the catalytic glow plugs. Methane oxidation was simulated on the catalytic materials used in this project: Pt, Pd, and Pd/Ru alloys. Models for Pt and Pd were validated against literature data, and the model for the behavior of Pd/Ru catalysts was derived based on current understanding of catalysis on the individual metals. A model for Pd/Au was not developed because it proved to be ineffective experimentally. Model predictions of ignition delay compared favorably against engine measurements for Pd and Pd/Ru and correctly predicted the benefit of increasing composition of Ru in Pd/Ru alloys. The following sections present insights obtained from the model results and discuss their implications for reducing ignition delay through design changes. 5.1 The Microkinetics Approach Microkinetic models for catalytic reactions are well suited to answer what-if questions because they are valid over a wide range of operating conditions. In a microkinetic model, the kinetics of the overall catalytic reaction are determined from the rates of the constitutive elementary reactions. No simplifying assumptions are made (such as reactions being in equilibrium or certain reaction intermediates being most abundant on the catalyst surface) in calculating the reaction rates of the elementary reactions. Mass action results in many coupled stiff differential equations – as many equations as there are species – that must be solved to determine the time-dependent concentrations of the species, which in turn provides both dynamic and steady-state reaction rates. The kinetic parameters in such models have physical significance and can be related by kinetics measurements, quantum chemistry, spectroscopy, thermochemistry, and statistical mechanics to the reaction chemistry of the hypothesized species.
To implement microkinetics modeling of heterogeneous catalytic reactors Bistro was developed, which combines reaction engineering and reactor engineering into a unified platform [1]. In Bistro, reaction networks and kinetic parameters (forward and reverse pre-exponential factors, activation energies, and heats of reactions) are manipulated with the aid of a relational database that also stores the parameters that describe the reactor configuration. The database passes the information to a numerical simulator, typically based on Matlab3, to integrate the very stiff differential equations according to a previously defined reactor model. For the simulations performed in this project, a combination of adiabatic and isothermal continuously stirred tank reactor (CSTR) modules was used.
5.2 Bistro Model for Pt Catalyst 5.2.1 Network Calibration The Bistro model for catalytic methane oxidation on Pt is given in Table 6. Previously validated networks of reactions for carbon monoxide (CO) oxidation and water formation (Equations 1-10) were used as the starting point [1]. The model was extended to simulate methane oxidation by addition of Equations 11-15 (methane adsorption and catalytic oxidation). Kinetic parameters for reactions involving methane and its derivatives were obtained from theoretical calculations in the
3 Matlab is the registered trademark of MathWorks, Inc., Natick, MA.
29
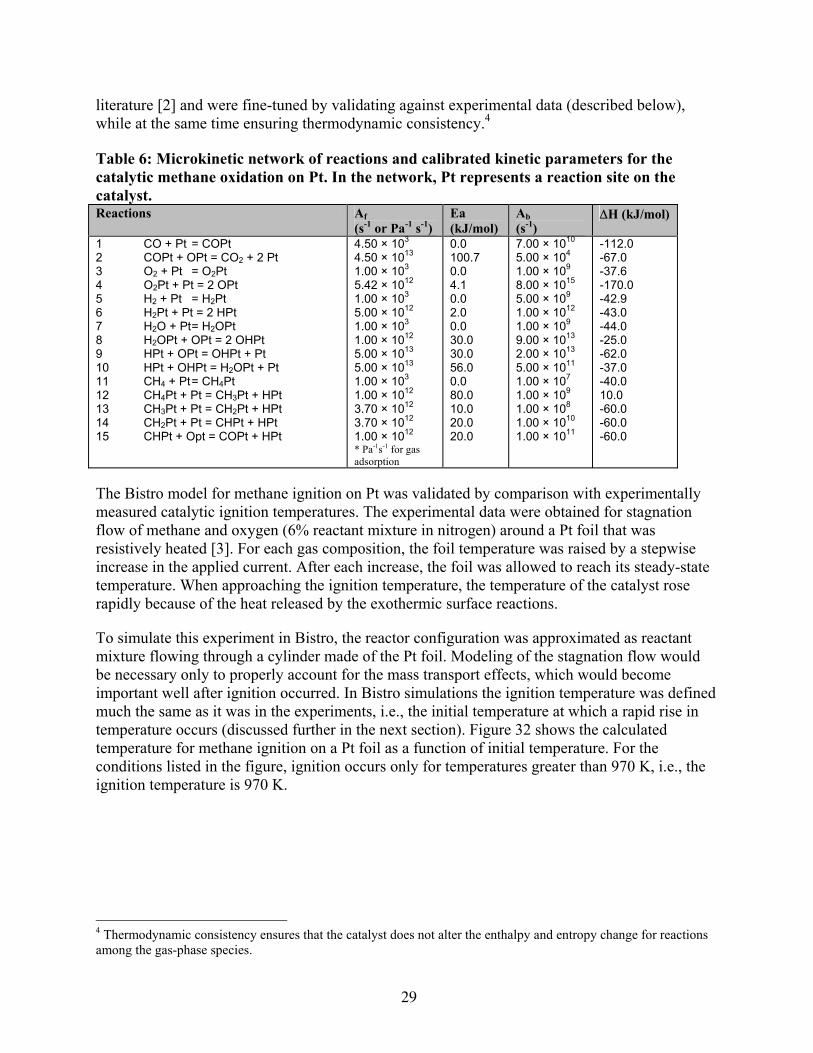
literature [2] and were fine-tuned by validating against experimental data (described below), while at the same time ensuring thermodynamic consistency.4 Table 6: Microkinetic network of reactions and calibrated kinetic parameters for the catalytic methane oxidation on Pt. In the network, Pt represents a reaction site on the catalyst. Reactions Af
(s-1 or Pa-1 s-1) Ea (kJ/mol)
Ab (s-1)
∆H (kJ/mol)
1 CO + Pt = COPt 2 COPt + OPt = CO2 + 2 Pt 3 O2 + Pt = O2Pt 4 O2Pt + Pt = 2 OPt 5 H2 + Pt = H2Pt 6 H2Pt + Pt = 2 HPt 7 H2O + Pt = H2OPt 8 H2OPt + OPt = 2 OHPt 9 HPt + OPt = OHPt + Pt 10 HPt + OHPt = H2OPt + Pt 11 CH4 + Pt = CH4Pt 12 CH4Pt + Pt = CH3Pt + HPt 13 CH3Pt + Pt = CH2Pt + HPt 14 CH2Pt + Pt = CHPt + HPt 15 CHPt + Opt = COPt + HPt
4.50 × 10³ 4.50 × 10¹³ 1.00 × 10³ 5.42 × 10¹² 1.00 × 10³ 5.00 × 10¹² 1.00 × 10³ 1.00 × 10¹² 5.00 × 10¹³ 5.00 × 10¹³ 1.00 × 10³ 1.00 × 10¹² 3.70 × 10¹² 3.70 × 10¹² 1.00 × 10¹² * Pa-1s-1 for gas adsorption
0.0 100.7 0.0 4.1 0.0 2.0 0.0 30.0 30.0 56.0 0.0 80.0 10.0 20.0 20.0
7.00 × 10¹⁰ 5.00 × 10⁴ 1.00 × 10⁹ 8.00 × 10¹⁵ 5.00 × 10⁹ 1.00 × 10¹² 1.00 × 10⁹ 9.00 × 10¹³ 2.00 × 10¹³ 5.00 × 10¹¹ 1.00 × 10⁷ 1.00 × 10⁹ 1.00 × 10⁸ 1.00 × 10¹⁰ 1.00 × 10¹¹
-112.0 -67.0 -37.6 -170.0 -42.9 -43.0 -44.0 -25.0 -62.0 -37.0 -40.0 10.0 -60.0 -60.0 -60.0
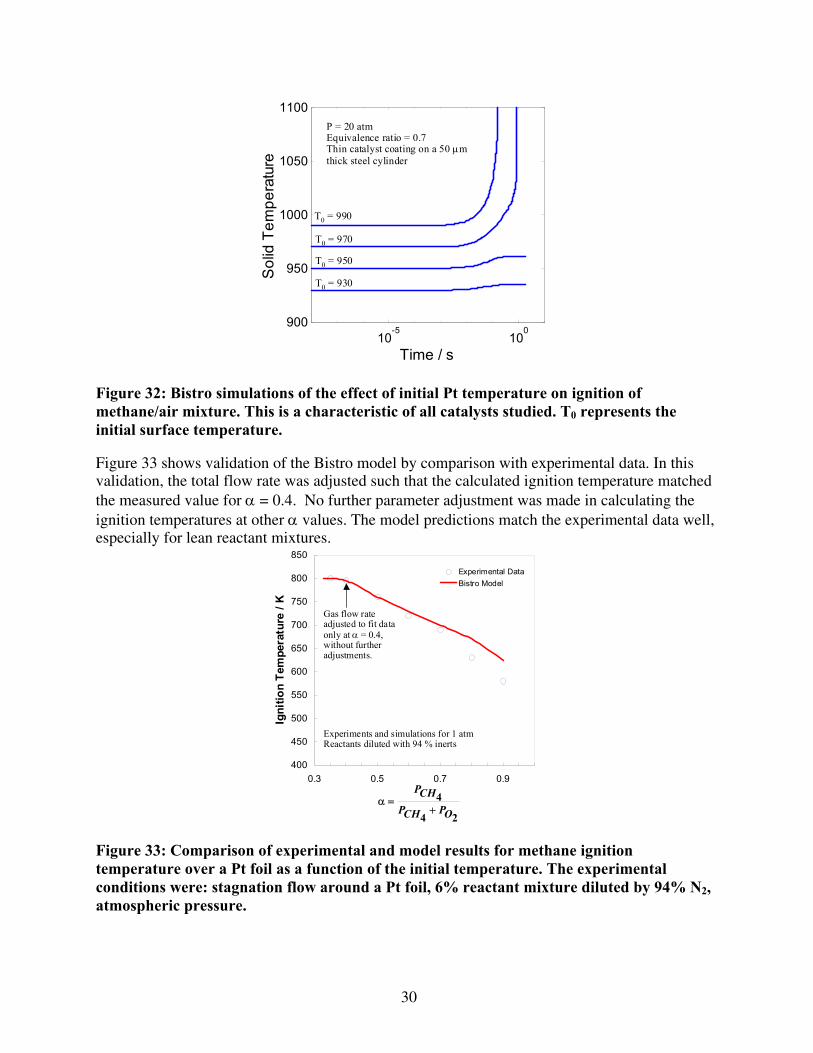
The Bistro model for methane ignition on Pt was validated by comparison with experimentally measured catalytic ignition temperatures. The experimental data were obtained for stagnation flow of methane and oxygen (6% reactant mixture in nitrogen) around a Pt foil that was resistively heated [3]. For each gas composition, the foil temperature was raised by a stepwise increase in the applied current. After each increase, the foil was allowed to reach its steady-state temperature. When approaching the ignition temperature, the temperature of the catalyst rose rapidly because of the heat released by the exothermic surface reactions.
To simulate this experiment in Bistro, the reactor configuration was approximated as reactant mixture flowing through a cylinder made of the Pt foil. Modeling of the stagnation flow would be necessary only to properly account for the mass transport effects, which would become important well after ignition occurred. In Bistro simulations the ignition temperature was defined much the same as it was in the experiments, i.e., the initial temperature at which a rapid rise in temperature occurs (discussed further in the next section). Figure 32 shows the calculated temperature for methane ignition on a Pt foil as a function of initial temperature. For the conditions listed in the figure, ignition occurs only for temperatures greater than 970 K, i.e., the ignition temperature is 970 K.
4 Thermodynamic consistency ensures that the catalyst does not alter the enthalpy and entropy change for reactions among the gas-phase species.
30
10-5
100
900
950
1000
1050
1100
Time / s
Sol
id T
empe
ratu
re
P = 20 atmEquivalence ratio = 0.7Thin catalyst coating on a 50 µmthick steel cylinder
T0 = 930
T0 = 950
T0 = 970
T0 = 990
Figure 32: Bistro simulations of the effect of initial Pt temperature on ignition of methane/air mixture. This is a characteristic of all catalysts studied. T0 represents the initial surface temperature. Figure 33 shows validation of the Bistro model by comparison with experimental data. In this validation, the total flow rate was adjusted such that the calculated ignition temperature matched the measured value for α = 0.4. No further parameter adjustment was made in calculating the ignition temperatures at other α values. The model predictions match the experimental data well, especially for lean reactant mixtures.
400
450
500
550
600
650
700
750
800
850
0.3 0.5 0.7 0.9
Igni
tion
Tem
pera
ture
/ K
Experimental DataBistro Model
24
4OPCHP
CHP
+=α
Experiments and simulations for 1 atmReactants diluted with 94 % inerts
Gas flow rateadjusted to fit dataonly at α = 0.4,without furtheradjustments.
Figure 33: Comparison of experimental and model results for methane ignition temperature over a Pt foil as a function of the initial temperature. The experimental conditions were: stagnation flow around a Pt foil, 6% reactant mixture diluted by 94% N2, atmospheric pressure.
31
5.2.2 Sensitivity Analysis The validated model for oxidation on Pt was used to gain insight into the factors that influence the catalytic and ignition behavior.
5.2.2.1 Rate Controlling Steps A modification of the concept of the ‘degree of rate control’ proposed by Campbell [4] helps understand how the different reactions in the network control the observed temperature rise of the catalytic foil. Essentially, the effect (ξΗ
i) of each reaction (j) on the rate of heat release (∆H) can be quantified according to:
∂∆∂
∆=
jkH
Hjk
Hiξ
Where kj is the rate constant for the reverse direction of reaction j. Note that a positive value of ξI
implies that decreasing the rate of the reverse direction of reaction j increases the heat release. Likewise, a negative value of ξI implies that increasing the rate of the reverse direction of reaction j increases the rate of heat release.
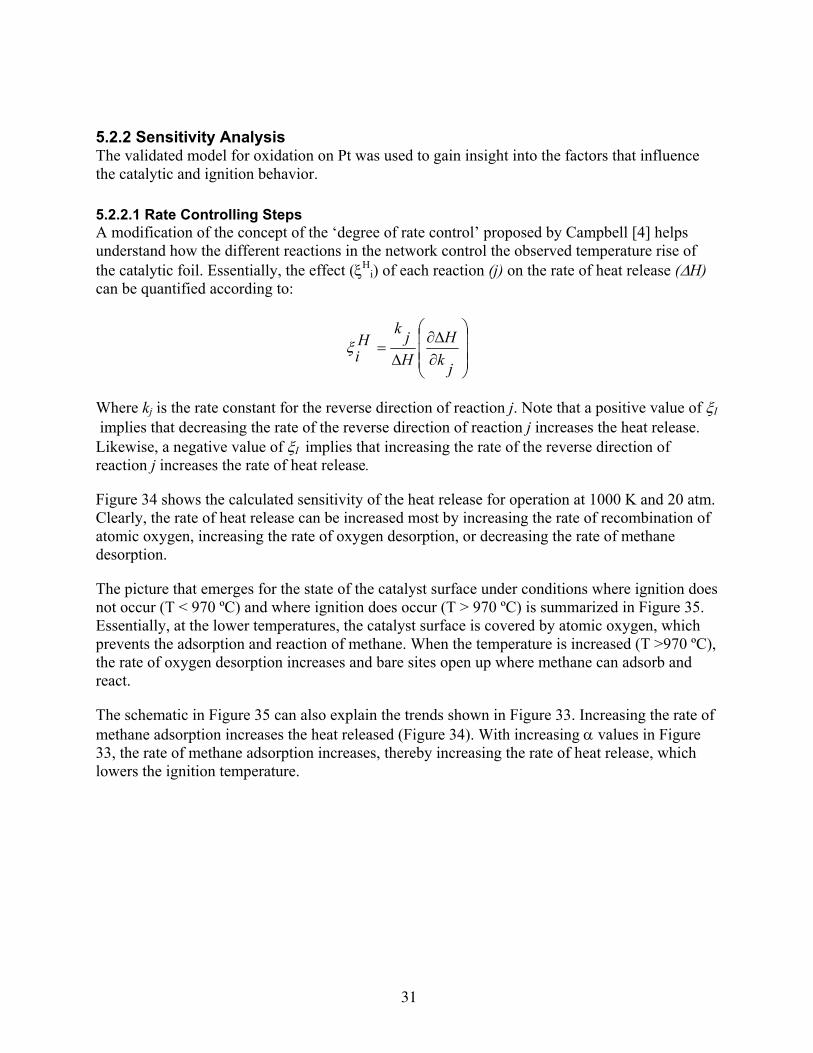
Figure 34 shows the calculated sensitivity of the heat release for operation at 1000 K and 20 atm. Clearly, the rate of heat release can be increased most by increasing the rate of recombination of atomic oxygen, increasing the rate of oxygen desorption, or decreasing the rate of methane desorption.
The picture that emerges for the state of the catalyst surface under conditions where ignition does not occur (T < 970 ºC) and where ignition does occur (T > 970 ºC) is summarized in Figure 35. Essentially, at the lower temperatures, the catalyst surface is covered by atomic oxygen, which prevents the adsorption and reaction of methane. When the temperature is increased (T >970 ºC), the rate of oxygen desorption increases and bare sites open up where methane can adsorb and react.
The schematic in Figure 35 can also explain the trends shown in Figure 33. Increasing the rate of methane adsorption increases the heat released (Figure 34). With increasing α values in Figure 33, the rate of methane adsorption increases, thereby increasing the rate of heat release, which lowers the ignition temperature.
32
-0.4
-0.2
0
0.2
0.4
0.6
CH4 + Pt = CH4Pt
CH4Pt + Pt = CH3Pt + HPt
CH3Pt + Pt = CH2Pt + HPt
CH3Pt + Pt = CH2Pt + HPt
CH2Pt + Pt = CHPt + HPt
CHPt + OPt = COPt + HPt
COPt + OPt = CO2 + 2Pt
O2 + Pt = O2Pt
O2Pt + Pt =2OPt
H2 + Pt =H2Pt
H2Pt + Pt =2HPt
H2O + Pt =H2OPt
H2OPt + OPt =2OHPt
HPt + OPt =OHPt + Pt
HPt + OHPt =H2OPt + Pt
Hiξ
Figure 34: Sensitivity of the heat release to the reverse rate of the different reactions. Operating conditions for this analysis were 1000 K and 20 atm.
Pt Metal
O O O O O O
CH4 + O2 CH4 + O2
O O CHx CO2
CH4 + O2 CO2 + H2O
Pt Metal
T << Ignition T >Ignition
Figure 35: Schematic describing the state of the Pt catalyst surface at two different temperatures for the conditions given in Figure 33. Operating above the ignition temperature creates open surface sites, which allow methane to adsorb and react with oxygen on the catalyst surface.
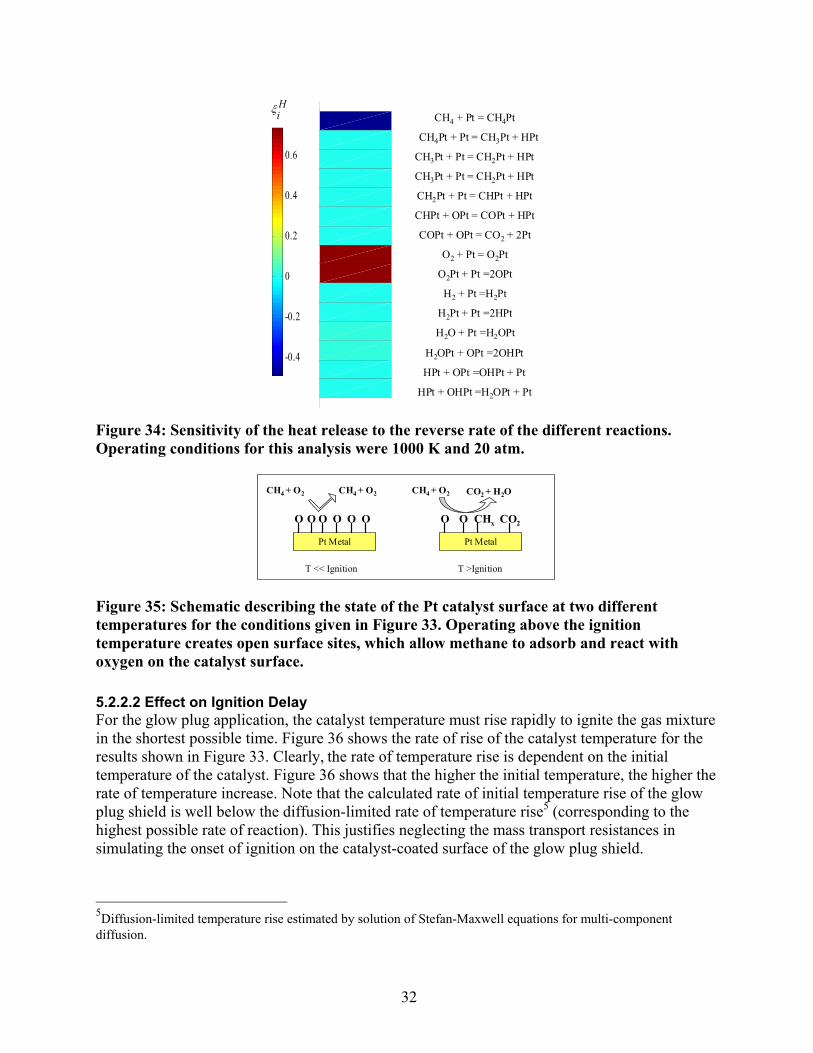
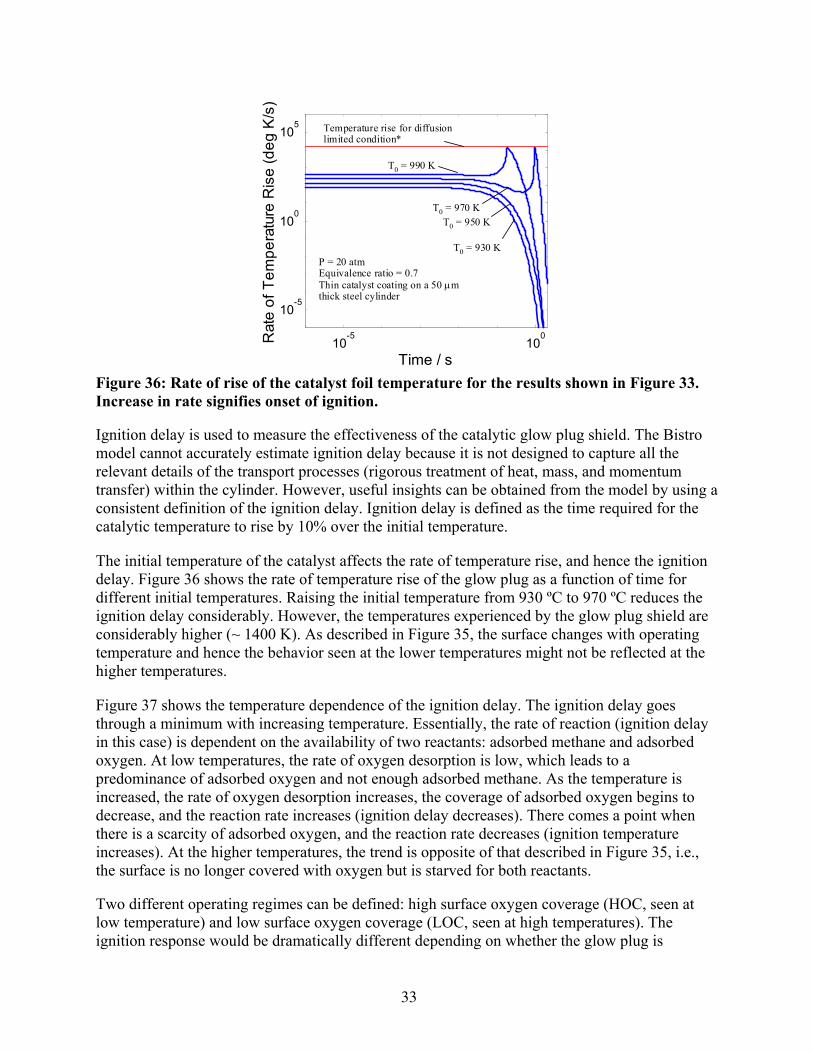
5.2.2.2 Effect on Ignition Delay For the glow plug application, the catalyst temperature must rise rapidly to ignite the gas mixture in the shortest possible time. Figure 36 shows the rate of rise of the catalyst temperature for the results shown in Figure 33. Clearly, the rate of temperature rise is dependent on the initial temperature of the catalyst. Figure 36 shows that the higher the initial temperature, the higher the rate of temperature increase. Note that the calculated rate of initial temperature rise of the glow plug shield is well below the diffusion-limited rate of temperature rise5 (corresponding to the highest possible rate of reaction). This justifies neglecting the mass transport resistances in simulating the onset of ignition on the catalyst-coated surface of the glow plug shield.
5Diffusion-limited temperature rise estimated by solution of Stefan-Maxwell equations for multi-component diffusion.
33
10-5
100
10-5
100
105
Time / s
Rat
e of
Tem
pera
ture
Ris
e (d
eg K
/s)
P = 20 atmEquivalence ratio = 0.7Thin catalyst coating on a 50 µmthick steel cylinder
Temperature rise for diffusionlimited condition*
T0 = 930 K
T0 = 950 K
T0 = 990 K
T0 = 970 K
Figure 36: Rate of rise of the catalyst foil temperature for the results shown in Figure 33. Increase in rate signifies onset of ignition. Ignition delay is used to measure the effectiveness of the catalytic glow plug shield. The Bistro model cannot accurately estimate ignition delay because it is not designed to capture all the relevant details of the transport processes (rigorous treatment of heat, mass, and momentum transfer) within the cylinder. However, useful insights can be obtained from the model by using a consistent definition of the ignition delay. Ignition delay is defined as the time required for the catalytic temperature to rise by 10% over the initial temperature.
The initial temperature of the catalyst affects the rate of temperature rise, and hence the ignition delay. Figure 36 shows the rate of temperature rise of the glow plug as a function of time for different initial temperatures. Raising the initial temperature from 930 ºC to 970 ºC reduces the ignition delay considerably. However, the temperatures experienced by the glow plug shield are considerably higher (~ 1400 K). As described in Figure 35, the surface changes with operating temperature and hence the behavior seen at the lower temperatures might not be reflected at the higher temperatures.
Figure 37 shows the temperature dependence of the ignition delay. The ignition delay goes through a minimum with increasing temperature. Essentially, the rate of reaction (ignition delay in this case) is dependent on the availability of two reactants: adsorbed methane and adsorbed oxygen. At low temperatures, the rate of oxygen desorption is low, which leads to a predominance of adsorbed oxygen and not enough adsorbed methane. As the temperature is increased, the rate of oxygen desorption increases, the coverage of adsorbed oxygen begins to decrease, and the reaction rate increases (ignition delay decreases). There comes a point when there is a scarcity of adsorbed oxygen, and the reaction rate decreases (ignition temperature increases). At the higher temperatures, the trend is opposite of that described in Figure 35, i.e., the surface is no longer covered with oxygen but is starved for both reactants. Two different operating regimes can be defined: high surface oxygen coverage (HOC, seen at low temperature) and low surface oxygen coverage (LOC, seen at high temperatures). The ignition response would be dramatically different depending on whether the glow plug is
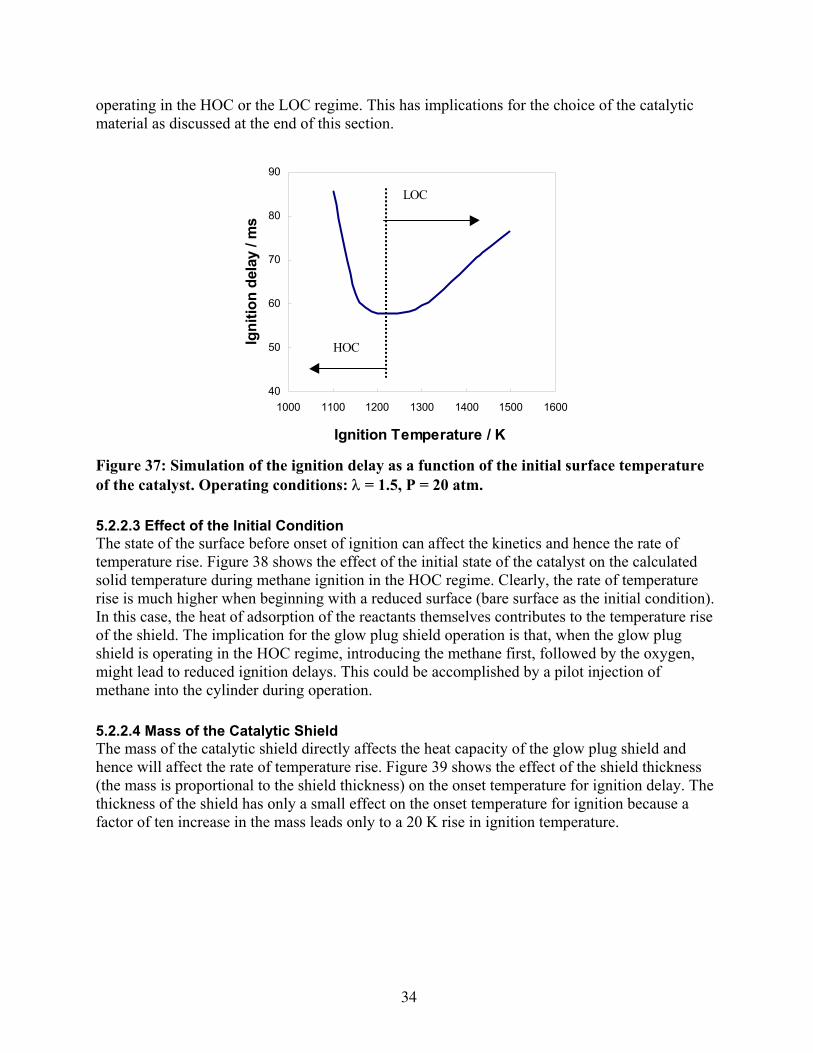
34
operating in the HOC or the LOC regime. This has implications for the choice of the catalytic material as discussed at the end of this section.
40
50
60
70
80
90
1000 1100 1200 1300 1400 1500 1600
Ignition Temperature / K
Igni
tion
dela
y / m
s
HOC
LOC
Figure 37: Simulation of the ignition delay as a function of the initial surface temperature of the catalyst. Operating conditions: λ = 1.5, P = 20 atm.
5.2.2.3 Effect of the Initial Condition The state of the surface before onset of ignition can affect the kinetics and hence the rate of temperature rise. Figure 38 shows the effect of the initial state of the catalyst on the calculated solid temperature during methane ignition in the HOC regime. Clearly, the rate of temperature rise is much higher when beginning with a reduced surface (bare surface as the initial condition). In this case, the heat of adsorption of the reactants themselves contributes to the temperature rise of the shield. The implication for the glow plug shield operation is that, when the glow plug shield is operating in the HOC regime, introducing the methane first, followed by the oxygen, might lead to reduced ignition delays. This could be accomplished by a pilot injection of methane into the cylinder during operation.
5.2.2.4 Mass of the Catalytic Shield The mass of the catalytic shield directly affects the heat capacity of the glow plug shield and hence will affect the rate of temperature rise. Figure 39 shows the effect of the shield thickness (the mass is proportional to the shield thickness) on the onset temperature for ignition delay. The thickness of the shield has only a small effect on the onset temperature for ignition because a factor of ten increase in the mass leads only to a 20 K rise in ignition temperature.
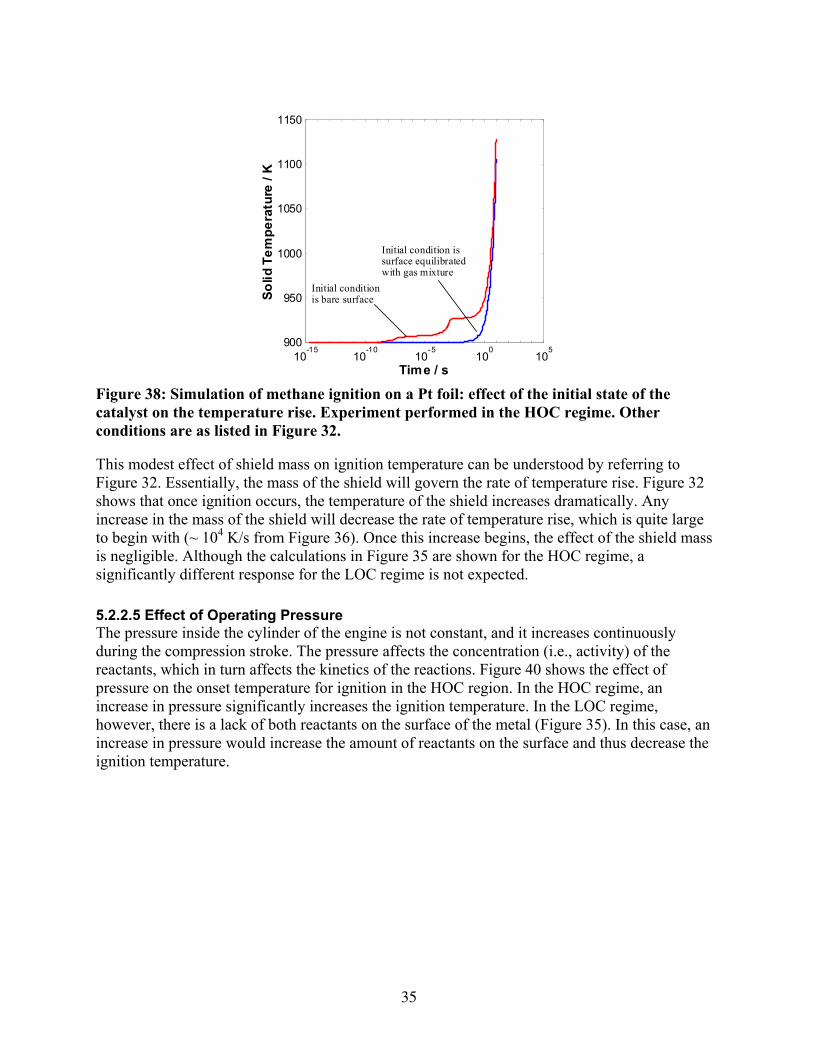
35
10-15
10-10
10-5
100
105
900
950
1000
1050
1100
1150
Time / s
Solid
Tem
pera
ture
/ K
Initial conditionis bare surface
Initial condition issurface equilibratedwith gas mixture
Figure 38: Simulation of methane ignition on a Pt foil: effect of the initial state of the catalyst on the temperature rise. Experiment performed in the HOC regime. Other conditions are as listed in Figure 32. This modest effect of shield mass on ignition temperature can be understood by referring to Figure 32. Essentially, the mass of the shield will govern the rate of temperature rise. Figure 32 shows that once ignition occurs, the temperature of the shield increases dramatically. Any increase in the mass of the shield will decrease the rate of temperature rise, which is quite large to begin with (~ 104 K/s from Figure 36). Once this increase begins, the effect of the shield mass is negligible. Although the calculations in Figure 35 are shown for the HOC regime, a significantly different response for the LOC regime is not expected.
5.2.2.5 Effect of Operating Pressure The pressure inside the cylinder of the engine is not constant, and it increases continuously during the compression stroke. The pressure affects the concentration (i.e., activity) of the reactants, which in turn affects the kinetics of the reactions. Figure 40 shows the effect of pressure on the onset temperature for ignition in the HOC region. In the HOC regime, an increase in pressure significantly increases the ignition temperature. In the LOC regime, however, there is a lack of both reactants on the surface of the metal (Figure 35). In this case, an increase in pressure would increase the amount of reactants on the surface and thus decrease the ignition temperature.
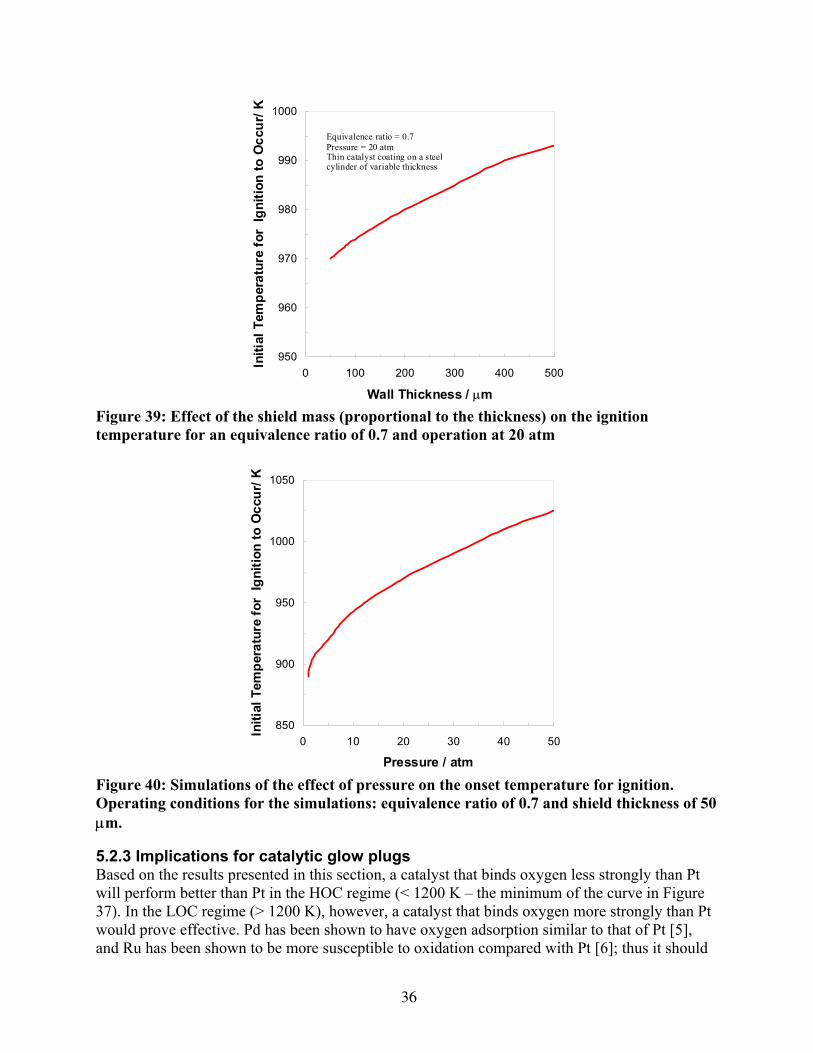
36
950
960
970
980
990
1000
0 100 200 300 400 500
Wall Thickness / µm
Initi
al T
empe
ratu
re fo
r Ig
nitio
n to
Occ
ur/ K
Equivalence ratio = 0.7Pressure = 20 atmThin catalyst coating on a steelcylinder of variable thickness
Figure 39: Effect of the shield mass (proportional to the thickness) on the ignition temperature for an equivalence ratio of 0.7 and operation at 20 atm
850
900
950
1000
1050
0 10 20 30 40 50
Pressure / atm
Initi
al T
empe
ratu
re fo
r Ig
nitio
n to
Occ
ur/ K
Figure 40: Simulations of the effect of pressure on the onset temperature for ignition. Operating conditions for the simulations: equivalence ratio of 0.7 and shield thickness of 50 µm. 5.2.3 Implications for catalytic glow plugs Based on the results presented in this section, a catalyst that binds oxygen less strongly than Pt will perform better than Pt in the HOC regime (< 1200 K – the minimum of the curve in Figure 37). In the LOC regime (> 1200 K), however, a catalyst that binds oxygen more strongly than Pt would prove effective. Pd has been shown to have oxygen adsorption similar to that of Pt [5], and Ru has been shown to be more susceptible to oxidation compared with Pt [6]; thus it should
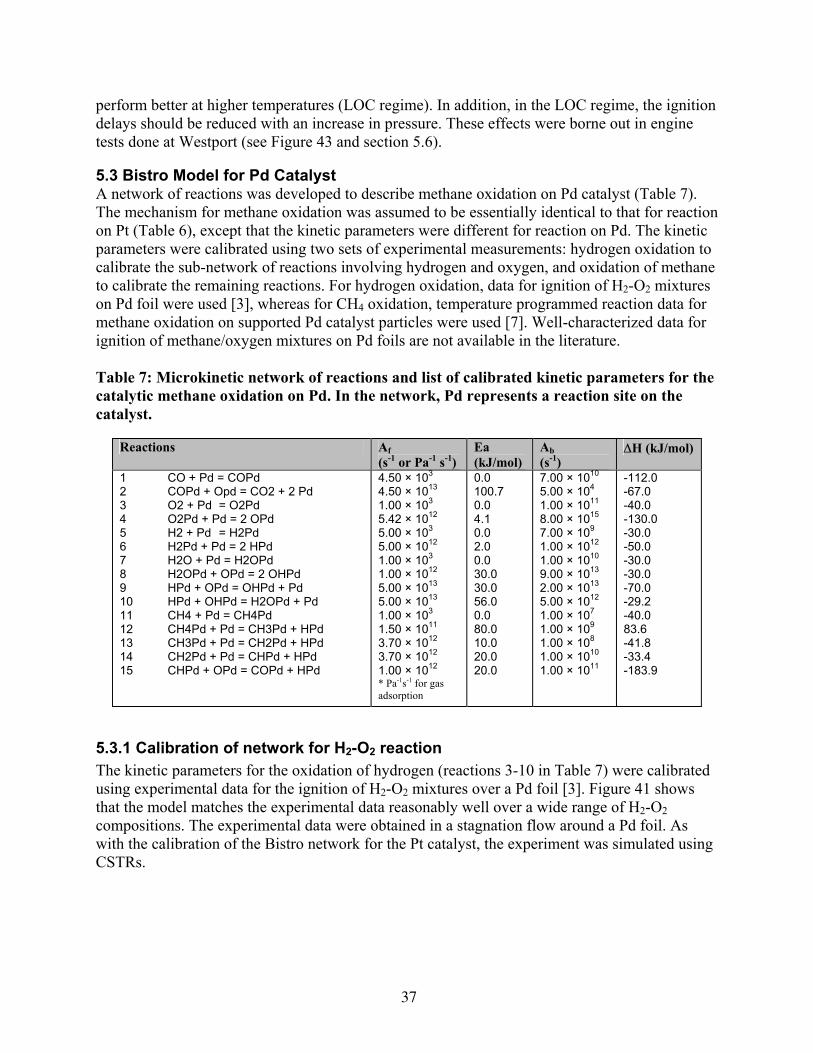
37
perform better at higher temperatures (LOC regime). In addition, in the LOC regime, the ignition delays should be reduced with an increase in pressure. These effects were borne out in engine tests done at Westport (see Figure 43 and section 5.6). 5.3 Bistro Model for Pd Catalyst A network of reactions was developed to describe methane oxidation on Pd catalyst (Table 7). The mechanism for methane oxidation was assumed to be essentially identical to that for reaction on Pt (Table 6), except that the kinetic parameters were different for reaction on Pd. The kinetic parameters were calibrated using two sets of experimental measurements: hydrogen oxidation to calibrate the sub-network of reactions involving hydrogen and oxygen, and oxidation of methane to calibrate the remaining reactions. For hydrogen oxidation, data for ignition of H2-O2 mixtures on Pd foil were used [3], whereas for CH4 oxidation, temperature programmed reaction data for methane oxidation on supported Pd catalyst particles were used [7]. Well-characterized data for ignition of methane/oxygen mixtures on Pd foils are not available in the literature. Table 7: Microkinetic network of reactions and list of calibrated kinetic parameters for the catalytic methane oxidation on Pd. In the network, Pd represents a reaction site on the catalyst.
Reactions Af (s-1 or Pa-1 s-1)
Ea (kJ/mol)
Ab (s-1)
∆H (kJ/mol)
1 CO + Pd = COPd 2 COPd + Opd = CO2 + 2 Pd 3 O2 + Pd = O2Pd 4 O2Pd + Pd = 2 OPd 5 H2 + Pd = H2Pd 6 H2Pd + Pd = 2 HPd 7 H2O + Pd = H2OPd 8 H2OPd + OPd = 2 OHPd 9 HPd + OPd = OHPd + Pd 10 HPd + OHPd = H2OPd + Pd 11 CH4 + Pd = CH4Pd 12 CH4Pd + Pd = CH3Pd + HPd 13 CH3Pd + Pd = CH2Pd + HPd 14 CH2Pd + Pd = CHPd + HPd 15 CHPd + OPd = COPd + HPd
4.50 × 10³ 4.50 × 10¹³ 1.00 × 10³ 5.42 × 10¹² 5.00 × 10³ 5.00 × 10¹² 1.00 × 10³ 1.00 × 10¹² 5.00 × 10¹³ 5.00 × 10¹³ 1.00 × 10³ 1.50 × 10¹¹ 3.70 × 10¹² 3.70 × 10¹² 1.00 × 10¹² * Pa-1s-1 for gas adsorption
0.0 100.7 0.0 4.1 0.0 2.0 0.0 30.0 30.0 56.0 0.0 80.0 10.0 20.0 20.0
7.00 × 10¹⁰ 5.00 × 10⁴ 1.00 × 10¹¹ 8.00 × 10¹⁵ 7.00 × 10⁹ 1.00 × 10¹² 1.00 × 10¹⁰ 9.00 × 10¹³ 2.00 × 10¹³ 5.00 × 10¹² 1.00 × 10⁷ 1.00 × 10⁹ 1.00 × 10⁸ 1.00 × 10¹⁰ 1.00 × 10¹¹
-112.0 -67.0 -40.0 -130.0 -30.0 -50.0 -30.0 -30.0 -70.0 -29.2 -40.0 83.6 -41.8 -33.4 -183.9
5.3.1 Calibration of network for H2-O2 reaction The kinetic parameters for the oxidation of hydrogen (reactions 3-10 in Table 7) were calibrated using experimental data for the ignition of H2-O2 mixtures over a Pd foil [3]. Figure 41 shows that the model matches the experimental data reasonably well over a wide range of H2-O2 compositions. The experimental data were obtained in a stagnation flow around a Pd foil. As with the calibration of the Bistro network for the Pt catalyst, the experiment was simulated using CSTRs.
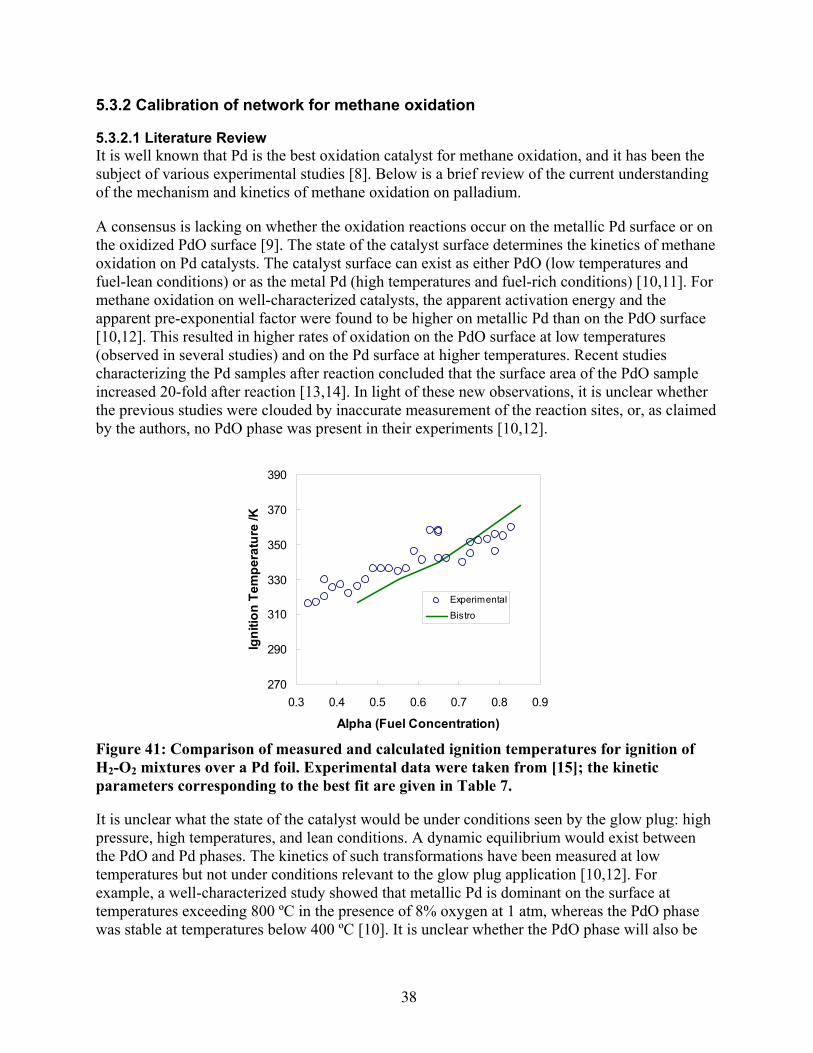
38
5.3.2 Calibration of network for methane oxidation 5.3.2.1 Literature Review It is well known that Pd is the best oxidation catalyst for methane oxidation, and it has been the subject of various experimental studies [8]. Below is a brief review of the current understanding of the mechanism and kinetics of methane oxidation on palladium.
A consensus is lacking on whether the oxidation reactions occur on the metallic Pd surface or on the oxidized PdO surface [9]. The state of the catalyst surface determines the kinetics of methane oxidation on Pd catalysts. The catalyst surface can exist as either PdO (low temperatures and fuel-lean conditions) or as the metal Pd (high temperatures and fuel-rich conditions) [10,11]. For methane oxidation on well-characterized catalysts, the apparent activation energy and the apparent pre-exponential factor were found to be higher on metallic Pd than on the PdO surface [10,12]. This resulted in higher rates of oxidation on the PdO surface at low temperatures (observed in several studies) and on the Pd surface at higher temperatures. Recent studies characterizing the Pd samples after reaction concluded that the surface area of the PdO sample increased 20-fold after reaction [13,14]. In light of these new observations, it is unclear whether the previous studies were clouded by inaccurate measurement of the reaction sites, or, as claimed by the authors, no PdO phase was present in their experiments [10,12].
270
290
310
330
350
370
390
0.3 0.4 0.5 0.6 0.7 0.8 0.9
Alpha (Fuel Concentration)
Igni
tion
Tem
pera
ture
/K
ExperimentalBistro
Figure 41: Comparison of measured and calculated ignition temperatures for ignition of H2-O2 mixtures over a Pd foil. Experimental data were taken from [15]; the kinetic parameters corresponding to the best fit are given in Table 7. It is unclear what the state of the catalyst would be under conditions seen by the glow plug: high pressure, high temperatures, and lean conditions. A dynamic equilibrium would exist between the PdO and Pd phases. The kinetics of such transformations have been measured at low temperatures but not under conditions relevant to the glow plug application [10,12]. For example, a well-characterized study showed that metallic Pd is dominant on the surface at temperatures exceeding 800 ºC in the presence of 8% oxygen at 1 atm, whereas the PdO phase was stable at temperatures below 400 ºC [10]. It is unclear whether the PdO phase will also be
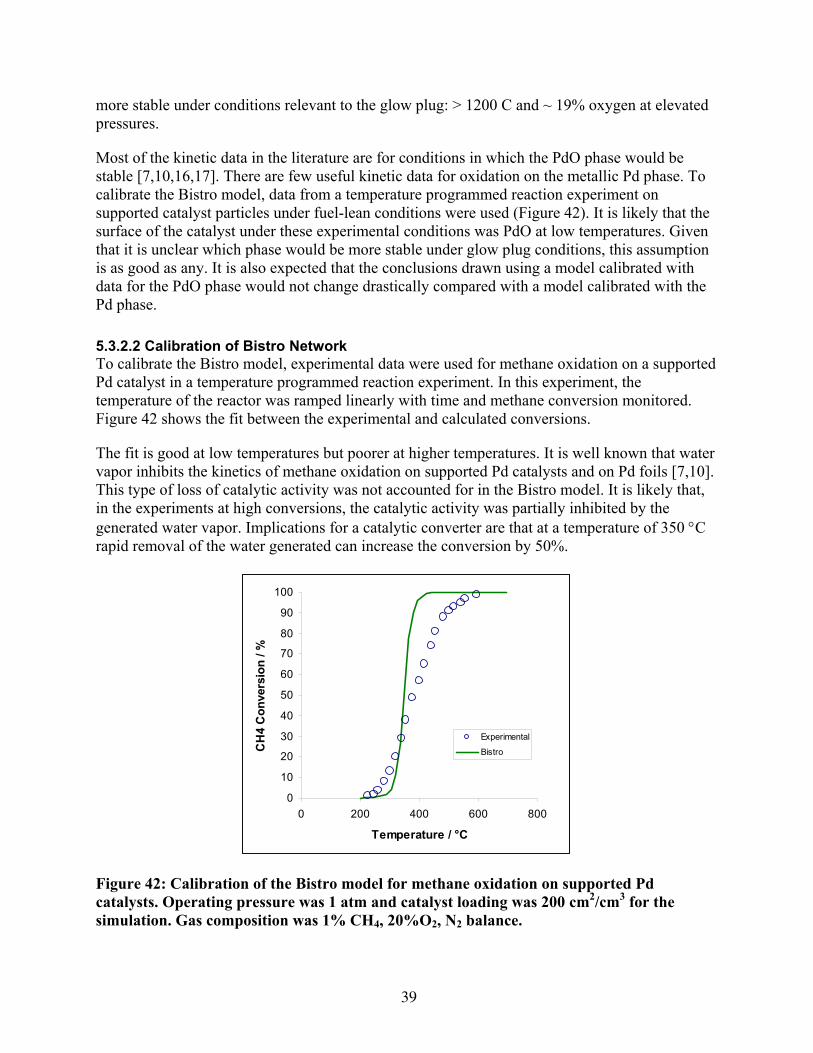
39
more stable under conditions relevant to the glow plug: > 1200 C and ~ 19% oxygen at elevated pressures.
Most of the kinetic data in the literature are for conditions in which the PdO phase would be stable [7,10,16,17]. There are few useful kinetic data for oxidation on the metallic Pd phase. To calibrate the Bistro model, data from a temperature programmed reaction experiment on supported catalyst particles under fuel-lean conditions were used (Figure 42). It is likely that the surface of the catalyst under these experimental conditions was PdO at low temperatures. Given that it is unclear which phase would be more stable under glow plug conditions, this assumption is as good as any. It is also expected that the conclusions drawn using a model calibrated with data for the PdO phase would not change drastically compared with a model calibrated with the Pd phase.
5.3.2.2 Calibration of Bistro Network To calibrate the Bistro model, experimental data were used for methane oxidation on a supported Pd catalyst in a temperature programmed reaction experiment. In this experiment, the temperature of the reactor was ramped linearly with time and methane conversion monitored. Figure 42 shows the fit between the experimental and calculated conversions.
The fit is good at low temperatures but poorer at higher temperatures. It is well known that water vapor inhibits the kinetics of methane oxidation on supported Pd catalysts and on Pd foils [7,10]. This type of loss of catalytic activity was not accounted for in the Bistro model. It is likely that, in the experiments at high conversions, the catalytic activity was partially inhibited by the generated water vapor. Implications for a catalytic converter are that at a temperature of 350 °C rapid removal of the water generated can increase the conversion by 50%.
0
10
20
30
40
50
60
70
80
90
100
0 200 400 600 800
Temperature / °C
CH
4 C
onve
rsio
n / %
Experimental
Bistro
Figure 42: Calibration of the Bistro model for methane oxidation on supported Pd catalysts. Operating pressure was 1 atm and catalyst loading was 200 cm2/cm3 for the simulation. Gas composition was 1% CH4, 20%O2, N2 balance.
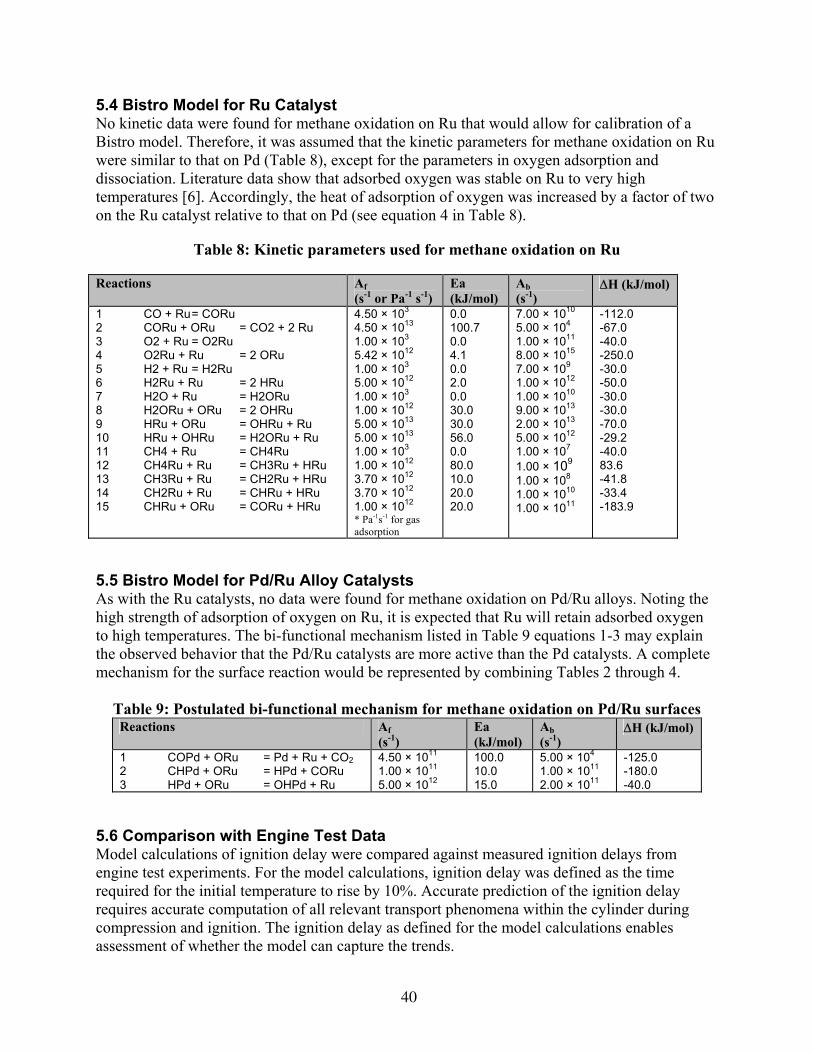
40
5.4 Bistro Model for Ru Catalyst No kinetic data were found for methane oxidation on Ru that would allow for calibration of a Bistro model. Therefore, it was assumed that the kinetic parameters for methane oxidation on Ru were similar to that on Pd (Table 8), except for the parameters in oxygen adsorption and dissociation. Literature data show that adsorbed oxygen was stable on Ru to very high temperatures [6]. Accordingly, the heat of adsorption of oxygen was increased by a factor of two on the Ru catalyst relative to that on Pd (see equation 4 in Table 8).
Table 8: Kinetic parameters used for methane oxidation on Ru
Reactions Af (s-1 or Pa-1 s-1)
Ea (kJ/mol)
Ab (s-1)
∆H (kJ/mol)
1 CO + Ru = CORu 2 CORu + ORu = CO2 + 2 Ru 3 O2 + Ru = O2Ru 4 O2Ru + Ru = 2 ORu 5 H2 + Ru = H2Ru 6 H2Ru + Ru = 2 HRu 7 H2O + Ru = H2ORu 8 H2ORu + ORu = 2 OHRu 9 HRu + ORu = OHRu + Ru 10 HRu + OHRu = H2ORu + Ru 11 CH4 + Ru = CH4Ru 12 CH4Ru + Ru = CH3Ru + HRu 13 CH3Ru + Ru = CH2Ru + HRu 14 CH2Ru + Ru = CHRu + HRu 15 CHRu + ORu = CORu + HRu
4.50 × 10³ 4.50 × 10¹³ 1.00 × 10³ 5.42 × 10¹² 1.00 × 10³ 5.00 × 10¹² 1.00 × 10³ 1.00 × 10¹² 5.00 × 10¹³ 5.00 × 10¹³ 1.00 × 10³ 1.00 × 10¹² 3.70 × 10¹² 3.70 × 10¹² 1.00 × 10¹² * Pa-1s-1 for gas adsorption
0.0 100.7 0.0 4.1 0.0 2.0 0.0 30.0 30.0 56.0 0.0 80.0 10.0 20.0 20.0
7.00 × 10¹⁰ 5.00 × 10⁴ 1.00 × 10¹¹ 8.00 × 10¹⁵ 7.00 × 10⁹ 1.00 × 10¹² 1.00 × 10¹⁰ 9.00 × 10¹³ 2.00 × 10¹³ 5.00 × 10¹² 1.00 × 10⁷ 1.00 × 10⁹ 1.00 × 10⁸ 1.00 × 10¹⁰ 1.00 × 10¹¹
-112.0 -67.0 -40.0 -250.0 -30.0 -50.0 -30.0 -30.0 -70.0 -29.2 -40.0 83.6 -41.8 -33.4 -183.9
5.5 Bistro Model for Pd/Ru Alloy Catalysts As with the Ru catalysts, no data were found for methane oxidation on Pd/Ru alloys. Noting the high strength of adsorption of oxygen on Ru, it is expected that Ru will retain adsorbed oxygen to high temperatures. The bi-functional mechanism listed in Table 9 equations 1-3 may explain the observed behavior that the Pd/Ru catalysts are more active than the Pd catalysts. A complete mechanism for the surface reaction would be represented by combining Tables 2 through 4.
Table 9: Postulated bi-functional mechanism for methane oxidation on Pd/Ru surfaces Reactions Af
(s-1) Ea (kJ/mol)
Ab (s-1)
∆H (kJ/mol)
1 COPd + ORu = Pd + Ru + CO2 2 CHPd + ORu = HPd + CORu 3 HPd + ORu = OHPd + Ru
4.50 × 10¹¹ 1.00 × 10¹¹ 5.00 × 10¹²
100.0 10.0 15.0
5.00 × 10⁴ 1.00 × 10¹¹ 2.00 × 10¹¹
-125.0 -180.0 -40.0
5.6 Comparison with Engine Test Data Model calculations of ignition delay were compared against measured ignition delays from engine test experiments. For the model calculations, ignition delay was defined as the time required for the initial temperature to rise by 10%. Accurate prediction of the ignition delay requires accurate computation of all relevant transport phenomena within the cylinder during compression and ignition. The ignition delay as defined for the model calculations enables assessment of whether the model can capture the trends.
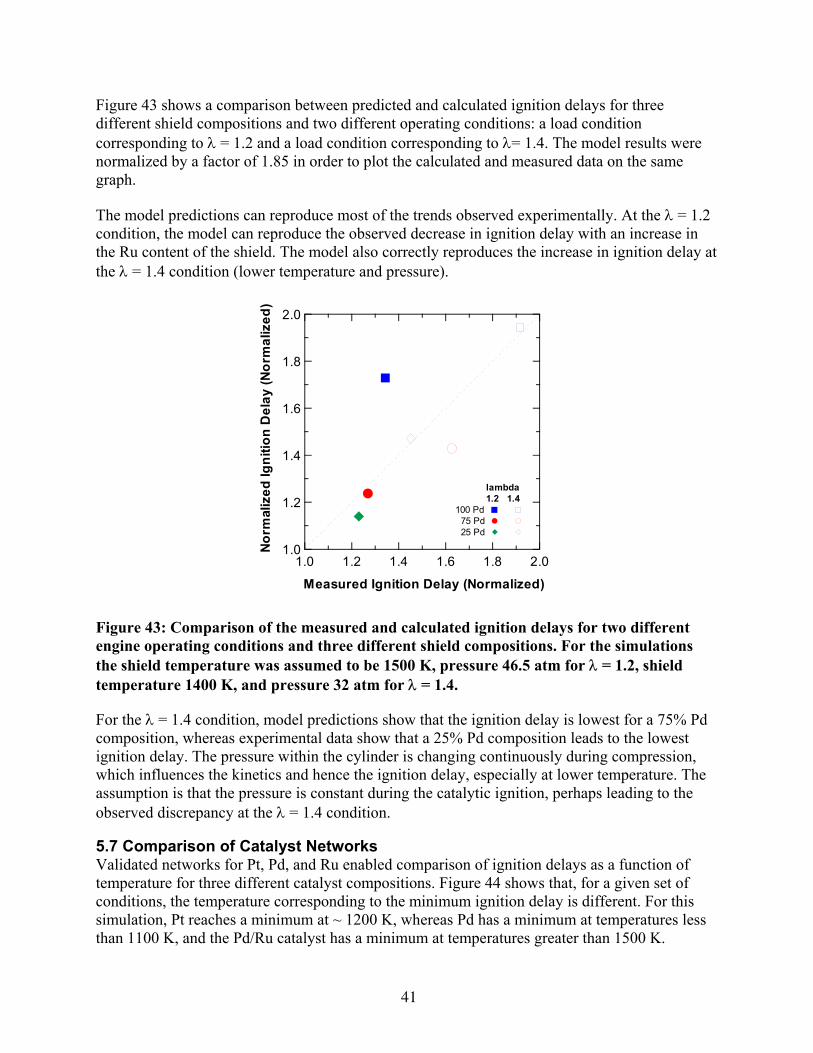
41
Figure 43 shows a comparison between predicted and calculated ignition delays for three different shield compositions and two different operating conditions: a load condition corresponding to λ = 1.2 and a load condition corresponding to λ= 1.4. The model results were normalized by a factor of 1.85 in order to plot the calculated and measured data on the same graph.
The model predictions can reproduce most of the trends observed experimentally. At the λ = 1.2 condition, the model can reproduce the observed decrease in ignition delay with an increase in the Ru content of the shield. The model also correctly reproduces the increase in ignition delay at the λ = 1.4 condition (lower temperature and pressure).
2.0
1.8
1.6
1.4
1.2
1.0Norm
aliz
ed Ig
nitio
n D
elay
(Nor
mal
ized
)
2.01.81.61.41.21.0
Measured Ignition Delay (Normalized)
lambda1.2 1.4
100 Pd 75 Pd 25 Pd
Figure 43: Comparison of the measured and calculated ignition delays for two different engine operating conditions and three different shield compositions. For the simulations the shield temperature was assumed to be 1500 K, pressure 46.5 atm for λ = 1.2, shield temperature 1400 K, and pressure 32 atm for λ = 1.4. For the λ = 1.4 condition, model predictions show that the ignition delay is lowest for a 75% Pd composition, whereas experimental data show that a 25% Pd composition leads to the lowest ignition delay. The pressure within the cylinder is changing continuously during compression, which influences the kinetics and hence the ignition delay, especially at lower temperature. The assumption is that the pressure is constant during the catalytic ignition, perhaps leading to the observed discrepancy at the λ = 1.4 condition. 5.7 Comparison of Catalyst Networks Validated networks for Pt, Pd, and Ru enabled comparison of ignition delays as a function of temperature for three different catalyst compositions. Figure 44 shows that, for a given set of conditions, the temperature corresponding to the minimum ignition delay is different. For this simulation, Pt reaches a minimum at ~ 1200 K, whereas Pd has a minimum at temperatures less than 1100 K, and the Pd/Ru catalyst has a minimum at temperatures greater than 1500 K.
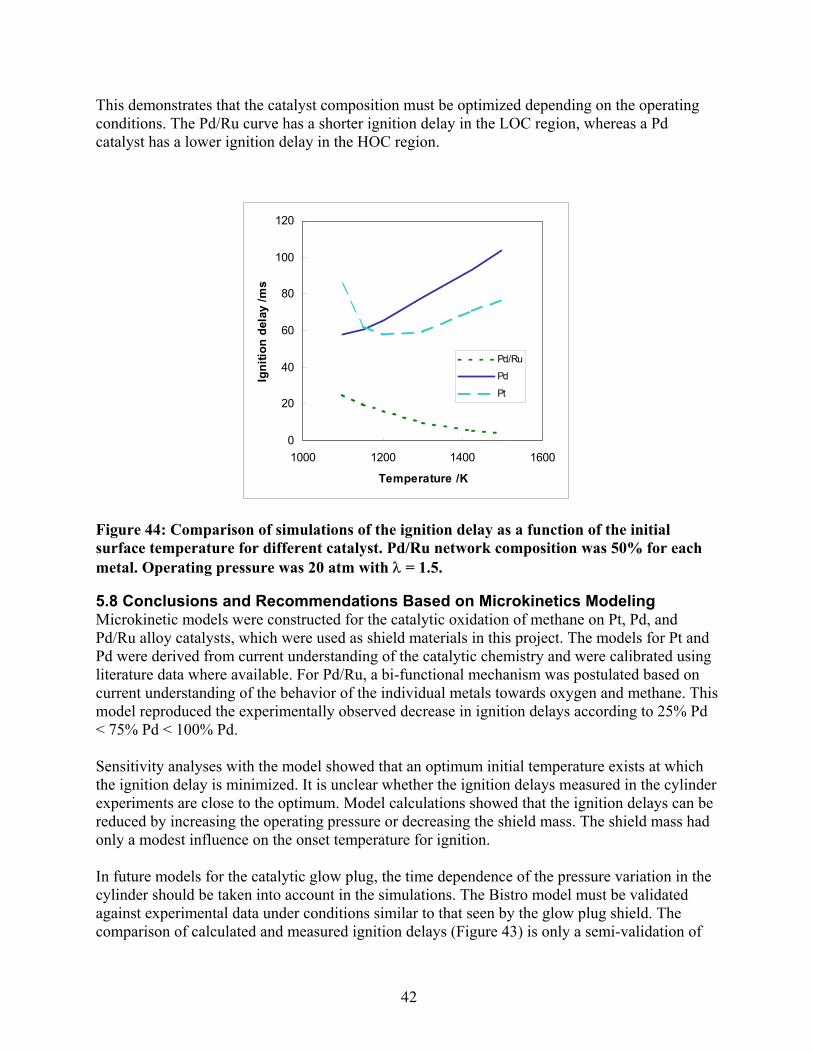
42
This demonstrates that the catalyst composition must be optimized depending on the operating conditions. The Pd/Ru curve has a shorter ignition delay in the LOC region, whereas a Pd catalyst has a lower ignition delay in the HOC region.
0
20
40
60
80
100
120
1000 1200 1400 1600
Temperature /K
Igni
tion
dela
y /m
s
Pd/Ru
Pd
Pt
Figure 44: Comparison of simulations of the ignition delay as a function of the initial surface temperature for different catalyst. Pd/Ru network composition was 50% for each metal. Operating pressure was 20 atm with λ = 1.5. 5.8 Conclusions and Recommendations Based on Microkinetics Modeling Microkinetic models were constructed for the catalytic oxidation of methane on Pt, Pd, and Pd/Ru alloy catalysts, which were used as shield materials in this project. The models for Pt and Pd were derived from current understanding of the catalytic chemistry and were calibrated using literature data where available. For Pd/Ru, a bi-functional mechanism was postulated based on current understanding of the behavior of the individual metals towards oxygen and methane. This model reproduced the experimentally observed decrease in ignition delays according to 25% Pd < 75% Pd < 100% Pd. Sensitivity analyses with the model showed that an optimum initial temperature exists at which the ignition delay is minimized. It is unclear whether the ignition delays measured in the cylinder experiments are close to the optimum. Model calculations showed that the ignition delays can be reduced by increasing the operating pressure or decreasing the shield mass. The shield mass had only a modest influence on the onset temperature for ignition. In future models for the catalytic glow plug, the time dependence of the pressure variation in the cylinder should be taken into account in the simulations. The Bistro model must be validated against experimental data under conditions similar to that seen by the glow plug shield. The comparison of calculated and measured ignition delays (Figure 43) is only a semi-validation of
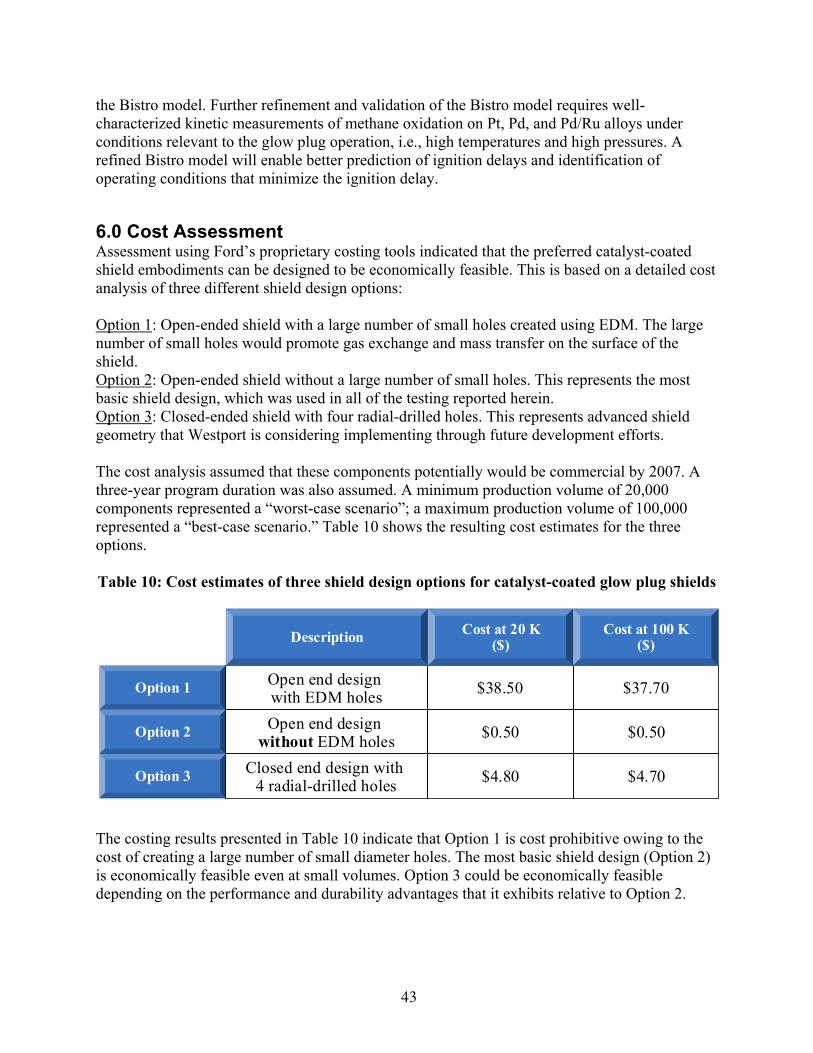
43
the Bistro model. Further refinement and validation of the Bistro model requires well-characterized kinetic measurements of methane oxidation on Pt, Pd, and Pd/Ru alloys under conditions relevant to the glow plug operation, i.e., high temperatures and high pressures. A refined Bistro model will enable better prediction of ignition delays and identification of operating conditions that minimize the ignition delay. 6.0 Cost Assessment Assessment using Ford’s proprietary costing tools indicated that the preferred catalyst-coated shield embodiments can be designed to be economically feasible. This is based on a detailed cost analysis of three different shield design options: Option 1: Open-ended shield with a large number of small holes created using EDM. The large number of small holes would promote gas exchange and mass transfer on the surface of the shield. Option 2: Open-ended shield without a large number of small holes. This represents the most basic shield design, which was used in all of the testing reported herein. Option 3: Closed-ended shield with four radial-drilled holes. This represents advanced shield geometry that Westport is considering implementing through future development efforts. The cost analysis assumed that these components potentially would be commercial by 2007. A three-year program duration was also assumed. A minimum production volume of 20,000 components represented a “worst-case scenario”; a maximum production volume of 100,000 represented a “best-case scenario.” Table 10 shows the resulting cost estimates for the three options. Table 10: Cost estimates of three shield design options for catalyst-coated glow plug shields The costing results presented in Table 10 indicate that Option 1 is cost prohibitive owing to the cost of creating a large number of small diameter holes. The most basic shield design (Option 2) is economically feasible even at small volumes. Option 3 could be economically feasible depending on the performance and durability advantages that it exhibits relative to Option 2.
Option 1
Option 2
Option 3
Open end design with EDM holesOpen end design
without EDM holesClosed end design with
4 radial-drilled holes
$38.50
$0.50
$4.80
$37.70
$0.50
$4.70
Description Cost at 20 K($)
Cost at 100 K($)
44
Although the component cost of the shield appears reasonable, the assessment of the exhaust aftertreatment system associated with the DI-NG engine indicates that the catalytic reactor required to achieve the mandated level of emissions will either have to be very big (i.e., costly) or very hot. This conclusion is based on using the reaction network devised for the Pd-coated shields (see Section 5) to simulate an exhaust catalyst assumed to be adiabatic. The input to the catalyst model was the 13-mode engine out emissions, and the model was used to predict the expected emission reduction over a catalyst assumed to be of the same volume as the engine displacement. Based on this initial analysis, successful commercialization of the DI-NG engine will depend on development of an exhaust aftertreatment system that meets the cost and performance targets set by the market. 7.0 Conclusions and Future Efforts 7.1 Conclusions This project was directed at improving the ignition system of a DI-NG engine. Several preferred elements of the ignition system were determined. The project indicates that catalyst-coated glow plug shields may be a promising means of improving ignition in DI-NG engines. Because of bonding issues, catalyst coatings on the surface of ceramic glow plugs were not tested. However, engine testing with catalyst-coated glow plug shields shows the promise of using low-Pd/high-Ru shield coatings; these shields can potentially improve glow plug life through improved stability and lower voltage operation. Analysis of the impact of the Pd/Ru catalyst coating indicates that it reduces the glow plug temperature by about 50-100 ºC. Based on extensive testing of various hardware configurations, the preferred configuration of the hot surface ignition system appears to be a Le-Mark 50W glow plug with a -3 mm protrusion with respect to the shield opening. In addition, in-cylinder flow characteristics of the PLN engine were favorable for improving the combustion characteristics of the engine. In efforts beyond the scope of this program, Westport is using CFD to investigate the mechanism behind the observed improvement. Microkinetics modeling of the catalytic ignition of methane/air mixtures provided additional insight into the preferred embodiment of the hot surface ignition system. These results suggest that further increases in glow plug temperature are not likely to have a large impact on reducing ignition delay because the glow plugs currently operate in a temperature range near the ignition delay minimum. Instead, the modeling results suggest the potential attractiveness of using pilot injection of natural gas to enhance the effectiveness of catalyst coatings on in-cylinder combustion. In addition, Pd/Ru coated shields appear to be a cost-effective means of improving hot-surface ignition systems in DI-NG engines. Preferred embodiments of the catalyst-coated shield are expected to cost approximately $0.50 to $5.00 per cylinder in volume. Such a cost is reasonable provided that durability targets of the hot surface ignition system are met.

45
Although the Pd/Ru-coated shields demonstrated promise for future development, this project also highlighted remaining challenges with respect to the viability of using catalyst-coated shields to reduce ignition delay and improve combustion stability: • Formulating a catalyst coating that produces a significant improvement in ignition delay and
combustion stability over the entire engine operating map, particularly at the most challenging high speed/low load conditions; a coated glow plug could have been beneficial in this light load regime, where the shield temperature is low
• Improving the ability of the coating to survive in-cylinder conditions through the use of improved coating techniques and/or improved catalyst composition
• Developing an exhaust aftertreatment system that does not compromise engine performance and meets emissions targets for heavy-duty vehicles
7.2 Future Efforts Based on the progress made under this program, future efforts to optimize the hot surface ignition system should be focused on a system level approach. Such efforts should be directed at further optimizing the composition and geometry of the shield/glow plug and injection process. Specific areas of focus necessary to build upon progress to date and further advance the development of DI-NG engines include: • Improving the coating and geometry for ignition performance and emissions targets at low
loads • Tuning the coating composition and fabrication method for durability, stoichiometry of the
local combustion mixture, and in-cylinder temperature; in particular, efforts directed toward development of a robust coating method for the ceramic glow plug surface will likely help reduce operating temperature required to achieve short ignition delays at light loads, improving glow plug durability
• Designing the shield/glow plug geometry for optimal stoichiometry required for ignition • Identifying optimal placement of the glow plug within the combustion chamber, within the
limits of the combustion chamber design • Tailoring the injection process (e.g., pilot injection and/or rate shaping) to work with the
chemistry of the catalyst-coated glow plug/shield • Addressing the complex interactions of chemistry at the glow plug and in-cylinder fluid
mechanics via controlled engine experiments, bench-scale experiments, and numerical simulations
• Leveraging the microkinetics models of the catalytic ignition of methane to address the exhaust aftertreatment challenges associated with cost effectively meeting heavy-duty on-highway emissions standards using DI-NG engines
8.0 References 1. S. Sriramulu, P.D. Moore, J.P. Mello, and R.S. Weber: Arthur D. Little, Inc., Cambridge,
MA (2001). 2. E. Shustorovich and H. Sellers: Surface Science Reports, 31:1 (1998). 3. O. Deutschmann, R. Schmidt, F. Behrendt, and J. Warnatz: Twenty-Sixth Symposium
(International) on Combustion, p. 1747 (1996).
46
4. C. Campell: Topics in Catalysis, 1:353 (1994). 5. E.S. Putna, J.M. Vohs, and R.J. Gorte. Surface Science, 391:L1178 (1997). 6. Y.D. Kim, A.P. Seitsonen, S. Wendt, et al.: Journal of Physical Chemistry, B. 105:3752
(2001). 7. R. Kikuchi, S. Maeda, K. Sasaki, et al.: Applied Catalysis, A: General 232:23 (2002). 8. T.V. Choudhary, S. Banerjee, and V.R. Choudhary: Applied Catalysis, A 234:1 (2002). 9. M. Lyubovsky and L.D. Pfefferle: Applied Catalysis, A: General 173:107 (1998). 10. M. Lyubovsky and L.D. Pfefferle: Catalysis Today, 47:29 (1999). 11. G.B. Hoflund, H.A.E. Hagelin, J.F. Weaver, and G.N. Salaita: Applied Surface Science,
205:102 (2002). 12. X. Zhang, C.S.M. Lee, D.M.P. Mingod, and D.O. Hayward: Applied Catalysis, A 6230:1
(2002). 13. R.S. Monteiro, D. Zemlyanov, J.M. Storey, and F.H. Ribeiro: Journal of Catalysis,
199:291 (2001). 14. R.S. Monteiro, D. Zemlyanov, J.M. Storey, and F.H. Ribeiro: Journal of Catalysis,
201:37 (2001). 15. O. Deutschmann, R. Schmidt, F. Behrendt, and J. Warnatz: Symposium (International) on
Combustion, [Proceedings] 26th:1747 (1996). 16. H. Widjaja, K. Sekizawa, K. Eguchi, and H. Arai: Catalysis Today, 47:95 (1999). 17. K. Sekizawa, H. Widjaja, S. Maeda, et al.: Applied Catalysis, A: General 200:211 (2000).
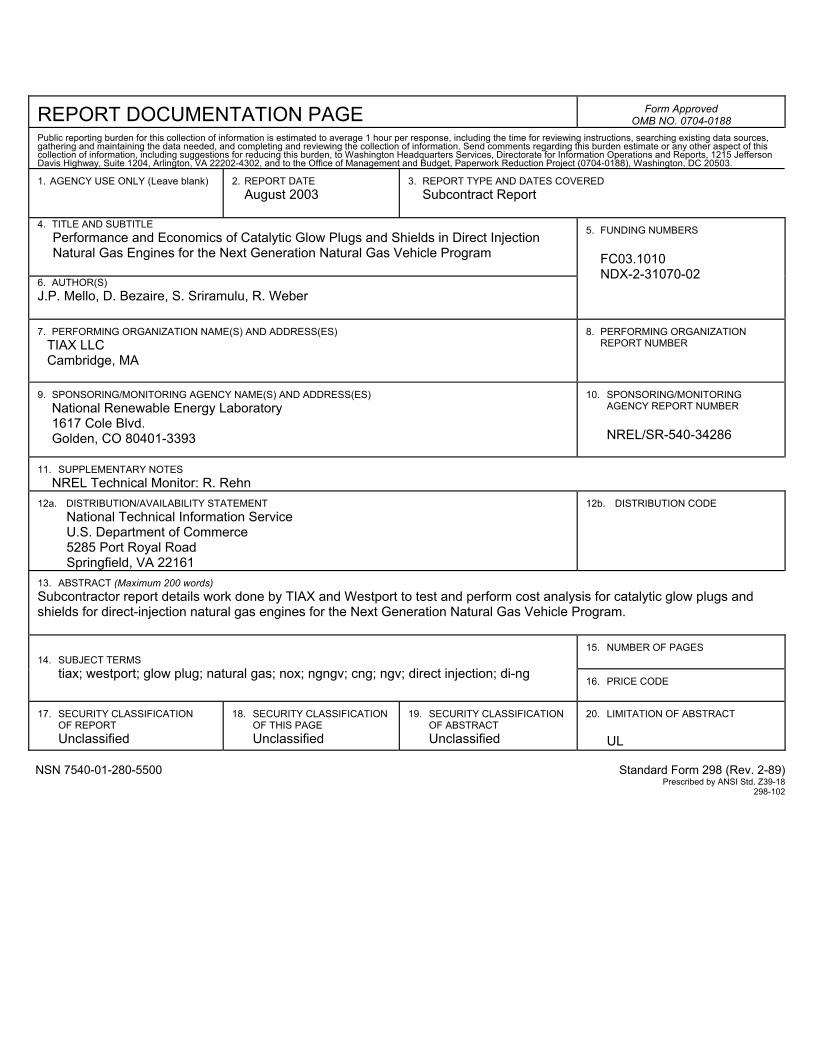
REPORT DOCUMENTATION PAGE
Form Approved OMB NO. 0704-0188
Public reporting burden for this collection of information is estimated to average 1 hour per response, including the time for reviewing instructions, searching existing data sources, gathering and maintaining the data needed, and completing and reviewing the collection of information. Send comments regarding this burden estimate or any other aspect of this collection of information, including suggestions for reducing this burden, to Washington Headquarters Services, Directorate for Information Operations and Reports, 1215 Jefferson Davis Highway, Suite 1204, Arlington, VA 22202-4302, and to the Office of Management and Budget, Paperwork Reduction Project (0704-0188), Washington, DC 20503. 1. AGENCY USE ONLY (Leave blank)
2. REPORT DATE
August 2003
3. REPORT TYPE AND DATES COVERED
Subcontract Report
4. TITLE AND SUBTITLE Performance and Economics of Catalytic Glow Plugs and Shields in Direct Injection Natural Gas Engines for the Next Generation Natural Gas Vehicle Program
6. AUTHOR(S) J.P. Mello, D. Bezaire, S. Sriramulu, R. Weber
5. FUNDING NUMBERS
FC03.1010 NDX-2-31070-02
7. PERFORMING ORGANIZATION NAME(S) AND ADDRESS(ES)
TIAX LLC Cambridge, MA
8. PERFORMING ORGANIZATION
REPORT NUMBER
9. SPONSORING/MONITORING AGENCY NAME(S) AND ADDRESS(ES)
National Renewable Energy Laboratory 1617 Cole Blvd. Golden, CO 80401-3393
10. SPONSORING/MONITORING
AGENCY REPORT NUMBER NREL/SR-540-34286
11. SUPPLEMENTARY NOTES
NREL Technical Monitor: R. Rehn 12a. DISTRIBUTION/AVAILABILITY STATEMENT
National Technical Information Service U.S. Department of Commerce 5285 Port Royal Road
Springfield, VA 22161
12b. DISTRIBUTION CODE
13. ABSTRACT (Maximum 200 words) Subcontractor report details work done by TIAX and Westport to test and perform cost analysis for catalytic glow plugs and shields for direct-injection natural gas engines for the Next Generation Natural Gas Vehicle Program.
15. NUMBER OF PAGES
14. SUBJECT TERMS tiax; westport; glow plug; natural gas; nox; ngngv; cng; ngv; direct injection; di-ng
16. PRICE CODE
17. SECURITY CLASSIFICATION
OF REPORT Unclassified
18. SECURITY CLASSIFICATION
OF THIS PAGE Unclassified
19. SECURITY CLASSIFICATION
OF ABSTRACT Unclassified
20. LIMITATION OF ABSTRACT
UL
NSN 7540-01-280-5500 Standard Form 298 (Rev. 2-89) Prescribed by ANSI Std. Z39-18 298-102