Performance Analysis of Several Functional Splits in C-RAN
6
HAL Id: hal-01439903 https://hal.archives-ouvertes.fr/hal-01439903 Submitted on 23 Jan 2017 HAL is a multi-disciplinary open access archive for the deposit and dissemination of sci- entific research documents, whether they are pub- lished or not. The documents may come from teaching and research institutions in France or abroad, or from public or private research centers. L’archive ouverte pluridisciplinaire HAL, est destinée au dépôt et à la diffusion de documents scientifiques de niveau recherche, publiés ou non, émanant des établissements d’enseignement et de recherche français ou étrangers, des laboratoires publics ou privés. Performance Analysis of Several Functional Splits in C-RAN Jialong Duan, Xavier Lagrange, Frédéric Guilloud To cite this version: Jialong Duan, Xavier Lagrange, Frédéric Guilloud. Performance Analysis of Several Functional Splits in C-RAN. VTC 2016 Spring: 83th Semi-Annual Vehicular Technology Conference, May 2016, Nan- jing, China. pp.1 - 5, 10.1109/VTCSpring.2016.7504410. hal-01439903
Transcript of Performance Analysis of Several Functional Splits in C-RAN

HAL Id: hal-01439903https://hal.archives-ouvertes.fr/hal-01439903
Submitted on 23 Jan 2017
HAL is a multi-disciplinary open accessarchive for the deposit and dissemination of sci-entific research documents, whether they are pub-lished or not. The documents may come fromteaching and research institutions in France orabroad, or from public or private research centers.
L’archive ouverte pluridisciplinaire HAL, estdestinée au dépôt et à la diffusion de documentsscientifiques de niveau recherche, publiés ou non,émanant des établissements d’enseignement et derecherche français ou étrangers, des laboratoirespublics ou privés.
Performance Analysis of Several Functional Splits inC-RAN
Jialong Duan, Xavier Lagrange, Frédéric Guilloud
To cite this version:Jialong Duan, Xavier Lagrange, Frédéric Guilloud. Performance Analysis of Several Functional Splitsin C-RAN. VTC 2016 Spring : 83th Semi-Annual Vehicular Technology Conference, May 2016, Nan-jing, China. pp.1 - 5, �10.1109/VTCSpring.2016.7504410�. �hal-01439903�

Performance Analysis of Several Functional Splitsin C-RAN
Jialong Duan∗, Xavier Lagrange∗ and Frédéric Guilloud†∗Networks, Security and Multimedia Department†Signal and Communications Department
Télécom BretagneEmail: [email protected]
Abstract—Centralized/Cloud Radio Access Network (C-RAN)is a promising future mobile network architecture, which canpotentially increase the capacity of mobile network meanwhilereducing operators’ cost. In standard C-RAN, frequency shiftingis made in Remote Radio Heads (RRHs), which are close tothe antennas. Signal processing and upper layers are made inBaseband Unit (BBU) pool for multiple base stations. However,this results in high burden on the optical transport networkbetween RRHs and BBU pool. This paper investigates newfunctional split architectures between RRH and BBU, to reducethe transmission throughput between RRHs and BBUs. Twonew architectures are proposed and modeled for the uplink. Wepropose to move part of physical layer functions of the BBU tothe RRH. For the proposed architectures, the transmission ratebetween RRHs and BBUs depends on the mobile network load,while that of current architecture is constant. Simulation resultsillustrate that 30% to 40% bandwidth can be saved when allthe radio channel capacity is used, and up to 70% bandwidthwhen half of the radio channel capacity is used.
Keywords: RRH; BBU; functional split; quantization; errorvector magnitude (EVM).
I. INTRODUCTION
Mobile data traffic is supposed to increase more than 1000times from year 2010 to 2020 [1]. Meanwhile, the future 5Gsystem is required to support an increase factor of 10 − 100times of the transmission user data rate and devices withdelays as low as a few milliseconds [2]. Operators are facingthe challenges to satisfy the explosion of data usage whilereducing the cost. A novel mobile network architecture C-RAN has been proposed to address these.
In Long Term Evolution (LTE), eNodeB (eNB) contains twomain parts: Baseband Unit (BBU) and Remote Radio Head(RRH). RRHs transform the baseband signals from BBUsto radio frequency and then forward it to User Equipments(UEs) by the antennas in the downlink. The process is adversein the uplink. Meanwhile, BBUs deal with baseband signalprocessing. RRH is connected to BBU through optical fibers.
C-RAN remotes BBUs from RRHs and mitigates them to aBBU pool for centralized processing [3]. The current widelyused interface protocol for Inphase (I) and Quadrature (Q)data transmission between RRHs and BBUs is Common PublicRadio Interface (CPRI) [4]. The estimated IQ data throughputexceeds 10 Gbps for a 3 sector Base Station (BS) with 20 MHz4×4 MIMO. A BBU pool which connects 10−1000 BSs will
need vast transmission bandwidth in the fronthaul [5]. This isone of the main issues of C-RAN.
The raw IQ samples transmitted between RRHs and BBUsconsume too much bandwidth of the transport network. Thus,an efficient compression scheme is needed for the capacityconstrained transport network between RRHs and BBUs. Sev-eral solutions have been proposed in [6], such as reducingsignal sampling rate, applying non-linear quantization, fre-quency sub-carrier compression and IQ data compression.Another envisioned method is to change the current functionalsplit architecture between RRH and BBU [7]. This paperinvestigates on the performance of the last method. Two newfunctional split architectures are proposed, which move part ofthe functions in the physical layer of LTE transmission systemfrom BBU to RRH.
For the downlink, the base station is concerned by thetransmission side. The baseband signal is defined in a set ofdiscrete symbols, so developing compression scheme is easy.For the uplink, the BS is concerned by the receiver side. Asthe signal received is affected by noise, it is fundamentallyanalog. The analog received signal should be quantized beforebeing transmitted from RRHs to BBUs. The quantization hasan impact both on the quality of the reception and on thethroughput between RRHs and BBUs. Therefore, we focus onLTE uplink.
This paper is organized as follows. In Section II, theDiscrete Fourier Transform Spread Orthogonal Frequency-Division Multiplexing (DFTS-OFDM) transmission system inLTE uplink is briefly introduced. The current and proposedfunctional split architectures between RRH and BBU aremodeled and presented in Section III. The algorithms appliedand numerical configurations in the simulation are proposedin Section IV. The simulation results are shown in Section V.At last, this paper is concluded in Section VI.
II. OVERVIEW OF DFTS OFDM TRANSMISSION SYSTEM
LTE uplink is based on DFTS-OFDM rather than Or-thogonal Frequency-Division Multiplexing Access (OFDMA),which is used for LTE downlink. The Peak to Average PowerRatio (PAPR) of DFTS-OFDM is lower than OFDMA whichgreatly benefits the User Equipment (UE) in terms of transmitpower efficiency and reduced cost of the power amplifier [8].

Fig. 1. Localized DFTS-OFDM transmitter.
A. Transmitter
Let us consider a transmitter i of a DFTS-OFDM system. Itconverts input bit stream signal to Mi modulated sub-carriersover a total of N sub-carriers, as shown in Figure 1. A setof input data bits is firstly collected and then modulated byusing QPSK, 16 QAM or 64 QAM, which results in a complexvector ai = {ai0, ai1, ..., aiMi−1}. After an Mi-point unitaryDiscrete Fourier Transform (DFT), the output Ai is obtained.
Then Ai is mapped to a group of Mi adjacent sub-carriersof Xi, whose remaining sub-carriers are allocated with zeros.This is called localized sub-carrier mapping. Next, a DFTS-OFDM symbol xi is generated by performing an N -pointunitary inverse DFT to Xi.
To combat multi-path fading, a Cyclic Prefix (CP) is addedat the beginning of each symbol xi. A CP is created by copyingthe last L samples of symbol xi. After a parallel-to-serialoperation, xi
cp is converted to analog signal and modulatedto radio frequency, then finally transmitted.
B. White Gaussian Noise Channel Model
We model the transmission channel with noise betweenTransmitter i and receiver by adding white Gaussian noise(AWGN). The elements of the noise vector n follow a normaldistribution with mean µ = 0 and variance given by
σ2 = Es × 10−(Es
N0)dB
/10 (1)
where Es is the average symbol energy defined as:
Es = E(|aik|2), (2)
and N0 is the double-sided power spectral density of the whiteGaussian noise.
C. Receiver
A block diagram of a DFTS-OFDM receiver for the re-covery of signals transmitted from multiple transmitters isillustrated in Figure 2. The signal processing is inverse to thatof the aforementioned transmitter. The signal correspondingto Transmitter j, denoted by Bj , is selected out by the Sub-carrier Demapping block. A frequency-domain-equalization(FDE) can be performed after the Sub-carrier Demapping tocombat frequency-selective fading and phase distortion. We donot consider equalization in this work.
Fig. 2. Localized DFTS-OFDM receiver.
Fig. 3. Method 1 of functional split between RRH and BBU (used in CPRI).
III. DIFFERENT FUNCTIONAL SPLITS
A. Current Functional Split Between RRH and BBU
A model of receiver applying typical functional split isshown in Figure 3, which we denote as Method 1. A Qq-bits linear quantization is applied to both the real part and theimaginary part of ycp separately before it is transmitted fromRRH to BBU. The RRH in Method 1 can’t identify which andhow many Physical Resource Blocks (PRBs) are occupied,thus it has to transmit all the PRBs even if all of them arevacant. Therefore, the transmission rate between RRHs andBBUs is constant, independent of the mobile network load.
B. Proposed Functional Splits Between RRH and BBU
In LTE transmission, the number of guard sub-carriers isabout 40 percent of all the sub-carriers transmitted and thecyclic prefix (CP) also forms 7 to 25 percents of the datatransmitted [7]. We consider to remove CP and the guardsub-carriers before the transmission from RRH to BBU. Twomethods of functional split which move “remove CP” and“FFT” blocks from BBU to RRH are proposed. We denotethem Method 2 and 3, and detail them hereafter.
1) Method 2 of Functional Split Between RRH and BBU:The model of Method 2 is shown in Figure 4. The differencebetween Method 1 and 2 is that we move the “remove CP”block and “N-point-FFT" block from BBU to RRH. The newblock “PRB usage state detection” detects which sets of 12sub-carriers corresponding to one PRB, are occupied in Y.

Fig. 4. Method 2 of functional split between RRHs and BBUs.
Usually, not all the PRBs are occupied in LTE transmission.If we can detect which PRBs are occupied or vacant, then wecan transmit just the PRBs occupied to further reduce the datatransmission rate between RRH and BBU.
One possible method is to calculate the sum of the mod-ulus of 12 elements belonging to a PRB in Y. Assumethat {Y12k+nmin , Y12k+nmin+1, ..., Y12k+nmin+11} in Y belong toPRB k, where nmin is the index of the first active sub-carrier.The sum of the modulus of the 12 elements is given as
Wk =
11∑n=0
|Y12k+n|2 (3)
If Wk is less than a threshold, we can decide that the 12 sub-carriers in PRB k are vacant.
2) Method 3 of Functional Split Between RRH and BBU:The model of Method 3 is shown in Figure 5. The dy-namic of the signal y in the frequency domain is higherthan Y in the time domain. In method 2, the signal trans-mitted from RRH to BBU is in frequency domain. Weconsider to transform it to time domain before the trans-mission to reduce the dynamic. To realize this, differentfrom method 2, we perform a 12-point unitary IFFT on{Y12k+nmin , Y12k+nmin+1, ..., Y12k+nmin+11} in Y in Method 3.Then we obtain a vector {c12k, c12k+1, ..., c12k+11}, wherek = 0, 1, ..., NRB − 1. The total number of PRBs during oneLTE time slot is denoted by NRB. Next, the block “PRB usagestate detection” decides if this vector will be quantized andtransmitted to BBUs.
In BBUs, the serial “12-point FFT” blocks are used toreverse the 12-point unitary IFFT operation in the RRHs.
IV. ALGORITHMS AND NUMERICAL CONFIGURATIONS
This section present the simulation set up of DFT-SpreadOFDM in LTE Uplink physical layer of 20 MHz, whichincludes N = 2048 sub-carriers where 1200 of them areactive. The length of CP L = 160. Modulation scheme 16QAM is adapted, thus m = 4 bits per symbol. “DAC” and“RF” blocks in the transmitter are not considered as well as“ADC” and “RF” in the receiver. Three different methods offunctional split between RRH and BBU are applied and theperformances will be compared in Section V.
A. Quantization and Frame Arrangement
In order to minimize the quantization error, a digital auto-matic gain control is applied. A scaling factor Fs is determinedfor each block of Ns received IQ samples which is denotedby z = {z1, z2, ..., zNs−1}. Then z is quantized linearly withQq bits resolution per complex component based on Fs . Thescaling factor is sent together with z from RRHs to BBUs. Inorder not to introduce a large extra delay to the transmissionsystem, the value of Ns should be a factor of N + L forMethod 1, and of the total number of sub-carriers occupiedduring each LTE time slot for Method 2 and 3.
We define the largest absolute value as
Vmax = maxk=0,...,Ns−1
{|<(zk)|, |=(zk)|} (4)
where <(zk) and =(zk) denotes the real and imaginary partof zk, respectively.
The corresponding scaling factor is determined as
Fs =
{dVmax
p e for dVmaxp e ≤ 2Qs − 1
2Qs − 1 for dVmaxp e > 2Qs − 1
(5)
where p is the quantization step for Vmax and Qs is the numberof bits used to represent Fs.
Then the IQ samples are linearly quantized to 2Qq levelsranging from −Fs to Fs. The n-th quantization level is givenby
qn = −Fsp+ (n+1
2) · Fsp
2Qq−1(6)
where n = 0, 1, ..., 2Qq − 1.Applying the quantization levels obtained, the IQ samples
z are linearly quantized as
uI(k) = arg minn|qn −<(zk)|, (7)
uQ(k) = arg minn|qn −=(zk)| (8)
where k = 0, ..., Ns − 1.Inspired by [9], the IQ samples transmitted from RRH to
BBU may be organized as a frame given in Figure 6. The firstQs bits are used to represent Fs. Moreover, the references ofthe corresponding occupied PRBs are also represented by Qr

Fig. 5. Method 3 of functional split between RRHs and BBUs.
Fig. 6. Possible frame structure.
bits. This is necessary for Method 2 and 3 to identify whichPRBs the samples received belong to. For Method 1, Qr = 0.
Taking into account the transmission of the scaling factorand the references of PRB, the average number of bits usedto transport a complex element (I or Q) for Method k is:
Qeffk =2NskQqk +Qs +Qr
2Nsk(9)
where k = 1, 2, 3, Nsk is the number of IQ samples in eachframe and Qqk is the number of quantization bits per complexcomponent.
B. Data Transmission Rate From RRH to BBU
In the following, we will present the formula of datatransmission rate calculation from RRH to BBU separately.
1) Data Transmission Rate for Method 1: The data trans-mission rate between RRH and BBU for Method 1 is givenby
D1 = Fos · fs · 2 ·Qeff1 ·1
Rc(10)
where Fos is the oversampling factor, fs is the minimumsampling frequency, and Qeff1 is the number of effectivequantization bits for each complex element (I or Q) asmentioned in Section IV-A. The factor 2 in Equation 10 resultsfrom that both I and Q signals should be transmitted. Due tothe Forward Error Correction (FEC) code applied in CPRI, acode rate Rc needs to be considered.
In LTE uplink with 20 MHz bandwidth, there are 2048 sub-carriers. Therefore, the minimum sampling frequency fs =2048×∆f = 2048× 15 kHz = 30.72 MHz. Oversampling isdoing sampling to a signal with a frequency higher than theNyquist rate (minimum sampling rate). It is applied to improve
TABLE ISIMULATION PARAMETERS FOR METHOD 1.
PAPAMETER SYMBOL VALUEOversampling factor Fos 1
Minimum sampling frequency fs 30.72 MHzNumber of samples for each frame Ns 138Number of bits for scaling factor Qs 16
Number of bits for reference of PRB Qr 0Code rate of FEC applied Rc 8/10
the performance of system. The values of the parameters forMethod 1 in our simulation are shown in Table I.
2) Data Transmission Rate for Method 2 and 3: The datatransmission rate from RRH to BBU for Method 2 is denotedby D2, and D3 for Method 3. The data transmission rate isgiven by
Dk = NSc ·1
Ts· 2 ·Qeffk ·
1
Rc· η (11)
where NSc is the number of active sub-carriers for datatransmission, Ts is the symbol duration, k = 2, 3, and η isthe assumed PRB utilization ratio. The factors 2 and Rc inEquation 11 are the same as in Equation 10 for Method 1.
TABLE IISIMULATION PARAMETERS FOR METHOD 2 AND 3.
PAPAMETER SYMBOL VALUENumber of active subcarriers NSc 1200
Symbol duration (for normal CP) Ts 71.43 µsNumber of samples for each frame Nsk (k = 2, 3) 12Number of bits for scaling factor Qs 16
Number of bits for reference of PRB Qr 7Code rate of FEC applied Rc 8/10
Assumed PRB utilization ratio η 0.5or1
The value assignments of the parameters in our simulationfor method 2 and 3 are shown in Table II.
C. Error Vector Magnitude
The error vector magnitude (EVM) is used to quantify theperformance of aforementioned different methods of receiver.EVM is defined as
EVM =
√E[|aik − aik|2]
E[|aik|2](12)
where aik are the 16 QAM modulated symbols to be sent intransmitters as shown in Figure 1, and aik are the receivedsymbols before 16 QAM demodulation as shown in Figure 2.
We have also considered the cases with AWGN in thetransmission channel between transmitters and receivers.
V. SIMULATION RESULTS
The performances of Method 1, 2 and 3 with and withoutAWGN have been simulated. Using Equation 10 and 11, wecan get the data transmission rate from RRH to BBU for thethree different methods and quantization resolution Qq.
A. Performance Comparison Between Method 1 and 2.
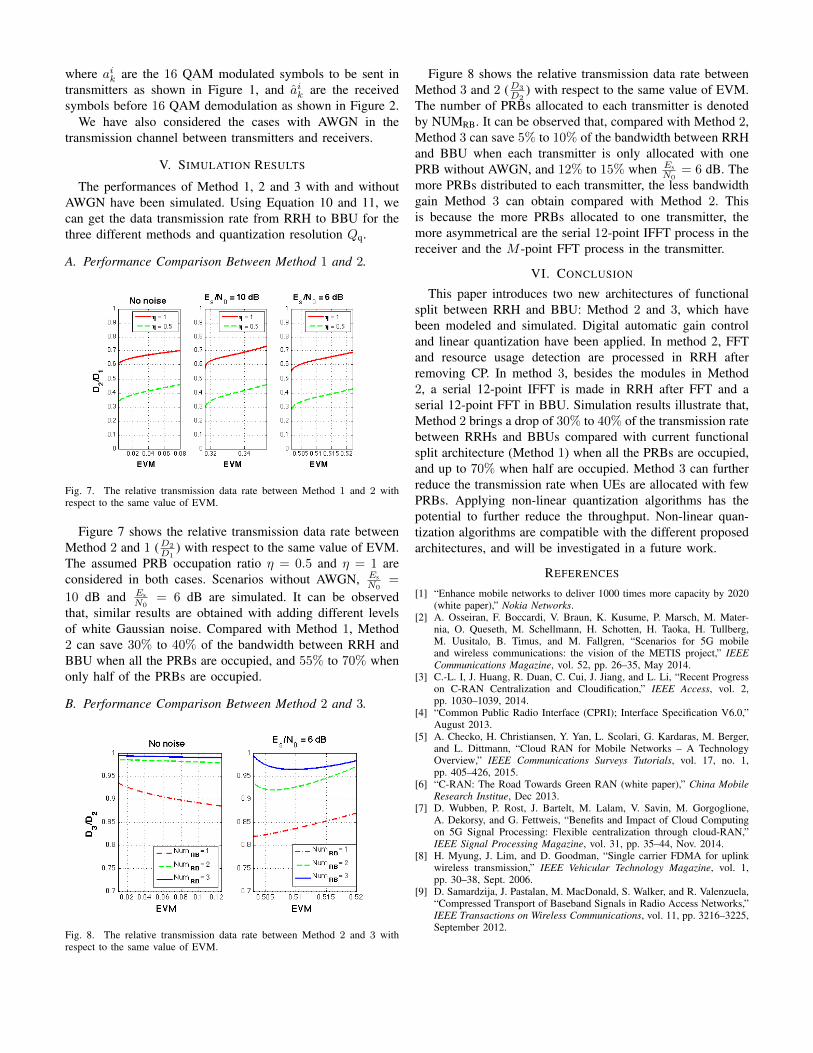
Fig. 7. The relative transmission data rate between Method 1 and 2 withrespect to the same value of EVM.
Figure 7 shows the relative transmission data rate betweenMethod 2 and 1 (D2
D1) with respect to the same value of EVM.
The assumed PRB occupation ratio η = 0.5 and η = 1 areconsidered in both cases. Scenarios without AWGN, Es
N0=
10 dB and EsN0
= 6 dB are simulated. It can be observedthat, similar results are obtained with adding different levelsof white Gaussian noise. Compared with Method 1, Method2 can save 30% to 40% of the bandwidth between RRH andBBU when all the PRBs are occupied, and 55% to 70% whenonly half of the PRBs are occupied.
B. Performance Comparison Between Method 2 and 3.
Fig. 8. The relative transmission data rate between Method 2 and 3 withrespect to the same value of EVM.
Figure 8 shows the relative transmission data rate betweenMethod 3 and 2 (D3
D2) with respect to the same value of EVM.
The number of PRBs allocated to each transmitter is denotedby NUMRB. It can be observed that, compared with Method 2,Method 3 can save 5% to 10% of the bandwidth between RRHand BBU when each transmitter is only allocated with onePRB without AWGN, and 12% to 15% when Es
N0= 6 dB. The
more PRBs distributed to each transmitter, the less bandwidthgain Method 3 can obtain compared with Method 2. Thisis because the more PRBs allocated to one transmitter, themore asymmetrical are the serial 12-point IFFT process in thereceiver and the M -point FFT process in the transmitter.
VI. CONCLUSION
This paper introduces two new architectures of functionalsplit between RRH and BBU: Method 2 and 3, which havebeen modeled and simulated. Digital automatic gain controland linear quantization have been applied. In method 2, FFTand resource usage detection are processed in RRH afterremoving CP. In method 3, besides the modules in Method2, a serial 12-point IFFT is made in RRH after FFT and aserial 12-point FFT in BBU. Simulation results illustrate that,Method 2 brings a drop of 30% to 40% of the transmission ratebetween RRHs and BBUs compared with current functionalsplit architecture (Method 1) when all the PRBs are occupied,and up to 70% when half are occupied. Method 3 can furtherreduce the transmission rate when UEs are allocated with fewPRBs. Applying non-linear quantization algorithms has thepotential to further reduce the throughput. Non-linear quan-tization algorithms are compatible with the different proposedarchitectures, and will be investigated in a future work.
REFERENCES
[1] “Enhance mobile networks to deliver 1000 times more capacity by 2020(white paper),” Nokia Networks.
[2] A. Osseiran, F. Boccardi, V. Braun, K. Kusume, P. Marsch, M. Mater-nia, O. Queseth, M. Schellmann, H. Schotten, H. Taoka, H. Tullberg,M. Uusitalo, B. Timus, and M. Fallgren, “Scenarios for 5G mobileand wireless communications: the vision of the METIS project,” IEEECommunications Magazine, vol. 52, pp. 26–35, May 2014.
[3] C.-L. I, J. Huang, R. Duan, C. Cui, J. Jiang, and L. Li, “Recent Progresson C-RAN Centralization and Cloudification,” IEEE Access, vol. 2,pp. 1030–1039, 2014.
[4] “Common Public Radio Interface (CPRI); Interface Specification V6.0,”August 2013.
[5] A. Checko, H. Christiansen, Y. Yan, L. Scolari, G. Kardaras, M. Berger,and L. Dittmann, “Cloud RAN for Mobile Networks – A TechnologyOverview,” IEEE Communications Surveys Tutorials, vol. 17, no. 1,pp. 405–426, 2015.
[6] “C-RAN: The Road Towards Green RAN (white paper),” China MobileResearch Institue, Dec 2013.
[7] D. Wubben, P. Rost, J. Bartelt, M. Lalam, V. Savin, M. Gorgoglione,A. Dekorsy, and G. Fettweis, “Benefits and Impact of Cloud Computingon 5G Signal Processing: Flexible centralization through cloud-RAN,”IEEE Signal Processing Magazine, vol. 31, pp. 35–44, Nov. 2014.
[8] H. Myung, J. Lim, and D. Goodman, “Single carrier FDMA for uplinkwireless transmission,” IEEE Vehicular Technology Magazine, vol. 1,pp. 30–38, Sept. 2006.
[9] D. Samardzija, J. Pastalan, M. MacDonald, S. Walker, and R. Valenzuela,“Compressed Transport of Baseband Signals in Radio Access Networks,”IEEE Transactions on Wireless Communications, vol. 11, pp. 3216–3225,September 2012.