Evaluating C-RAN Fronthaul Functional Splits in Terms of ... · Evaluating C-RAN fronthaul...
12
General rights Copyright and moral rights for the publications made accessible in the public portal are retained by the authors and/or other copyright owners and it is a condition of accessing publications that users recognise and abide by the legal requirements associated with these rights. Users may download and print one copy of any publication from the public portal for the purpose of private study or research. You may not further distribute the material or use it for any profit-making activity or commercial gain You may freely distribute the URL identifying the publication in the public portal If you believe that this document breaches copyright please contact us providing details, and we will remove access to the work immediately and investigate your claim. Downloaded from orbit.dtu.dk on: May 15, 2020 Evaluating C-RAN Fronthaul Functional Splits in Terms of Network Level Energy and Cost Savings Checko, Aleksandra; Popovska Avramova, Andrijana; Berger, Michael Stübert; Christiansen, Henrik Lehrmann Published in: Journal of Communications and Networks Link to article, DOI: 10.1109/JCN.2016.000025 Publication date: 2016 Document Version Peer reviewed version Link back to DTU Orbit Citation (APA): Checko, A., Popovska Avramova, A., Berger, M. S., & Christiansen, H. L. (2016). Evaluating C-RAN Fronthaul Functional Splits in Terms of Network Level Energy and Cost Savings. Journal of Communications and Networks, 18(2), 162-172. https://doi.org/10.1109/JCN.2016.000025
Transcript of Evaluating C-RAN Fronthaul Functional Splits in Terms of ... · Evaluating C-RAN fronthaul...
General rights Copyright and moral rights for the publications made accessible in the public portal are retained by the authors and/or other copyright owners and it is a condition of accessing publications that users recognise and abide by the legal requirements associated with these rights.
Users may download and print one copy of any publication from the public portal for the purpose of private study or research.
You may not further distribute the material or use it for any profit-making activity or commercial gain
You may freely distribute the URL identifying the publication in the public portal If you believe that this document breaches copyright please contact us providing details, and we will remove access to the work immediately and investigate your claim.
Downloaded from orbit.dtu.dk on: May 15, 2020
Evaluating C-RAN Fronthaul Functional Splits in Terms of Network Level Energy andCost Savings
Checko, Aleksandra; Popovska Avramova, Andrijana; Berger, Michael Stübert; Christiansen, HenrikLehrmann
Published in:Journal of Communications and Networks
Link to article, DOI:10.1109/JCN.2016.000025
Publication date:2016
Document VersionPeer reviewed version
Link back to DTU Orbit
Citation (APA):Checko, A., Popovska Avramova, A., Berger, M. S., & Christiansen, H. L. (2016). Evaluating C-RAN FronthaulFunctional Splits in Terms of Network Level Energy and Cost Savings. Journal of Communications andNetworks, 18(2), 162-172. https://doi.org/10.1109/JCN.2016.000025
JOURNAL OF COMMUNICATIONS AND NETWORKS, ACCEPTED FOR PUBLICATION 1
Evaluating C-RAN fronthaul functional splits interms of network level energy and cost savingsAleksandra Checko*, Andrijana P. Avramova*, Michael S. Berger and Henrik L. Christiansen
Abstract: The placement of the complete baseband processing in acentralized pool results in high data rate requirement and inflex-ibility of the fronthaul network, which challenges the energy andcost effectiveness of the Cloud Radio Access Network (C-RAN).Recently, redesign of the C-RAN through functional split in thebaseband processing chain has been proposed to overcome thesechallenges. This paper evaluates, by mathematical and simulationmethods, different splits with respect to network level energy andcost efficiency having in the mind the expected quality of service.
The proposed mathematical model quantifies the multiplexinggains and the trade-offs between centralization and decentraliza-tion concerning the cost of the pool, fronthaul network capacityand resource utilization. The event-based simulation captures theinfluence of the traffic load dynamics and traffic type variation ondesigning an efficient fronthaul network.
Based on the obtained results, we derive a principle for fronthauldimensioning based on the traffic profile. This principle allows forefficient radio access network with respect to multiplexing gainswhile achieving the expected users’ quality of service.
Index Terms: C-RAN; functional split; multiplexing gain; energyefficiency.
I. INTRODUCTION
Striving towards cost and energy efficient next generation
of mobile communications, C-RAN designates a leading tech-
nology for the Radio Access Network (RAN) architecture [1].
C-RAN inherits the design of a distributed Base Station (BS),
where the Remote Radio Head (RRH)1 is separated and con-
nected via fiber to the baseband processing server, called
Baseband Unit (BBU). The baseband processing is gathered in
a centralized pool, which facilitates advanced multi-cell cooper-
ation techniques. Thus the radio resource management is more
efficient as the network is flexible and scalable to the tempo-
rally and spatial fluctuations of the mobile traffic. The central-
ization is further enhanced with cloud computing [2], providing
elasticity, virtualization with possibility for multitenancy among
operators. The computational resources can be pooled and dy-
namically allocated to a virtual BS, which brings cost-effective
hardware and software design [3].
* The first two authors contributed equally to this work.
This work was partially sponsored by the 7th Framework Programme for Re-search of the European Commission HARP project, under grant number HARP-318489.
A. Checko, A. P. Avramova, M. S. Berger and H. L. Christiansen arewith the DTU Fotonik, Department of Photonics Engineering, Technical Uni-versity of Denmark, Kgs. Lyngby, Denmark, email: [amch, apop, msbe,hlch]@fotonik.dtu.dk.
A. Checko is also with MTI Radiocomp, Hillerød, Denmark, email: [email protected].
1A RRH is consisted of radio frequency equipment and antenna
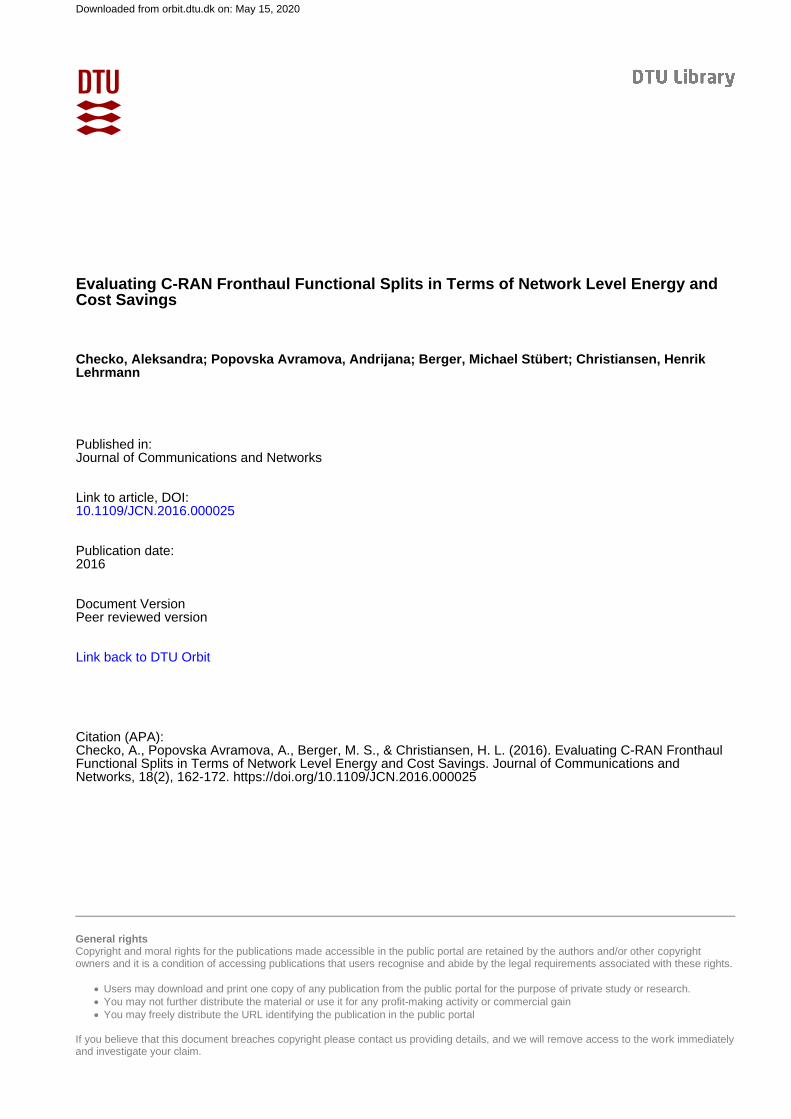
Fig. 1. RAN Architecture for different functional splits.
With the current interface definition, the fronthaul net-
work (connecting the BBU pool and the RRHs) relies
on technologies that are capable of supporting high ca-
pacity, such as optical fiber. For example, in case of
Common Public Radio Interface (CPRI) fronthaul interface, for
a 20MHz bandwidth and 2x2 MIMO antenna system, the data
rate required by the links for downlink in one sector is 2457.6
Mbps, where only 150Mbps is offered to a single cell users on
the air interface [4]. The transport efficiency on the fronthaul
links is highly reduced as the interface is independent of the
traffic load while dependent of the number of antennas used. As
such, massive Multiple Input Multiple Output (MIMO) will fur-
ther challenge the cost-effectiveness of the C-RAN architecture.
The high cost due to the stringent requirement of such fron-
thaul infrastructure has lead to investigation of alternative points
of separating the functionality in the baseband processing chain
([4], [5], [6]) as illustrated in Fig. 1. The future definitions
of the fronthaul interface need to realize the benefits of central-
ization and cloud computation at highest possible level, while
relaxing the bandwidth and latency requirements.
In this paper we discuss and analyze different split points in
terms of multiplexing gains, which relates to cost and energy ef-
ficiency of the transport network. First we present a quantitative
study of different splits based on teletraffic theory. Afterwards
we provide simulation based analysis where more detailed traf-
fic models have been applied in order to derive in-depth and
detailed study of a particular functional split. The research elab-
orated in this paper suggests that hybrid deployments should be
considered in order to optimally balance the multiplexing gains,
spectral efficiency and cost of the fronthaul infrastructure. This
paper gives indication of the multiplexing gains through network
c©
This is the author's version of an article that has been published in this journal. Changes were made to this version by the publisher prior to publication.The final version of record is available at http://dx.doi.org/10.1109/JCN.2016.000025
Copyright (c) 2016 JCN. Personal use is permitted. For any other purposes, permission must be obtained from the JCN/KICS
2 JOURNAL OF COMMUNICATIONS AND NETWORKS, ACCEPTED FOR PUBLICATION
dimensioning, while ensuring satisfying quality of service to the
end user. The results obtained substantially influence the opera-
tor’s decision of the radio access network deployments.
This structure of the paper is illustrated in Fig. 1. Sec-
tion II defines the multiplexing gains considered in this paper
and elaborates on possible split points in the baseband process-
ing chain. Section III evaluates the functional splits using direct
routing model based on multi-dimensional loss system, while
Section IV reports the results from the discrete event-based sim-
ulation analysis. Finally, concluding remarks are presented in
Section V.
II. METHODS FOR QUANTIFYING MULTIPLEXING
GAINS
In this section we explain the sources and definition of mul-
tiplexing gains in mobile networks. We discuss possible func-
tional splits and multiplexing gains they enable. Moreover, we
explain the methodologies taken in this article to quantify multi-
plexing gains. Last, we provide an overview of the state-of-the-
art on quantifying multiplexing gains.
A. Background and terminology
The art of network/BBU dimensioning is to provide a net-
work that is cost-effective for the operator and at the same time
provides a reasonable Quality of Service (QoS) for users. By al-
lowing many users and base stations to share network resources,
multiplexing gain can be achieved, as they will request peak data
rates at different times. The multiplexing gain comes from traf-
fic independence and from 1) burstiness of the traffic, and 2) the
tidal effect - daily traffic variations between office and residen-
tial cells [7]. Given the fact that cells from metropolitan area
can be connected to one BBU pool (maximum distance between
RRH and BBU is required to be within 20 km) it is realistic to
account for office and residential cells to be included. The tidal
effect is one of the main motivations for introducing C-RAN [7].
As for any other shared resources, multiplexing enables to
serve the same amount of users with less equipment. Multiplex-
ing gain indicates the savings that comes from the less equip-
ment required to serve the same number of users. In this way
the cost of deploying BBU pools and fronthaul links (CAPital
EXpenditure (CAPEX)) will be lower. That will lead to energy
savings, as fewer BBU units and fronthaul links need to be sup-
plied with electricity (OPerating EXpenditure (OPEX)).
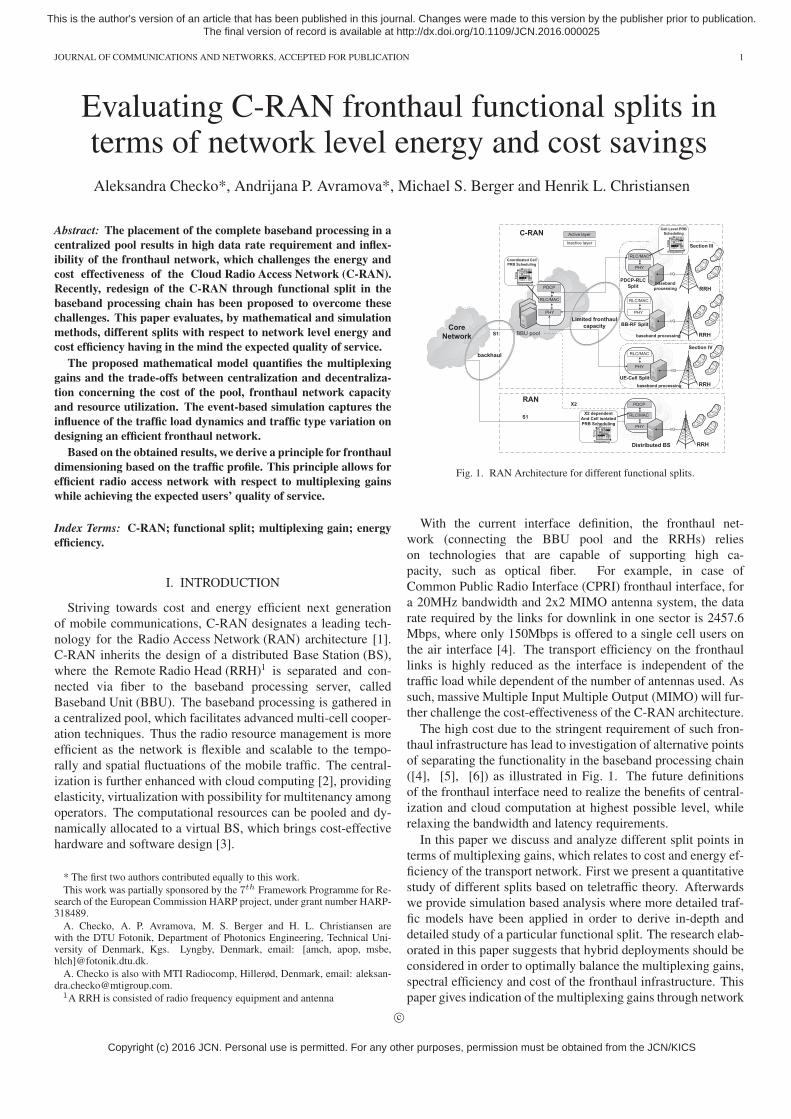
B. Multiplexing gains for different functional splits
In a traditional base station or in a base station with RRH,
for each cell, the baseband processing resources are statically
assigned to the RRH, as shown in Fig. 2a. In C-RAN, shown
in Fig. 2d the baseband units are shared in a virtualized BBU
pool, hence it is expected that in C-RAN the amount of pro-
cessors needed to perform baseband processing will be lower
comparing to the RAN. The CPRI protocol is constant bit rate,
independent of user activity. Hence, there is no multiplexing
gain on fronthaul links. We call this split BB-RF as is separates
baseband and radio frequency functionalities.
Fig. 2. Possible multiplexing gains depending on base station architecture.
Before year 2013, to address the challenge of optimizing the
fronthaul bit rate and flexibility various compression techniques
were considered. As a more disruptive methods were needed to
achieve higher data rate reduction, nowadays (from year 2013)
a new split between RRH and BBU functionality is under an ex-
tensive analysis [4], [8], [9]. In the analysis reported by this
paper we focus on three functional splits as indicated in Fig. 2:
BB-RF, discussed above, UE-Cell and PDCP-RLC. With the
UE-Cell split (separating user and cell specific functionalities),
shown in Fig. 2c traffic between RRH and BBU will be traf-
fic dependent, hence we can expect multiplexing gain both on
BBU resources but also on fronthaul links. However, fronthaul
latency requirements are tight - 250 μs [4]. For PDCP-RLCsplit, shown in Fig. 2b, the majority of data processing will
be executed at the cell sites, only a small portion of it will be
done in a pool, hence a marginal BBU pool multiplexing gain.
However, a variable bit rate traffic will be transmitted on the
fronthaul links, hence a possibility for a multiplexing gain on
the fronthaul. Moreover, this split allows for higher fronthaul
latency - 30 ms [4]. This split leaves the MAC scheduling and
PHY functionality to reside at the RRH, which limits the possi-
bility for joint PHY processing and joint scheduling for multi-
cell cooperation.
For the heterogeneous cases, when some of the cells are
served by RAN, some by C-RAN with different splits, different
multiplexing gain will be achieved for fronthaul and different
for the BBU. Therefore the total cost of the network will vary.
We evaluate this trade off in Section III. Generally, the more
CHECKO, AVRAMOVA et al.: EVALUATING C-RAN FRONTHAUL FUNCTIONAL SPLITS... 3
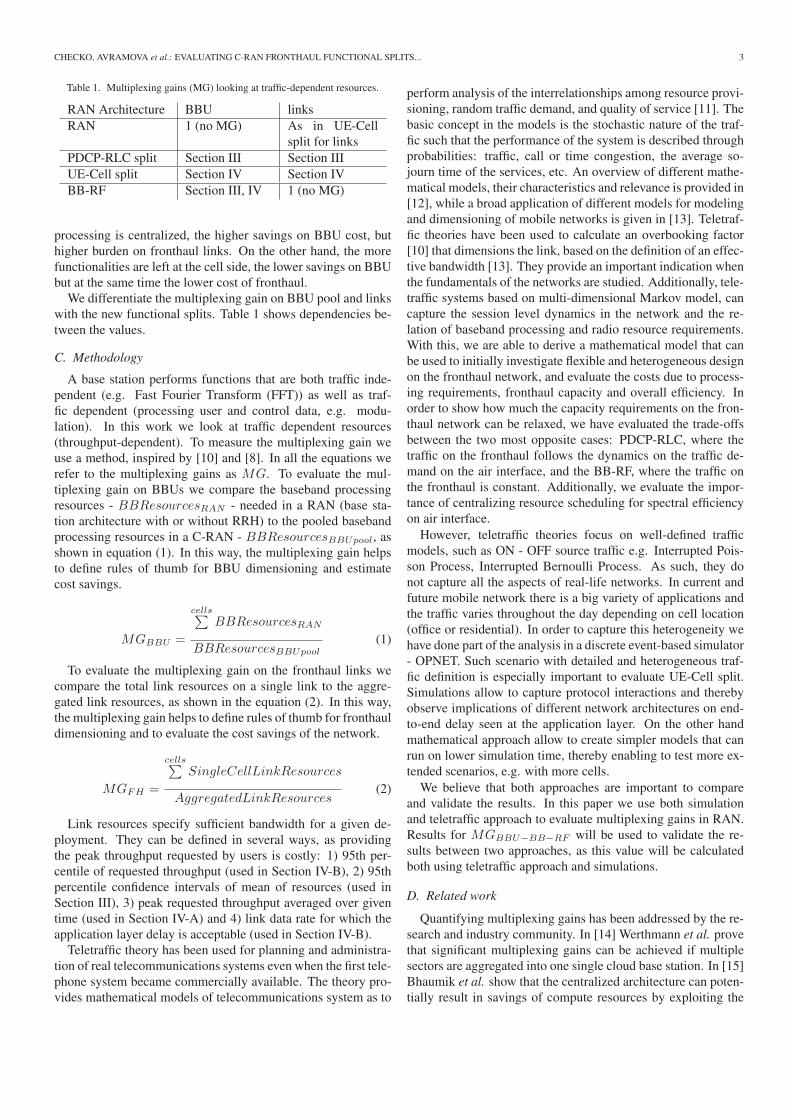
Table 1. Multiplexing gains (MG) looking at traffic-dependent resources.
RAN Architecture BBU links
RAN 1 (no MG) As in UE-Cell
split for links
PDCP-RLC split Section III Section III
UE-Cell split Section IV Section IV
BB-RF Section III, IV 1 (no MG)
processing is centralized, the higher savings on BBU cost, but
higher burden on fronthaul links. On the other hand, the more
functionalities are left at the cell side, the lower savings on BBU
but at the same time the lower cost of fronthaul.
We differentiate the multiplexing gain on BBU pool and links
with the new functional splits. Table 1 shows dependencies be-
tween the values.
C. Methodology
A base station performs functions that are both traffic inde-
pendent (e.g. Fast Fourier Transform (FFT)) as well as traf-
fic dependent (processing user and control data, e.g. modu-
lation). In this work we look at traffic dependent resources
(throughput-dependent). To measure the multiplexing gain we
use a method, inspired by [10] and [8]. In all the equations we
refer to the multiplexing gains as MG. To evaluate the mul-
tiplexing gain on BBUs we compare the baseband processing
resources - BBResourcesRAN - needed in a RAN (base sta-
tion architecture with or without RRH) to the pooled baseband
processing resources in a C-RAN - BBResourcesBBUpool, as
shown in equation (1). In this way, the multiplexing gain helps
to define rules of thumb for BBU dimensioning and estimate
cost savings.
MGBBU =
cells∑BBResourcesRAN
BBResourcesBBUpool(1)
To evaluate the multiplexing gain on the fronthaul links we
compare the total link resources on a single link to the aggre-
gated link resources, as shown in the equation (2). In this way,
the multiplexing gain helps to define rules of thumb for fronthaul
dimensioning and to evaluate the cost savings of the network.
MGFH =
cells∑SingleCellLinkResources
AggregatedLinkResources(2)
Link resources specify sufficient bandwidth for a given de-
ployment. They can be defined in several ways, as providing
the peak throughput requested by users is costly: 1) 95th per-
centile of requested throughput (used in Section IV-B), 2) 95th
percentile confidence intervals of mean of resources (used in
Section III), 3) peak requested throughput averaged over given
time (used in Section IV-A) and 4) link data rate for which the
application layer delay is acceptable (used in Section IV-B).
Teletraffic theory has been used for planning and administra-
tion of real telecommunications systems even when the first tele-
phone system became commercially available. The theory pro-
vides mathematical models of telecommunications system as to
perform analysis of the interrelationships among resource provi-
sioning, random traffic demand, and quality of service [11]. The
basic concept in the models is the stochastic nature of the traf-
fic such that the performance of the system is described through
probabilities: traffic, call or time congestion, the average so-
journ time of the services, etc. An overview of different mathe-
matical models, their characteristics and relevance is provided in
[12], while a broad application of different models for modeling
and dimensioning of mobile networks is given in [13]. Teletraf-
fic theories have been used to calculate an overbooking factor
[10] that dimensions the link, based on the definition of an effec-
tive bandwidth [13]. They provide an important indication when
the fundamentals of the networks are studied. Additionally, tele-
traffic systems based on multi-dimensional Markov model, can
capture the session level dynamics in the network and the re-
lation of baseband processing and radio resource requirements.
With this, we are able to derive a mathematical model that can
be used to initially investigate flexible and heterogeneous design
on the fronthaul network, and evaluate the costs due to process-
ing requirements, fronthaul capacity and overall efficiency. In
order to show how much the capacity requirements on the fron-
thaul network can be relaxed, we have evaluated the trade-offs
between the two most opposite cases: PDCP-RLC, where the
traffic on the fronthaul follows the dynamics on the traffic de-
mand on the air interface, and the BB-RF, where the traffic on
the fronthaul is constant. Additionally, we evaluate the impor-
tance of centralizing resource scheduling for spectral efficiency
on air interface.
However, teletraffic theories focus on well-defined traffic
models, such as ON - OFF source traffic e.g. Interrupted Pois-
son Process, Interrupted Bernoulli Process. As such, they do
not capture all the aspects of real-life networks. In current and
future mobile network there is a big variety of applications and
the traffic varies throughout the day depending on cell location
(office or residential). In order to capture this heterogeneity we
have done part of the analysis in a discrete event-based simulator
- OPNET. Such scenario with detailed and heterogeneous traf-
fic definition is especially important to evaluate UE-Cell split.
Simulations allow to capture protocol interactions and thereby
observe implications of different network architectures on end-
to-end delay seen at the application layer. On the other hand
mathematical approach allow to create simpler models that can
run on lower simulation time, thereby enabling to test more ex-
tended scenarios, e.g. with more cells.
We believe that both approaches are important to compare
and validate the results. In this paper we use both simulation
and teletraffic approach to evaluate multiplexing gains in RAN.
Results for MGBBU−BB−RF will be used to validate the re-
sults between two approaches, as this value will be calculated
both using teletraffic approach and simulations.
D. Related work
Quantifying multiplexing gains has been addressed by the re-
search and industry community. In [14] Werthmann et al. prove
that significant multiplexing gains can be achieved if multiple
sectors are aggregated into one single cloud base station. In [15]
Bhaumik et al. show that the centralized architecture can poten-
tially result in savings of compute resources by exploiting the
4 JOURNAL OF COMMUNICATIONS AND NETWORKS, ACCEPTED FOR PUBLICATION
variations in the processing load across base stations. In [16]
Namba et al. analyze statistical multiplexing gain as a function
of cell layout. In [17] Madhavan et al. quantify the multiplexing
gain of consolidating WiMAX base stations in different traffic
conditions. The gain increases linearly with network size and
it is higher when base stations are experiencing higher traffic
intensity. On the contrary, based on teletraffic theory, in [18]
Liu et al. analyzed that lighter load can increase the statistical
multiplexing gain in virtual base station pool. Moreover, multi-
plexing gain reaches significant level even for the medium-size
pools and the increase in gain for larger pools in negligible. In
our previous work, using the definition from equation (1) we
compared BBU resources in RAN to C-RAN. The network con-
sisted of office and residential base stations. We concluded that
the value of the multiplexing gain is 1.2-1.6 and depends on
the percentage of office base stations in the BBU pool, reaching
the peak for 30% of office and thereby 70% of residential base
stations [19]. Secondly, we have compared results on multiplex-
ing gain obtained via simulations [19] to the ones achieved with
teletraffic theory [20].
However, all those works referred to the traditional - BB-RF
- functional split of C-RAN. In [8] authors estimate what they
define as statistical multiplexing convergence ratio on fronthaul
links by averaging observed daily throughput. Calculated ratio
equals to three. However, the analysis took only average net-
work load into account and therefore can be interpreted mostly
as an average daily fronthaul utilization. In this work we look
at different functional splits and different, precisely defined ap-
plication mixes. Moreover, on top of studying traffic to cal-
culate multiplexing gain, we also measure delays for different
BBU/fronthaul dimensioning cases.
III. TELETRAFFIC APPROACH
In this section we provide a quantitative analysis for the dif-
ferent functional splits discussed in the previous sections. In
particular we consider a RAN with hybrid functional split in
the fronthaul interface, namely BB-RF and PDCP-RLC split.
We consider these two opposite splits, but the model can be ex-
tended for comparison of all three discussed splits. The split
can be defined per cell, such that a portion of RRHs are con-
nected via CPRI to the BBU pool while the rest is connected
via the PDCP-RLC split. In order to simplify the analytical
model and introduce symmetry in the RRH definition, we con-
sider dynamic split per traffic flow, and define a portion of traf-
fic per RRH that is carried with a specific split. As we need
to define the amount of pooled resources required to carry the
requested volume of traffic, a network with hybrid functional
splits can be represented by an equivalent direct routing network
model. Such model can be used to define numerical examples
that study the statistical multiplexing advantages of pooling re-
sources in C-RAN. The following subsections first explain how
we model C-RAN using notation of teletraffic theory and then
we describe the direct routing analytical model based on the
multi-dimensional systems. Afterwards, we elaborate on the
obtained numerical results. Further information on the model
used, along with the mathematical model for the carried traffic
and blocking probabilities can be found in [20].
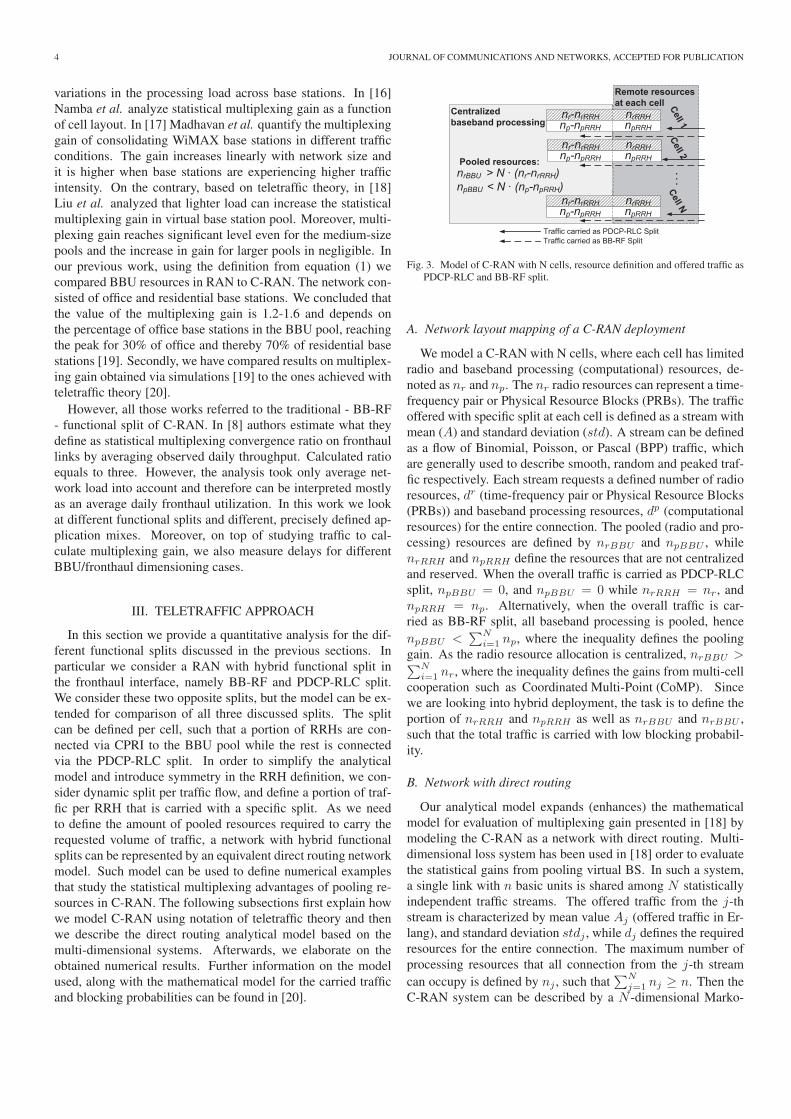
Fig. 3. Model of C-RAN with N cells, resource definition and offered traffic asPDCP-RLC and BB-RF split.
A. Network layout mapping of a C-RAN deployment
We model a C-RAN with N cells, where each cell has limited
radio and baseband processing (computational) resources, de-
noted as nr and np. The nr radio resources can represent a time-
frequency pair or Physical Resource Blocks (PRBs). The traffic
offered with specific split at each cell is defined as a stream with
mean (A) and standard deviation (std). A stream can be defined
as a flow of Binomial, Poisson, or Pascal (BPP) traffic, which
are generally used to describe smooth, random and peaked traf-
fic respectively. Each stream requests a defined number of radio
resources, dr (time-frequency pair or Physical Resource Blocks
(PRBs)) and baseband processing resources, dp (computational
resources) for the entire connection. The pooled (radio and pro-
cessing) resources are defined by nrBBU and npBBU , while
nrRRH and npRRH define the resources that are not centralized
and reserved. When the overall traffic is carried as PDCP-RLC
split, npBBU = 0, and npBBU = 0 while nrRRH = nr, and
npRRH = np. Alternatively, when the overall traffic is car-
ried as BB-RF split, all baseband processing is pooled, hence
npBBU <∑N
i=1 np, where the inequality defines the pooling
gain. As the radio resource allocation is centralized, nrBBU >∑Ni=1 nr, where the inequality defines the gains from multi-cell
cooperation such as Coordinated Multi-Point (CoMP). Since
we are looking into hybrid deployment, the task is to define the
portion of nrRRH and npRRH as well as nrBBU and nrBBU ,
such that the total traffic is carried with low blocking probabil-
ity.
B. Network with direct routing
Our analytical model expands (enhances) the mathematical
model for evaluation of multiplexing gain presented in [18] by
modeling the C-RAN as a network with direct routing. Multi-
dimensional loss system has been used in [18] order to evaluate
the statistical gains from pooling virtual BS. In such a system,
a single link with n basic units is shared among N statistically
independent traffic streams. The offered traffic from the j-th
stream is characterized by mean value Aj (offered traffic in Er-
lang), and standard deviation stdj , while dj defines the required
resources for the entire connection. The maximum number of
processing resources that all connection from the j-th stream
can occupy is defined by nj , such that∑N
j=1 nj ≥ n. Then the
C-RAN system can be described by a N -dimensional Marko-
CHECKO, AVRAMOVA et al.: EVALUATING C-RAN FRONTHAUL FUNCTIONAL SPLITS... 5
vian process with state space x = (x1, x2, ..., xN ), where xj
represents the number of connections of the stream from the j-
th RRH. The following restrictions define the truncation to the
state space:
0 ≤ xj · dj ≤ nj ,N∑j=1
xj · dj ≤ np (3)
Such system is reversible and since the traffic streams are in-
dependent, the system has product form. Thus the convolution
algorithm [21], which has not been considered in [18], can be
applied to derive the probability of the state p(x) as:
p(x) = p1(x1) ∗ p2(x2) ∗ ... ∗ pN (xN ), (4)
By pj(xj) we assume one dimensional Markovian process for
the j-th stream, which is a classical loss system with full acces-
sibility. The convolution, denoted by ∗, is done for one stream
at a time, in the following manner. Let pk represent convolution
of the first k streams, then the next stream, k + 1, is convolved
as follows:
pk ∗ pk+1 =
{pk(0) · pk+1(0),
1∑x=0
pk(x) · pk+1(1− x), ...,
t∑x=0
pk(x) · pk+1(t− x)}
(5)
Here t = min(∑k+1
j=1 nj , np) and defines truncation to the state
space at each step. Therefore, normalization needs to be per-
formed at each step in order to get the true state probabilities.
In order to obtain the performance metrics for the k-th stream,
all streams except the k-th need to be first convolved. Let pN/k
denotes the convolution of all streams except the k-th, then the
carried traffic is defined as:
Yk =
np∑x=0
x∑xj=0
xj · pN/k(x− xj) · pk(xj) (6)
Additionally, the traffic, call and time congestion can be derived
as defined in [12].
In this paper we extend the multidimensional loss system by
a network with direct routing [21] in order to be able to define
additional restrictions to the state space due to the considered
functional splits as well as a sharing degree of PRB among RRH
with respect to advanced multi-cell cooperation techniques. A
network with direct routing is defined through N routes (Rj),
M links (Lm) and required resources dmj for the j-th stream on
the m-th link. Each route corresponds to a traffic stream. The
links have capacity (lm) that defines the maximum number of
resources that a stream can occupy. Table 2 provides an illustra-
tion of how a network with direct routing can be defined.
The system defined by the network with direct routing still has
a product form and the convolution algorithm can be applied in
Table 2. Direct routing network
RoutesLinks R1 R2 ... RN CapacityL1 d11 d12 ... dMN l1L2 d21 d22 ... dMN l2
... ... ... ... ... ...
LM dM1 dM2 ... dMN lM
Table 3. Direct routing equivalent to a functional split in C-RAN
Route (Stream)
Cell1 Cell2 ... CellNLink RP RC RP RC RP RC Capacity
LA dpdcpp 0 0 0 0 0 npRRH
LB dpdcpr 0 0 0 0 0 nrRRH
LA 0 0 dpdcpp 0 0 0 npRRH
LB 0 0 dpdcpr 0 0 0 nrRRH
LA 0 0 0 0 dpdcpp 0 npRRH
LB 0 0 0 0 dpdcpr 0 nrRRH
LC 0 dbb−rfp 0 dbb−rf
p 0 dbb−rfp npBBU
LD 0 dbb−rfr 0 dbb−rf
r 0 dbb−rfr nrBBU
order to derive the performance metrics for each stream. The
convolution is performed by aggregating the state probabilities
of one route at a time and considering the restrictions on each
link due to the limited capacity:
N∑j=1
xj · dmj ≤ lm, m = 1, 2, ...M (7)
A direct routing equivalent to a C-RAN model with two func-
tional splits described by Fig. 3 is given in Table 3. The routes
define the stream(s) j of BPP traffic associated with a RRH. The
radio resources are either being scheduled at the MAC layer at
the RRHs, or at the BBU pool, depending on the split. The
baseband processing power required for these radio resources is
reserved in the RRH, or the BBU pool, correspondingly to the
assigned radio resources. The limited amount of radio resources
and processing power available need to be considered during
each convolution step, and in this case they are represented by
the link-restrictions. As we evaluate the performance metrics in
case of different hybrid functional splits, for each stream (route)
we define the resources (both radio and processing) requested
at the BBU pool and the RRH. The route RP defines the mean
offered traffic Apdcpj and the standard deviation stdpdcpj of the
traffic that is carried in the fronthaul network through the PDCP-
RLC interface at the j-th cell. The route RC defines the same
characteristics (Abb−rfj and stdbb−rf
j ) for the traffic that is car-
ried through CPRI at the j-th cell. The capacity defines total
available resources, both radio and processing, which yields the
following restrictions. Link LA define the restrictions due to the
available PRBs at each RRH (nrRRH ), while link LB defines
the limited processing possibilities at the RRH, defined through
npRRH . Link LC , and LD define the restrictions due to the to-
tal available radio and processing resources at the BBU pool,
defined as nrBBU and npBBU respectively.
6 JOURNAL OF COMMUNICATIONS AND NETWORKS, ACCEPTED FOR PUBLICATION
C. Numerical results and discussion
For the numerical analysis we have considered N = 100cells, each with total offered traffic of A = 8Erl. and arrival
rates with Poisson distribution. We have considered Poisson
process with single-slot traffic (dp = dr = 1) in order to keep
the studies manageable. At a fixed offered traffic, the percentage
of total traffic that is carried as PDCP-RLC split is varied from 0
to 100%, with a step of 10%. This way the network becomes hy-
brid, where the deployment is partially implemented as PDCP-
RLC split and partially as BB-RF split. For each split percent-
age, we first derive the minimum amount of radio (nrRRH ) and
processing resources (npRRH) required at the RRH, such that
the carried traffic is equal to the offered traffic (traffic conges-
tion below 1% ). Then we dimension the resources at the BBU
pool (npBBU ), to ensure that the total offered traffic is carried
by the network. At each split we quantify the following key
performance indicators: multiplexing gains at the BBU pool,
multiplexing gains on the fronthaul links and radio resource uti-
lizations. Based on equation 1, the multiplexing gain for the
computational resources at the BBU pool is defined as:
MGBBU−hybrid =N · nRAN
N · npRRH + npBBU(8)
where nRAN represent the maximum processing units available
at a RRH in a (traditional) RAN architecture. We only consider
the multiplexing gains that come from the layers below PDCP,
as all the gains of centralizing the PDCP layer are present for
both functional splits. Using equation 2, the multiplexing gain
at the fronthaul can be expressed through the variation of the
mean value and standard deviation (defined through the state
probabilities):
MGFH−hybrid =∑N
j=1 (F · (Abb−rfj + tn · stdbb−rf
j ) + (Apdpcj + tn · stdpdcpj ))
(Apdcpagg + tn · stdpdcpagg ) +
∑Nj=1 F · (Abb−rf
j + tn · stdbb−rfj )
(9)
where tn = 1.96 represent the student t-distribution for 95%
confidence interval. The notation of Apdcpagg , stdpdcpagg represent
the characteristics of the aggregated traffic from the PDCP-RLC
split, defined as:
Apdcpagg =
N∑1
(Apdcpj ), stdpdcpagg =
√√√√N∑j=1
stdpdcpj
2(10)
By F we define the increase factor due to CPRI protocol na-
ture, which has been set F = 16, as the extreme case where
2.5Gbps/150Mbps = 16.
Implementing multi-cell cooperation, such as CoMP, leads to
increased spectral efficiency, especially at the cell edges, where
interference is reduced and even more used as complementary
signal in case of joint transmission. In order to indicate the ef-
fects of multi-cell cooperation, we model them as a percentage
of PRB sharing among cells (sharing_pct). Then we consider
the PRB utilization defined through the following equation:
PRButil =carried_traffic
nrCell + nrBBU(11)
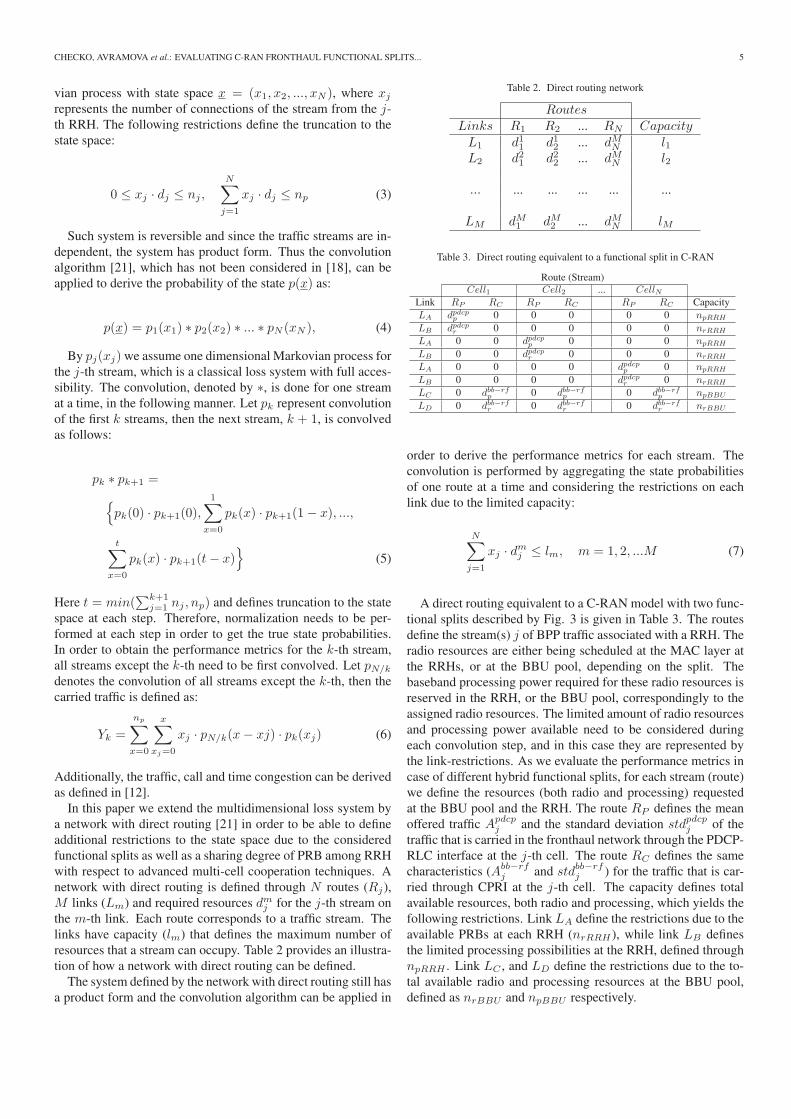
Fig. 4. Multiplexing gain in BBU pool: PDCP-RLC versus BB-RF split.
where nrBBU = (nrCell − nrRRH) · sharing_pct, and nrCell
are the PRB available at the RRH in case all traffic is car-
ried as PDCP-RLC split. The more possibility there exist for
multi-cell cooperation, the PRB are better utilized and hence
less PRBs are needed in order to carry the same traffic vol-
ume. Since we consider that the total offered traffic is carried,
carried_traffic = A = 8Erl., while sharing_pct = 30%.
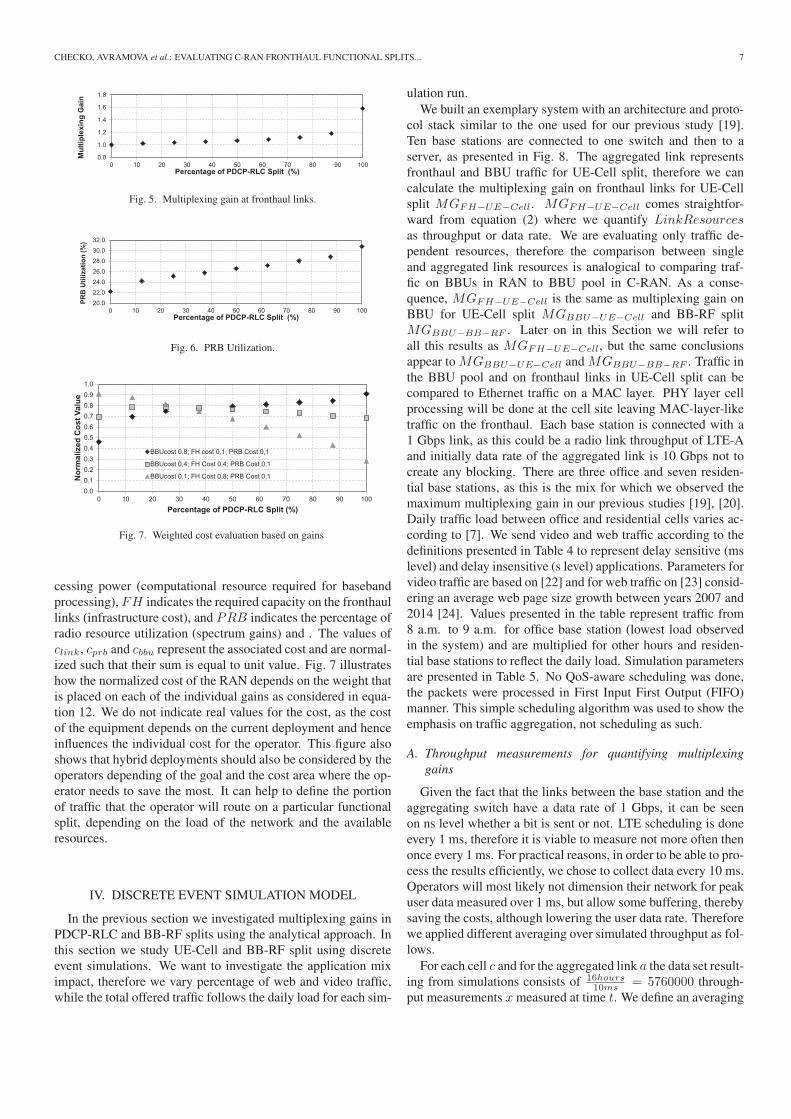
The results for each key indicator are given in Fig. 4 to Fig. 6.
As expected, the multiplexing gains in the BBU pool is in-
creasing as more traffic (cells with fully centralized baseband
processing) is aggregated at the BBU pool. In the previous
study [20] we have showed that as we aggregate more cells, the
aggregated traffic has a mean value that is sum of the mean val-
ues of the aggregated traffic, but the coefficient of the variation
is reduced, leading to more smooth traffic. The highest gains
occur when mixing cites with more complementary traffic pat-
ters, such as office and residential areas, but significant gains
are present even for random traffic as shown in Fig. 4. When
the total traffic is carried through the PDCP-RLC split, there is
no multiplexing gain as all resource are required at the RRHs
and cannot be shared. On the other hand, in case of full cen-
tralization, there is no multiplexing gains in fronthaul links as
the traffic is not depended on the load of the cells. As such the
multiplexing gain for 0% of PDCP-RLC split is 1 as shown in
Fig. 5. By using a factor of 16 for CPRI overload, we can see
that by increasing the percent of PDCP-RLC split, gain in the
fronthaul can be achieved. The maximum gain is achieved at
no centralization as the traffic in the fronthaul network becomes
fully load dependent. By looking equation (9), we can also con-
clude that the traffic load becomes high and almost constant,
multiplexing gains at the fronthaul will be reduced. If the traffic
load is low, and even more bursty, higher multiplexing gains can
be achieved. An other important metric is the physical resource
block utilization shown in Fig. 6 indicating resource efficiency
gains are reduced as we reduce the centralization percentage.
This is an important metric to be considered as either additional
effort need to be placed in order to provide multi-cell coopera-
tion, or the operator needs to be aware that channel utilization
will be increased when reducing the percentage of centraliza-
tion, in order to carry the same amount of traffic. By increasing
the channel utilization, the sensitivity of the overall system to
overload is reduced.
In order to evaluate the split percentage based on all three
criteria described above, the following cost weight function can
be defined:
costvalue = BBU · cbbu + FH · clink + PRB · cprb (12)
In equation (12), BBU indicates the required amount of pro-
CHECKO, AVRAMOVA et al.: EVALUATING C-RAN FRONTHAUL FUNCTIONAL SPLITS... 7
Fig. 5. Multiplexing gain at fronthaul links.
Fig. 6. PRB Utilization.
Fig. 7. Weighted cost evaluation based on gains
cessing power (computational resource required for baseband
processing), FH indicates the required capacity on the fronthaul
links (infrastructure cost), and PRB indicates the percentage of
radio resource utilization (spectrum gains) and . The values of
clink, cprb and cbbu represent the associated cost and are normal-
ized such that their sum is equal to unit value. Fig. 7 illustrates
how the normalized cost of the RAN depends on the weight that
is placed on each of the individual gains as considered in equa-
tion 12. We do not indicate real values for the cost, as the cost
of the equipment depends on the current deployment and hence
influences the individual cost for the operator. This figure also
shows that hybrid deployments should also be considered by the
operators depending of the goal and the cost area where the op-
erator needs to save the most. It can help to define the portion
of traffic that the operator will route on a particular functional
split, depending on the load of the network and the available
resources.
IV. DISCRETE EVENT SIMULATION MODEL
In the previous section we investigated multiplexing gains in
PDCP-RLC and BB-RF splits using the analytical approach. In
this section we study UE-Cell and BB-RF split using discrete
event simulations. We want to investigate the application mix
impact, therefore we vary percentage of web and video traffic,
while the total offered traffic follows the daily load for each sim-
ulation run.
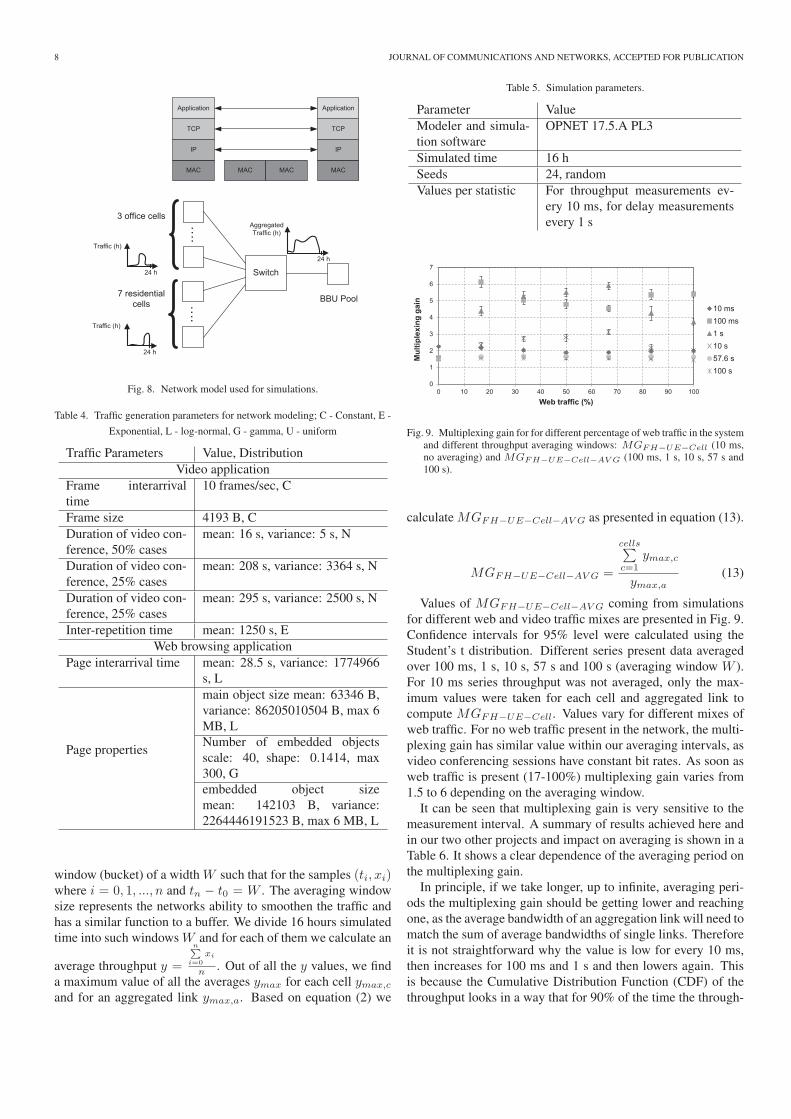
We built an exemplary system with an architecture and proto-
col stack similar to the one used for our previous study [19].
Ten base stations are connected to one switch and then to a
server, as presented in Fig. 8. The aggregated link represents
fronthaul and BBU traffic for UE-Cell split, therefore we can
calculate the multiplexing gain on fronthaul links for UE-Cell
split MGFH−UE−Cell. MGFH−UE−Cell comes straightfor-
ward from equation (2) where we quantify LinkResourcesas throughput or data rate. We are evaluating only traffic de-
pendent resources, therefore the comparison between single
and aggregated link resources is analogical to comparing traf-
fic on BBUs in RAN to BBU pool in C-RAN. As a conse-
quence, MGFH−UE−Cell is the same as multiplexing gain on
BBU for UE-Cell split MGBBU−UE−Cell and BB-RF split
MGBBU−BB−RF . Later on in this Section we will refer to
all this results as MGFH−UE−Cell, but the same conclusions
appear to MGBBU−UE−Cell and MGBBU−BB−RF . Traffic in
the BBU pool and on fronthaul links in UE-Cell split can be
compared to Ethernet traffic on a MAC layer. PHY layer cell
processing will be done at the cell site leaving MAC-layer-like
traffic on the fronthaul. Each base station is connected with a
1 Gbps link, as this could be a radio link throughput of LTE-A
and initially data rate of the aggregated link is 10 Gbps not to
create any blocking. There are three office and seven residen-
tial base stations, as this is the mix for which we observed the
maximum multiplexing gain in our previous studies [19], [20].
Daily traffic load between office and residential cells varies ac-
cording to [7]. We send video and web traffic according to the
definitions presented in Table 4 to represent delay sensitive (ms
level) and delay insensitive (s level) applications. Parameters for
video traffic are based on [22] and for web traffic on [23] consid-
ering an average web page size growth between years 2007 and
2014 [24]. Values presented in the table represent traffic from
8 a.m. to 9 a.m. for office base station (lowest load observed
in the system) and are multiplied for other hours and residen-
tial base stations to reflect the daily load. Simulation parameters
are presented in Table 5. No QoS-aware scheduling was done,
the packets were processed in First Input First Output (FIFO)
manner. This simple scheduling algorithm was used to show the
emphasis on traffic aggregation, not scheduling as such.
A. Throughput measurements for quantifying multiplexinggains
Given the fact that the links between the base station and the
aggregating switch have a data rate of 1 Gbps, it can be seen
on ns level whether a bit is sent or not. LTE scheduling is done
every 1 ms, therefore it is viable to measure not more often then
once every 1 ms. For practical reasons, in order to be able to pro-
cess the results efficiently, we chose to collect data every 10 ms.
Operators will most likely not dimension their network for peak
user data measured over 1 ms, but allow some buffering, thereby
saving the costs, although lowering the user data rate. Therefore
we applied different averaging over simulated throughput as fol-
lows.
For each cell c and for the aggregated link a the data set result-
ing from simulations consists of 16hours10ms = 5760000 through-
put measurements x measured at time t. We define an averaging
8 JOURNAL OF COMMUNICATIONS AND NETWORKS, ACCEPTED FOR PUBLICATION
Fig. 8. Network model used for simulations.
Table 4. Traffic generation parameters for network modeling; C - Constant, E -
Exponential, L - log-normal, G - gamma, U - uniform
Traffic Parameters Value, Distribution
Video application
Frame interarrival
time
10 frames/sec, C
Frame size 4193 B, C
Duration of video con-
ference, 50% cases
mean: 16 s, variance: 5 s, N
Duration of video con-
ference, 25% cases
mean: 208 s, variance: 3364 s, N
Duration of video con-
ference, 25% cases
mean: 295 s, variance: 2500 s, N
Inter-repetition time mean: 1250 s, E
Web browsing application
Page interarrival time mean: 28.5 s, variance: 1774966
s, L
Page properties
main object size mean: 63346 B,
variance: 86205010504 B, max 6
MB, L
Number of embedded objects
scale: 40, shape: 0.1414, max
300, G
embedded object size
mean: 142103 B, variance:
2264446191523 B, max 6 MB, L
window (bucket) of a width W such that for the samples (ti, xi)where i = 0, 1, ..., n and tn − t0 = W . The averaging window
size represents the networks ability to smoothen the traffic and
has a similar function to a buffer. We divide 16 hours simulated
time into such windows W and for each of them we calculate an
average throughput y =
n∑
i=0
xi
n . Out of all the y values, we find
a maximum value of all the averages ymax for each cell ymax,c
and for an aggregated link ymax,a. Based on equation (2) we
Table 5. Simulation parameters.
Parameter Value
Modeler and simula-
tion software
OPNET 17.5.A PL3
Simulated time 16 h
Seeds 24, random
Values per statistic For throughput measurements ev-
ery 10 ms, for delay measurements
every 1 s
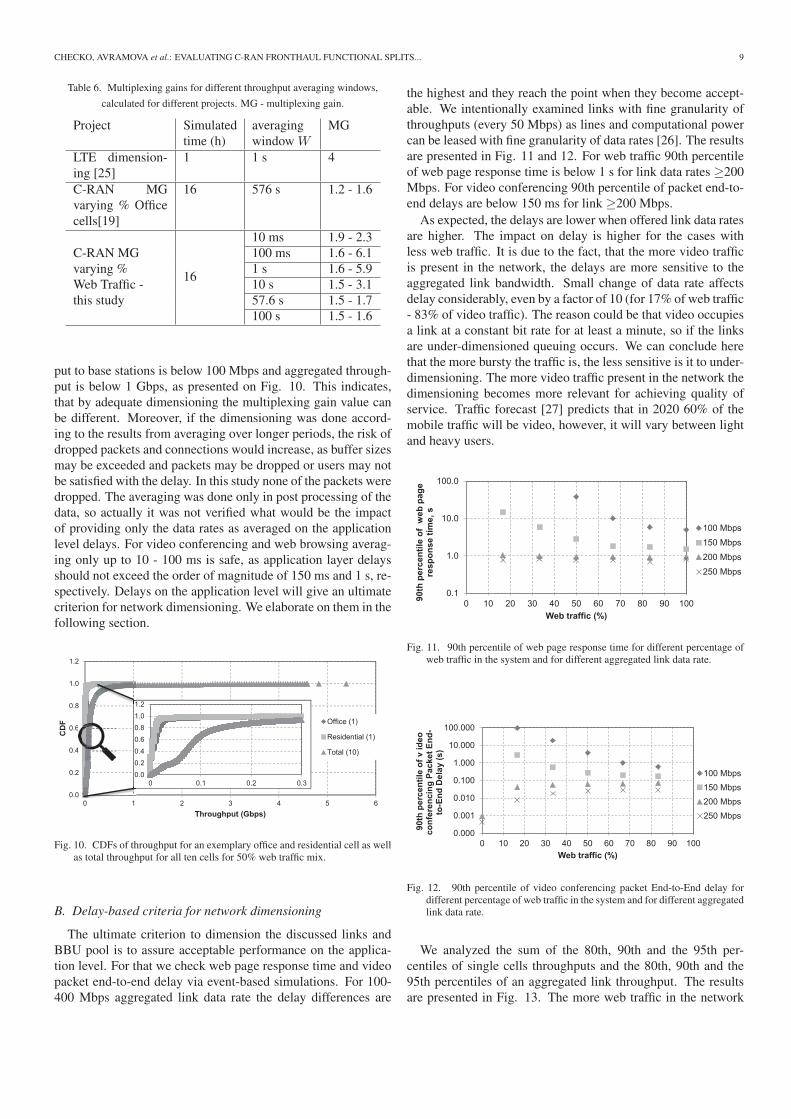
Fig. 9. Multiplexing gain for for different percentage of web traffic in the systemand different throughput averaging windows: MGFH−UE−Cell (10 ms,no averaging) and MGFH−UE−Cell−AV G (100 ms, 1 s, 10 s, 57 s and100 s).
calculate MGFH−UE−Cell−AVG as presented in equation (13).
MGFH−UE−Cell−AVG =
cells∑c=1
ymax,c
ymax,a(13)
Values of MGFH−UE−Cell−AVG coming from simulations
for different web and video traffic mixes are presented in Fig. 9.
Confidence intervals for 95% level were calculated using the
Student’s t distribution. Different series present data averaged
over 100 ms, 1 s, 10 s, 57 s and 100 s (averaging window W ).
For 10 ms series throughput was not averaged, only the max-
imum values were taken for each cell and aggregated link to
compute MGFH−UE−Cell. Values vary for different mixes of
web traffic. For no web traffic present in the network, the multi-
plexing gain has similar value within our averaging intervals, as
video conferencing sessions have constant bit rates. As soon as
web traffic is present (17-100%) multiplexing gain varies from
1.5 to 6 depending on the averaging window.
It can be seen that multiplexing gain is very sensitive to the
measurement interval. A summary of results achieved here and
in our two other projects and impact on averaging is shown in a
Table 6. It shows a clear dependence of the averaging period on
the multiplexing gain.
In principle, if we take longer, up to infinite, averaging peri-
ods the multiplexing gain should be getting lower and reaching
one, as the average bandwidth of an aggregation link will need to
match the sum of average bandwidths of single links. Therefore
it is not straightforward why the value is low for every 10 ms,
then increases for 100 ms and 1 s and then lowers again. This
is because the Cumulative Distribution Function (CDF) of the
throughput looks in a way that for 90% of the time the through-
CHECKO, AVRAMOVA et al.: EVALUATING C-RAN FRONTHAUL FUNCTIONAL SPLITS... 9
Table 6. Multiplexing gains for different throughput averaging windows,
calculated for different projects. MG - multiplexing gain.
Project Simulated
time (h)
averaging
window WMG
LTE dimension-
ing [25]
1 1 s 4
C-RAN MG
varying % Office
cells[19]
16 576 s 1.2 - 1.6
C-RAN MG
varying %
Web Traffic -
this study
16
10 ms 1.9 - 2.3
100 ms 1.6 - 6.1
1 s 1.6 - 5.9
10 s 1.5 - 3.1
57.6 s 1.5 - 1.7
100 s 1.5 - 1.6
put to base stations is below 100 Mbps and aggregated through-
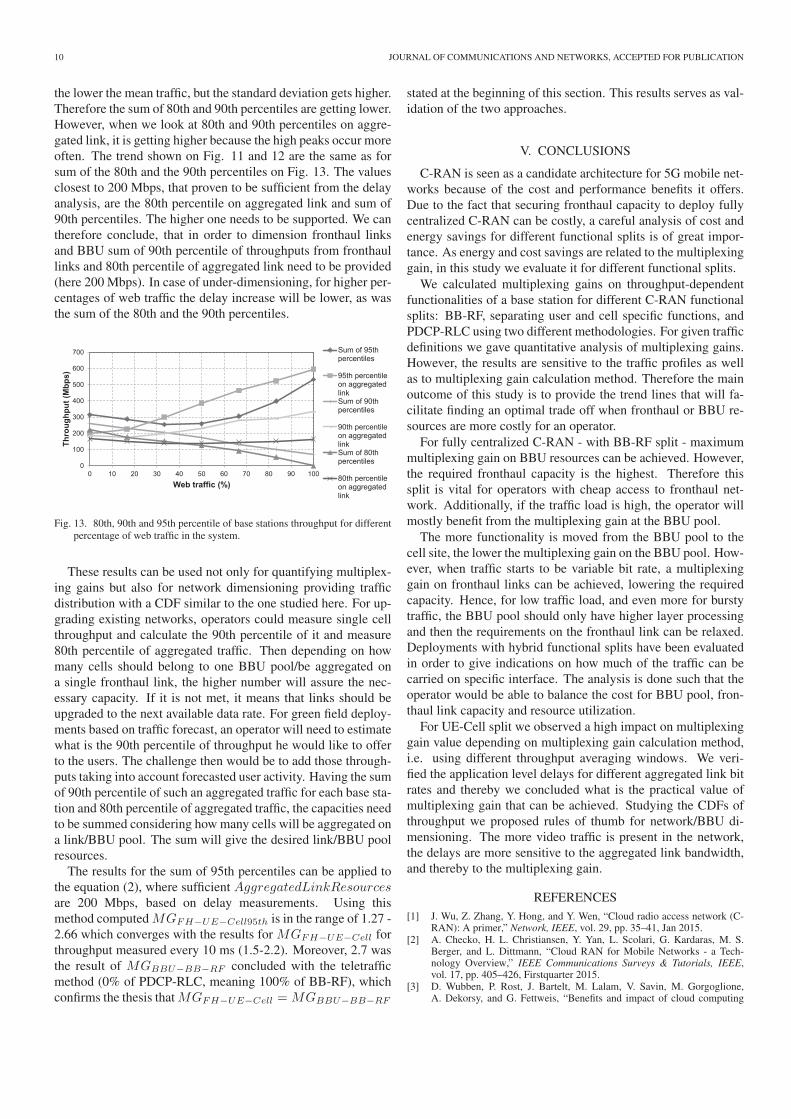
put is below 1 Gbps, as presented on Fig. 10. This indicates,
that by adequate dimensioning the multiplexing gain value can
be different. Moreover, if the dimensioning was done accord-
ing to the results from averaging over longer periods, the risk of
dropped packets and connections would increase, as buffer sizes
may be exceeded and packets may be dropped or users may not
be satisfied with the delay. In this study none of the packets were
dropped. The averaging was done only in post processing of the
data, so actually it was not verified what would be the impact
of providing only the data rates as averaged on the application
level delays. For video conferencing and web browsing averag-
ing only up to 10 - 100 ms is safe, as application layer delays
should not exceed the order of magnitude of 150 ms and 1 s, re-
spectively. Delays on the application level will give an ultimate
criterion for network dimensioning. We elaborate on them in the
following section.
Fig. 10. CDFs of throughput for an exemplary office and residential cell as wellas total throughput for all ten cells for 50% web traffic mix.
B. Delay-based criteria for network dimensioning
The ultimate criterion to dimension the discussed links and
BBU pool is to assure acceptable performance on the applica-
tion level. For that we check web page response time and video
packet end-to-end delay via event-based simulations. For 100-
400 Mbps aggregated link data rate the delay differences are
the highest and they reach the point when they become accept-
able. We intentionally examined links with fine granularity of
throughputs (every 50 Mbps) as lines and computational power
can be leased with fine granularity of data rates [26]. The results
are presented in Fig. 11 and 12. For web traffic 90th percentile
of web page response time is below 1 s for link data rates ≥200
Mbps. For video conferencing 90th percentile of packet end-to-
end delays are below 150 ms for link ≥200 Mbps.
As expected, the delays are lower when offered link data rates
are higher. The impact on delay is higher for the cases with
less web traffic. It is due to the fact, that the more video traffic
is present in the network, the delays are more sensitive to the
aggregated link bandwidth. Small change of data rate affects
delay considerably, even by a factor of 10 (for 17% of web traffic
- 83% of video traffic). The reason could be that video occupies
a link at a constant bit rate for at least a minute, so if the links
are under-dimensioned queuing occurs. We can conclude here
that the more bursty the traffic is, the less sensitive is it to under-
dimensioning. The more video traffic present in the network the
dimensioning becomes more relevant for achieving quality of
service. Traffic forecast [27] predicts that in 2020 60% of the
mobile traffic will be video, however, it will vary between light
and heavy users.
Fig. 11. 90th percentile of web page response time for different percentage ofweb traffic in the system and for different aggregated link data rate.
Fig. 12. 90th percentile of video conferencing packet End-to-End delay fordifferent percentage of web traffic in the system and for different aggregatedlink data rate.
We analyzed the sum of the 80th, 90th and the 95th per-
centiles of single cells throughputs and the 80th, 90th and the
95th percentiles of an aggregated link throughput. The results
are presented in Fig. 13. The more web traffic in the network
10 JOURNAL OF COMMUNICATIONS AND NETWORKS, ACCEPTED FOR PUBLICATION
the lower the mean traffic, but the standard deviation gets higher.
Therefore the sum of 80th and 90th percentiles are getting lower.
However, when we look at 80th and 90th percentiles on aggre-
gated link, it is getting higher because the high peaks occur more
often. The trend shown on Fig. 11 and 12 are the same as for
sum of the 80th and the 90th percentiles on Fig. 13. The values
closest to 200 Mbps, that proven to be sufficient from the delay
analysis, are the 80th percentile on aggregated link and sum of
90th percentiles. The higher one needs to be supported. We can
therefore conclude, that in order to dimension fronthaul links
and BBU sum of 90th percentile of throughputs from fronthaul
links and 80th percentile of aggregated link need to be provided
(here 200 Mbps). In case of under-dimensioning, for higher per-
centages of web traffic the delay increase will be lower, as was
the sum of the 80th and the 90th percentiles.
Fig. 13. 80th, 90th and 95th percentile of base stations throughput for differentpercentage of web traffic in the system.
These results can be used not only for quantifying multiplex-
ing gains but also for network dimensioning providing traffic
distribution with a CDF similar to the one studied here. For up-
grading existing networks, operators could measure single cell
throughput and calculate the 90th percentile of it and measure
80th percentile of aggregated traffic. Then depending on how
many cells should belong to one BBU pool/be aggregated on
a single fronthaul link, the higher number will assure the nec-
essary capacity. If it is not met, it means that links should be
upgraded to the next available data rate. For green field deploy-
ments based on traffic forecast, an operator will need to estimate
what is the 90th percentile of throughput he would like to offer
to the users. The challenge then would be to add those through-
puts taking into account forecasted user activity. Having the sum
of 90th percentile of such an aggregated traffic for each base sta-
tion and 80th percentile of aggregated traffic, the capacities need
to be summed considering how many cells will be aggregated on
a link/BBU pool. The sum will give the desired link/BBU pool
resources.
The results for the sum of 95th percentiles can be applied to
the equation (2), where sufficient AggregatedLinkResourcesare 200 Mbps, based on delay measurements. Using this
method computed MGFH−UE−Cell95th is in the range of 1.27 -
2.66 which converges with the results for MGFH−UE−Cell for
throughput measured every 10 ms (1.5-2.2). Moreover, 2.7 was
the result of MGBBU−BB−RF concluded with the teletraffic
method (0% of PDCP-RLC, meaning 100% of BB-RF), which
confirms the thesis that MGFH−UE−Cell = MGBBU−BB−RF
stated at the beginning of this section. This results serves as val-
idation of the two approaches.
V. CONCLUSIONS
C-RAN is seen as a candidate architecture for 5G mobile net-
works because of the cost and performance benefits it offers.
Due to the fact that securing fronthaul capacity to deploy fully
centralized C-RAN can be costly, a careful analysis of cost and
energy savings for different functional splits is of great impor-
tance. As energy and cost savings are related to the multiplexing
gain, in this study we evaluate it for different functional splits.
We calculated multiplexing gains on throughput-dependent
functionalities of a base station for different C-RAN functional
splits: BB-RF, separating user and cell specific functions, and
PDCP-RLC using two different methodologies. For given traffic
definitions we gave quantitative analysis of multiplexing gains.
However, the results are sensitive to the traffic profiles as well
as to multiplexing gain calculation method. Therefore the main
outcome of this study is to provide the trend lines that will fa-
cilitate finding an optimal trade off when fronthaul or BBU re-
sources are more costly for an operator.
For fully centralized C-RAN - with BB-RF split - maximum
multiplexing gain on BBU resources can be achieved. However,
the required fronthaul capacity is the highest. Therefore this
split is vital for operators with cheap access to fronthaul net-
work. Additionally, if the traffic load is high, the operator will
mostly benefit from the multiplexing gain at the BBU pool.
The more functionality is moved from the BBU pool to the
cell site, the lower the multiplexing gain on the BBU pool. How-
ever, when traffic starts to be variable bit rate, a multiplexing
gain on fronthaul links can be achieved, lowering the required
capacity. Hence, for low traffic load, and even more for bursty
traffic, the BBU pool should only have higher layer processing
and then the requirements on the fronthaul link can be relaxed.
Deployments with hybrid functional splits have been evaluated
in order to give indications on how much of the traffic can be
carried on specific interface. The analysis is done such that the
operator would be able to balance the cost for BBU pool, fron-
thaul link capacity and resource utilization.
For UE-Cell split we observed a high impact on multiplexing
gain value depending on multiplexing gain calculation method,
i.e. using different throughput averaging windows. We veri-
fied the application level delays for different aggregated link bit
rates and thereby we concluded what is the practical value of
multiplexing gain that can be achieved. Studying the CDFs of
throughput we proposed rules of thumb for network/BBU di-
mensioning. The more video traffic is present in the network,
the delays are more sensitive to the aggregated link bandwidth,
and thereby to the multiplexing gain.
REFERENCES
[1] J. Wu, Z. Zhang, Y. Hong, and Y. Wen, “Cloud radio access network (C-RAN): A primer,” Network, IEEE, vol. 29, pp. 35–41, Jan 2015.
[2] A. Checko, H. L. Christiansen, Y. Yan, L. Scolari, G. Kardaras, M. S.Berger, and L. Dittmann, “Cloud RAN for Mobile Networks - a Tech-nology Overview,” IEEE Communications Surveys & Tutorials, IEEE,vol. 17, pp. 405–426, Firstquarter 2015.
[3] D. Wubben, P. Rost, J. Bartelt, M. Lalam, V. Savin, M. Gorgoglione,A. Dekorsy, and G. Fettweis, “Benefits and impact of cloud computing
CHECKO, AVRAMOVA et al.: EVALUATING C-RAN FRONTHAUL FUNCTIONAL SPLITS... 11
on 5g signal processing: Flexible centralization through cloud-ran,” Sig-nal Processing Magazine, IEEE, vol. 31, pp. 35–44, Nov 2014.
[4] “Small Cell Virtualization Functional Splits and Use Cases ,” tech. rep.,Small Cell Forum, June 2015.
[5] P. Rost, C. Bernardos, A. Domenico, M. Girolamo, M. Lalam, A. Maeder,D. Sabella, and D. Wubben, “Cloud technologies for flexible 5g radioaccess networks,” Communications Magazine, IEEE, vol. 52, pp. 68–76,May 2014.
[6] “Next Generation Fronthaul Interface,” tech. rep., China Mobile ResearchInstitute, June 2015.
[7] “C-RAN The Road Towards Green RAN,” tech. rep., China Mobile Re-search Institute, October 2011.
[8] “White Paper of Next Generation Fronthaul Interface,” tech. rep., ChinaMobile Research Institute, Alcatel-Lucent, Nokia Networks, ZTE Cor-poration, Broadcom Corporation, Intel China Research Center, October2015.
[9] U. Dotsch, M. Doll, H.-P. Mayer, F. Schaich, J. Segel, and P. Sehier,“Quantitative analysis of split base station processing and determinationof advantageous architectures for LTE,” vol. 18, pp. 105–128, June 2013.
[10] C. Chen, “The Notion of overbooking and Its Application to IP/MPLSTraffic Engineering,” Request for Comments: internet draft <draft-cchen-te-overbooking-01.txt>, November 2001.
[11] Robert B. Cooper and Daniel P. Heyman, “Teletraffic Theory and Engi-neering,” Encyclopedia of Telecommunications, vol. 16, no. 1, pp. 453–483, 1998.
[12] V. B. Iversen, Teletraffic Engineering. Chapter 7: Multi-dimensional losssystems. Technical University of Denmark, 2013.
[13] M. Stasiak, M. Głabowski, A. Wisniewski, and P. Zwierzykowski, Model-ing and dimensioning of mobile networks : from GSM to LTE. John Wiley& Sons Ltd., 2011.
[14] T. Werthmann, H. Grob-Lipski, and M. Proebster, “Multiplexing gainsachieved in pools of baseband computation units in 4g cellular networks,”in Personal Indoor and Mobile Radio Communications (PIMRC), 2013IEEE 24th International Symposium on, pp. 3328–3333, Sept 2013.
[15] S. Bhaumik, S. P. Chandrabose, M. K. Jataprolu, A. Muralidhar, V. Srini-vasan, G. Kumar, P. Polakos, and T. Woo, “CloudIQ: A framework forprocessing base stations in a data center,” Proceedings of the Annual Inter-national Conference on Mobile Computing and Networking, MOBICOM,pp. 125–136, 2012.
[16] S. Namba, T. Matsunaka, T. Warabino, S. Kaneko, and Y. Kishi, “Colony-RAN architecture for future cellular network,” in Future Network MobileSummit (FutureNetw), 2012, pp. 1 –8, July 2012.
[17] M. Madhavan, P. Gupta, and M. Chetlur, “Quantifying multiplexing gainsin a wireless network cloud,” in Communications (ICC), 2012 IEEE Inter-national Conference on, pp. 3212–3216, 2012.
[18] J. Liu, S. Zhou, J. Gong, Z. Niu, and S. Xu, “On the statistical multiplexinggain of virtual base station pools,” in Global Communications Conference(GLOBECOM), 2014 IEEE, pp. 2283–2288, Dec 2014.
[19] A. Checko, H. Holm, and H. Christiansen, “Optimizing small cell deploy-ment by the use of C-RANs,” in European Wireless 2014 (EW 2014).
[20] A. Avramova, H. Christiansen, and V. Iversen, “Cell deployment op-timization for cloud radio access networks using teletraffic theory,” inThe Eleventh Advanced International Conference on Telecommunications,AICT 2015.
[21] V. B. Iversen, “The Exact Evaluation of Multi-Service Loss Systems withAccess Control,” Teleteknik, English ed., vol. 31, pp. 56–61, Firstquarter1987.
[22] X. Cheng, “Understanding the characteristics of internet short video shar-ing: Youtube as a case study,” in Procs of the 7th ACM SIGCOMM Con-ference on Internet Measurement, San Diego (CA, USA), 15, p. 28, 2007.
[23] J. J. Lee and M. Gupta, “A new traffic model for current user web browsingbehavior,” tech. rep., Intel, 2007.
[24] “Average Web Page Breaks 1600K.” [cited: June 2015].
[25] A. Checko, L. Ellegaard, and M. Berger, “Capacity planning for carrierethernet lte backhaul networks,” in Wireless Communications and Net-working Conference (WCNC), 2012 IEEE, pp. 2741–2745, April 2012.
[26] Metro Ethernet Forum, “EVC Ethernet Services Definitions Phase 3, Tech.Spec. MEF 6.2,” July 2014.
[27] “Mobility Report,” tech. rep., Ericsson, June 2015.
Aleksandra Checko holds a M.Sc. degrees intelecommunication from Technical University of Den-mark (DTU) and Technical University of Lodz,Poland (PŁ) (2011). She is now pursuing industrialPh.D. studies with DTU Fotonik (in the NetworksTechnology and Service Platforms Group) and MTIRadiocomp. She participated in a Danish nationalproject SAIRS and a European project HARP. Her in-terests include mobile networks, especially their archi-tecture, protocols, synchronization and capacity plan-ning methods.
Andrijana P. Avramova has received her M.Sc. de-gree in telecommunication from the Technical Univer-sity of Denmark (DTU) in 2008. She is now pur-suing Ph.D. studies with DTU Fotonik (in the Net-works Technology and Service Platforms Group). Shehas participated in a Danish national project SAIRS.Her research interests are mainly related to heteroge-neous mobile networks, especially resource manage-ment and cross tier optimizations.
Michael S. Berger received the M.Sc. E.E. and Ph.D.from the Technical University of Denmark in 1998and 2004. He is currently Associate Professor atthe university within the area of switching and net-work node design. He has been involved in the ISTproject ESTA (Ethernet at 10 Gigabit and Above),IST project MUPBED. Previously, he was leading aproject on next generation IP and Carrier Ethernet net-works partly funded by the Danish National AdvancedTechnology Foundation. He is currently Dissemina-tion Manager in EU project MODUS and board mem-
ber of several national research projects.
Henrik L. Christiansen is an Associate Professorin mobile communication at the Technical Universityof Denmark, where he also received his M.Sc.E.E.and Ph.D., specializing in telecommunications. Healso has several years of experience from the tele-com industry. His main areas of research are mobilenetwork architectures, mobile fronthaul and backhaulnetworks.