PERFORMANCE ANALYSIS OF PALM, JATROPHA AND...
135
1 PERFORMANCE ANALYSIS OF PALM, JATROPHA AND MORINGA BIODIESELS IN A DIESEL ENGINE MD. MOFIJUR RAHMAN DISSERTATION SUBMITTED IN FULFILMENT OF THE REQUIREMENTS FOR THE DEGREE OF MASTER OF ENGINEERING SCIENCE FACULTY OF ENGINEERING UNIVERSITY OF MALAYA KUALA LUMPUR 2013
Transcript of PERFORMANCE ANALYSIS OF PALM, JATROPHA AND...
1
PERFORMANCE ANALYSIS OF PALM, JATROPHA AND
MORINGA BIODIESELS IN A DIESEL ENGINE
MD. MOFIJUR RAHMAN
DISSERTATION SUBMITTED IN FULFILMENT
OF THE REQUIREMENTS FOR THE
DEGREE OF MASTER OF ENGINEERING SCIENCE
FACULTY OF ENGINEERING
UNIVERSITY OF MALAYA
KUALA LUMPUR
2013

ii
ABSTRACT
The global energy consumption is expected to grow in a faster rate than the population
growth. By 2030, an increase of 53% of global energy consumption and 39% of greenhouse
gases emissions from fossil fuels are anticipated. Therefore, it has become a global agenda
to develop clean alternative fuels which are domestically available, environmentally
acceptable and technically feasible. As an alternative fuel, biodiesel seems as one of the
best choices among other sources due to its environment friendly aspect and similar
functional properties as diesel fuel. This research aims to produce biodiesel from some
edible and non-edible oils that are either readily available or have native distribution in
Malaysia. These oils include; Palm (Elaeis guineensis), Jatropha curcas and Moringa
oleifera oils. This was followed by a detailed investigation of physic-chemical properties of
the produced methyl esters such as kinematic viscosity, density, flash point, cloud point,
pour point, cold filter plugging point, viscosity index and oxidation stability. This research
also discusses the concept of biodiesel-diesel blending to improve some of the properties.
Moreover, 5%, 10%, 15% and 20% by volume blends of Palm, Jatropha curcas and
Moringa oleifera were used to evaluate their performance in a Mitsubishi Pajero
turbocharged diesel engine. According to the results of the investigation, the produced
methyl esters meet biodiesel standard specification. Moreover, blending of biodiesel with
diesel fuel improves their fuel properties. The results of engine performance indicated that
over the entire range of speed, biodiesel blended fuels give average reduction in torque,
brake power and increased brake specific fuel consumption values compared to diesel fuel.
In case of engine emission, biodiesel blended fuels give an average reduction in carbon
monoxide and hydrocarbon emissions whereas slightly increased nitric oxides and carbon
iii
dioxides emissions respectively compared to diesel fuel. Overall, Palm biodiesel blended
fuel showed better performance than Jatropha curcas and Moringa oleifera biodiesel
blended fuels. In conclusion, Palm, Jatropha curcas and Moringa oleifera are potential
feedstock for biodiesel production, and up to 20% of their blends should be considered to
replace diesel fuel without engine modification to reduce the dependency on petro-diesel
and produce cleaner exhaust emissions.

iv
ABSTRAK
Kadar penggunaan tenaga global dijangka berkembang lebih cepat daripada kadar
pertumbuhan penduduk. Pada tahun 2030, peningkatan dijangkakan sebanyak 53% dalam
penggunaan tenaga global dan peningkatan juga dijangkakan sebanyak 39% dalam
pelepasan gas rumah hijau daripada bahan api fosil. Oleh itu, ini menjadi satu agenda
global untuk membangunkan bahan api alternatif bersih yang terdapat dalam negara, yang
mesra alam-sekitar dan yang boleh dilaksanakan secara teknikal. Sebagai bahan api
alternatif, biodiesel merupakan salah satu pilihan yang terbaik di kalangan sumber-sumber
lain kerana sifat mesra alam-sekitar dan ia mempunyai ciri-ciri fungsi yang sama seperti
bahan api diesel. Kajian ini bertujuan untuk menghasilkan biodiesel daripada beberapa
minyak yang boleh dimakan dan yang tidak boleh dimakan, sama ada yang sedia-ada atau
yang mempunyai pengedaran di dalam Malaysia. Minyak ini termasuk; minyak sawit,
Jatropha curcas dan Moringa oleifera. Ini diikuti dengan penyiasatan sifat fizik-kimia
untuk biodiesel yang dihasilkan, separti kelikatan kinematic, ketumpatan, takat kilat, takat
tidak-larut, takat boleh-dituang, sejuk penapis memasang mata, indeks kelikatan dan
kestabilan pengoksidaan. Kajian ini juga membincangkan konsep campuran biodiesel-
diesel untik memperbaiki beberapa ciri-ciri bahan suapan ini. Selain itu, campuran 5%,
10%, 15% dan 20% sawit, Jatropha curcas dan Moringa oleifera telah dijalankan untuk
menilai prestasi mereka dalam Enjin Diesel Turbo, iaitu Mitsubishi Pajero. Menurut
penyiasatan, biodiesel yang dihasilkan memenuhi spesifikasis piawai biodiesel dan
campuran biodiesel dengan diesel meningkatkan sifat-sifat bahan api tersebut. Keputusan
prestasi enjin menunjukkan bahawa pada pelbagai kelajuan, bahan api biodiesel yang
dicampur memberikan pengurangan tork purata, pengurangan kuasa brek dan

v
meningkatkan nilai-nilai penggunaan bahan api brek tertentu berbanding dengan bahan api
diesel. Dalam kes pelepasan gas enjin, bahan api campuran biodiesel memberikan
pengurangan yang berpurata dalam pelepasan karbon monoksida dan pelepasan
hidrokarbon. Manakala terdapat sedikit peningkatan dalam pelepasan nitrus oksida dan
pelepasan karbon dioksida berbanding dengan bahan api diesel. Keseluruhan, campuran
bahan api biodiesel menunjukkan prestasi yang lebih baik berbanding dengan campuran
bahan api biodiesel sawit, Jatropha curcas dan Moringa oleifera. Kesimpulannya, sawit,
Jatropha curcas dan Moringa oleifera adalah bahan-bahan mentah yang berpotensi untuk
pengeluaran biodiesel, dan sebanyak 20% daripada campuran bahan-bahan tersebut boleh
menggantikan bahan api diesel tanpa penguabahsuaian enjin untuk mengurangkan
pergantungan kepada petro-diesel dan akan menghasilkan pelepasan ekzos yang bersih.

vi
University of Malaya
ORIGINAL LITERARY WORK DECLARATION
Name of the candidate: Md. Mofijur Rahman (AA 3181159)
Registration/Matric No: KGA110004
Name of the Degree: Master of Science in Engineering
Title of Thesis: Experimental Studies of Biodiesel Fuel from Edible and Non-Edible
Oil Sources in a Diesel Engine
Field of Study: Energy
I do solemnly and sincerely declare that:
(1) I am the sole author/ writer of the work;
(2) This work is original;
(3) Any use of any work in which copyright exists was done by way of fair dealings
and any expert or extract from or reference to or reproduction of any copyright work
has been disclosed expressly and sufficiently and the title of the work and tis
authorship has been acknowledged in this work;
(4) I do not have any actual knowledge nor do I ought to reasonably to know that the
making of this work constitutes an infringement of any copyright work;
(5) I hereby assign all and every rights in the copyright to this work to the University of
Malaya (UM), who henceforth shall be the owner of the copyright in this work and
that any reproduction or use in any form or by any means whatsoever is prohibited
without the written consent of UM having been first had and obtained actual
knowledge;
(6) I am fully aware that if in the course of making this work I have infringed any
copyright whether internationally or otherwise, I may be subject to legal action or
any other action as may be determined by UM.
Candidate’s Signature Date:
Subscribed and solemnly declared before,
Witness Signature
Name:
Designation

vii
ACKNOWLEDGEMENTS
In the name of Allah, the most Merciful and Generous. Should all the praises upon him, for
giving me the fortitude and aptitude to complete this thesis.
I would like to special thanks to my supervisors Professor Dr. Masjuki Hj. Hassan and Dr.
Md. Abul Kalam for their helpful guidance, encouragement and assistance throughout this
works. I also express my gratitude to the Ministry of Higher Education (MOHE) for HIR
Grant for the financial support through project no. UM.C/HIR/MOHE/ENG/07. I also
would like to convey appreciation to all lectures and staff of the Department of
Mechanical Engineering, University of Malaya for giving opportunity to prepare and
conduct this research. I also would like to thank Mr. Abdelaziz Emad Atabani and all
members in “Centre for Energy Sciences” research group for their valuable ideas and
discussion.
Additional Thanks to Mr. Sulaiman Ariffin, Mr. Kamarul Bahrin Bin Musa, Mr. Asri and
Mr. Nur Azam Ali for their technical help and assistance.
Last but not least, take pleasure in acknowledgement the continued encouragement and
moral support of my parents, my brothers and sisters and my wife. Also I would like to
thank my research partners for their encouragement and support. Their help, advices and
ideas had contributed a lot toward the success of this thesis.

viii
Dedicated to my beloved
Father, Md. Abdur Rashid Forazy
Mother, Rahima Khatun
For their unconditional love and encouragement

ix
TABLE OF CONTENTS
ABSTRACT .......................................................................................................................... ii
ABSTRAK ........................................................................................................................... iv
ORIGINAL LITERARY WORK DECLARATION ....................................................... vi
ACKNOWLEDGEMENTS ............................................................................................... vii
TABLE OF CONTENTS .................................................................................................... ix
LIST OF TABLES ............................................................................................................ xiv
LIST OF FIGURES ........................................................................................................... xv
LIST OF ABBREVIATION ............................................................................................. xix
CHAPTER 1 INTRODUCTION ........................................................................................ 1
1.0 Introduction ............................................................................................................. 1
1.1 Overview of Global Energy Scenario ..................................................................... 1
1.2 Overview of Malaysian Energy Scenario ................................................................ 2
1.3 Increasing Environment Pollution ........................................................................... 3
1.4 Background ............................................................................................................. 4
1.5 Research Objectives ................................................................................................ 6
1.6 Scope of the Work ................................................................................................... 6
1.7 Organization of Dissertation ................................................................................... 7
CHAPTER 2 LITERATURE REVIEW ............................................................................ 9
2.0 Introduction ............................................................................................................. 9
2.1 Impact of Diesel Engine Emission on Environment and Human Health ................ 9
2.2 Development of Biodiesel in Malaysia ................................................................. 10

x
2.3 Sources (Feedstocks) of Biodiesel ........................................................................ 11
2.4 Production of Biodiesel ......................................................................................... 12
2.4.1 Pyrolysis ......................................................................................................... 13
2.4.2 Blending of Crude Oils or Dilution ................................................................ 13
2.4.3 Micro-Emulsification ..................................................................................... 13
2.4.4 Transesterification .......................................................................................... 14
2.5 Factors Affecting the Transesterification Process ................................................. 15
2.6 Standards and Properties of Biodiesel ................................................................... 16
2.7 Impact of Biodiesel from Various Feedstocks on Engine Performance and
Emissions Characteristics ................................................................................................ 18
2.7.1 Canola (Rapeseed) ......................................................................................... 18
2.7.2 Soybean .......................................................................................................... 19
2.7.3 Mahua (Madhuca Indica) ............................................................................... 19
2.7.4 Jojoba ............................................................................................................. 20
2.7.5 Neem .............................................................................................................. 20
2.7.6 Pistacia Chinensis Bunge ............................................................................... 21
2.7.7 Beef Tallow .................................................................................................... 21
2.7.8 Palm ............................................................................................................... 22
2.7.9 Jatropha Curcas ............................................................................................. 24
2.7.10 Moringa Oleifera ........................................................................................... 25
CHAPTER 3 METHODOLOGY AND EXPERIMENTAL SET UP ........................... 28

xi
3.0 Introduction ........................................................................................................... 28
3.1 Structure of Research Methodology ...................................................................... 28
3.2 Selection of Biodiesel Feedstocks ......................................................................... 30
3.3 Biodiesel Production ............................................................................................. 31
3.3.1 Pretreatment Process ...................................................................................... 32
3.3.2 Esterification Process ..................................................................................... 32
3.3.3 Transesterification Process............................................................................. 33
3.3.4 Post-Treatment Process .................................................................................. 33
3.4 Determination of Fatty Acid Composition ............................................................ 35
3.5 FT-IR Analysis ...................................................................................................... 35
3.6 Fuel Properties Measuring Procedure and Equipment .......................................... 35
3.6.1 Dynamic Viscosity, Kinematic Viscosity, Density and Viscosity Index
Measurement ................................................................................................................ 36
3.6.2 Flash Point Measurement ............................................................................... 38
3.6.3 Calorific Value Measurement ........................................................................ 39
3.6.4 Oxidation Stability ......................................................................................... 41
3.6.5 Cloud Point and Pour Point ............................................................................ 43
3.6.6 Cold Filter Plugging Point ............................................................................. 44
3.6.7 Determination of Acid Value, the Saponification Number (SN), Iodine Value
(IV) and Cetane Number (CN) ..................................................................................... 45
3.7 Biodiesel-Diesel Blending ..................................................................................... 46

xii
3.8 Engine Set-Up and Engine Performance Procedure .............................................. 47
3.8.1 Dynamometer ................................................................................................. 51
3.9 Apparatus for Engine Emission Studies ................................................................ 52
CHAPTER4 RESULT AND DISCUSSIONS .................................................................. 55
4.0 Introduction ........................................................................................................... 55
4.1 Physico-Chemical Properties of Crude Palm, Jatropha Curcas and Moringa
Oleifera Oil ...................................................................................................................... 55
4.2 Characterization of Palm, Jatropha Curcas and Moringa Oleifera Biodiesel ...... 57
4.2.1 Properties Analysis ........................................................................................ 57
4.2.2 Fatty Acids Composition of Palm, Jatropha Curcas and Moringa Oleifera
Biodiesel ....................................................................................................................... 59
4.2.3 Structural Analysis ......................................................................................... 60
4.3 Effect of Biodiesel-Diesel Blending on Fuel Properties ....................................... 62
4.3.1 Mathematical Relationship between Blends Ratio and Physico-Chemical
Properties ..................................................................................................................... 62
4.4 Engine Performance Analysis ............................................................................... 76
4.4.1 Engine Torque ................................................................................................ 76
4.4.2 Brake Power ................................................................................................... 79
4.4.3 Brake Specific Fuel Consumptions ................................................................ 83
4.5 Engine Emissions Study ........................................................................................ 86
4.5.1 Carbon Monoxide (CO) Emission ................................................................. 86
4.5.2 Hydrocarbon (HC) Emission ......................................................................... 90

xiii
4.5.3 Nitric Oxide (NO) Emission .......................................................................... 94
4.5.4 Carbon Dioxide Emission .............................................................................. 97
CHAPTER 5 CONCLUSIONS AND RECOMMENDATION.................................... 101
5.0 Conclusions ......................................................................................................... 101
5.1 Recommendations for Future Work .................................................................... 103
REFERENCES ................................................................................................................. 104
APPENDIX A PUBLICATIONS .................................................................................... 112
APPENDIX B FUEL PROPERTIES OF BIODIESEL BLENDS ............................... 113
APPENDIX C ................................................................................................................... 115

xiv
LIST OF TABLES
Table 2.1: Impact of Diesel Engine Emission on Human Health ........................................ 10
Table 2.2:ASTM and EN Specifications for Biodiesel (B100) (Silitonga et al. 2011) ........ 17
Table 2.3: Fatty Acid Compositions of Different Biodiesel Fuel ........................................ 18
Table 3.1: Summary of Biodiesel Production Process ......................................................... 32
Table 3.2: GC Operating Conditions ................................................................................... 35
Table 3.3: Technical Data for Anton Paar (SVM 3000) Viscometer ................................... 37
Table 3.4: Technical Data for Flash Point Tester ................................................................ 39
Table 3.5: Technical Data of IKA C 2000 Calorimeter ....................................................... 40
Table 3.6: Technical Data of 737 Rancimat......................................................................... 43
Table 3.7: Technical Data of NTE 450 Cloud and Pour Point Tester.................................. 44
Table 3.8: Technical Data of NTE 450 Cold Filter Plugging Point Tester .......................... 45
Table 3.9: Blend Fuel Compositions (% Vol) ...................................................................... 48
Table 3.10: Specifications of the Engine ............................................................................. 50
Table 3.11: Details of the Exhaust Gas Analyzer ................................................................ 54
Table 4.1: Physico-Chemical Properties of Crude Palm, Jatropha Curcas and Moringa
Oleifera Oil .......................................................................................................................... 56
Table 4.2: Physico-Chemical Properties of Palm, Jatropha and Moringa Oleifera Biodiesel
compared with diesel fuel .................................................................................................... 58
Table 4.3: Fatty Acid Composition of Palm, Jatropha Curcas and Moringa
Oleifera Biodiesel ................................................................................................................ 59
Table 4.4: Characteristics Peak of PB, JB and MB in FT IR Spectra .................................. 62
xv
LIST OF FIGURES
Figure 2.1 General Cost Breakdown for Biodiesel Production............................................ 12
Figure 2.2: Classification of Transesterification Process ..................................................... 16
Figure 3.1 Flow Chart of the Research Methodology .......................................................... 29
Figure 3.2: Pictures of Palm, Jatropha Curcas and Moringa Oleifera Feedstocks (Atabani
et al. 2013) ............................................................................................................................ 30
Figure 3.3: Biodiesel Production Process (a) Crude Oil (b) Remove Moisture (c) & (d)
Esterification (e & f) Removal of Impurities (g) Removal of Methanol and Water (h)
Transesterification (i) Settling (j) Filtering (k & l) Biodiesel & Glycerol respectively...... 34
Figure 3.4: Anton Paar (SVM 3000) Viscometer Set Up .................................................... 37
Figure 3.5: Flash Point Tester .............................................................................................. 38
Figure 3.6: IKA C 2000 Calorimeter ................................................................................... 39
Figure 3.7: Rancimat 743 ..................................................................................................... 42
Figure 3.8: NTE 450 CP and PP Tester (Norma Lab, France) ............................................ 44
Figure 3.9: NTE 450 CFPP Tester ....................................................................................... 45
Figure 3.10: Biodiesel Blending Process ............................................................................. 47
Figure 3.11: Engine Test Bed............................................................................................... 50
Figure 3.12: Schematic Diagram of Engine Test Bed.......................................................... 51
Figure 3.13: Dynamometer .................................................................................................. 52
Figure 3.14: Bosch Gas Analyzer (BEA 350) ...................................................................... 53
Figure 4.1: FT IR Analysis of (a) Palm, (b) Jatropha Curcas and (c) Moringa Oleifera
Biodiesel ............................................................................................................................... 61
Figure 4.2: Effect of (a) PB-Diesel Blending (b) JB-Diesel Blending (c) MB-Diesel
Blending on Kinematic Viscosity at 40°C ........................................................................... 64

xvi
Figure 4.3: Effect of (a) PB-Diesel Blending (b) JB-Diesel Blending (c) MB-Diesel
Blending on Kinematic Viscosity at 100°C ......................................................................... 65
Figure 4.4: Effect of (a) PB-Diesel Blending (b) JB-Diesel Blending (c) MB-Diesel
Blending on Density ............................................................................................................. 67
Figure 4.5: Effect of (a) PB-Diesel Blending (b) JB-Diesel Blending (c) MB-Diesel
Blending on Viscosity Index ................................................................................................ 69
Figure 4.6: Effect of (a) PB-Diesel Blending (b) JB-Diesel Blending (c) MB-Diesel
Blending on Calorific Value ................................................................................................ 71
Figure 4.7: Effect of (a) PB-Diesel Blending (b) JB-Diesel Blending (c) MB-Diesel
Blending on Oxidation Stability........................................................................................... 73
Figure 4.8: Effect of (a) PB-Diesel Blending (b) JB-Diesel Blending (c) MB-Diesel
Blending on Flash Point ....................................................................................................... 75
Figure 4.9: Torque versus Engine Speed for Palm Biodiesel Blended Fuel at Full Load
Condition .............................................................................................................................. 77
Figure 4.10: Torque versus Engine Speed for Jatropha Biodiesel Blended Fuel at Full Load
Condition .............................................................................................................................. 77
Figure 4.11: Torque versus Engine Speed for Moringa Biodiesel Blended Fuel at Full Load
Condition .............................................................................................................................. 78
Figure 4.12: Average Torque Difference Compared to Diesel Fuel .................................... 79
Figure 4.13: Brake Power versus Engine Speed for Palm Biodiesel Blended Fuel at Full
Load Condition .................................................................................................................... 80
Figure 4.14: Brake Power versus Engine Speed for Jatropha Biodiesel Blended Fuel at Full
Load Condition .................................................................................................................... 81
Figure 4.15: Brake Power versus Engine Speed for Moringa Biodiesel Blended Fuel at Full
Load Condition .................................................................................................................... 82

xvii
Figure 4.16: Average Brake Power Difference Compared to Diesel Fuel ........................... 82
Figure 4.17: BSFC versus Engine Speed for Palm Biodiesel Blended Fuel at Full Load
Condition .............................................................................................................................. 83
Figure 4.18: BSFC versus Engine Speed for Jatropha Biodiesel Blended Fuel at Full Load
Condition .............................................................................................................................. 84
Figure 4.19: BSFC versus Engine Speed for Moringa Biodiesel Blended Fuel at Full Load
Condition .............................................................................................................................. 85
Figure 4.20: Average BSFC Difference Compared to Diesel Fuel ...................................... 85
Figure 4.21: CO Emission versus Engine Speed for Palm Biodiesel Blended Fuel at Full
Load Condition .................................................................................................................... 87
Figure 4.22: CO Emission versus Engine Speed for Jatropha Biodiesel Blended Fuel at Full
Load Condition .................................................................................................................... 88
Figure 4.23: CO Emission versus Engine Speed for Moringa Biodiesel Blended Fuel at Full
Load Condition .................................................................................................................... 88
Figure 4.24: Average CO Emission Difference Compared to Diesel Fuel .......................... 89
Figure 4.25: HC Emission versus Engine Speed for Palm Biodiesel Blended Fuel at Full
Load Condition .................................................................................................................... 91
Figure 4.26: HC Emission versus Engine Speed for Jatropha Biodiesel Blended Fuel at Full
Load Condition .................................................................................................................... 91
Figure 4.27: HC Emission versus Engine Speed for Moringa Biodiesel Blended Fuel at Full
Load Condition .................................................................................................................... 92
Figure 4.28: Average HC Emission Difference Compared to Diesel Fuel .......................... 93
Figure 4.29: NO Emission versus Engine Speed for Palm Biodiesel Blended Fuel at Full
Load Condition .................................................................................................................... 94

xviii
Figure 4.30: NO Emission versus Engine Speed for Jatropha Biodiesel Blended Fuel at Full
Load Condition .................................................................................................................... 95
Figure 4.31: NO Emission versus Engine Speed for Moringa Biodiesel Blended Fuel at Full
Load Condition .................................................................................................................... 95
Figure 4.32: Average NO Emission Difference Compared to Diesel Fuel .......................... 96
Figure 4.33: CO2 Emission versus Engine Speed for Palm Biodiesel Blended Fuel at Full
Load Condition .................................................................................................................... 97
Figure 4.34: CO2 Emission versus Engine Speed for Jatropha Biodiesel Blended Fuel at
Full Load Condition ............................................................................................................. 98
Figure 4.35: CO2 Emission versus Engine Speed for Moringa Biodiesel Blended Fuel at
Full Load Condition ............................................................................................................. 99
Figure 4.36: Average CO2 Emission Difference Compared to Diesel Fuel ......................... 99

xix
LIST OF ABBREVIATION
ASTM American Society of Testing Materials
BP Brake Power
BSFC Brake Specific Fuel Consumptions
BTE Brake Thermal Efficiency
CI Compression Ignition
cm Centimeter
CMOO Crude Moringa Oleifera Oil
CPO Crude Palm Oil
CJCO Crude Jatropha Curcas oil
CO Carbon Monoxide
CO2 Carbon Dioxides
DF Diesel Fuel
DI Direct Injection
DOE Department of Environment
USEIA United States Energy Information Administration
EPA Energy Protection Agency
EN European Union
FAME Fatty Acid Methyl Ester
h Hour
HC Hydrocarbon
IC Internal Combustion
IEA International Energy Agency
JB Jatropha Biodiesel

xx
kg Kilogram
kW Kilowatt
MB Moringa Biodiesel
MJ Mega Joule
mm Millimeter
MPOB Malaysian Palm Oil Board
Mtoe Million Tons of Oil Equivalents
NEB National Energy Board
NO Nitric Oxide
NOx Oxides of Nitrogen
OECD Organization for Economic Co-operation and Development
PB Palm Biodiesel
PM Particulate Matter
ppm Part Per Million
rpm Revolution Per Minute
SAE Society of Automotive Engineers

1
CHAPTER 1
INTRODUCTION
1.0 Introduction
1.1 Overview of Global Energy Scenario
It is one of the known facts that the advancement in modern economics through
agricultural, telecommunication, transportation, industrial sectors, etc. is heavily depends
upon energy. Consequently, worldwide energy consumption rate is growing faster than the
population growth rate. For many countries, this ever growing increase of energy demand is
becoming a critical issue. Usually, global energy demand is fulfilled by natural gas, crude
oil, coal and other resources. Among them, gas and oil are largely used in combustion
engines and as raw material for manufacturing plastic and other chemicals, too. At the
present time, transportation sector heavily depends upon petroleum or crude fossil oil. All
over the world, petroleum has become a dependent source due to having high density and
better handling facility. They are a vital utility for a country’s industrial economy.
World’s energy map is changing. These changes have potentially persuasive consequences
over the energy markets and trade. Global energy demand increases by more than one-third
over the period to 2035 with India, China, and the Middle East responsible for 60% of the
increase. Although, energy demand barely rises in OECD countries, there is a definite shift
away from oil, coal (and, in some countries, nuclear) towards natural gas and renewable
2
energy resources. Regardless of the growth in low carbon sources of energy, fossil fuels
still dominating the global energy mix, supported by large subsidies such as $523 billion in
2011, 30% more than that of 2010 and six times more than subsidies provided for
renewable. According to the International Energy Agency (IEA, 2012), by the year 2030
global energy consumption will increase by 53%. The main source of energy is fossil fuel
fulfilling 87% of the demand, amongst other energy sources crude oil supplies 33.06%, coal
30.34% and natural gas 23.67% respectively. Nuclear energy, hydropower and renewable
energy supplies very small percentages of the energy demand (4.88%, 6.44% and 1.58% of
total energy usages respectively). The world’s primary fuel consumption has doubled
within 1980 to 2011. In 1980 energy consumption was 6,630 million tons of oil equivalents
(Mtoe) which rose to 12274.6 Mtoe in 2011 (BP, 2012).
1.2 Overview of Malaysian Energy Scenario
According to British petroleum statistics; Malaysia’s primary energy consumption has
increased to 62.9 Mtoe in 2010 from 48.6 Mtoe in 2001, which is an average increase of
3.6% per annum. But in this period of time, oil production in Malaysia has decreased to
32.1 Mtoe in 2010 from 32.9 Mtoe in 2001. But, oil consumption has increased to 25.3
Mtoe in 2010 from 22 Mtoe in 2001. Contrasting to oil, production of natural gas has
increased to 59.8 Mtoe in 2010 from 42.2 Mtoe in 2001. Also, an increase in the
corresponding consumption has been observed. The final energy demand is growing
considerably high rate of 5.4% per annum. In this rate the final energy demand will be 83.5
Mtoe in 2020 from 33.9 Mtoe in 2003 (BP, 2012). In Malaysia, annual biodiesel production
increased at a rate of 26.6% per annum. The production was 1.1 thousand barrel per day in
2006, which rose to 5.7 thousand barrel per day in 2009 (USEIA, 2010).

3
1.3 Increasing Environment Pollution
Emissions from burning petroleum derived fuels have a severe consequence on both the
environment as well as human health (Oener and Altun, 2009). The united nation
intergovernmental panel reported that, due to the greenhouse gas emission including
methane, nitrogen oxides and carbon dioxides, global warming is increasing. It is
forecasted that emission of the greenhouse gases (GHG) from fossil fuels will increase up
to 39% in 2030 if no strict steps are taken to alleviate it. Air pollution is a phenomenon
where chemical, physical or biological agents modify the natural characteristics of the
atmosphere. The types of pollutants are particulate matter and noxious gases such as sulfur
dioxide, carbon monoxide, nitrogen oxides, and chemical vapors. All over the world, air
pollution is heavily responsible for huge number of health problems and respiratory
diseases. Mobile sources e.g. vehicles, stationary sources for instance factories and open
burning of wastes like municipal and industrial wastes; are the three major sources of air
pollution in Malaysia, whereby contributing to at least 70–75 %, 20–25 % and 3–5 %,
respectively. According to the Department of the Environment (DOE, 2010), Malaysia, in
2010, the major sources of the air emission were motor vehicles (82%), power stations (9
%), industrial fuel burning (5%), industrial production processes (3%), domestic and
commercial furnaces (0.2%) and open burning at solid waste disposal sites (0.8 %). Mostly,
these sources contribute to the air pollution through the combustion of fossil fuels to fulfill
nation’s overall energy demand.
4
1.4 Background
Worldwide energy demand, global environmental concerns, price hiking of petroleum
fuels , rapid depletion of fossil fuel along with numerous other factors have stimulated to
find alternative fuel sources that will ensure the clean combustion of diesel engines (M
Palash et al., 2013; Shahabuddin et al., 2013). Hence, it has become a worldwide agenda to
look for clean alternative fuels which are environmentally acceptable, domestically
available and technically feasible (Liaquat et al., 2010). According to the Energy Policy Act
of 1992 (EPACT, US), natural gas, ethanol, methanol, biodiesel, and electricity – these are
the main potential alternative fuels that can decrease global warming, consumption of fossil
fuels and exhaust emissions (Jia et al., 2005). As biodiesel is environment friendly and also
posseses similar operation properties as diesel fuels it is one best choices amongst the
available alternative fuels. If biodiesel is used in internal combustion engines, it can play a
massive role in reducing fossil fuel demand, as well as fossil fuel’s adverse effect on
environment and human health (Mallikappa et al., 2012; Ng et al., 2012; Tan et al., 2012).
Biodiesel, is known as fatty acid methyl ester, is produced from animal fats or vegetable
oils by using transesterification process in the absence or presence of any catalyst. If
vegetable oils are used directly in engine, it may cause various engine problems such as
carbon deposits on both piston and head of engine, injectors coking and also excessive
engine wear (Srivastava and Prasad, 2000). For these reasons, vegetable oils must be
refined to turn into the quality fuel. These problems can be overcome by following four
methods: pyrolysis, dilution with hydrocarbons blending, Micro-emulsion, and
transesterification (Demirbas and Demirbas, 2007; Demirbas, 2008, Balat and Balat, 2010;
Chauhan et al., 2010; Lin et al., 2011). The process of thermal fragmentation of the organic

5
substances can be classified in two conditions: absence of oxygen and presence of a catalyst
is known as Pyrolysis. This process is an effective, waste less, simple and pollution free
process (Singh and Singh, 2010). The process which is used to reduce the viscosity of the
vegetable oils and also to improve the performance of the engine is known as dilution
process. In this process, there is no need of chemical reaction (Balat and Balat, 2010).
Micro-emulsion is defined as a colloidal equilibrium dispersion of optically isotropic fluid
microstructure with dimensions generally ranging from 1–150 nm and developed
impulsively from two typically immiscible liquids and one and more ionic or more ionic
amphiphiles. In transesterification process, a chemical reaction is observed between
vegetable oil and alcohol in the presence of a catalyst. The resultant biodiesel is
biodegradable, non-explosive, renewable, non-flammable, non-toxic and also environment
friendly (Lee et al., 2013). The major advantages of biodiesel are it can be blended with
diesel fuel at any proportion and there is no need of any kind of engine modification needed
to use these blends in the engine (How et al., 2012; Shahabuddin M et al., 2012).
Furthermore, biodiesel contains no sulphur and also produces less harmful emission to the
environment compared to diesel fuel. Worldwide, there are more than 350 prospective oil-
bearing crops, among which Jatropha curcas, rapeseed, soybean, palm, sunflower,
safflower, cottonseed and peanut oils are regarded as potential alternative feedstocks
(Demirbas, 2007; Parawira, 2010; Atadashi et al., 2012). On the other hand, some other
non-edible oils such as Calophyllum inophyllum, Moringa oleifera, Sterculia foetida,
Madhuca indica (Mahua), Croton megalocarpus and Pongamia pinnata etc. are also
gaining popularity all over the world. The specification and technical regulation of
biodiesel are set by USA as ASTM 6751- 02 or by the European Union as EN 14214.

6
1.5 Research Objectives
The main objectives of this investigation are:
1. To produce biodiesel from crude edible (Palm) and non-edible (Jatropha curcas
and Moringa oleifera) oils
2. To characterize the Palm, Jatropha curcas and Moringa oleifera oil biodiesel.
3. To study the effect of blending on physico-chemical properties of Palm, Jatropha
curcas and Moringa oleifera biodiesel.
4. To study the performance and emission characteristics of Palm, Jatropha curcas
and Moringa oleifera biodiesel blended fuel in a multi cylinder diesel engine.
1.6 Scope of the Work
This study explores the potentiality of available edible and non-edible feedstocks in
Malaysia from which biodiesel can be produced. At present, in Malaysia, palm oil is the
main crop for biodiesel. Malaysian Government has agreed to use 40% (~6 million tonnes)
of palm oil production (15.8 million tonnes) to produce biodiesel. Recently, Jatropha curcas
has drawn the attention of the Malaysian Government. They have planned to build a
demonstrative project on cultivation of Jatropha curcas to establish the economic feasibility
study of the crop for biodiesel production. As Malaysia has sufficient area of land and
possesses good climatic condition, it is conducive to cultivate Jatropha; this feedstock can
be the best candidate for future biodiesel production.
On the other hand, Moringa oleifera have native distribution in Malaysia. The aim of this
study is to produce biodiesel from palm, Jatropha curcas and Moringa oleifera oil as a
promising biodiesel feedstock for Malaysia. This was followed by characterizing the fuel

7
properties of produced palm, Jatropha curcas and Moringa oleifera biodiesel and their
blends with diesel. Finally, engine performance and emission characteristics of palm,
Jatropha curcas and Moringa oleifera biodiesel blends (B5 to B20) have been conducted in
an unmodified diesel engine and compared with diesel fuel. Data from all of the tests
includes crude oil properties, biodiesel production, biodiesel properties, blending effect on
fuel properties, engine performance and emission analysis will be correlated and a
conclusion will be made based on the all findings.
1.7 Organization of Dissertation
This dissertation is made up of five chapters. The chapters are organized as follows:
Chapter 1 provides a brief introduction or overview of the research topic. It starts with
giving an introduction to global energy scenario; Malaysian energy scenario, followed by a
background of the study that shows the potential of biodiesel as a renewable energy sources
and finally the objectives and scope of the study.
Chapter 2 provides a literature review for the objective based study. It starts with giving a
brief discussion about the diesel engine combustion followed by historical background of
biodiesel evolution, the sources of biodiesel, production of biodiesel, standards &
properties of biodiesel, advantages & disadvantages of biodiesel. The next part
comprehensively discusses the impact of biodiesel on engine performance & emission
characteristics.
Chapter 3 explains in detail the research methodology and design of experiments. Besides
methods which were applied to test the feedstocks’ properties, blending effect on fuel
8
properties, blending, engine performance and emission etc. are explained in brief in this
chapter.
Chapter 4 is dedicated to present all the results that have been obtained from the
experimental tests and analysis. Moreover, the findings of the study followed by a detailed
discussion and analysis of all results presented along with comparing them with the existing
results presented in the literature.
Chapter 5 provides a summary of the key findings in the light of the research and puts some
recommendations for the future studies.

9
2 CHAPTER 2
LITERATURE REVIEW
2.0 Introduction
Quite a significant number of selective literatures have been reviewed in order to critically
compare the feasibilities of these target feedstocks (i.e. Palm, Jatropha curcas and Moringa
oleifera) with other popular biodiesel feedstocks like sunflower, rapeseed, pongamia,
Calophyllum inophyllum in different parameters such oil properties, production process,
biodiesel properties and standards, engine performance and emission. On selecting
references, only highly rated journals with scientific references, Society of Automotive
Engineers (SAE) technical notes are taken and some information are gathered from reports
from renowned organization like International Energy Agency (IEA), Malaysian Palm Oil
Board (MPOB), National Energy Board (NEB), National Institute of Standards and
Technology (NIST). The experimental results as well as reason behind of these results are
analyzed to find the jest.
2.1 Impact of Diesel Engine Emission on Environment and Human Health
The emissions which are produced due to combustion of petroleum derived fuel have an
adverse effect on environment and human health. It is reported by the united nation
intergovernmental panel that global warming is increasing due to the greenhouse gas
emission including methane, nitrogen oxides and carbon dioxides. Liaquat et al. (2010)
reported that if the average global temperature is increased by more than 2° C, many people

10
about hundreds of millions of people will lose their lives. Carbon monoxide (CO),
hydrocarbon (HC) and formaldehyde (HCHO), Oxides of nitrogen (NOx), particulate matter
(PM) and organic gases other than methane (Non-Methane Organic Gases, i.e. NMOG)
which are emitted from internal combustion engine has been identified as harmful to the
human health and environment degradation. Table 2.1 shows the impact of exhaust
emissions on human health.
Table 2.1: Impact of Diesel Engine Emission on Human Health
Exhaust
Emissions
Impact on Health References
PM Lung cancer and cardiopulmonary deaths (Zhang 2010) NOx Irritate the lungs and cause oedema, bronchitis
and pneumonia; and result in increased sensitivity to dust and pollen in asthmatics
(Faiz 1990)
CO Its affects fetal growth in pregnant women and tissue development of young children. It has a synergistic action with other pollutants to promote morbidity in people with respiratory or circulatory problems.
(Faiz 1990)
HC Eye irritation, coughing and sneezing, drowsiness and symptoms akin to drunkenness. Some hydrocarbons have a close affinity for diesel particulates and may contribute to lung disease.
(Faiz 1990)
PAHs Eye and nose irritation, coughing, nausea and shortness of breath
(Okona-Mensah 2005)
Formaldehyde Eye and nose irritation, coughing, nausea and shortness of breath
(Onursal 1997)
2.2 Development of Biodiesel in Malaysia
In Malaysia, the production of biodiesel per annum upturned from 1.1 thousand barrel per
day in 2006 to 5.7 thousand barrel per day in 2009 which shows an average increase of
26.6% annually (USEIA, 2010). The government of Malaysia had observed the necessity of
evolving alternative energy resources particularly on biodiesel in the long term since 1980s.
The country is elevated as one of the pioneers in palm biodiesel industry because it

11
produces and exports largest amount of palm oil in all over the world. The palm biodiesel
were fortified as an alternative fuel in the Malaysian transport sector, for embracing more
renewable sources and getting rise of dependency on fossil fuels. From this time onward,
biodiesel production in Malaysia was seen to grow promptly. In 2006, Malaysian
government initiated the National Biofuel Policy to boost up the production and
consumption of biodiesels. The country also professed a pledge to keep apart six million
tons of crude palm oil to enhance the biodiesel production and make the policy fruitful.
However, because of introducing of Envo diesel at late’ 2006, biodiesel status again
solidified as a renewable energy source (Chin, 2011). Nevertheless the country turned back
to the inventive mandate of utilizing B5 blend. The execution of B5 mandate was being
delayed till the middle of 2011 and it is also limited to the Central Region of Malaysia
(Dompok, 2010). A satisfactory status has been achieved by Malaysia in the proper truck to
use biomass as a renewable energy source. This t can entertain as a model to the countries
in the world having immense biomass feedstock’s (Ayob et al., 1998). Presently, Malaysia
owns 25 biodiesel plants with total production capacity of 2.6 million tons. Most of these
plants are placed in Peninsula Malaysia .
2.3 Sources (Feedstocks) of Biodiesel
More than 350 oil-bearing crops are recognized universally as potential sources for
production of biodiesel. The comprehensive variety of prevailing feedstocks for biodiesel
production is a major vital advantage. As per existing literature, feedstock acquisition
presently considers more than 75% of biodiesel production costs as represented in Figure
2.1. Generally, the biodiesel feedstock’s can be distributed into four major categories
(Silitonga et al., 2011) such as

12
1. Edible vegetable oil: canola, soybean, peanut, sunflower, palm and coconut oil.
2. Non-edible vegetable oil: Jatropha curcas, Calophyllum inophyllum, Moringa Oleifera
and croton megalocarpus.
3. Waste or recycled oil.
4. Animal fats: chicken fat, pork lard, beef tallow and poultry fat
The main feedstock for biodiesel production in Malaysia is Palm oil. The preliminary
assessment for physical and chemical characteristics of edible and non-edible feedstocks is
of utmost importance to judge their feasibility for imminent biodiesel production. A few
physical and chemical properties of edible and non-edible oil feedstocks are found in the
study of (Atabani et al., 2013) and (Sanford et al., 2011).
Figure 2.1: General Cost Breakdown for Biodiesel Production
2.4 Production of Biodiesel
Currently, there are number of well-established methods which can be used to produce
biodiesel fuel. In order to use as engine fuel, viscosity of crude oils needs to be reduced.
This modification can be achieved through several procedures to ensure production of
better quality biodiesel. These four primary ways viz. blending of crude oils, thermal

13
cracking, micro emulsions, and transesterification- can be used to achieve the desired
modification (Jain & Sharma, 2010; Leung et al., 2010). As vegetable oils have low
volatility, high viscosity, and polyunsaturated characteristics, they cannot be directly
applied in diesel engines (Srivastava and Prasad, 2000). There is a need of refinement to
turn those vegetable oils into quality fuel. Four distinct methods; pyrolysis, dilution with
hydrocarbons blending, Micro-emulsion, and transesterification can overcome the
constraint well (Demirbas and Demirbas, 2007; Demirbas, 2008; Balat and Balat, 2010;
Chauhan et al., 2010; Lin et al., 2011).
2.4.1 Pyrolysis
In pyrolysis process, in the absence of oxygen, one substance is converted into another with
help of catalyst or by means of heat. The vegetable oils, natural fatty acids, animal fats, as
well as methyl ester of fatty acids can be used for pyrolysis. Pyrolysis process is simple,
effective, pollution free and waste less (Singh and Singh, 2010).
2.4.2 Blending of Crude Oils or Dilution
To resolve the problem of high viscosity of crude vegetable oils, they can be blended
directly or diluted with diesel fuel to increase the viscosity for using in compression
ignition engines. In 1980, Caterpillar Brazil maintained total power using a 10% mixture of
vegetable oil without altering the engines. Also, a blend of 20% vegetable oil with 80%
diesel fuel was also successfully reported by (Singh and Singh, 2010). Dilution is a process
in which without any chemical reaction reduction of viscosity of the vegetable oils as well
as improvement in engine performance can be achieved (Balat and Balat, 2010).
2.4.3 Micro-Emulsification
Micro-emulsion is demarcated as a colloidal equilibrium dispersion of optically isotropic
fluid microstructure usually ranging from 1–150 nm dimensions formed instinctively from

14
two normally immiscible liquids together with one or ionic amphiphiles (Moser, 2009). The
micro-emulsification process can be used to lessen the viscosity of vegetable oil. Micro
emulsions are clear and stable isotropic fluids containing three types of components such as
oil phase, aqueous phase and surfactant. A complex mixture of olefins and hydrocarbons
are the constituent of the oil phase whereas salts are constituents of the aqueous phase.
Aqua phase also may contain other ingredients. Spray characteristics can be improved by
this ternary phase through quick-tempered vaporization of low boiling components in
micelles. Limitation of maximum viscosity can be met by all micro-emulsions using
butanol, hexanol and octanol (Jain and Sharma, 2010).
2.4.4 Transesterification
Adopting the transesterification process, the triglyceride can nicely be converted into
monoester. In this process, when a catalyst is existent, three consecutive reversible
chemical reactions, involving triglycerides and alcohol, produce esters and glycerol. The
inclusive transesterification reaction can be deliberated by three consecutive and reversible
equations (2.1-2.3)
Triglyceride (TG) + ROH ↔ Diglycerides (DG) + RCOOR1……………………….. (2.1)
Diglycerides (DG) + ROH ↔ Monoglyceride (MG) + RCOOR2…………………… (2.2)
Monoglyceride (MG) + ROH ↔ Glycerol + RCOOR3……………………………… (2.3)
To reduce the reaction time and to enhance reaction rate usually a catalyst is chosen. There
are three common kinds of catalysts in the ester reaction: lipase catalysts, acid catalysts,
and alkali catalysts. Each catalyst has its own advantages and disadvantages in the whole
reaction process. As transesterification process is reversible, in order to shift equilibrium
towards product side excess alcohol is used. Hence ester and crude glycerol are produced
from a fruitful transesterification reaction produces. In this process, glycerin recovery
15
shows its vital importance because of its frequent applications in daily products (Ramadhas
et al., 2005a). The transesterification reaction can be catalyzed by alkalis, acids or enzymes
(Demirbas, 2005).
Amongst the four techniques, transesterification is the most promising technique to resolve
the higher viscosity issues. At present, transesterification is widely available technique for
industrialized biodiesel production due to its higher conversion efficiency and lower cost
(Balat and Balat, 2010; Jain and Sharma, 2010; Parawira, 2010). Details classification of
transesterification process has shown in Figure 2.2.
2.5 Factors Affecting the Transesterification Process
The transesterification reaction is affected by several parameters reliant on the reaction
environments. If the parameters are not optimized, the reaction may either be incomplete or
the yield is lessened to a momentous amount. The most imperative parameters affecting the
transesterification process are revealed as below:
� Moisture, FFA and water content.
� Kind of alcohol
� Molar ratio applied
� Sort and deliberation of catalysts.
� Reaction temperature
� Reaction time.
� Speed and method of stirring.
� Purification process.
� Mixing strength.
� Influence of using organic co-solvents.

16
Figure 2.2: Classification of Transesterification Process
2.6 Standards and Properties of Biodiesel
Quality standards for producing, storing and marketing of biofuel are being technologically
advanced and employed worldwide in order to maintain the end product quality and also to
ensure consumers’ confidence. Austria was the first nation in the world which defined and
approved the standards for rapeseed oil methyl esters as a diesel fuel. At present the US and
the EU standards are the most referred standards followed by standards from other biofuel
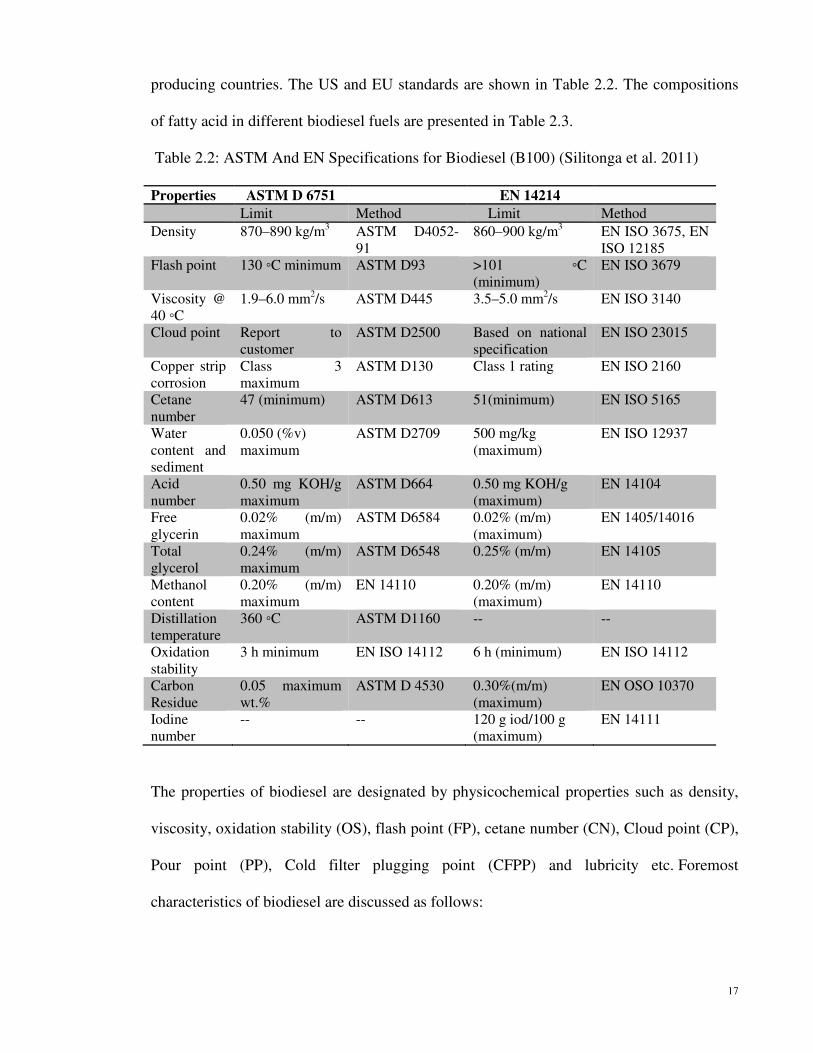
17
producing countries. The US and EU standards are shown in Table 2.2. The compositions
of fatty acid in different biodiesel fuels are presented in Table 2.3.
Table 2.2: ASTM And EN Specifications for Biodiesel (B100) (Silitonga et al. 2011)
Properties ASTM D 6751 EN 14214 Limit Method Limit Method Density 870–890 kg/m3 ASTM D4052-
91 860–900 kg/m3 EN ISO 3675, EN
ISO 12185 Flash point 130 ◦C minimum ASTM D93 >101 ◦C
(minimum) EN ISO 3679
Viscosity @ 40 ◦C
1.9–6.0 mm2/s ASTM D445 3.5–5.0 mm2/s EN ISO 3140
Cloud point Report to customer
ASTM D2500 Based on national specification
EN ISO 23015
Copper strip corrosion
Class 3 maximum
ASTM D130 Class 1 rating EN ISO 2160
Cetane number
47 (minimum) ASTM D613 51(minimum) EN ISO 5165
Water content and sediment
0.050 (%v) maximum
ASTM D2709 500 mg/kg (maximum)
EN ISO 12937
Acid number
0.50 mg KOH/g maximum
ASTM D664 0.50 mg KOH/g (maximum)
EN 14104
Free glycerin
0.02% (m/m) maximum
ASTM D6584 0.02% (m/m) (maximum)
EN 1405/14016
Total glycerol
0.24% (m/m) maximum
ASTM D6548 0.25% (m/m) EN 14105
Methanol content
0.20% (m/m) maximum
EN 14110 0.20% (m/m) (maximum)
EN 14110
Distillation temperature
360 ◦C ASTM D1160 -- --
Oxidation stability
3 h minimum EN ISO 14112 6 h (minimum) EN ISO 14112
Carbon Residue
0.05 maximum wt.%
ASTM D 4530 0.30%(m/m) (maximum)
EN OSO 10370
Iodine number
-- -- 120 g iod/100 g (maximum)
EN 14111
The properties of biodiesel are designated by physicochemical properties such as density,
viscosity, oxidation stability (OS), flash point (FP), cetane number (CN), Cloud point (CP),
Pour point (PP), Cold filter plugging point (CFPP) and lubricity etc. Foremost
characteristics of biodiesel are discussed as follows:
18
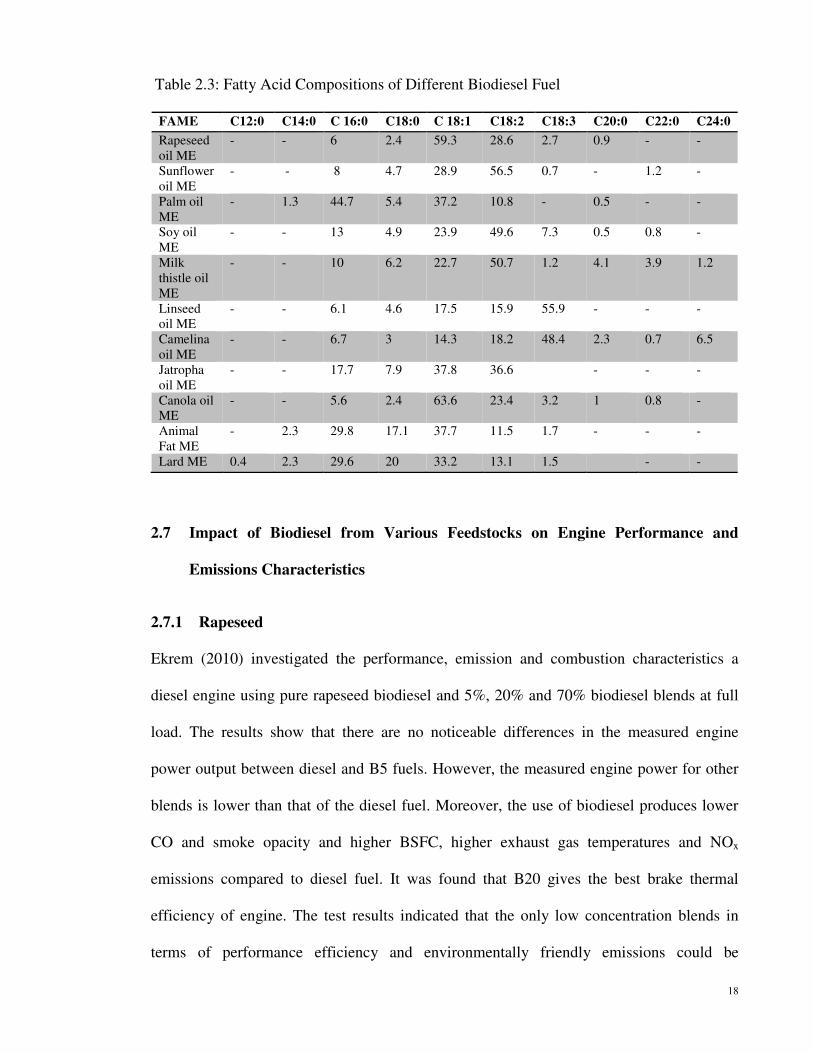
Table 2.3: Fatty Acid Compositions of Different Biodiesel Fuel
FAME C12:0 C14:0 C 16:0 C18:0 C 18:1 C18:2 C18:3 C20:0 C22:0 C24:0
Rapeseed oil ME
- - 6 2.4 59.3 28.6 2.7 0.9 - -
Sunflower oil ME
- - 8 4.7 28.9 56.5 0.7 - 1.2 -
Palm oil ME
- 1.3 44.7 5.4 37.2 10.8 - 0.5 - -
Soy oil ME
- - 13 4.9 23.9 49.6 7.3 0.5 0.8 -
Milk thistle oil ME
- - 10 6.2 22.7 50.7 1.2 4.1 3.9 1.2
Linseed oil ME
- - 6.1 4.6 17.5 15.9 55.9 - - -
Camelina oil ME
- - 6.7 3 14.3 18.2 48.4 2.3 0.7 6.5
Jatropha oil ME
- - 17.7 7.9 37.8 36.6 - - -
Canola oil ME
- - 5.6 2.4 63.6 23.4 3.2 1 0.8 -
Animal Fat ME
- 2.3 29.8 17.1 37.7 11.5 1.7 - - -
Lard ME 0.4 2.3 29.6 20 33.2 13.1 1.5 - -
2.7 Impact of Biodiesel from Various Feedstocks on Engine Performance and
Emissions Characteristics
2.7.1 Rapeseed
Ekrem (2010) investigated the performance, emission and combustion characteristics a
diesel engine using pure rapeseed biodiesel and 5%, 20% and 70% biodiesel blends at full
load. The results show that there are no noticeable differences in the measured engine
power output between diesel and B5 fuels. However, the measured engine power for other
blends is lower than that of the diesel fuel. Moreover, the use of biodiesel produces lower
CO and smoke opacity and higher BSFC, higher exhaust gas temperatures and NOx
emissions compared to diesel fuel. It was found that B20 gives the best brake thermal
efficiency of engine. The test results indicated that the only low concentration blends in
terms of performance efficiency and environmentally friendly emissions could be

19
recognized as the potential candidates to be certificated for full scale usage in unmodified
diesel engines.
2.7.2 Soybean
Qi et al. (2010) studied the combustion and performance characteristics of a direct injection
engine fueled with biodiesel from soybean oil and its different blend (B0, B30, B50, B80,
B100). The test result showed a small increase in BSFC for biodiesel and its blends due to
the lower heating value of biodiesel. The BTE of biodiesel and its blends are slightly lower
than that of diesel at low engine loads keeping the same trend to the higher engine load.
The significant improvement in reduction of carbon monoxide (CO) and smoke were found
for biodiesel and its blends at high engine loads. HC emissions of biodiesel and its blends
have little difference from those of diesel fuel. Nitrogen oxides (NOx) were slightly higher
for biodiesel and its blends. This is because of the increases the combustion chamber
temperature due to higher oxygen content in biodiesel. The authors concluded that the
excess oxygen contents of biodiesel play a key role in engine performance and biodiesel is
proved to be a potential fuel for complete or partially replacement of diesel fuel.
2.7.3 Mahua (Madhuca Indica)
Saravanan et al. (2010) investigated the performance and emission of a diesel engine
fuelled with Madhuca indica biodiesel. Experiments were conducted on a single cylinder,
four strokes; air cooled, direct injection, compression ignition engine using Mahua oil
methyl ester and diesel as fuel. The result showed that at full load, the power loss was
around 13% along with 20% increase in fuel consumption with Mahua oil methyl ester due
to the lower heating value and higher viscosity of biodiesel fuel. Emissions such as carbon
monoxide, hydrocarbons were lesser for Mahua ester compared to diesel by 26% and 20%

20
respectively due to the higher oxygen contents which promoted combustion. Oxides of
nitrogen were lesser by 4% for the ester compared to diesel due to the lower in cylinder
temperature. Besides, smoke intensity was reduced by 15% for MOME at full load. It was
also observed that the exhaust gas temperature lowered for MOME blended fuel
combustion compared to that of diesel.
2.7.4 Jojoba
Saleh (2009) studied the performance and exhaust emissions of a two-cylinder, naturally
aspirated, four-stroke direct injection diesel engine operating with diesel and Jojoba methyl
ester (JME). This was followed by studying the effect of exhaust gas recirculation (EGR).
The result showed that the engine power and brake thermal efficiency with JME are slightly
higher than the diesel. The BSFC with JME is lower (8.2-9.8%) than that of diesel. Author
also found that JME also give higher concentration of NOx of 14% at 1600 rpm and 16% at
1200 rpm. At lower engine speed JME produce higher HC and CO emissions. At high
speed, there is no appreciable difference between HC concentration with JME and diesel
fuel while CO of JME is lower than diesel. The results also showed that when the EGR rate
is increased, the NOx emissions decreased. However, CO and HC emissions increased. The
optimum EGR level is 5-15% for all engine speeds and loads and that may be favorable in a
trade-off between HC, CO and NOx emissions with little economy penalty.
2.7.5 Neem
Sharma et al. (2009) studied the performance and emissions of a direct injection diesel
engine fueled by Neem-diesel blend. They reported that neem biodiesel gives slightly lower
brake thermal efficiency (BTE) and higher brake specific fuel consumption (BSFC) than
21
diesel at all loads. A significant reduction in the NOx, smoke density, CO and unburned
hydrocarbon (UHC) emissions with compare to diesel fuel was observed.
2.7.6 Pistacia Chinensis Bunge
Zhihao et al. (2011) studied the emission characteristics of a diesel engine fuelled with
Pistacia Chinensis Bunge Seed biodiesel blend. The result showed that CO, HC and exhaust
smoke emissions decrease with the increase of the proportions of biodiesel in the blends
due to the higher oxygen contents and absence of sulphur in the blend. The NOx emissions
are reduced as the engine operating with B10 and B20, but slightly increased with B30 due
to the higher oxygen contents which increases the in cylinder temperature.
2.7.7 Beef Tallow
Selvam and Vadivel (2012) studied the performance and emission of a diesel engine using
beef tallow biodiesel (B100) and its blends (B5, B25, B50, B75) with diesel at different
load condition and constant speed of 1500 rpm. The test result indicates that blended fuels
give a slight decrease in BTE and increase in BSFC compared to that of diesel fuel due to
the higher density and lower heating value of biodiesel fuel. The emission analysis shows a
radical reduction in carbon monoxide (CO), unburned hydrocarbon (UHC) and smoke
density for all biodiesel blended fuel due to the higher oxygen contents in biodiesel fuel.
The maximum reduction in CO, HC and smoke emission with neat biodiesel are 24.7%,
32.5% and 63% respectively. However, in the case of oxides of nitrogen, there is a slight
increase for all the blended fuels and with neat biodiesel (6.35%) compared to diesel fuel.
The authors concluded that methyl esters of beef tallow and its blends with diesel fuel can

22
be used as an alternative fuel for diesel in direct injection diesel engines without any
significant engine modification.
2.7.8 Palm
Karavalakis et al. (2009) investigated regulated, unregulated exhaust emissions and fuel
consumption of diesel fuel and palm based biodiesel blends at proportions of 5%, 20% and
40% (v/v). A Euro 3 compliant light duty vehicle was tested on a chassis dynamometer
over the new European driving cycle (NEDC) and the non-legislated Athens driving cycle
(ADC). The experimental results showed that the addition of biodiesel increased NOx
emissions. This increase was more significant with the use of B20 over both cycles (13.7%
and 23.2% over the NEDC and ADC, respectively). Biodiesel addition resulted to increases
in CO emissions with the highest increase being 11.78% for B20 over NEDC and 11.62%
for B40 over ADC. HC emissions increased with biodiesel over the NEDC, while over the
ADC the addition of biodiesel led to reductions with the highest being with the use of B40
(about 26.47%). The same observation holds for PM emissions. Over the ADC the most
beneficial reduction was in the order of 50% for the B40. CO2 emissions and fuel
consumption followed similar patterns. B20 led to increases up to 6.16% and 2.94% in fuel
consumption over NEDC and ADC, respectively. Some PAH compounds demonstrated an
increase with biodiesel, while nitro-PAHs decreased with most of them being almost
undetectable. Most carbonyl emissions decreased with biodiesel.
Kalam et al. (2011) studied emission and performance characteristics of an indirect ignition
diesel engine fuelled with 5% palm (P5) and 5% coconut oil (C5) with diesel fuel at
constant 85% throttle position. The results show that there are reductions in brake power of
1.2% and 0.7% for P5 and C5 respectively compared with B0. This reduction is mainly
23
owed to their respective lower heating values. Compared with B0, P5 increases exhaust gas
temperature by 1.42% and C5 decreases it by 1.58%. However, both C5 and P5 reduce CO
by 7.3% and 21% respectively and HC by 23% and 17% respectively. However, C5
reduces 1% and P5 increases 2% of NOx emission. It was noted that P5 produces higher
CO2 than C5 and B0 fuels. This is mainly the effect of high unsaturated fatty acid in palm
oil.
Leevijit and Prateepchaikul (2011) studied the performance and emission characteristics of
IDI-turbo automobile diesel engine operated using degummed, deacidified mixed crude
palm oil-diesel blends at various loads and speeds. The test result showed that all blends
produce the same maximum brake torque and power. A higher blending portion results in a
little higher brake specific fuel consumption (+4.3% to +7.6%), a slightly lower brake
thermal efficiency (-3.0% to -5.2%), a slightly lower exhaust gas temperature (2.7% to
3.4%), and a significantly lower amount of black smoke (-30% to -45%). The CO emission
of the 20 vol. % blend is significantly lower (-70%), and the NOx emissions of all blends
are little higher. The authors concluded that blending of degummed, deacidified palm oil in
diesel up to 40 vol. % has been found to be satisfactory for short-term usage in the IDI-
turbo automotive diesel engine.
Ng et al. (2012) studied the engine performance using neat palm oil methyl ester, B50 and
neat diesel (B0) at different speeds and load conditions. The result showed that SFC for
palm oil methyl ester is higher than diesel fuel due to lower energy contents. They also
found that neat palm oil methyl ester (B100) reduces tailpipe NO, UHC and smoke opacity
by 5.0%, 26.2% and 66.7%, respectively due to improved combustion, higher cetane
number and oxidation of soot. However, it was found that PME content in the fuel blend
did not significantly affect tailpipe CO emission, with only a maximum 0.89% reduction
achieved with the B50 blend. The authors concluded that despite the shortcoming of PME

24
in its higher specific fuel consumption, its overall reduction of regulated tailpipe emissions
makes PME green technically viable alternative to fossil diesel in both neat and blended
forms for use in light-duty diesel engines.
2.7.9 Jatropha Curcas
Sahoo et al. (2009) studied the performance and emission characteristics of Jatropha based
biodiesel as fuel in a tractor engine. During the part throttle performance test they found
best brake specific fuel consumption (BSFC) improvement with jatropha biodiesel blend.
They also found the significant reduction in smoke, hydrocarbon (HC), particulate matter
(PM) with biodiesel and their blend but slightly increase of oxides of nitrogen (NOx) and
carbon monoxides (CO) emissions. The reason of increasing NOx is the presence of oxygen
in biodiesel which causes an increase in combustion gas temperature resulting in increasing
NOx emission.
Huang et al. (2010) studied the emission characteristic of a diesel engine using jatropha
biodiesel compared with diesel fuel. They reported that the performance and thermal
efficiency of the engine run by biodiesel is comparable with that of diesel fuel. Emissions
are reduced to some extent when using the biodiesels. CO emissions are reduced 20-25%
when the engine runs at engine high loads and also 17-23% HC emissions are reduced
compared to diesel fuel. NOx emissions are also reduced at different engine loads. Smoke
emissions from the engine fuelled by the biodiesels are lowered significantly than that
fuelled by diesel.
Rao (2011) studied the performance and emission analysis of pure Jatropha biodiesel and
preheated jatropha biodiesel fuel in a single cylinder diesel engine and compared with that
of diesel fuel. The results showed that the biodiesel performance and emissions are lower
25
than that of diesel fuel. However, the NOx emission of Jatropha biodiesel is more than that
of diesel fuel. These high NOx emissions are due to the presence of unsaturated fatty acids
and the advanced injection caused by the higher bulk modulus (or density) of Jatropha
biodiesel.
Chauhan et al. (2012) evaluated the performance and exhaust emissions using 5%, 10%,
20% and 30% Jatropha biodiesel blends with diesel fuel on an unmodified diesel engine.
The experimental results show that engine performance with biodiesel of Jatropha and its
blends were comparable to the performance of diesel fuel. In case of all fuel blends, brake
thermal efficiency, HC, CO, CO2 and smoke density were lower while BSFC and NOx were
higher than that of diesel. The authors concluded that biodiesel derived from Jatropha and
its blends could be used in a conventional diesel engine without any modification. However
there are various parameters which can be evaluated in future such as the prediction of best
blend with respect to the various engine parameters by varying spray time of fuel using
common-rail fuel injection.
2.7.10 Moringa Oleifera
Rashid et al. (2008) evaluated the Moringa oleifera oil as a potential feedstock for biodiesel
production in Pakistan. They produced biodiesel using two-step process including
pretreatment and esterification process. They found that the methyl esters (biodiesel)
obtained from Moringa oil exhibit a high cetane number of approximately 67, one of the
highest found for a biodiesel fuel. Other fuel properties of biodiesel derived from M.
oleifera such as cloud point, kinematic viscosity and oxidative stability were also meet
biodiesel standards such as ASTM D6751 and EN 14214. Authors concluded that, M.
oleifera oil appears to be an acceptable feedstock for biodiesel.

26
Rajaraman et al. (2009) reported on the performance and emission characteristics of
Moringa oil methyl ester and its blend (B20-B100) in a DI diesel engine at various load
condition. They reported that, in comparison to diesel fuel Moringa oleifera methyl ester
blends have lower brake thermal efficiency (BTE) because of having lower heating value,
higher viscosity and density than diesel fuel. In case of engine emission Moringa oleifera
methyl ester blend produce lower HC, CO, PM emission but higher NOx emission
compared to diesel fuel.
Da Silva et al. (2010) studied the characterization and production of biodiesel from
Moringa oleifera oil. They collected seeds from the northeast of Brazil, evaluated some
properties and chemical composition of the oil, as well any potential application in
biodiesel production. They concluded that the material may be used as a fuel in diesel
engines, mainly as a mixture to petro diesel.
Kafuku and Mbarawa (2010) evaluated the Moringa oleifera oil from Tanzania as a
potential raw material for biodiesel production and identified optimal reaction condition for
biodiesel production. Experimental results of their study showed that larger catalyst
amounts favor the saponification process while greater methanol amounts hinder the
separation of glycerin from methyl esters. Moreover, at optimal catalyst and methanol
amounts, there is a correlation between reaction time, temperature and agitation speed. At
higher temperatures and agitation speed the reaction takes a shorter time to complete while
at lower temperature and agitation speed the reaction needs a longer time to achieve
completion. The best combination of an alkali-catalyzed transesterification condition is: a
methanol to oil ratio of 30 wt%; 1.0 wt% of KOH; a temperature of 60°C; an agitation
speed of 400 rpm and a reaction time of 60 min: with these conditions the optimal MOME
yield achieved was 82%. Properties of MOME met minimum requirements of both the

27
ASTM D6751 and EN 14214 biodiesel standards despite the finding that MOME showed
high values of cloud and pour points of 10°C and 3°C respectively.

28
3 CHAPTER 3
METHODOLOGY AND EXPERIMENTAL SET UP
3.0 Introduction
Research methodology is a crucial factor to bring in an effective research with accredited
results. It can be define in many ways such as procedures, ways, methods and techniques
that are applied to incorporate and gather all relevant information for the research.
This chapter explains how the whole research was conducted and shows the methods by
which crude oil collection and crude oils characteristics, biodiesel production, fatty acid
composition, FT-IR analysis and physical and chemical properties of Palm, Jatropha
curcas and Moringa oleifera biodiesel were conducted according to the ASTM D6351 and
EN 14214 standards. The opportunity of biodiesel-diesel blending (10-90% by volume
blend) to improve some of the properties of each feedstock was also studied in this
research. The properties of biodiesel blends were estimated using the polynomial curve
fitting method. Moreover, 13 fuel samples were selected to evaluate their performance in a
multi-cylinder diesel engine.
3.1 Structure of Research Methodology
This paper aims to produce biodiesel from various edible and non-edible oils that are
readily available in the Malaysia or have native distribution to Malaysia. Figure 3.1 gives a
summary of the implemented flow chart of this paper.
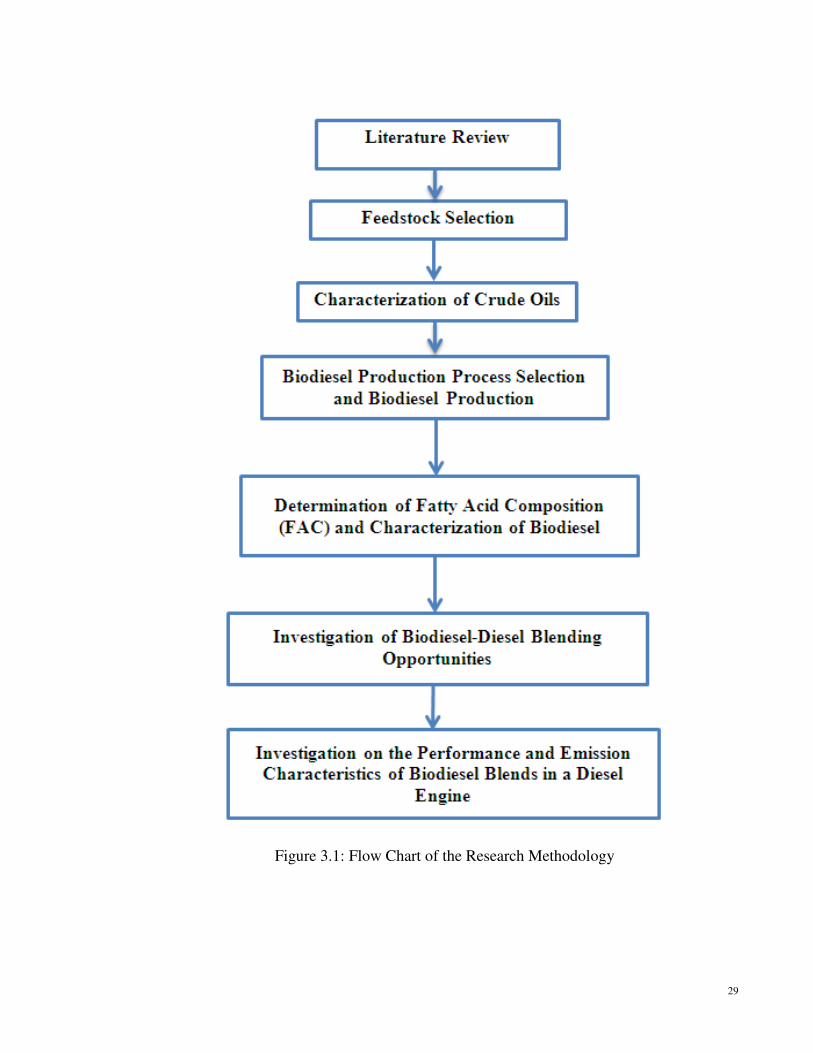
29
Figure 3.1: Flow Chart of the Research Methodology

30
3.2 Selection of Biodiesel Feedstocks
In this study biodiesel feedstock was selected on the basis of available sources or has native
distribution in Malaysia. So there are three types of biodiesel feedstocks such as Palm,
Jatropha curcas and Moringa oleifera have been selected. Figure 3.2 shows some pictures
of palm, Moringa oleifera and Jatropha curcas.
Figure 3.2: Pictures of Palm, Jatropha Curcas and Moringa Oleifera Feedstocks (Atabani
et al. 2013)

31
The reason of choosing these feedstocks is that Malaysia is the world’s second largest palm
produce country and the production of biodiesel in Malaysia is palm oil based. Recently
Malaysian government has taken initiative to introduce Jatropha curcas as it non edible
feedstocks and doesn’t create food versus fuel conflict. Moringa oleifera still is not
introduced in Malaysia as a biodiesel feedstock but it has a native distribution in Malaysia.
The crude oils of Moringa oleifera oil was obtained from personal communication and
Palm and Jatropha curcas were purchased from Forest research Institute, Malaysia
(FRIM).
3.3 Biodiesel Production
Free fatty acid (FFA) and acid values are the main identifier of production process. If the
crude oil contains higher acid value then two step processes is required because of forming
fatty acid salts during the conversion of FFA into FAME (Fatty acid methylester) using
alkaline catalyst. The fatty acid salt prevents to separate FAME layer from glycerin.
The acid values of crude Palm, Jatropha curcas and Moringa oleifera oils were measured
to be 3.47, 10.7 and 8.62 mgKOH/g oil respectively. Therefore two step (acid-base catalyst)
processes were selected to convert crude Jatropha and Moringa oleifera oil into Jatropha
and Moringa oleifera biodiesel and only transesterification process was selected to convert
palm biodiesel. The summary of biodiesel production process is given in Table 3.1.
However, production of biodiesel from these crude oils has been conducted as follow:
(a) Pre-treatment process.
(b) Esterification process.
(c) Transesterification process.

32
(d) Post-treatment process
The apparatus used for biodiesel production was a small scale laboratory reactor consisting
of 1L three necked round bottom flask, condenser to recover methanol, thermometer and
heating plate equipped with a magnetic stirrer. A separating funnel with a valve at the
bottom was used for collection of the final products.
Table 3.1: Summary of Biodiesel Production Process
3.3.1 Pretreatment Process
In this process, crude Palm, Jatropha curcas and Moringa oleifera oils were entered in a
rotary evaporator and heated to remove moisture for 1 hour at 95°C under vacuum.
3.3.2 Esterification Process
In this process, the molar ratio of methanol to refined Jatropha curcas and Moringa
oleifera oils were maintained at 12:1 (50% v/v). 1% (v/v) of sulphuric acid (H2SO4) was
added to the pre-heated oils at 60oC for 3 hour under 600 rpm stirring speed in a glass
reactor. On completion of this reaction, the products were poured into a separating funnel to
No Process parameter Process specification 01 Process selected
Reaction temperature Catalyst used
Acid-base catalyst process 02 60°C 03 98% pure sulphuric acid (1%v/v) & 99% pure potassium
hydroxides (1% m/m) 04 05
Alcohol used Molar ratio
Methanol 12:1 for esterification and 6:1 for transesterification
06 Reaction time Setting time
3 hours for esterification and 2 hours for transesterification 07 15h 08 Stirring speed 600 rpm

33
separate the excess alcohol, sulphuric acid and impurities presented in the upper layer. The
lower layer was separated and entered into a rotary evaporator and heated at 95°C under
vacuum conditions for 1 hour to remove methanol and water from the esterified oil.
3.3.3 Transesterification Process
In this process, crude palm oil and esterified Moringa oleifera and Jatropha curcas oils
were reacted with 25% (v/v) of methanol and 1% (m/m) of potassium hydroxide (KOH)
and maintained at 60oC for 2 hours and 600 rpm stirring speed. After completion of the
reaction, the produced biodiesel was deposited in a separation funnel for 15 hours to
separate glycerol from biodiesel. The lower layer which contained impurities and glycerol
was drawn off.
3.3.4 Post-Treatment Process
Methyl ester formed in the upper layer from the previous process was washed to remove
the entrained impurities and glycerol. In this process, 50% (v/v oil) of distilled water at
60oC was sprayed over the surface of the ester and stirred gently. This process was repeated
several times until the pH of the distilled water became neutral. The lower layer was
discarded and upper layer was entered into a flask and dried using Na2SO4 and then further
dried using rotary evaporator to make sure that biodiesel is free from methanol and water.
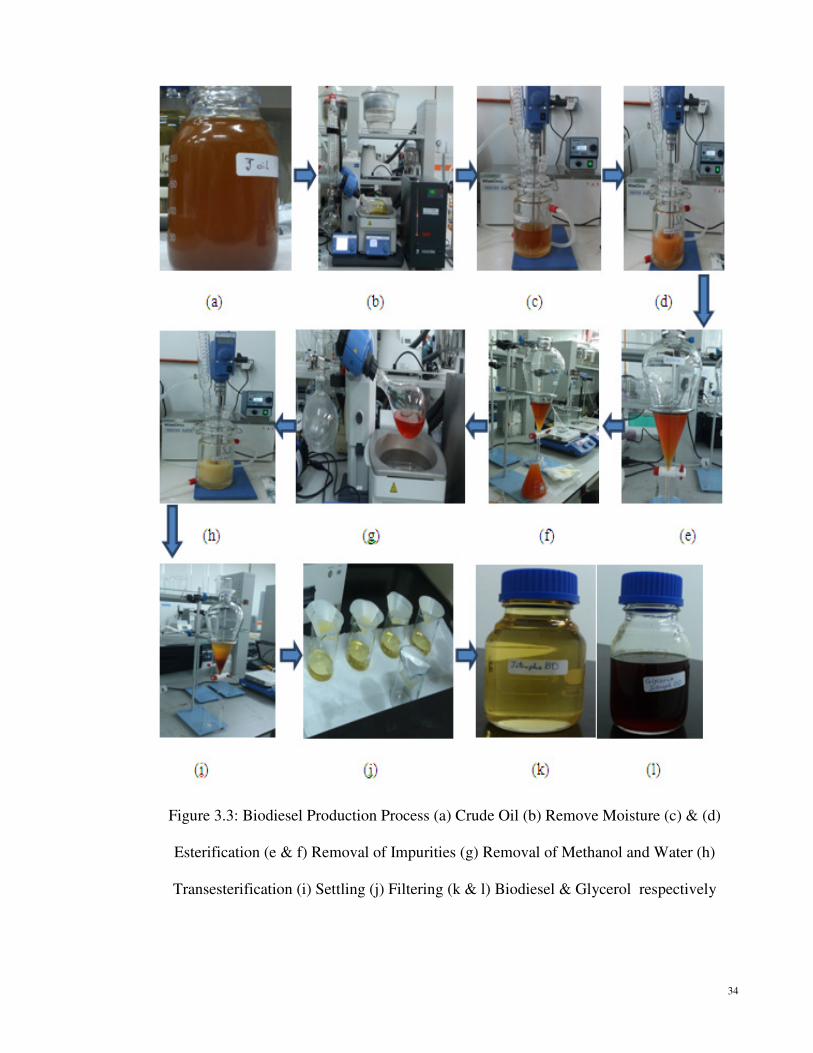
34
Figure 3.3: Biodiesel Production Process (a) Crude Oil (b) Remove Moisture (c) & (d)
Esterification (e & f) Removal of Impurities (g) Removal of Methanol and Water (h)
Transesterification (i) Settling (j) Filtering (k & l) Biodiesel & Glycerol respectively

35
3.4 Determination of Fatty Acid Composition
In this test 0.25g of each sample samples was diluted with 5ml n-heptane. The solution was
then entered into GC (GC 7890A, Agilent technologies). Table 3.2 shows the operating
condition used to perform this analysis.
Table 3.2: GC Operating Conditions
Property Specification
Carrier gas He at 23.878Psi Linear velocity 44.124cm/s at 100°C Flow rate Air = 450mL/min
H2 = 40mL/min He = 20ml/min
Detector temperature 250°C Column head pressure 23.878Psi Column dimensions 30m x 0.25mm x 0.25µm Injector Type = split and splitless
Split ratio 50:1 Injection volume 0.3µL
Temperature Ramp 1 100°C hold for 0 min Temperature Ramp 2 10°C/min to 250°C hold for 5 min
3.5 FT-IR Analysis
Biodiesel from Palm, Jatropha curcas and Moringa oleifera oils were characterized by FT-
IR, using a Perkin Elmer biodiesel FAME analyzer equipped with the MIR TGS detector in
the range 4000-400 cm-1 and processed with the computer software program spectrum. The
resolution was 4 cm-1 and 8 scans.
3.6 Fuel Properties Measuring Procedure and Equipment
The quality of oil is expressed in terms of the fuel properties such as viscosity, density,
calorific value, CCR, flash point, pour point, cloud point and cold filter plugging point etc.

36
The important physical and chemical properties of the crude oils and their methyl esters
were tested according to ASTM D6751 standard.
3.6.1 Dynamic Viscosity, Kinematic Viscosity, Density and Viscosity Index
Measurement
Density is defined as the ratio of mass to volume and Viscosity is the measure of the flow
resistance of a fluid. It provides an estimation of the time required for a given volume of
fuel to flow through a calibrated glass capillary tube under gravity. In this study, an Anton
Paar automatic viscometer (SVM 3000) was used as shown in Figure 3.4 to measure the
dynamic viscosity (mPa.s) and density (kg/cm3) of the fuel according to ASTM D7042.
From this result, the viscometer automatically calculates the kinematic viscosity and
delivers measurement results which are equivalent to ISO 3104 or ASTM D445. Biodiesel
viscosity was measured at +40°C and 100°C. The viscosity index is an important value,
especially in the automotive industry. The viscosity index is calculated from the kinematic
viscosity at 40 °C and at 100 °C. The SVM 3000 covers the whole measuring range from
less than 1 to 20 000 mm2/s.
However, to calculate the kinematic viscosity from the dynamic viscosity, density result is
required. For this reason, a density measuring cell in SVM 3000 has been given. Both cells
are filled in one cycle and the measurements are carried simultaneously. However by using
mode settings menu, selection of required standard test can be adapted from 10 predefined
standards settings. After switching ON, a self-test and the initializing procedure will be
performed by SVM. After that it becomes ready for measurement and will show the first
measuring window. During the measurement, current repeat deviation for density and
viscosity can be viewed. If the results of the first repetition are within the limits for the
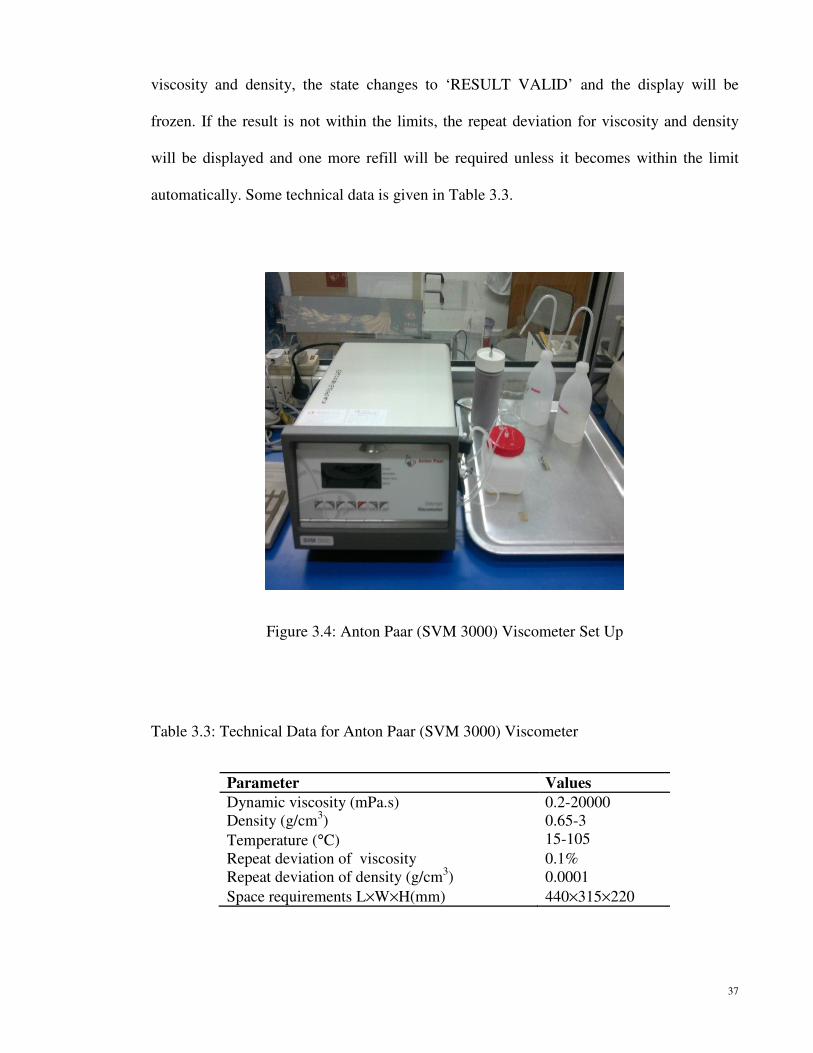
37
viscosity and density, the state changes to ‘RESULT VALID’ and the display will be
frozen. If the result is not within the limits, the repeat deviation for viscosity and density
will be displayed and one more refill will be required unless it becomes within the limit
automatically. Some technical data is given in Table 3.3.
Figure 3.4: Anton Paar (SVM 3000) Viscometer Set Up
Table 3.3: Technical Data for Anton Paar (SVM 3000) Viscometer
Parameter Values
Dynamic viscosity (mPa.s) 0.2-20000 Density (g/cm3) 0.65-3 Temperature (°C) 15-105 Repeat deviation of viscosity 0.1% Repeat deviation of density (g/cm3) 0.0001 Space requirements L×W×H(mm) 440×315×220
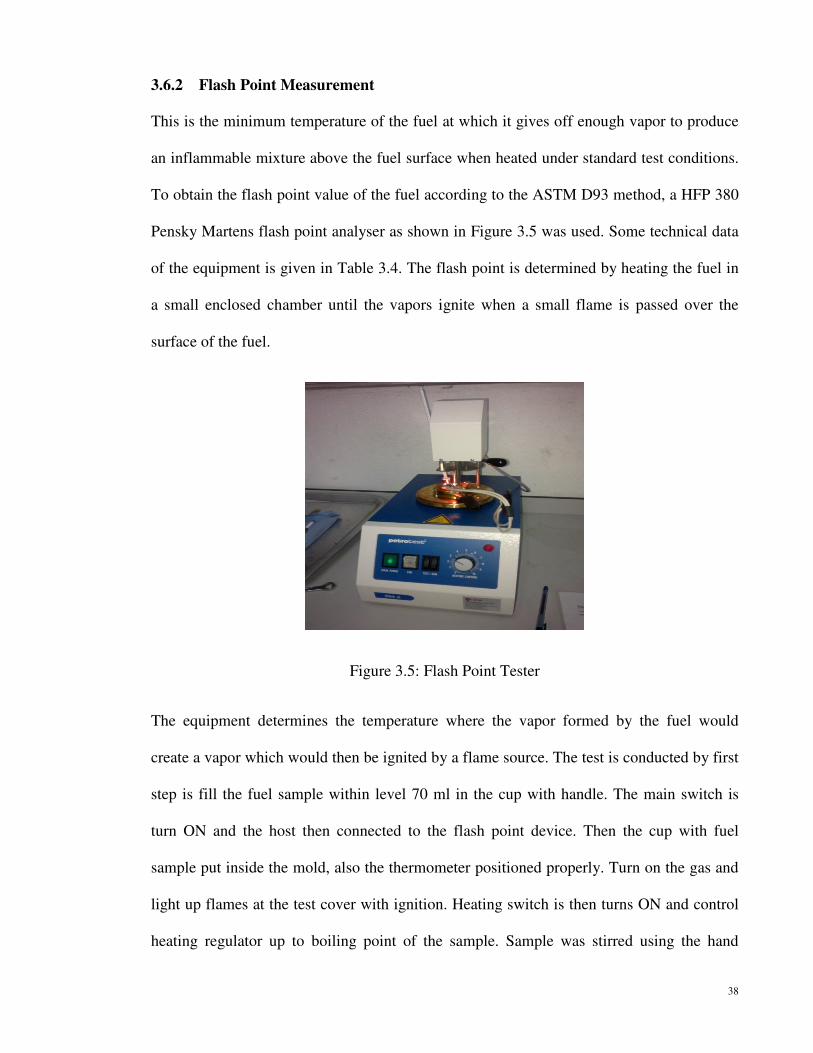
38
3.6.2 Flash Point Measurement
This is the minimum temperature of the fuel at which it gives off enough vapor to produce
an inflammable mixture above the fuel surface when heated under standard test conditions.
To obtain the flash point value of the fuel according to the ASTM D93 method, a HFP 380
Pensky Martens flash point analyser as shown in Figure 3.5 was used. Some technical data
of the equipment is given in Table 3.4. The flash point is determined by heating the fuel in
a small enclosed chamber until the vapors ignite when a small flame is passed over the
surface of the fuel.
Figure 3.5: Flash Point Tester
The equipment determines the temperature where the vapor formed by the fuel would
create a vapor which would then be ignited by a flame source. The test is conducted by first
step is fill the fuel sample within level 70 ml in the cup with handle. The main switch is
turn ON and the host then connected to the flash point device. Then the cup with fuel
sample put inside the mold, also the thermometer positioned properly. Turn on the gas and
light up flames at the test cover with ignition. Heating switch is then turns ON and control
heating regulator up to boiling point of the sample. Sample was stirred using the hand

39
stirrer and it was checked frequently to ensure when the flash point occurs (the flame
exiting the device would burn). Temperature reading then recorded at this stage for flash
point of the fuel sample.
Table 3.4: Technical Data for Flash Point Tester
Parameter Values
Temperature range Approx. +40 to +360 °C Ignition type Gas and electric (included) Stirring speeds 120 or 250 rpm (selectable) Sensing system Differential-thermocouple Gas connection For propane/butane or natural gas (max. 0.05 bar) Dimension (L×W×H) 230×470×460 mm
3.6.3 Calorific Value Measurement
The heating value of all the fuel samples used in this research work was determined using
IKA C 2000 calorimeter. IKA C 2000 calorimeter system shown in Figure 3.6 can be used
to determine the gross calorific value of solid and liquid materials in accordance to DIN
51900, BS 1016 T5, ISO 1928, ASTM 5468 and ASTM 4809. Some technical data of the
calorimeter can be found from Table 3.5.
Figure 3.6: IKA C 2000 Calorimeter
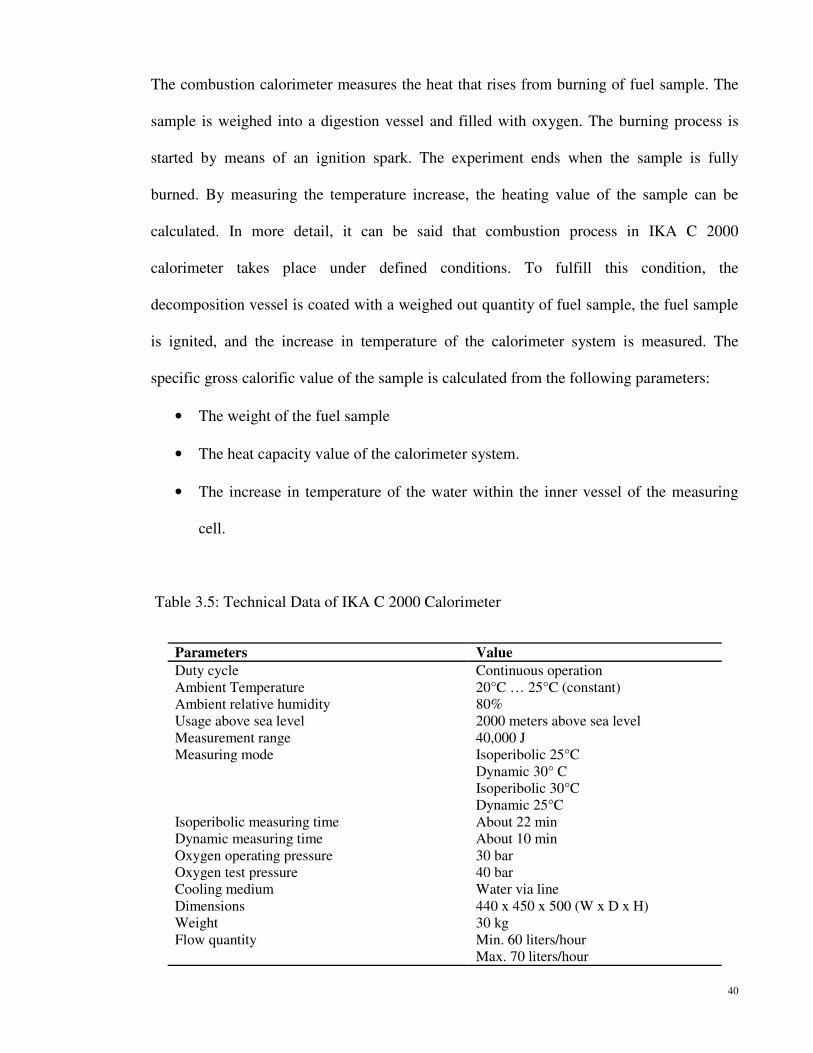
40
The combustion calorimeter measures the heat that rises from burning of fuel sample. The
sample is weighed into a digestion vessel and filled with oxygen. The burning process is
started by means of an ignition spark. The experiment ends when the sample is fully
burned. By measuring the temperature increase, the heating value of the sample can be
calculated. In more detail, it can be said that combustion process in IKA C 2000
calorimeter takes place under defined conditions. To fulfill this condition, the
decomposition vessel is coated with a weighed out quantity of fuel sample, the fuel sample
is ignited, and the increase in temperature of the calorimeter system is measured. The
specific gross calorific value of the sample is calculated from the following parameters:
• The weight of the fuel sample
• The heat capacity value of the calorimeter system.
• The increase in temperature of the water within the inner vessel of the measuring
cell.
Table 3.5: Technical Data of IKA C 2000 Calorimeter
Parameters Value
Duty cycle Continuous operation Ambient Temperature 20°C … 25°C (constant) Ambient relative humidity 80% Usage above sea level 2000 meters above sea level Measurement range 40,000 J Measuring mode Isoperibolic 25°C
Dynamic 30° C Isoperibolic 30°C Dynamic 25°C
Isoperibolic measuring time About 22 min Dynamic measuring time About 10 min Oxygen operating pressure 30 bar Oxygen test pressure 40 bar Cooling medium Water via line Dimensions 440 x 450 x 500 (W x D x H) Weight 30 kg Flow quantity Min. 60 liters/hour
Max. 70 liters/hour

41
However during an experiment, the following processes occur in the measuring cell
• The measuring cell cover starts closing automatically, once the decomposition
vessel is immersed with the fuel sample in the inner vessel.
• Pure oxygen (99.95%) flows into the decomposition vessel through the oxygen
filling apparatus until the required pressure has been reached (30 bars).
• Water from an external pressure source flows into the device and is heated up to the
working temperature (optionally 25° C-30 °C).
• The inner vessel is filled with temperature-controlled water (at working
temperature).
• The temperature of the water in the insulating outer vessel is controlled.
• With the help of ignition device, fuel sample is ignited.
3.6.4 Oxidation Stability
Biodiesel which is produced from vegetable oils is considered more vulnerable to oxidation
at high temperature and contact of air, because of bearing the double bond molecules in the
free fatty acid. The biodiesel and its blends stability was measured by induction period.
Oxidation stability of samples was evaluated with commercial appliance Rancimat 743 as
shown in Figure 3.7 applying accelerated oxidation test (Rancimat test) specified in EN
14112. The end of the induction period (IP) was determined by the formation of volatile
acids measured by a sudden increase of conductivity during a forced oxidation of ester
sample at 110 °C with airflow of 10 L/h passing through the sample. Some technical data is
given in Table 3.6.

42
Figure 3.7: Rancimat 743
However during the experiment following procedure was followed:
� The heating block is heated up to the 110° C temperature.
� The measuring vessel is filled with 60 mL deionized water and placed on the
Rancimat together with the measuring vessel cover. For long analysis times (> 72
h), it is recommended to increase the volume to compensate evaporation loss. An
evaporation rate of 5 … 10 mL water per day has to be taken into account. It has to
be ensured that the electrode is immersed into the measuring solution at any time.
� For each determination, a new reaction vessel is used. To remove particles (e.g.,
from the cardboard box) the reaction vessel is air-cleaned inside and outside by a
sharp stream of nitrogen. Then sample is weighed directly into the reaction vessel.
For liquid samples and for samples that melt at elevated temperatures a sample size
of 3.0 ± 0.1 g is used. For samples with significant water content (> 5%) the sample
size has to be increased to compensate the decrease in volume when the water
evaporates. Ensure that the air inlet tube always immerses in the sample. Solid
samples which do not melt should only cover the bottom of the reaction vessel. In
this case, 0.5 … 1 g of the powdered sample is weighed into the reaction vessel.

43
� The reaction vessel is closed with a reaction vessel cover assembled with an air inlet
tube.
� Before the determination can be started, the temperature of the heating block has to
be stable. The two tubing’s between Rancimat and reaction vessel and between
reaction vessel and measuring vessel are connected. Then the reaction vessel is
placed in the heating block and the measurement is started immediately.
Table 3.6: Technical Data of 737 Rancimat Instrument
Parameter Values
Sample size Liquid samples: 3.0 ± 0.1 g Measuring solution 60 mL Temperature (°C) 80-160 Gas Flow 10 L/hr Evaluation Induction time Evaluation sensitivity 1.0
3.6.5 Cloud Point and Pour Point
The pour point describes a procedure for testing the fluidity of a fuel at a specified
temperature. The cloud point is defined as the temperature of a liquid specimen when the
smallest observable cluster of wax crystals first appears upon cooling under prescribed
conditions. An automatic NTE 450 (Norma lab, France) Cloud and Pour point tester as
shown in Figure 3.8 was used to measure the cloud point and pour point of the samples
according to the ASTM D2500 and ASTM D93 respectively. Table 3.7 shows some
technical data of cloud and pour point tester.

44
Table 3.7: Technical Data of NTE 450 Cloud and Pour Point Tester
Pour Point Cloud point
Detection by optical fiber Detection by ultrasonic sensor Temperature range from -75°C to 51°C Intervals of 1°C Resolution: 1°C Resolution: 0.1°C Tilting intervals: every 3°C or 1°C Temperature range from -75°C to 49°C
Figure 3.8: NTE 450 CP and PP Tester (Norma Lab, France)
3.6.6 Cold Filter Plugging Point
This test method covers the determination of the cold filter plugging point (CFPP) of fuels
using automated equipment. The results express an estimation of the lowest temperature at
which a fuel will freely flow within a fuel system. An automatic NTE 450 (Norma lab,
France) cold filter plugging point tester as shown in Figure 3.9 was used to measure the
cold filter plugging point (CFPP) of the samples according to the ASTM D6371 standards.
Table 3.8 shows some technical data of cold filter plugging point tester.

45
Figure 3.9: NTE 450 CFPP Tester
Table 3.8: Technical Data of NTE 450 Cold Filter Plugging Point Tester
Parameter Values
Detection by Optical cell Temperature range -80°C to 20°C Temperature measurement resolution 1°C Tilting intervals every 3°C
3.6.7 Determination of Acid Value, the Saponification Number (SN), Iodine Value
(IV) and Cetane Number (CN)
Acid value is the number of milligrams of potassium or sodium hydroxide necessary to
neutralize the free acid in 1 g of sample. The acid value can be calculated using the
following equation:
�� ������
� (3.1)
Where,

46
MW ≡ Molecular weight of potassium hydroxide (KOH)
N≡ Normality of sodium hydroxide (KOH) solution.
V≡ Volume of sodium hydroxide (KOH) solution used in titration.
W ≡ Weight of oil sample
The saponification numbers (SN), iodine value (IV) and cetane number (CN) of the methyl
esters of were calculated empirically from its fatty acid methyl ester compositions with the
help of Eqs. (3.2), (3.3) and (3.4), respectively (Devan 2009b):
CN= 46.3+ (5458/SV) - (0.225⋅IV)…………………………………………………………. (3.2)
SN= SUM (560⋅Ai)/MWi ………………………………………………………..……………. (3.3)
IV= SUM (254⋅Ai ⋅D)/MWi …........................................................................................ (3.4)
Where Ai is the percentage of each component, D is the number of double bonds and MWi
molecular mass of each component.
3.7 Biodiesel-Diesel Blending
Each test fuel blend was prepared prior to the properties test and engine test. In this respect,
the test fuels were blended for 20 minutes by using a homogenizer device at a speed of
2000 rpm. The homogenizer was fixed on a clamp on a vertical stand as shown in Figure
3.10, which allows changing of the homogenizer’s height. To mix the fuels by using the
homogenizer, the plug is turned ON and the appropriate speed is selected by using the
selector which is located on top of the homogenizer.

47
Figure 3.10: Biodiesel Blending Process
In this study the effect of biodiesel-diesel blending by a percentage of (10-90% v/v) on
some physical and chemical properties has been studied and presented. These include flash
point, viscosity, cloud point, pour point and cold filter plugging point. In this paper,
polynomial curve fitting method was used to estimate the properties of other biodiesel
blends. This method is an attempt to describe the relationship between variable as a
function of available data and a response�, which seeks to find a smooth curve that best
fits the data. Mathematically, a polynomial of order k in is expressed in the following
form:
Y= C0 + C1X + C2X2 + ………+ CkX
k …………………………………………………. (3.5)
3.8 Engine Set-Up and Engine Performance Procedure
The experimental investigation was carried out using 13 fuel samples including diesel fuel
and (B5, B10, B15, B20) of each feedstocks. These blends was chosen based on the reports
by the researchers that up to 20% of biodiesel blend can be used in a diesel engine without

48
any modification. The blend compositions of all fuel samples are given in Table 3.9. The
engine used is a Mitsubishi Pajero (model 4D56T) multi-cylinder diesel engine coupled
with an eddy current dynamometer. Figure 3.11 shows the test rig of the engine and Figure
3.12 shows the schematic of experimental set-up. The detailed specification of the engine is
shown in Table 3.10. In order to carry out engine performance test, the engine was run at
various speeds range from 1000 rpm to 4000 rpm at an interval of 500 rpm at full load
conditions. The engine was connected with test bed and a computer data acquisition
system which collects signal, rectify, filter and convert the signal to the data to be read.
Table 3.9: Blend Fuel Compositions (% Vol)
No. Fuel Samples Samples description
01 B0 Diesel fuel 02 PB5 5% Palm biodiesel + 95% diesel fuel 03 PB10 10% Palm biodiesel + 90% diesel fuel 04 PB15 15% Palm biodiesel + 85% diesel fuel 05 PB20 20% Palm biodiesel + 80% diesel fuel 06 JB5 5% Jatropha biodiesel + 95% diesel fuel 07 JB10 10% Jatropha biodiesel + 90% diesel fuel 08 JB15 15% Jatropha biodiesel + 85% diesel fuel 09 JB20 20% Jatropha biodiesel + 80% diesel fuel 10 MB5 5% Moringa biodiesel + 95% diesel fuel 11 MB10 10% Moringa biodiesel + 90% diesel fuel 12 MB15 15% Moringa biodiesel + 85% diesel fuel 13 MB20 20% Moringa biodiesel + 80% diesel fuel
In order to carry out the engine performance tests for this study such as engine torque,
brake power, brake specific fuel consumptions, brake specific air consumptions, engine test
conditions were monitored by REO-DCA controller connected through a desktop to the
engine test bed. All the performance data was measured at step RPM test mode. At every
500 rpm increments, engine stabilizes for 20 seconds and acquires data for next 20 seconds.

49
For performance test, each fuel sample has been tested for three times and their results are
averaged. The data logged by the computer are:
� Engine speed
� Dynamometer load
� Throttle position
� Fuel flow rate
� Air flow rate
� Fuel temperature
� Air temperature
� Lube oil temperature
� Coolant temperature
� Inlet and exhaust manifold temperature
� Engine torque
� Brake power
� Brake specific fuel consumption
Before the engine and dynamometer are started, several precautions had to be taken into
consideration.
(a) The motor was switched ON to supply cooling water to the dynamometer and the
flow out water was controlled to maintain a suitable flow rate by using the water
outlet valve.
(b) It was ensured that the water level of the main water tank was always sufficient
during the engine test.
(c) The engine lube oil was checked with the dipstick indicator.

50
(d) The cooling water inlet was adjusted by using the valves to control the flow rate in
order to maintain the inlet temperature.
Table 3.10: Specifications of the Engine
Parameter Unit Description Engine type 4 cylinder inline Displacement (L) 2.5 Cylinder bore x stroke (mm) 92 x 96 Compression ratio 21:1 Maximum engine speed (rpm) 4200 Maximum power (kW) 55
Fuel system Distribution type jet pump (indirect injection)
Lubrication System Pressure feed
Combustion chamber Swirl type
Cooling system Radiator cooling
Figure 3.11: Engine Test Bed

51
Figure 3.12: Schematic Diagram of Engine Test Bed
3.8.1 Dynamometer
The dynamometer is used to exert a fixed loading onto the engine for the purpose of
analysis and it also measures the speed at which the engine is rotating. The dynamometer is
connected to the engine by a shaft which is enclosed in a steel casing between the test
engine and the dynamometer. The dynamometer is cooled by the cooling system which is
located in front of it. The cooling system has a pump which moves the water through the
dynamometer into the radiator where it will be cooled by the air pushed by the fan and
enters the dynamometer to complete the cycle. Figure 3.13 shows the dynamometer of the
diesel engine.

52
Figure 3.13: Dynamometer
The dynamometer is connected to the controller box where the measured speed and also the
torque are displayed. The dynamometer is turned ON by switching both the switches at the
dynamometer controller to ‘ON’. The torque is adjusted by turning the red knob on the
dynamometer controller. The knob is turned in the counter clockwise direction to increase
the torque and the knob is turned in the clockwise direction to reduce the torque. Caution
steps should be taken as not to suddenly increase the torque of the dynamometer which
could cause the shaft to break under the sudden increase in stress. Also, load should not be
increased too much that will cause a lot of stress on the engine and would stop the engine.
3.9 Apparatus for Engine Emission Studies
A BOSCH exhaust gas analyzer (model BEA-350) was used as shown in Figure 3.14 to
measure the exhaust emission gases emission of NO and HC in ppm while CO and CO2 in
volume percent. The details of gas analyzer are shown in Table 3.11. In this research work
exhaust emission was measured at various speeds range from 1000 rpm to 4000 rpm at an
interval of 500 rpm at full load conditions by inserting probe into the tail pipe. First the

53
engine was run using diesel fuel to get baseline data and other fuel blends were tested
accordingly.
To get the average values, all tests were repeated three times. The technology of this
analyzer consisted of automatic measurements with microprocessor control and self-test,
auto calibration before every analysis, and a high degree of accuracy in analysis of low
concentrations of gases found in engine fitted with catalytic converter. After the instrument
is switched ON it takes three minutes to warm up. During this time no measurement is
possible. After a system adjustment has been conducted with zero gas, the measurement
can be taken. Before every measurement the zero point of the analysis system is
automatically adjusted with zero gas after the pump is switched on. During the first 15
seconds of the 30 seconds adjustment, zero is indicated in the indicator panels for the gases
and the particular upper limit of the effective range is indicated for 15 seconds. During the
test, the water condensed in the hose connecting the probe and it is collected in the
condensate container and automatically sucked out. However a new condensate filter has to
be installed by switching of the measured-gas pump, if the present is badly fouled.
Figure 3.14: Bosch Gas Analyzer (BEA 350)

54
Table 3.11: Details of the Exhaust Gas Analyzer (BEA-350)
Equipment Method Measurement Upper limit Accuracy Percentage
uncertainties
BOSCH gas analyser
Non-dispersive infrared
CO 10.00 vol% ±0.001 vol% 0.002 vol%
Non-dispersive infrared
CO2 18.00 vol% ±0.001 vol% 0.150 vol%
Flame ionization detector (FID)
HC 9999 ppm ±l ppm 2 ppm
Electro-chemical transmitter
NO 5000 ppm ±1 ppm 21 ppm

55
4 CHAPTER 4
RESULT AND DISCUSSIONS
4.0 Introduction
In this chapter, the physical and chemical properties of crude edible and non-edible oil
feedstocks was presented followed by the properties include kinematic viscosity, density,
viscosity index, cloud point, pour point, and cold filter plugging point, flash point, calorific
value and oxidation stability of biodiesel synthesized from edible and non-edible
feedstocks. The physical and chemical properties of biodiesel-diesel blends ratios of (B0-
B100) were fully covered and presented. Moreover, the polynomial curve fitting method
was used to see the effect of blending on fuel properties and to predict the properties of
biodiesel blends at any blends ratio. Finally, data of engine performance and emission
characteristics using a total of 12 fuel samples (B5, B10, B15 and B20 of each biodiesel)
were presented and compared with that of diesel fuel.
4.1 Physico-Chemical Properties of Crude Palm, Jatropha Curcas and Moringa
Oleifera Oil
The feedstock characteristics such as FFA and acid values influence the biodiesel
production process selection and final properties of biodiesel. Moreover, feedstocks with
high MIU and titter require extra processing steps like filtration, centrifuging and heating.
Table 4.1 shows the main findings of the physical and the chemical properties of crude
palm, Jatropha curcas and Moringa oleifera oil.

56
Table 4.1: Physico-Chemical Properties of Crude Palm, Jatropha Curcas and Moringa
Oleifera Oil
From Table 4.1 it can be seen that Moringa oleifera oil has highest kinematic viscosity of
43.33 mm2/s at 40 °C and 8.91 mm2/s at 100 °C, dynamic viscosity 38.90 mPa.s at 40 °C
while Palm oil have kinematic viscosity of 40.40 mm2/s at 40 °C and 8.43 mm2/s at 100 °C,
dynamic viscosity 36.30 mPa.s at 40 °C and Jatropha curcas oil have kinematic viscosity
of 34.93 mm2/s at 40 °C and 7.81 mm2/s at 100 °C, dynamic viscosity 31.52 mPa.s at
40 °C.
It is clear that all crude oil samples have higher viscosity. These high values of viscosities
can negatively affect the volume flow and injection spray characteristics in the engine. At
low temperature it may even compromise the mechanical integrity of the injection pump
drive systems (Jayed et al. 2009). Therefore, it is suggested that oil from the crops should
be either blended with diesel fuel or transesterified to biodiesel to reduce the viscosity and
density properties when used in CI engines.
Properties Units Standards Palm
oil
Jatropha
oil
Moringa
oil
Dynamic viscosity mPa.s ASTM D445 36.30 31.52 38.90 Kinematic viscosity at 40 °C
mm2/s ASTM D445 40.40 34.93 43.33
Kinematic viscosity at 100 °C
mm2/s ASTM D445 8.43 7.81 8.91
Viscosity Index - N/A 192.1 204.5 193.1 Density at 15 °C kg/m3 ASTM D4052 898.4 902.5 897.5 Flash point °C ASTM D93 165 220 268.5 Pour point °C ASTM D97 9 -3 11 Cloud point °C ASTM D2500 8 -2 10 Calorific value MJ/kg ASTM D240 39.44 38.66 38.05 Acid value mgKOH/g
oil ASTM D664 3.47 10.7 8.62

57
The density results showed that the Jatropha curcas oil possesses highest density 902
kg/m3 followed by Palm oil and Moringa oleifera oil which have 898.5 and 897.5 kg/m3
respectively.
The flash point results showed that Moringa oleifera oil possesses highest flash point 265.4
°C followed by Jatropha curcas and palm oil which have 220 °C and 165°C respectively.
All of these crude oils have very high flash points (>160 °C) which indicate that these oils
are very safe for transportation, handling and storage.
Calorific value is an important parameter in the selection of a fuel. If the fuel has higher
calorific value then it will have tendency to produce more power in the engine. The result
from Table 4.1 shows that Palm oil possesses highest calorific value 39.44 MJ/kg followed
by Jatropha oil (38.66 MJ/kg) and Moringa oleifera oil (38.05 MJ/kg) respectively.
The acid value results showed that the crude Jatropha curcas oil possesses highest acid
value of 10.7 mg KOH/g oil followed by Moringa oil (8.62 KOH/g oil) and Palm oil (3.47
mg KOH/g oil) respectively. So it is easier to convert palm oil into palm biodiesel
compared to Jatropha and Moringa oil respectively.
4.2 Characterization of Palm, Jatropha Curcas and Moringa Oleifera Biodiesel
4.2.1 Properties Analysis
The quality of biodiesel depends upon the feedstocks quality, chemical composition of
feedstock, production process, storage and handling process. Biodiesel quality is assessed
through the determination of physical and chemical properties. The physical and chemical
properties of Palm, Jatropha curcas and Moringa oleifera are presented in Table 4.2.
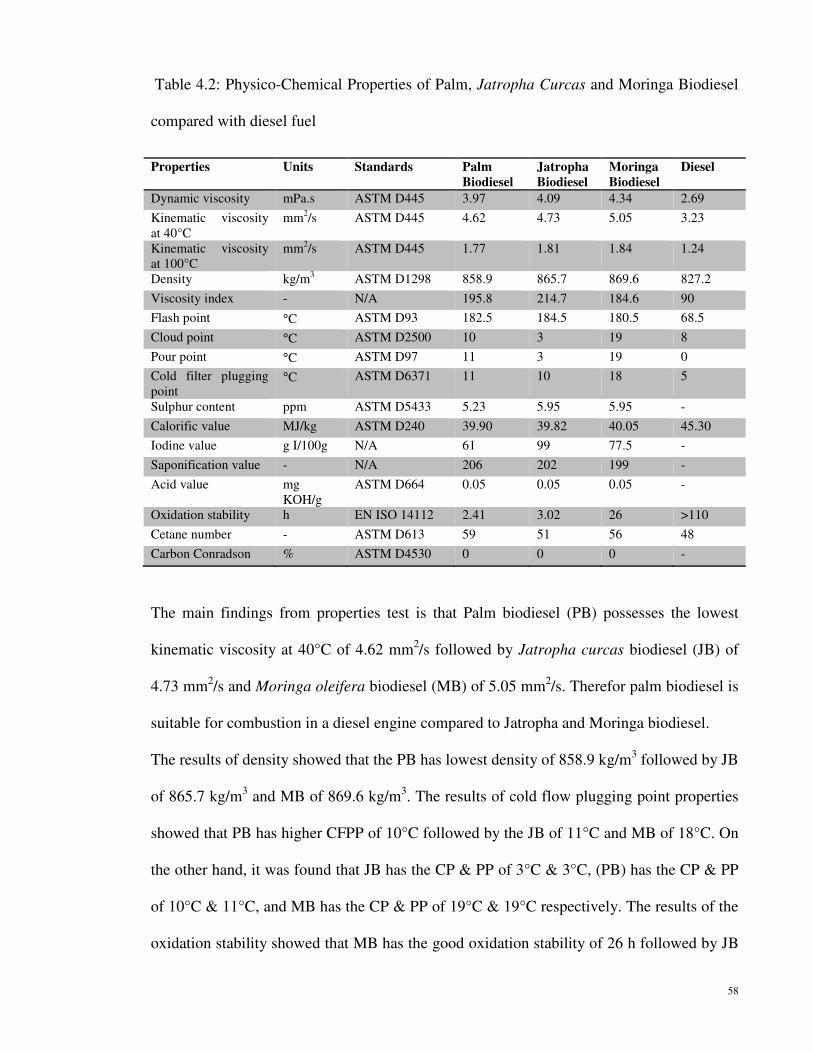
58
Table 4.2: Physico-Chemical Properties of Palm, Jatropha Curcas and Moringa Biodiesel
compared with diesel fuel
The main findings from properties test is that Palm biodiesel (PB) possesses the lowest
kinematic viscosity at 40°C of 4.62 mm2/s followed by Jatropha curcas biodiesel (JB) of
4.73 mm2/s and Moringa oleifera biodiesel (MB) of 5.05 mm2/s. Therefor palm biodiesel is
suitable for combustion in a diesel engine compared to Jatropha and Moringa biodiesel.
The results of density showed that the PB has lowest density of 858.9 kg/m3 followed by JB
of 865.7 kg/m3 and MB of 869.6 kg/m3. The results of cold flow plugging point properties
showed that PB has higher CFPP of 10°C followed by the JB of 11°C and MB of 18°C. On
the other hand, it was found that JB has the CP & PP of 3°C & 3°C, (PB) has the CP & PP
of 10°C & 11°C, and MB has the CP & PP of 19°C & 19°C respectively. The results of the
oxidation stability showed that MB has the good oxidation stability of 26 h followed by JB
Properties Units Standards Palm
Biodiesel
Jatropha
Biodiesel
Moringa
Biodiesel
Diesel
Dynamic viscosity mPa.s ASTM D445 3.97 4.09 4.34 2.69
Kinematic viscosity at 40°C
mm2/s ASTM D445 4.62 4.73 5.05 3.23
Kinematic viscosity at 100°C
mm2/s ASTM D445 1.77 1.81 1.84 1.24
Density kg/m3 ASTM D1298 858.9 865.7 869.6 827.2
Viscosity index - N/A 195.8 214.7 184.6 90
Flash point °C ASTM D93 182.5 184.5 180.5 68.5
Cloud point °C ASTM D2500 10 3 19 8
Pour point °C ASTM D97 11 3 19 0
Cold filter plugging point
°C ASTM D6371 11 10 18 5
Sulphur content ppm ASTM D5433 5.23 5.95 5.95 -
Calorific value MJ/kg ASTM D240 39.90 39.82 40.05 45.30
Iodine value g I/100g N/A 61 99 77.5 -
Saponification value - N/A 206 202 199 -
Acid value mg KOH/g
ASTM D664 0.05 0.05 0.05 -
Oxidation stability h EN ISO 14112 2.41 3.02 26 >110
Cetane number - ASTM D613 59 51 56 48
Carbon Conradson % ASTM D4530 0 0 0 -

59
of 3.2 h and PB of only 2.41 h. Moreover, MB possesses the highest calorific value of
40.05 MJ/kg compared to PB of 39.90 MJ/kg and JB of 39.82 MJ/kg respectively. The
results of flash point show that JB has the highest flash point of 184.5°C, followed by PB of
182.5°C and MB of 180.5°C. So it is seen that Jatropha biodiesel have good cold flow
properties and is safer to store compared to Palm and Moringa biodiesel.
4.2.2 Fatty Acids Composition of Palm, Jatropha Curcas and Moringa Oleifera
Biodiesel
Fatty acid without double bond is known as saturated fatty acids and Fatty acid containing
double bond is termed as unsaturated fatty acids. The results of FAC of Palm biodiesel
(PB), Jatropha curcas biodiesel (JB) and Moringa oleifera biodiesel (MB) are shown in
Table 4.3. It was found that PB contained (44.4%) saturated and (55.6%) unsaturated fatty
acids, JB contained (22.6%) saturated and (77.4%) unsaturated fatty acids and MB
contained (18.6%) saturated and (81.4%) unsaturated fatty acids respectively.
Table 4.3: Fatty Acid Composition of Palm, Jatropha and Moringa Biodiesel
Sl. No.
Fatty acid Molecular weight
Structure Systematic name
Formula PB (%)
JB (%)
MB (%)
01 Lauric 200 12:0 Dodecanoic C12H24O2 - 0.1 0 02 Myristic acid 228 14:0 Tetradecanoic C14H28O2 - 0.1 0.1 03 Palmitic 256 16:0 Hexadecanoic C16H32O2 40.5 14.6 7.9 04 Palmitoleic 254 16.1 hexadec-9-enoic C16H30O2 - 0.6 1.7 05 Stearic 284 18:0 Octadecanoic C18H36O2 4.1 7.6 5.5 06 Oleic 282 18:1 cis-9-Octadecenoic C18H34O2 43.4 44.6 74.1 07 Linoleic 280 18:2 cis-9-cis-12
Octadecadienoic C18H32O2 12.0 31.9 4.1
08 Linolenic 278 18:3 cis-9-cis-12 C18H30O2 - 0.3 0.2 09 Arachidic 312 20:0 Eicosanoic C20H40O2 - 0.2 2.3 10 Eicosanoic 310 20:1 cis-11-eicosenoic C20H38O2 - - 1.3 11 Behenic 340 22:0 Docosanoic C22H44O2 - - 2.8 12 Other 0 0 0 Saturated 44.6 22.6 18.6 Monounsaturated 43.4 45.2 77.1 Polyunsaturated 12.0 32.2 4.3 Total 100 100 100

60
4.2.3 Structural Analysis
The structural analysis of Palm, Jatropha curcas and Moringa oleifera biodiesel was done
by FT-IR analysis. Figure 4.1 shows the Fourier transform infrared (FT-IR) spectrum of the
Palm, Jatropha curcas and Moringa oleifera biodiesel. The characteristics peaks of the
Palm, Jatropha curcas and Moringa oleifera biodiesel are shown in Table 4.4.
(a)
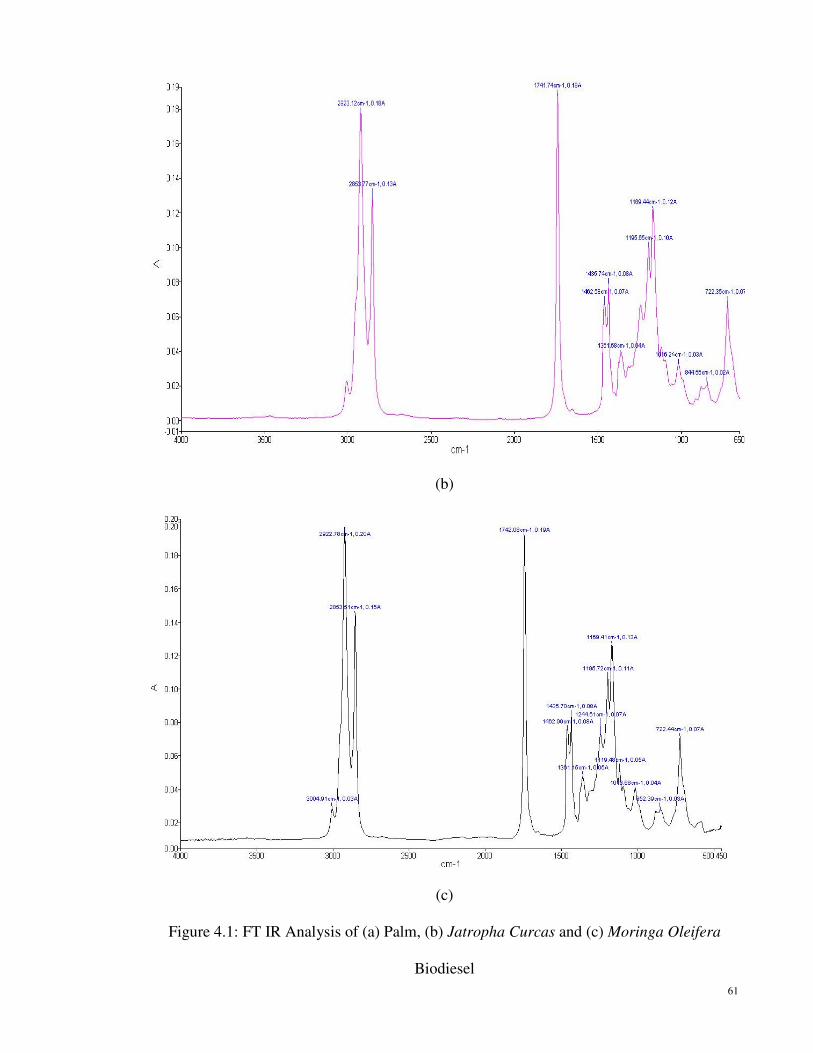
61
(b)
(c)
Figure 4.1: FT IR Analysis of (a) Palm, (b) Jatropha Curcas and (c) Moringa Oleifera
Biodiesel

62
4.3 Effect of Biodiesel-Diesel Blending on Fuel Properties
It was found that blending of biodiesel with diesel has resulted in much improvement in
kinematic viscosity, density, calorific value, oxidation stability. However, flash point and
viscosity index decrease as the percentage of diesel increases in the blend. The next section
will discuss how to establish a mathematical correlation between the blends ratio and
physical and chemical properties.
Table 4.4: Characteristics Peak of PB, JB and MB in FT IR Spectra
4.3.1 Mathematical Relationship between Blends Ratio and Physico-Chemical
Properties
Based on the data of all biodiesel-diesel blend in Appendix B, mathematical equations were
developed for the calculation of oxidation stability (OS), viscosity (KV), density (D),
viscosity index (VI), calorific value (CV) and flash point (FP) of PB, JB and MB blends
with diesel. The next section will explain the results of this study in detail.
Absorption
bands
(cm-1
)
PB
Absorption
bands
(cm-1
)
JB
Absorption
bands
(cm-1
)
MB
Functional
group
Absorption
intensity
2922.77 2912 2922.78-3004.91 C-H stretching vibration
Strong
2853.51 2853 2853.5 CH2 asymmetric and symmetric vibration
Strong
1742 1741 1742.08 C=O stretching vibration
Strong
1435.80-1463.47
1435-1462 1435.7-1462.99 CH2 shear type vibration
Middling
1361.37 1361 1361.15 CH3 bending vibration Middling 1118.08-1195.63
1169-1195 1119.48-1195.72 C-O-C symmetric stretching vibration
Middling
1016.74 1016 1016.68 C-O-C anti-symmetric stretching vibration
Weak
848.86 844 852.39 Epoxy ring vibration Middling 722.11 722 722.44 CH2 plane rocking
vibration Weak

63
4.3.1.1 Kinematic Viscosity (KV)
Figures 4.2 (a-c) and Figures 4.3 (a-c) show the correlations between kinematic viscosity at
40°C and 100°C of PB, JB and MB and their blends with diesel. As can be seen, the
kinematic viscosities of PB, JB and MB decrease remarkably with the increasing
percentage of diesel in the blends. The viscosity values of PB, JB and MB and their blends
with diesel were correlated using Linear Regression Analysis (LRA). The equations
between kinematic viscosity and blends ratio are:
For (PB-diesel blends):
KV at 40°C = 1.3841x + 3.2024 x ≡ (%PB-diesel blends) (4.1)
R² = 0.9948
KV at 100°C = 0.4976x + 1.2616 x ≡ (%PB-diesel blends) (4.2)
R² = 0.9941
For (JB-diesel blends):
KV at 40°C = 1.4491x + 3.2782 x ≡ (%JB-diesel blends) (4.3)
R² = 0.997
KV at 100°C = 0.5409x + 1.2786 x ≡ (%JB-diesel blends) (4.4)
R² = 0.99
For (MB-diesel blends)
KV at 40°C = 1.7446x + 3.2962 x ≡ (%MB-diesel blends) (4.5)
R² = 0.996
KV at 100°C = 0.581x + 1.2795 x ≡ (%MB-diesel blends) (4.6)
R² = 0.9895
It can be observed that the coefficient of regression values indicate that there is a high
regression between kinematic viscosity and biodiesel-diesel blends.
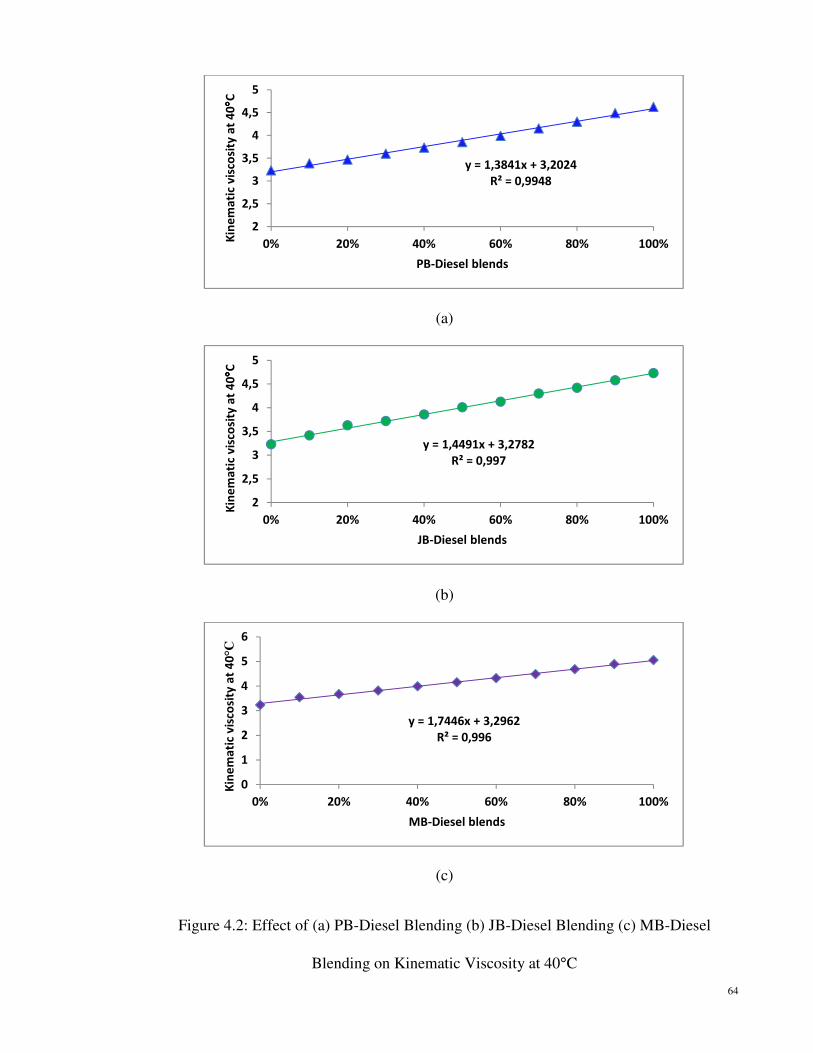
64
(a)
(b)
(c)
Figure 4.2: Effect of (a) PB-Diesel Blending (b) JB-Diesel Blending (c) MB-Diesel
Blending on Kinematic Viscosity at 40°C
y = 1,3841x + 3,2024
R² = 0,9948
2
2,5
3
3,5
4
4,5
5
0% 20% 40% 60% 80% 100%Kin
em
ati
c v
isco
sity
at
40
°° °°C
PB-Diesel blends
y = 1,4491x + 3,2782
R² = 0,997
2
2,5
3
3,5
4
4,5
5
0% 20% 40% 60% 80% 100%
Kin
em
ati
c v
isco
sity
at
40
°° °°C
JB-Diesel blends
y = 1,7446x + 3,2962
R² = 0,996
0
1
2
3
4
5
6
0% 20% 40% 60% 80% 100%
Kin
em
ati
c v
isco
sity
at
40°C
MB-Diesel blends

65
(a)
(b)
(c)
Figure 4.3: Effect of (a) PB-Diesel Blending (b) JB-Diesel Blending (c) MB-Diesel
Blending on Kinematic Viscosity at 100°C
y = 0,4976x + 1,2616
R² = 0,9941
1
1,2
1,4
1,6
1,8
2
0% 20% 40% 60% 80% 100%
Kin
em
ati
c v
isco
sity
at
10
0°° °°C
PB-Diesel blends
y = 0,5409x + 1,2786
R² = 0,99
1
1,2
1,4
1,6
1,8
2
0% 20% 40% 60% 80% 100%
Kin
em
ati
c v
isco
sity
at
10
0°° °°C
JB-Diesel blends
y = 0,581x + 1,2795
R² = 0,9895
0
0,5
1
1,5
2
0% 20% 40% 60% 80% 100%Kin
em
ati
c v
isco
sity
at
10
0°C
MB-Diesel blends
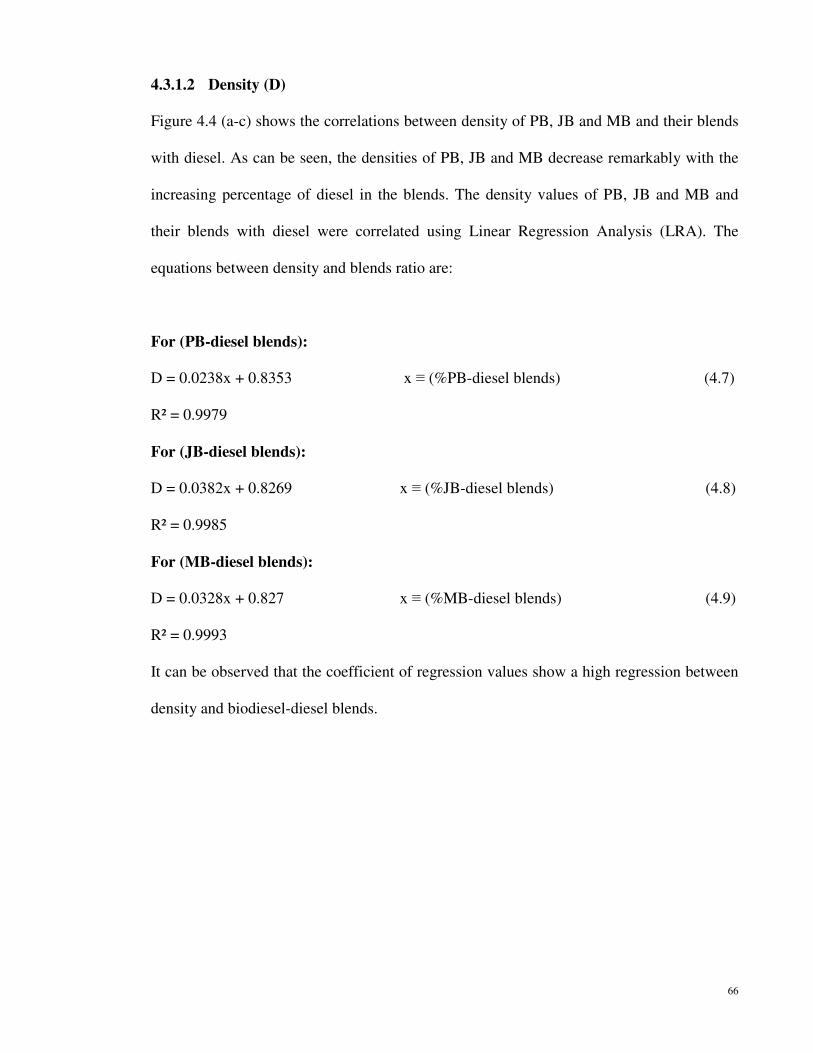
66
4.3.1.2 Density (D)
Figure 4.4 (a-c) shows the correlations between density of PB, JB and MB and their blends
with diesel. As can be seen, the densities of PB, JB and MB decrease remarkably with the
increasing percentage of diesel in the blends. The density values of PB, JB and MB and
their blends with diesel were correlated using Linear Regression Analysis (LRA). The
equations between density and blends ratio are:
For (PB-diesel blends):
D = 0.0238x + 0.8353 x ≡ (%PB-diesel blends) (4.7)
R² = 0.9979
For (JB-diesel blends):
D = 0.0382x + 0.8269 x ≡ (%JB-diesel blends) (4.8)
R² = 0.9985
For (MB-diesel blends):
D = 0.0328x + 0.827 x ≡ (%MB-diesel blends) (4.9)
R² = 0.9993
It can be observed that the coefficient of regression values show a high regression between
density and biodiesel-diesel blends.

67
(a)
(b)
(c)
Figure 4.4: Effect of (a) PB-Diesel Blending (b) JB-Diesel Blending (c) MB-Diesel
Blending on Density
y = 0,0238x + 0,8353
R² = 0,9979
0,83
0,835
0,84
0,845
0,85
0,855
0,86
0,865
0% 20% 40% 60% 80% 100%
De
nsi
ty [
kg
/cm
3]
PB-Diesel blends
y = 0,0382x + 0,8269
R² = 0,9985
0,825
0,83
0,835
0,84
0,845
0,85
0,855
0,86
0,865
0,87
0% 20% 40% 60% 80% 100%
De
nsi
ty [
kg
/cm
3]
JB-Diesel blends
y = 0,0328x + 0,827
R² = 0,9993
0,825
0,83
0,835
0,84
0,845
0,85
0,855
0,86
0,865
0% 20% 40% 60% 80% 100%
De
nsi
ty [
kg
/cm
3]
MB-Diesel blends

68
4.3.1.3 Viscosity Index (VI)
Figure 4.5 (a-c) shows the correlations between viscosity index of PB, JB and MB and their
blends with diesel. As can be seen, the viscosity index values of PB, JB and MB decrease
remarkably with the increasing percentage of diesel in the blends. The viscosity index
values of PB, JB and MB and their blends with diesel were correlated using Polynomial
Regression Analysis (PRA). The equations between viscosity index and blends ratio are:
For (PB-diesel blends):
VI = 254.33x3 - 495.72x2 + 341.41x + 97.911 x ≡ (%PB-diesel blends) (4.10)
R² = 0.9658
For (JB-diesel blends):
VI = 310.12x3 - 573.53x2 + 384.01x + 98.238 x ≡ (%JB-diesel blends) (4.11)
R² = 0.973
For (MB-diesel blends):
VI = 97.909x + 91.236 x ≡ (%MB-diesel blends) (4.12)
R² = 0.9732
It can be observed that the coefficient of regression values show a high regression between
viscosity index and biodiesel-diesel blends.

69
(a)
(b)
(c)
Figure 4.5: Effect of (a) PB-Diesel Blending (b) JB-Diesel Blending (c) MB-Diesel
Blending on Viscosity Index
y = 254.33x3 - 495.72x2 + 341.41x + 97.911
R² = 0.9658
40
90
140
190
0% 20% 40% 60% 80% 100%
Vis
cosi
ty I
nd
ex
PB-Diesel blends
y = 310,12x3 - 573,53x2 + 384,01x + 98,238
R² = 0,973
40
90
140
190
0% 20% 40% 60% 80% 100%
Vis
cosi
ty I
nd
ex
JB-Diesel blends
y = 97,909x + 91,236
R² = 0,9945
40
60
80
100
120
140
160
180
200
0% 20% 40% 60% 80% 100%
Vis
cosi
ty I
nd
ex
MB-Diesel blends
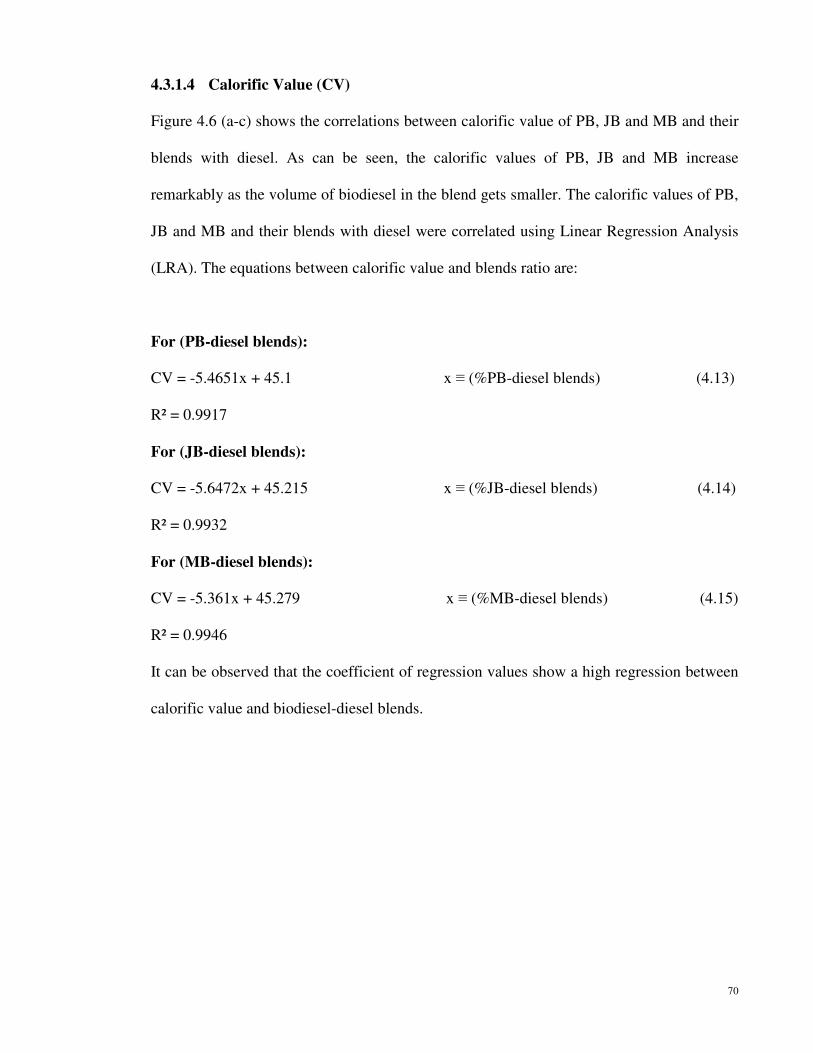
70
4.3.1.4 Calorific Value (CV)
Figure 4.6 (a-c) shows the correlations between calorific value of PB, JB and MB and their
blends with diesel. As can be seen, the calorific values of PB, JB and MB increase
remarkably as the volume of biodiesel in the blend gets smaller. The calorific values of PB,
JB and MB and their blends with diesel were correlated using Linear Regression Analysis
(LRA). The equations between calorific value and blends ratio are:
For (PB-diesel blends):
CV = -5.4651x + 45.1 x ≡ (%PB-diesel blends) (4.13)
R² = 0.9917
For (JB-diesel blends):
CV = -5.6472x + 45.215 x ≡ (%JB-diesel blends) (4.14)
R² = 0.9932
For (MB-diesel blends):
CV = -5.361x + 45.279 x ≡ (%MB-diesel blends) (4.15)
R² = 0.9946
It can be observed that the coefficient of regression values show a high regression between
calorific value and biodiesel-diesel blends.
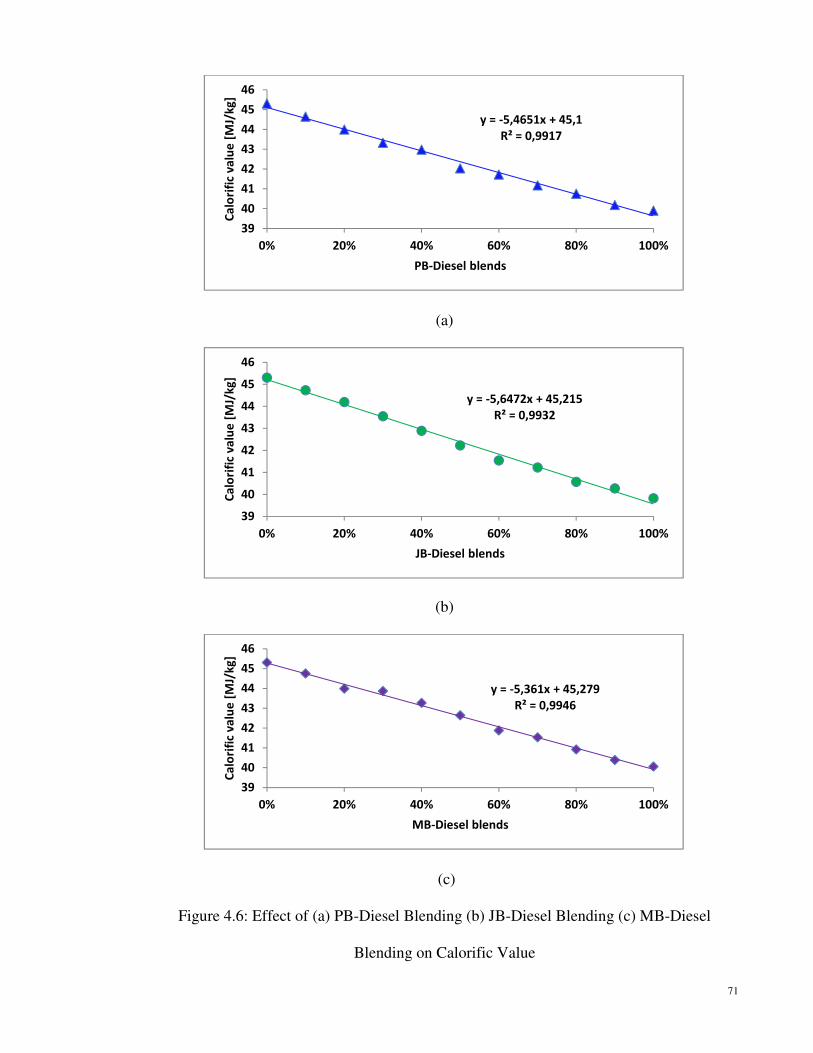
71
(a)
(b)
(c)
Figure 4.6: Effect of (a) PB-Diesel Blending (b) JB-Diesel Blending (c) MB-Diesel
Blending on Calorific Value
y = -5,4651x + 45,1
R² = 0,9917
39
40
41
42
43
44
45
46
0% 20% 40% 60% 80% 100%
Ca
lori
fic
va
lue
[M
J/k
g]
PB-Diesel blends
y = -5,6472x + 45,215
R² = 0,9932
39
40
41
42
43
44
45
46
0% 20% 40% 60% 80% 100%
Ca
lori
fic
va
lue
[M
J/k
g]
JB-Diesel blends
y = -5,361x + 45,279
R² = 0,9946
39
40
41
42
43
44
45
46
0% 20% 40% 60% 80% 100%
Ca
lori
fic
va
lue
[M
J/k
g]
MB-Diesel blends

72
4.3.1.5 Oxidation Stability (OS)
Figure 4.7 (a-c) shows the correlation between oxidation stability of PB, JB and MB and
their blends with diesel. As can be seen, the oxidation stability values of PB, JB and MB
increase with the increasing percentage of diesel in the blends. The oxidation stability
values of PB, JB and MB and their blends with diesel were correlated using Polynomial
Regression Analysis (PRA). The equations between oxidation stability and blends ratio are:
For (PB-diesel blends):
OS = -417.44x3 + 893.48x2 - 641.88x + 165.28 x ≡ (%PB-diesel blends) (4.16)
R² = 0.9828
For (JB-diesel blends):
OS = -219.76x3 + 471.04x2 - 334.63x + 84.747 x ≡ (%JB-diesel blends) (4.17)
R² = 0.9855
For (MB-diesel blends):
OS = -533.76x3 + 1010.4x2 - 684.27x + 235.91 x ≡ (%MB-diesel blends) (4.18)
R² = 0.9943
It can be observed that the coefficient of regression values show a high regression between
Oxidation stability and biodiesel-diesel blends.

73
(a)
(b)
(c)
Figure 4.7: Effect of (a) PB-Diesel Blending (b) JB-Diesel Blending (c) MB-Diesel
Blending on Oxidation Stability
y = -417,44x3 + 893,48x2 - 641,88x + 165,28
R² = 0,9828
0102030405060708090
100110120
0% 20% 40% 60% 80% 100%
Ox
ida
tio
n s
tab
ilit
y [
h]
PB-Diesel blends
y = -219,76x3 + 471,04x2 - 334,63x + 84,747
R² = 0,9855
0
10
20
30
40
50
60
70
0% 20% 40% 60% 80% 100%
Ox
ida
tio
n s
tab
ilit
y [
h]
JB-Diesel blends
y = -533,76x3 + 1010,4x2 - 684,27x + 235,91
R² = 0,9943
0
50
100
150
200
0% 20% 40% 60% 80% 100%
Ox
ida
tio
n s
tab
ilit
y [
h]
MB-Diesel blends

74
4.3.1.6 Flash Point (FP)
Figure 4.8 (a-c) shows the correlations between flash points of PB, JB and MB and their
blends with diesel. As can be seen, the flash points of PB, JB and MB increase with the
increasing percentage of diesel in the blends. The flash points of PB, JB and MB and their
blends with diesel were correlated using Polynomial Regression Analysis (PRA). The
equations between flash point and blends ratio are:
For (PB-diesel blends):
FP = 348.33x3 - 370.63x2 + 136.03x + 67.131 x ≡ (%PB-diesel blends) (4.19)
R² = 0.9951
For (JB-diesel blends):
FP = 76.593x3 - 2.3252x2 + 39.32x + 72.209 x ≡ (%JB-diesel blends) (4.20)
R² = 0.9914
For (MB-diesel blends):
FP = 170.16x3 - 210.37x2 + 121.64x + 68.15 x ≡ (%MB-diesel blends) (4.21)
R² = 0.994
It can be observed that the coefficient of regression values show a high regression between
Flash point and biodiesel-diesel blends.

75
(a)
(b)
(c)
Figure 4.8: Effect of (a) PB-Diesel Blending (b) JB-Diesel Blending (c) MB-Diesel
Blending on Flash Point
y = 348,33x3 - 370,63x2 + 136,03x + 67,131
R² = 0,9951
40
60
80
100
120
140
160
180
200
0% 20% 40% 60% 80% 100%
Fla
sh p
oin
t [ °° °°
C]
PB-Diesel blends
y = 76,593x3 - 2,3252x2 + 39,32x + 72,209
R² = 0,9914
40
60
80
100
120
140
160
180
200
0% 20% 40% 60% 80% 100%
Fla
sh p
oin
t [ °° °°
C]
JB-Diesel blends
y = 170,16x3 - 210,37x2 + 121,64x + 68,15
R² = 0,994
40
60
80
100
120
140
160
0% 20% 40% 60% 80% 100%
Fla
sh p
oin
t [ °° °°
C]
MB-Diesel blends

76
4.4 Engine Performance Analysis
In this study, to evaluate the performance of biodiesel blends 3 sets of fuel (Table 3.9) were
prepared. 1st set consists of diesel fuel (B0) and Palm biodiesel-diesel blends includes PB5,
PB10, PB15 and PB20. 2nd set consists of diesel fuel (B0) and Jatropha biodiesel-diesel
blends such as JB5, JB10, JB15 and JB20. 3rd consists of diesel fuel (BO) and Moringa
oleifera biodiesel-diesel blends includes MB5, MB10, MB15 and MB20. In order to carry
out engine performance tests, the engine was run at various speeds range from 1000 rpm to
4000 rpm at an interval of 500 rpm at full load condition. Engine test conditions were
monitored by REO-DCA controller connected through a desktop to the engine test bed.
Engine performance was evaluated in terms of engine torque, brake power (BP) and brake
specific fuel consumption (BSFC). The engine was run with diesel fuel for several minutes
to warm it up before biodiesel was tested. Likewise, the engine was operated with diesel
fuel before it was shut down. The same procedure was used for each fuel test. The
following section will discuss the obtained results of these parameters.
4.4.1 Engine Torque
The effect of Palm, Jatropha curcas and Moringa oleifera biodiesel and their blend with
diesel fuel on the engine torque with respect to the engine speed are shown in Figures 4.9-
4.11. Considering torque performance with all the fuel blends tested, it can be seen that the
trend of these parameters as a function of speed is almost similar with diesel fuel. It can be
seen that torque increases steadily with speed up to a maximum value, and then falls with
further increases in speed. This is mainly attributed to two main reasons. The first reason is
the mechanical friction loss, and the second is lower volumetric efficiency of the engine
due to increasing speed. It is also clear that the torque is decreased slightly with the
increasing percentages of biodiesel in the blend.

77
Figure 4.9: Torque versus Engine Speed for Palm Biodiesel Blended Fuel at Full Load
Condition
Over the whole range of speed, for Palm biodiesel blended fuel, the average torque values
were found 115.82, 114.25, 112.27, 109.98 and 108.02 N-m for the B0, PB5, PB10, PB15
and PB20 blends respectively. The fuel sample PB5, PB10, PB15 and PB20 blends gives an
average reduction in torque of 1.35, 3.07, 5.04 and 6.73% respectively compared to that of
diesel fuel over the entire range of speed.
Figure 4.10: Torque versus Engine Speed for Jatropha Biodiesel Blended Fuel at Full Load
Condition
50
60
70
80
90
100
110
120
130
140
1000 1500 2000 2500 3000 3500 4000
En
gin
e t
orq
ue
[N
-m]
Engine speed [rpm]
B0
PB5
PB10
PB15
PB20
50
60
70
80
90
100
110
120
130
140
1000 1500 2000 2500 3000 3500 4000
En
gin
e t
orq
ue
[N
-m]
Engine speed [rpm]
B0
JB5
JB10
JB15
JB20

78
For Jatropha biodiesel blended fuel, the average torque values were found 115.82, 113.37,
110.41, 108.38 and 105.97 N-m for the B0, JB5, JB10, JB15 and JB20 blends respectively.
The fuel sample B0, JB5, JB10, JB15 and JB20 blends gives an average reduction in torque
of 3.84, 4.67, 6.42 and 8.51% respectively compared to that of diesel fuel over the entire
range of speed.
Figure 4.11: Torque versus Engine Speed for Moringa Biodiesel Blended Fuel at Full Load
Condition
For Moringa biodiesel blended fuel, the average torque values were found 115.82, 113.38,
111.22, 109.12 and 106.77 N-m for the B0, MB5, MB10, MB15 and MB20 blends
respectively. The fuel sample MB5, MB10, MB15 and MB20 blends gives an average
reduction in torque of 2.10, 3.97, 5.78 and 7.81% respectively compared to diesel fuel over
the entire range of speed.
It can be seen that the torque values are higher when diesel fuel is being used, which is
supported by the literature (Murillo et al., 2007; Liaquat et al., 2012). The reason of
reduction in torque with the diesel fuel can be attributed to the lower viscosity, density and
50
60
70
80
90
100
110
120
130
140
1000 1500 2000 2500 3000 3500 4000
En
gin
e t
orq
ue
[N
-m]
Engine speed [rpm]
B0
MB5
MB10
MB15
MB20

79
higher calorific values of the diesel fuel. It has been reported that biodiesel have a major
effect on the engine performance due to higher oxygen contents, higher viscosity and
density, lower calorific values, higher cetane number and these factors influence on
injection and combustion system (Özener et al., 2012).
Figure 4.12: Average Torque Difference Compared to Diesel Fuel
It can be seen from the Figure 4.12 that the lowest average reduction in the torque values
compared to diesel fuel was found for Palm biodiesel blended fuel followed by Moringa
oleifera biodiesel and Jatropha curcas biodiesel blended fuel respectively. The reason can
be explained that Palm biodiesel have lower viscosity, density and higher calorific value
compared to Moringa oleifera and Jatropha curcas biodiesel.
4.4.2 Brake Power
The effect of Palm, Jatropha curcas and Moringa oleifera biodiesel and their blend with
diesel fuel on the engine brake power with respect to the engine speed are shown in Figures
-1,35
-3,07
-5,04
-6,73
-3,84
-4,67
-6,45
-8,51
-2,1
-3,97
-5,78
-7,81-9
-8
-7
-6
-5
-4
-3
-2
-1
0
PB5 PB10 PB15 PB20 JB5 JB10 JB15 JB20 MB5 MB10 MB15 MB20
Av
era
ge
to
rqu
e d
iffe
ren
ce (
%)
Biodiesel blend compositions (%)

80
4.13-4.15. Considering brake power performance with all the fuel blends tested, it can be
seen that the trend of these parameters as a function of speed is almost similar with diesel
fuel. It can be seen that brake power increased steadily with engine speed until 3500 rpm
then starts to decrease due to frictional force. It is also clear that brake power is decreased
slightly with the increasing percentages of biodiesel in the blend.
Over the whole range of speed, for Palm biodiesel blended fuel, the average brake power
values were found 28.72, 28.32, 27.81, 27.24 and 26.73 kW for the B0, PB5, PB10, PB15
and PB20 blends respectively. The fuel sample PB5, PB10, PB15 and PB20 blends gives an
average reduction in brake power of 1.38, 3.16, 5.14 and 6.92% respectively compared to
that of diesel fuel over the entire range of speed.
Figure 4.13: Brake Power versus Engine Speed for Palm Biodiesel Blended Fuel at Full
Load Condition
5
10
15
20
25
30
35
40
1000 1500 2000 2500 3000 3500 4000
Bra
ke
po
we
r [k
W]
Engine speed [rpm]
B0
PB5
PB10
PB15
PB20

81
For Jatropha biodiesel blended fuel, the average brake power values were found 28.72,
27.57, 27.32, 26.76 and 26.35 kW for the B0, JB5, JB10, JB15 and JB20 blends
respectively. The fuel sample JB5, JB10, JB15 and JB20 blends gives an average reduction
in brake power of 4.0, 4.86, 6.82 and 8.25% respectively compared to that of diesel fuel
over the entire range of speed.
Figure 4.14: Brake Power versus Engine Speed for Jatropha Biodiesel Blended Fuel at Full
Load Condition
For Moringa biodiesel blended fuel, the average brake power values were found 28.72,
28.07, 27.51, 27.0, and 26.41 kW for the B0, MB5, MB10, MB15 and MB20 blends
respectively. The fuel sample MB5, MB10, MB15 and MB20 blends gives an average
reduction in brake power of 2.27, 4.22, 5.97 and 8.03% compared to that of diesel fuel over
the entire range of speed.
5
10
15
20
25
30
35
40
1000 1500 2000 2500 3000 3500 4000
Bra
ke
po
we
r [k
W]
Engine speed [rpm]
B0
JB5
JB10
JB15
JB20

82
Figure 4.15: Brake Power versus Engine Speed for Moringa Biodiesel Blended Fuel at Full
Load Condition
It can be seen that the brake power values are higher when diesel blended fuel is being
used, which is supported by the literature (Shahabuddin et al., 2012). The reason for the
higher brake power of biodiesels compared to diesel can be attributed to their higher
calorific values and lower viscosities. Both the calorific value and viscosity have an effect
on the engine combustion system. Additionally, uneven combustion characteristics of
biodiesel fuel decreased the engine brake power (Muralidharan et al., 2011).
Figure 4.16: Average Brake Power Difference Compared to Diesel Fuel
5
10
15
20
25
30
35
40
1000 1500 2000 2500 3000 3500 4000
Bra
ke
po
we
r [k
W]
Engine speed [rpm]
B0
MB5
MB10
MB15
MB20
-1,38
-3,16
-5,14
-6,92
-4
-4,86
-6,82
-8,25
-2,27
-4,22
-5,97
-8,03-9
-8
-7
-6
-5
-4
-3
-2
-1
0
Av
era
ge
BP
dif
fere
nce
(%
)
Biodiesel blend compositions (%)
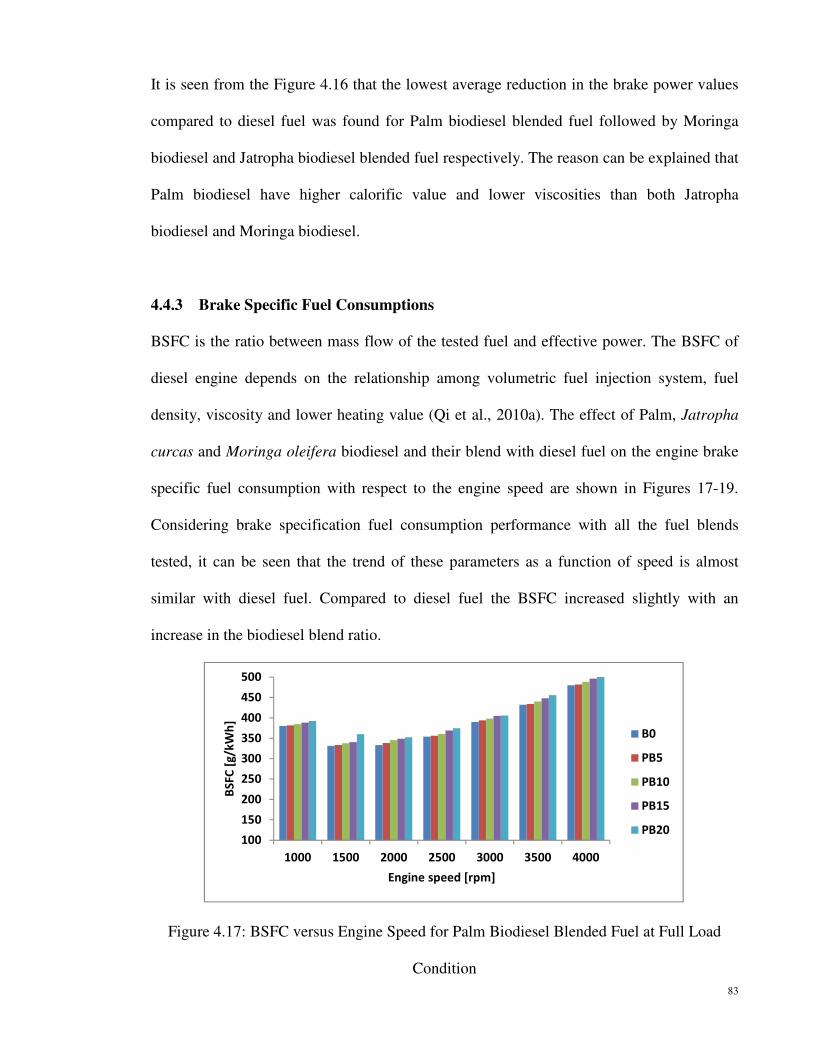
83
It is seen from the Figure 4.16 that the lowest average reduction in the brake power values
compared to diesel fuel was found for Palm biodiesel blended fuel followed by Moringa
biodiesel and Jatropha biodiesel blended fuel respectively. The reason can be explained that
Palm biodiesel have higher calorific value and lower viscosities than both Jatropha
biodiesel and Moringa biodiesel.
4.4.3 Brake Specific Fuel Consumptions
BSFC is the ratio between mass flow of the tested fuel and effective power. The BSFC of
diesel engine depends on the relationship among volumetric fuel injection system, fuel
density, viscosity and lower heating value (Qi et al., 2010a). The effect of Palm, Jatropha
curcas and Moringa oleifera biodiesel and their blend with diesel fuel on the engine brake
specific fuel consumption with respect to the engine speed are shown in Figures 17-19.
Considering brake specification fuel consumption performance with all the fuel blends
tested, it can be seen that the trend of these parameters as a function of speed is almost
similar with diesel fuel. Compared to diesel fuel the BSFC increased slightly with an
increase in the biodiesel blend ratio.
Figure 4.17: BSFC versus Engine Speed for Palm Biodiesel Blended Fuel at Full Load
Condition
100
150
200
250
300
350
400
450
500
1000 1500 2000 2500 3000 3500 4000
BS
FC
[g
/kW
h]
Engine speed [rpm]
B0
PB5
PB10
PB15
PB20

84
Over the whole range of speed, for Palm biodiesel blended fuel, the average brake specific
fuel consumption values were found 385.71, 388.4, 393.54, 399.4 and 406.62 g/kWh for
the B0, PB5, PB10, PB15 and PB20 blends respectively. The fuel sample PB5, PB10, PB15
and PB20 blends gives an average increase in brake specific fuel consumption of 0.69,
2.02, 3.54 and 5.42% respectively compared to that of diesel fuel over the entire range of
speed.
Figure 4.18: BSFC versus Engine Speed for Jatropha Biodiesel Blended Fuel at Full Load
Condition
For Jatropha biodiesel blended fuel, the average brake specific fuel consumption values
were found 385.71, 391.94, 399.18, 405.52 and 413.32 g/kWh for the B0, JB5, JB10, JB15
and JB20 blends respectively. The fuel sample JB5, JB10, JB15 and JB20 blends gives an
average increase in brake specific fuel consumption of 1.61, 3.49, 5.13 and 7.15%
respectively compared to that of diesel fuel over the entire range of speed.
100
150
200
250
300
350
400
450
500
1000 1500 2000 2500 3000 3500 4000
BS
FC
[g
/kW
h]
Engine speed [rpm]
B0
JB5
JB10
JB15
JB20
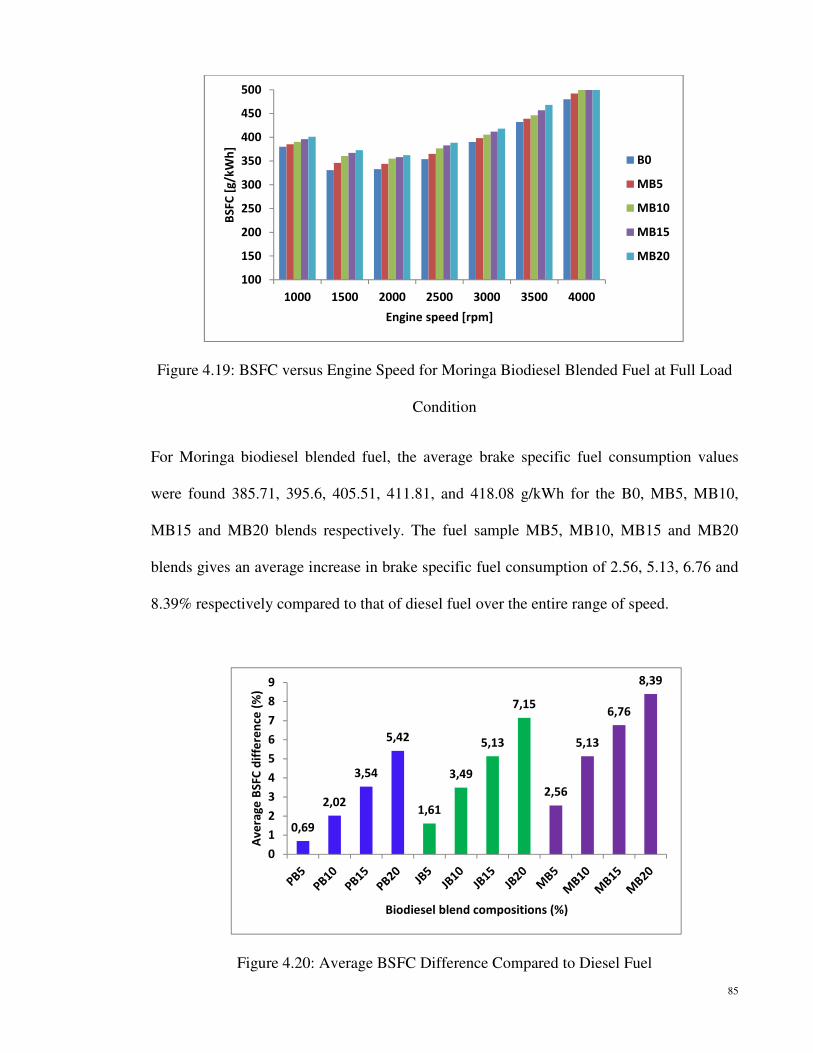
85
Figure 4.19: BSFC versus Engine Speed for Moringa Biodiesel Blended Fuel at Full Load
Condition
For Moringa biodiesel blended fuel, the average brake specific fuel consumption values
were found 385.71, 395.6, 405.51, 411.81, and 418.08 g/kWh for the B0, MB5, MB10,
MB15 and MB20 blends respectively. The fuel sample MB5, MB10, MB15 and MB20
blends gives an average increase in brake specific fuel consumption of 2.56, 5.13, 6.76 and
8.39% respectively compared to that of diesel fuel over the entire range of speed.
Figure 4.20: Average BSFC Difference Compared to Diesel Fuel
100
150
200
250
300
350
400
450
500
1000 1500 2000 2500 3000 3500 4000
BS
FC
[g
/kW
h]
Engine speed [rpm]
B0
MB5
MB10
MB15
MB20
0,69
2,02
3,54
5,42
1,61
3,49
5,13
7,15
2,56
5,13
6,76
8,39
0
1
2
3
4
5
6
7
8
9
Av
era
ge
BS
FC
dif
fere
nce
(%
)
Biodiesel blend compositions (%)

86
It can be seen that the brake specific fuel consumption values are lower when biodiesel
blended fuel is being used, which is supported by the literature (Chauhan et al., 2012;
Shahabuddin et al., 2012; Wang et al., 2013). The reason for the lower BSFC of diesels can
be attributed to the effects of the lower density, viscosity and higher heating value of the
diesel (Liaquat et al., 2012). On the other hand, biodiesel fuel is delivered into the engine
on a volumetric basis per stroke; thus, larger quantities of biodiesel are fed into the engine.
Therefore, to produce the same power, more biodiesel fuel is needed because biodiesel has
a lower calorific value compared to diesel fuel (Tsolakis et al., 2007). It is seen from the
Figure 4.20 that the average BSFC was found higher for Moringa biodiesel blend followed
by Jatropha and palm biodiesel. The reason can be explained that the Moringa biodiesel
have higher viscosity and density (Table 4.2) compared to the other biodiesel.
4.5 Engine Emissions Study
In order to examine emission characteristics of all fuel samples, a portable BOSCH exhaust
gas analyser (model BEA-350) was used to measure the concentration of exhaust gases of
the test engine. The exhaust gases emission of NO and HC was measured in ppm while CO
and CO2 in volume percent. In this research work, exhaust emission was measured at
various speeds range from 1000 rpm to 4000 rpm at an interval of 500 rpm at full load
conditions by inserting probe into the tail pipe.
4.5.1 Carbon Monoxide (CO) Emission
CO is produced as a result of the incomplete combustion of the fuel. If the combustion is
complete, CO is converted into CO2 (Gumus and Kasifoglu, 2010). If the combustion is
incomplete due to shortage of air or due to low gas temperature, CO will be formed.

87
Mostly, some factors such as air-fuel ratio, engine speed, injection timing, injection
pressure and type of fuels have an impact on CO emission (Gumus et al., 2012). The effect
of Palm, Jatropha curcas and Moringa oleifera biodiesel and their blend with diesel fuel on
the CO emission with respect to the engine speed are shown in Figures 4.21-4.23.
Figure 4.21: CO Emission versus Engine Speed for Palm Biodiesel Blended Fuel at Full
Load Condition
Over the whole range of speed, for Palm biodiesel blended fuel, the average CO emissions
were found 0.37, 0.32, 0.30, 0.28 and 0.25 vol% for the B0, PB5, PB10, PB15 and PB20
blends respectively. The fuel sample PB5, PB10, PB15 and PB20 blends gives an average
reduction in CO emissions of 13.17, 17.36, 23.93, and 32.65% respectively compared to
that of diesel fuel over the entire range of speed.
0
0,1
0,2
0,3
0,4
0,5
0,6
0,7
0,8
1000 1500 2000 2500 3000 3500 4000
CO
[v
ol
%]
Engine speed [rpm]
B0
PB5
PB10
PB15
PB20

88
Figure 4.22: CO Emission versus Engine Speed for Jatropha Biodiesel Blended Fuel at Full
Load Condition
For Jatropha biodiesel blended fuel, the average CO emissions were found 0.37, 0.34, 0.31,
0.30 and 0.27 vol% for the B0, JB5, JB10, JB15 and JB20 blends respectively. The fuel
sample JB5, JB10, JB15 and JB20 blends gives an average reduction in CO emissions of
8.02, 14.29, 18.78, and 27.23% respectively compared to that of diesel fuel over the entire
range of speed.
Figure 4.23: CO Emission versus Engine Speed for Moringa Biodiesel Blended Fuel at Full
Load Condition
0
0,1
0,2
0,3
0,4
0,5
0,6
0,7
0,8
1000 1500 2000 2500 3000 3500 4000
CO
[v
ol
%]
Engine speed [rpm]
B0
JB5
JB10
JB15
JB20
0
0,1
0,2
0,3
0,4
0,5
0,6
0,7
0,8
1000 1500 2000 2500 3000 3500 4000
CO
[v
ol
%]
Engine speed [rpm]
B0
MB5
MB10
MB15
MB20
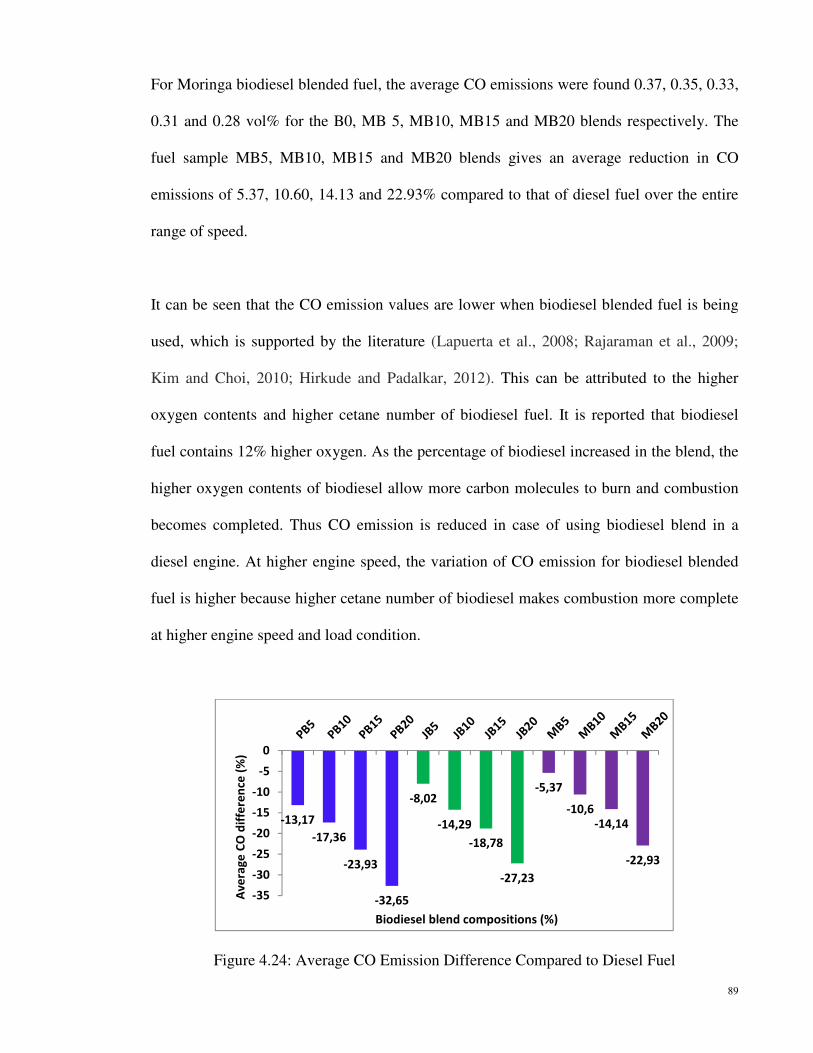
89
For Moringa biodiesel blended fuel, the average CO emissions were found 0.37, 0.35, 0.33,
0.31 and 0.28 vol% for the B0, MB 5, MB10, MB15 and MB20 blends respectively. The
fuel sample MB5, MB10, MB15 and MB20 blends gives an average reduction in CO
emissions of 5.37, 10.60, 14.13 and 22.93% compared to that of diesel fuel over the entire
range of speed.
It can be seen that the CO emission values are lower when biodiesel blended fuel is being
used, which is supported by the literature (Lapuerta et al., 2008; Rajaraman et al., 2009;
Kim and Choi, 2010; Hirkude and Padalkar, 2012). This can be attributed to the higher
oxygen contents and higher cetane number of biodiesel fuel. It is reported that biodiesel
fuel contains 12% higher oxygen. As the percentage of biodiesel increased in the blend, the
higher oxygen contents of biodiesel allow more carbon molecules to burn and combustion
becomes completed. Thus CO emission is reduced in case of using biodiesel blend in a
diesel engine. At higher engine speed, the variation of CO emission for biodiesel blended
fuel is higher because higher cetane number of biodiesel makes combustion more complete
at higher engine speed and load condition.
Figure 4.24: Average CO Emission Difference Compared to Diesel Fuel
-13,17
-17,36
-23,93
-32,65
-8,02
-14,29
-18,78
-27,23
-5,37
-10,6-14,14
-22,93
-35
-30
-25
-20
-15
-10
-5
0
Av
era
ge
CO
dif
fere
nce
(%
)
Biodiesel blend compositions (%)

90
It can be seen from the Figure 4.24 that the highest average reduction in the CO emission
compared to diesel fuel was found for Palm biodiesel blended fuel followed by Jatropha
and Moringa biodiesel blended fuel respectively. The reason can be explained by the degree
of saturation of the fatty acids. It has been reported that CO emission is decreased as the
saturation level is increased (Rodríguez et al., 2011). From the Table 4.3 it is seen that palm
biodiesel have highest saturation level followed by Jatropha and Moringa biodiesel
respectively. Moreover higher unsaturation level leads to higher density of the fuel. As the
fuel delivery system is volumetric basis, therefore, palm biodiesel with their lower densities
would restrict the formation of rich air-fuel mixture within the spray jet as compared to
Jatropha and Moringa biodiesel blends fuel. This allows more complete combustion which
helps to reduce CO emission (Ng et al., 2011).
4.5.2 Hydrocarbon (HC) Emission
Unburned HC is resulted from the incomplete combustion of fuel and flame quenching in
the crevice regions in the cylinder wall. The HC emission also can be resulted from the
problems of air and fuel mixing. The effect of Palm, Jatropha curcas and Moringa oleifera
biodiesel and their blend with diesel fuel on the HC emission with respect to the engine
speed are shown in Figures 4.25-4.27.

91
Figure 4.25: HC Emission versus Engine Speed for Palm Biodiesel Blended Fuel at Full
Load Condition
Over the whole range of speed, for Palm biodiesel blended fuel, the average HC emission
were found 10.85, 9.85, 8.85, 8.57, and 8 ppm for the B0, PB5, PB10, PB15 and PB20
blends respectively. The fuel sample PB5, PB10, PB15 and PB20 blends gives an average
reduction in HC emission of 9.21, 18.42, 21.05 and 26.31% respectively compared to that
of diesel fuel over the entire range of speed.
Figure 4.26: HC Emission versus Engine Speed for Jatropha Biodiesel Blended Fuel at Full
Load Condition
0
5
10
15
20
1000 1500 2000 2500 3000 3500 4000
HC
[p
pm
]
Engine speed [rpm]
B0
PB5
PB10
PB15
PB20
0
2
4
6
8
10
12
14
16
18
20
1000 1500 2000 2500 3000 3500 4000
HC
[p
pm
]
Engine speed [rpm]
B0
JB5
JB10
JB15
JB20
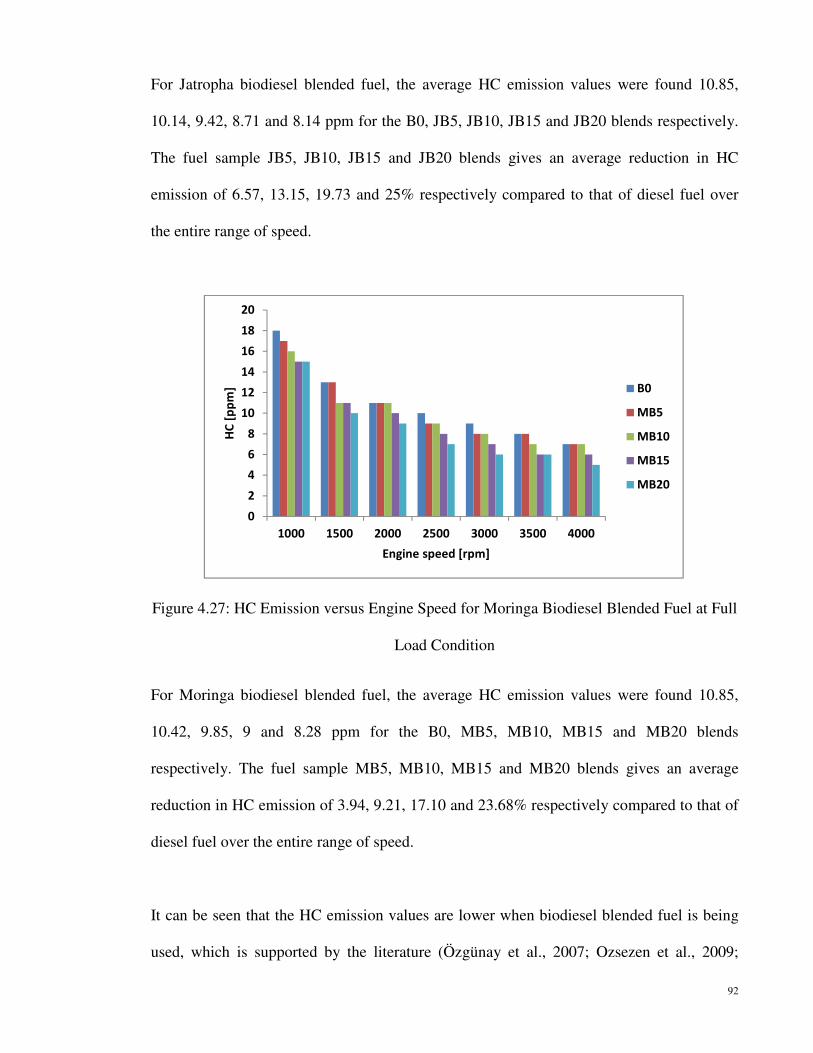
92
For Jatropha biodiesel blended fuel, the average HC emission values were found 10.85,
10.14, 9.42, 8.71 and 8.14 ppm for the B0, JB5, JB10, JB15 and JB20 blends respectively.
The fuel sample JB5, JB10, JB15 and JB20 blends gives an average reduction in HC
emission of 6.57, 13.15, 19.73 and 25% respectively compared to that of diesel fuel over
the entire range of speed.
Figure 4.27: HC Emission versus Engine Speed for Moringa Biodiesel Blended Fuel at Full
Load Condition
For Moringa biodiesel blended fuel, the average HC emission values were found 10.85,
10.42, 9.85, 9 and 8.28 ppm for the B0, MB5, MB10, MB15 and MB20 blends
respectively. The fuel sample MB5, MB10, MB15 and MB20 blends gives an average
reduction in HC emission of 3.94, 9.21, 17.10 and 23.68% respectively compared to that of
diesel fuel over the entire range of speed.
It can be seen that the HC emission values are lower when biodiesel blended fuel is being
used, which is supported by the literature (Özgünay et al., 2007; Ozsezen et al., 2009;
0
2
4
6
8
10
12
14
16
18
20
1000 1500 2000 2500 3000 3500 4000
HC
[p
pm
]
Engine speed [rpm]
B0
MB5
MB10
MB15
MB20

93
Ulusoy et al., 2009). This can be attributed to the higher oxygen contents and higher cetane
number of biodiesel fuel. Biodiesel contains higher oxygen and lower carbon and hydrogen
than diesel fuel which trigger an improved and complete combustion process (Lin et al.,
2009; Qi et al., 2010b). Thus HC emission is reduced in case of using biodiesel blend in a
diesel engine.
Figure 4.28: Average HC Emission Difference Compared to Diesel Fuel
It can be seen from the Figure 4.28 that the highest average reduction in the HC emission
compared to diesel fuel was found for Palm biodiesel blended fuel followed by Jatropha
and Moringa biodiesel blended fuel respectively. The reason can be explained by the
highest degree of saturated fatty acids composition of Palm biodiesel which produced
complete combustion compared to other biodiesel. It has also been reported that the higher
cetane number of biodiesel fuel reduces the ignition delay which have an effect on the
reduction of HC emission (Monyem and Gerpen, 2001; Rao, 2011). In this regard, from
Table 4.2 it is clear that the Palm biodiesel have highest cetane number among the all
biodiesel samples.
-9,21
-18,42
-21,05
-26,31
-6,57
-13,15
-19,73
-25
-3,94
-9,21
-17,1
-23,68
-30
-25
-20
-15
-10
-5
0
Av
era
ge
HC
dif
fere
nce
(%
)
Biodiesel blend compositions (%)

94
4.5.3 Nitric Oxide (NO) Emission
NOx is produced during the combustion process when nitrogen and oxygen are present at
elevated temperatures. The oxides of nitrogen in the exhaust emissions contain nitric oxide
(NO) and nitrogen dioxide (NO2). The formation of NOx is highly dependent on in-cylinder
temperatures, the oxygen concentration, and residence time for the reaction to take place
(Xue et al., 2011). The increase in temperature and oxygen causes more NOX to be
produced. The effect of Palm, Jatropha curcas and Moringa oleifera biodiesel and their
blend with diesel fuel on the NO emission with respect to the engine speed are shown in
Figures 4.29-4.31.
Figure 4.29: NO Emission versus Engine Speed for Palm Biodiesel Blended Fuel at Full
Load Condition
Over the whole range of speed, for Palm biodiesel blended fuel, the average NO emission
values were found 210.85, 215, 218, 221.42 and 225.42 ppm for the B0, PB5, PB10, PB15
and PB20 blends respectively. The fuel sample PB5, PB10, PB15 and PB20 blends gives an
average increase in NO emission of 1.96, 3.38, 5.01 and 6.91% respectively compared to
that of diesel fuel over the entire range of speed.
0
50
100
150
200
250
300
1000 1500 2000 2500 3000 3500 4000
NO
[p
pm
]
Engine speed [rpm]
B0
PB5
PB10
PB15
PB20

95
Figure 4.30: NO Emission versus Engine Speed for Jatropha Biodiesel Blended Fuel at Full
Load Condition
For Jatropha biodiesel blended fuel, the average NO emission values were found 210.85,
218.85, 226.28, 233.57 and 240.85 ppm for the B0, JB 5, JB10, JB15 and JB20 blends
respectively. The fuel sample JB5, JB10, JB15 and JB20 blends gives an average increase
in NO emission of 3.79, 7.31, 10.76 and 14.22% compared to that of diesel fuel over the
entire range of speed.
Figure4.31: NO Emission versus Engine Speed for Moringa Biodiesel Blended Fuel at Full
Load Condition
0
50
100
150
200
250
300
350
1000 1500 2000 2500 3000 3500 4000
NO
[p
pm
]
Engine speed [rpm]
B0
JB5
JB10
JB15
JB20
0
50
100
150
200
250
300
350
1000 1500 2000 2500 3000 3500 4000
NO
[p
pm
]
Engine speed [rpm]
B0
MB5
MB10
MB15
MB20

96
For Moringa biodiesel blended fuel, the average NO emission values were found 210.85,
219.28, 228.71, 239.42 and 250 ppm for the B0, MB5, MB10, MB15 and MB20 blends
respectively. The fuel sample MB5, MB10, MB15 and MB20 blends gives an average
increase in NO emission of 3.99, 8.46, 13.55 and 18.56% compared to that of diesel fuel
over the entire range of speed.
It can be seen that the NO emission values are higher when biodiesel blended fuel is being
used. Same observation was observed in literature (El-Kasaby and Nemit-allah, 2013). This
can be attributed to the bulk modulus of biodiesel, longer fuel penetration into the engine
cylinder, decreased the radiative heat transfer due to reduced soot formation, shorter
ignition delay and higher heat release rate. Thus NO emission is increased for biodiesel
blend than that of diesel fuel. Moreover, the reason of increasing NO/NOx can be explained
in terms of adiabatic flame temperature. Biodiesel fuel contains higher percentages of
unsaturated fatty acids that have higher adiabatic flame temperature which causes higher
NO/NOx emission (El-Kasaby and Nemit-allah, 2013).
Figure 4.32: Average NO Emission Difference Compared to Diesel Fuel
1,963,38
5,01
6,91
3,86
7,31
10,77
14,22
3,99
8,46
13,55
18,56
0
2
4
6
8
10
12
14
16
18
20
Av
era
ge
NO
dif
fere
nce
(%
)
Biodiesel blend compositions (%)
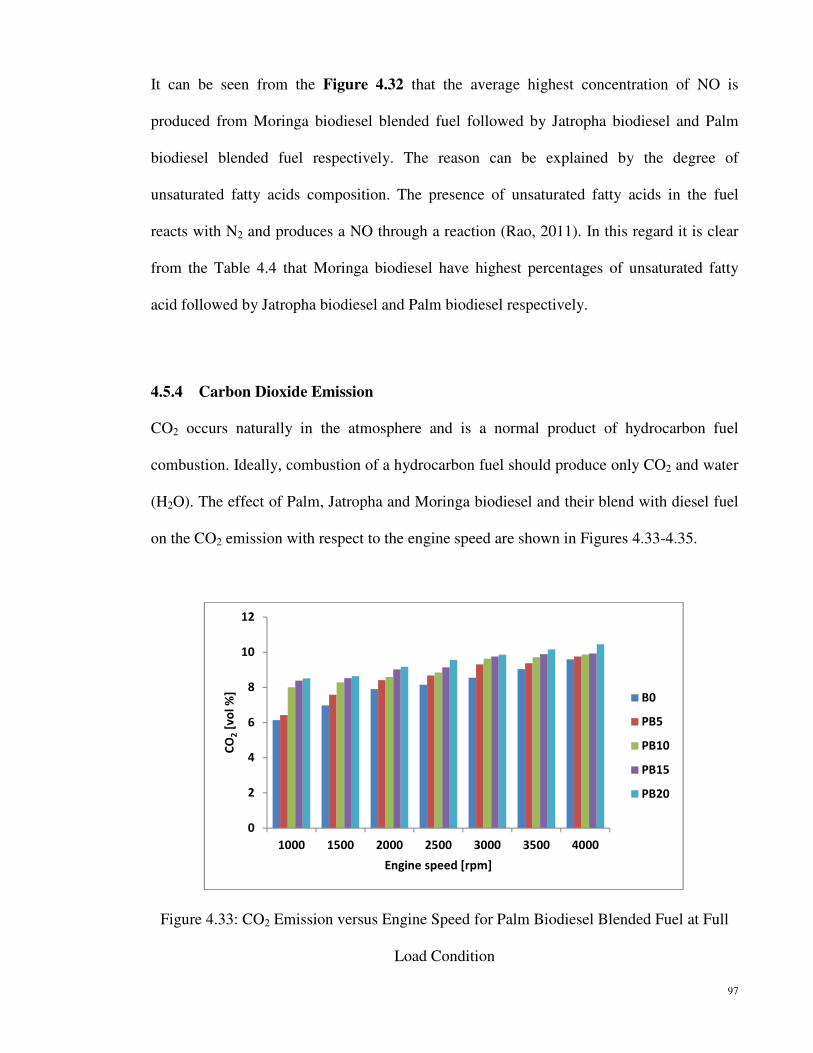
97
It can be seen from the Figure 4.32 that the average highest concentration of NO is
produced from Moringa biodiesel blended fuel followed by Jatropha biodiesel and Palm
biodiesel blended fuel respectively. The reason can be explained by the degree of
unsaturated fatty acids composition. The presence of unsaturated fatty acids in the fuel
reacts with N2 and produces a NO through a reaction (Rao, 2011). In this regard it is clear
from the Table 4.4 that Moringa biodiesel have highest percentages of unsaturated fatty
acid followed by Jatropha biodiesel and Palm biodiesel respectively.
4.5.4 Carbon Dioxide Emission
CO2 occurs naturally in the atmosphere and is a normal product of hydrocarbon fuel
combustion. Ideally, combustion of a hydrocarbon fuel should produce only CO2 and water
(H2O). The effect of Palm, Jatropha and Moringa biodiesel and their blend with diesel fuel
on the CO2 emission with respect to the engine speed are shown in Figures 4.33-4.35.
Figure 4.33: CO2 Emission versus Engine Speed for Palm Biodiesel Blended Fuel at Full
Load Condition
0
2
4
6
8
10
12
1000 1500 2000 2500 3000 3500 4000
CO
2[v
ol
%]
Engine speed [rpm]
B0
PB5
PB10
PB15
PB20

98
Over the whole range of speed, for Palm biodiesel blended fuel, the average CO2 emission
values were found 8.05, 8.50, 8.99, 9.23 and 9.47 vol% for the B0, PB 5, PB10, PB15 and
PB20 blends respectively. The fuel sample PB5, PB10, PB15 and PB20 blends gives an
average increase in CO2 emission of 5.60, 11.73, 14.72 and 17.76% respectively compared
to that of diesel fuel over the entire range of speed.
Figure 4.34: CO2 Emission versus Engine Speed for Jatropha Biodiesel Blended Fuel at
Full Load Condition
For Jatropha biodiesel blended fuel, the average CO2 emission values were found 8.05,
8.29, 8.59, 8.87 and 9.16 vol% for the B0, JB5, JB10, JB15 and JB20 blends respectively.
The fuel sample JB5, JB10, JB15 and JB20 blends gives an average increase in CO2
emission of 3.07, 6.70, 10.25 and 13.82% respectively compared to that of diesel fuel over
the entire range of speed.
0
2
4
6
8
10
12
1000 1500 2000 2500 3000 3500 4000
CO
2[v
ol
%]
Engine speed [rpm]
B0
JB5
JB10
JB15
JB20

99
Figure 4.35: CO2 Emission versus Engine Speed for Moringa Biodiesel Blended Fuel at
Full Load Condition
For Moringa biodiesel blended fuel, the average CO2 emission values were found 8.05,
8.23, 8.45, 8.61 and 8.88 vol% for the B0, MB5, MB10, MB15 and MB20 blends
respectively. The fuel sample MB5, MB10, MB15 and MB20 blends gives an average
increase in CO2 emission of 2.25, 4.96, 6.99 and 10.36% respectively compared to that of
diesel fuel over the entire range of speed.
Figure 4.36: Average CO2 Emission Difference Compared to Diesel Fuel
0
2
4
6
8
10
12
1000 1500 2000 2500 3000 3500 4000
CO
2[v
ol
%]
Engine speed [rpm]
B0
MB5
MB10
MB15
MB20
5,6
11,73
14,72
17,74
3,07
6,7
10,25
13,82
2,25
4,96
6,99
10,36
0
2
4
6
8
10
12
14
16
18
20
Av
era
ge
CO
2d
iffe
ren
ce [
%]
Biodiesel blend compositions (%)

100
It can be seen that the CO2 emission values are higher when biodiesel blended fuel is being
used. It is also seen that CO2 emission also increases as the percentages of biodiesel
increases in the blend. This is happened due to the higher oxygen contents in the biodiesel
fuel which improves the quality of combustion (Gumus and Kasifoglu, 2010). Moreover,
from Figure 4.36 it can be observed that highest value of CO2 emission was obtained when
engine is fuelled with Palm biodiesel blended fuel followed by Jatropha biodiesel and
Moringa biodiesel blended fuel. The reason can be explained by the highest degree of
saturated fatty acids composition of Palm biodiesel which produced complete combustion
compared to other biodiesel. Thus higher CO2 emission is obtained. The production of
CO2 from the combustion of fossil fuels causes many environmental problems such as the
accumulation of CO2 in the atmosphere. Although biofuel combustion produces CO2,
absorption by crops helps to maintain CO2 levels (Ramadhas et al., 2005). Therefore,
biodiesel combustion can be regarded as definitely causing lower net CO2 emission than
diesel fuel.

101
5 CHAPTER 5
CONCLUSIONS AND RECOMMENDATION
5.0 Conclusions
The main objective of this research work is to study the potential of biodiesel production
from Palm (Elaeis guineensis), Jatropha curcas and Moringa oleifera oil as a promising
feedstock that are easily accessible in many parts of the world. Series of experiment were
sequentially conducted in this research to characterize the physical and chemical properties
of Palm, Jatropha curcas and Moringa oleifera biodiesel and their 10% to 90% by volume
blends such as kinematic viscosity, density, flash point, cloud point, pour point, cold filter
plugging point, viscosity index and oxidation stability. Finally, a total of 12 fuel samples
(B5 to B20 of each biodiesel) were used to evaluate their performance in an unmodified
multi-cylinder diesel engine and compared with that of diesel fuel. Based on this research
work, the following conclusion could be drawn:
1. The properties of Palm, Jatropha curcas and Moringa oleifera and their blends such
as kinematic viscosity (KV), density (D), viscosity index (VI), cloud point (CP),
pour point (PP), cold filter plugging point (CFPP), flash point (FP), calorific value
(CV) and oxidation stability (OS) agree with ASTM D6751 and EN14214
standards.
2. Due to the blending of biodiesel with diesel fuel, the key fuel properties such as
kinematic viscosity, density, calorific value and oxidation stability are remarkably
102
improved. Nevertheless, flash point and viscosity index decrease as the percentage
of diesel increases in the blend.
3. Engine performance results show that engine torque and brake power for biodiesel
blended fuels decreased compared to diesel fuel due to their higher density,
viscosity and lower calorific value. The highest average reduction in torque and
brake power compared to diesel fuel was found for Palm biodiesel followed by
Moringa and Jatropha biodiesel blended fuels respectively.
4. The BSFC values for biodiesel blended fuels were higher compared to that of diesel
fuel due to their lower calorific value and density. Among all biodiesel blended
fuels, Moringa biodiesel blended fuel showed the highest average BSFC followed
by Jatropha and Palm biodiesel blended fuels.
5. In case of engine emission test, a reduction in CO and HC emissions was found for
biodiesel blended fuels compared to that of diesel fuel. The highest average
reduction in CO and HC was found for Palm biodiesel blended fuel followed by
Jatropha and Moringa biodiesel blended fuels due to the availability of saturated
fatty acids composition in the fuels.
6. An increase in NO and CO2 emissions was found for biodiesel blended fuels
compared to that of diesel fuel due to their higher oxygen contents, saturated fatty
acids, cetane number, in cylinder temperature and pressure etc.

103
In conclusion, Palm, Jatropha curcas and Moringa oleifera are potential feedstock for
biodiesel production, and up to 20% of their blends can replace diesel fuel without
modifying engines to reduce dependency on petro-diesel and produce cleaner exhaust
emissions. Among these three feedstock Palm biodiesel showed better performance and
emission characteristics.
5.1 Recommendations for Future Work
This research work has been carried out to produce biodiesel from available feedstocks and
to evaluate the performance of biodiesel-diesel blends in a diesel engine. In this regard, the
following recommendations for the future work can be suggested:
1. This research work only focused on engine performance and emission, so it is
recommended to focus on combustion characteristics of biodiesel blended fuels in a
diesel engine along with corrosion, wear and material compatibility studies.
2. In this research work up to 20% by volume blend of biodiesel was used, it is
recommended to use higher percentages blends and then compare the findings with
lower blends.
3. In this research work, only regulated emissions were studied, it is recommended to
focus on unregulated emissions to get more insight on human health and
environmental effect.

104
REFERENCES
Atabani, A. E., Silitonga, A. S., Ong, H. C., Mahlia, T. M. I., Masjuki, H. H., Badruddin, I. A., and Fayaz, H. (2013). Non-edible vegetable oils: A critical evaluation of oil extraction, fatty acid compositions, biodiesel production, characteristics, engine performance and emissions production. Renewable and Sustainable Energy Reviews 18 (0), 211-245.
Atadashi, I. M., Aroua, M. K., Abdul Aziz, A. R., and Sulaiman, N. M. N. (2012).
Production of biodiesel using high free fatty acid feedstocks. Renewable and Sustainable Energy Reviews 16 (5), 3275-3285.
Atadashi, I. M., Aroua, M. K., and Aziz, A. A. (2010). High quality biodiesel and its diesel
engine application: A review. Renewable and Sustainable Energy Reviews 14 (7), 1999-2008.
Aydin, H., and Bayindir, H. (2010). Performance and emission analysis of cottonseed oil
methyl ester in a diesel engine. Renewable Energy 35 (3), 588-592. Ayob, R., Sarpin, Z., and Hitam, A. (1998). Bench test of single-cylinder elsbett engine. In
Proceeding of the PORIM international biofuel and lubricant conferences. Azam, M. M., Waris, A., and Nahar, N.M. (2005). Prospects and potential of fatty acid
methyl esters of some non-traditional seed oils for use as biodiesel in India. Biomass and Bioenergy 29 (4), 293-302.
Balat, M. and Balat, H. (2010). Progress in biodiesel processing. Applied Energy 87 (6),
1815-1835. Ban-Weiss, G. A., Chen, J. Y., Buchholz, B. A., and Dibble, R. W. (2007). A numerical
investigation into the anomalous slight NOx increase when burning biodiesel; A new (old) theory. Fuel Processing Technology 88 (7), 659-667.
BP Statistical Review of World Energy June (2012). Available from:
http://www.bp.com/assets/bp_internet/globalbp/globalbp_uk_english/reports_and_publications/statistical_energy_review_2012/STAGING/local_assets/pdf/statistical_review_of_world_energy_full_report_2012.pdf
Chapagain, B. P., Yehoshua, Y., and Wiesman, Z. (2009). Desert date (Balanites
aegyptiaca) as an arid lands sustainable bioresource for biodiesel. Bioresource Technology 100 (3), 1221-1226.
Chauhan, B. S., Kumar, N., and Cho, H. M. (2012). A study on the performance and
emission of a diesel engine fueled with Jatropha biodiesel oil and its blends. Energy 37 (1), 616-622.

105
Chauhan, B. S., Kumar, N., Du Jun, Y., and Lee, K. B. (2010). Performance and emission study of preheated Jatropha oil on medium capacity diesel engine. Energy 35 (6), 2484-2492.
Chin, M. (2011). Biofuels in Malaysia: an analysis of the legal and institutional framework.
Working Paper 64. CIFOR, Bogor, Indonesia. Demirbas, A. (2007). Importance of biodiesel as transportation fuel. Energy Policy 35 (9),
4661-4670. Demirbas, A. (2008). Biodiesel: a realistic fuel alternative for diesel engines.London.
Springer. Demirbas, A. H., and Demirbas, I. (2007). Importance of rural bioenergy for developing
countries. Energy Conversion and Management 48 (8), 2386-2398. Devan, P. K., and Mahalakshmi, N.V. (2009a). Study of the performance, emission and
combustion characteristics of a diesel engine using poon oil-based fuels. Fuel Processing Technology 90 (4), 513-519.
Devan, P. K., and Mahalakshmi, N.V. (2009b). Utilization of unattended methyl ester of
paradise oil as fuel in diesel engine. Fuel 88 (10), 1828-1833. da Silva, J. P. V., Serra, T. M., Gossmann, M., Wolf, C. R., Meneghetti, M. R., &
Meneghetti, S. M. P. (2010). Moringa oleifera oil: Studies of characterization and biodiesel production. Biomass and Bioenergy, 34(10), 1527-1530.
DOE (2010). Environmental Quality Report. Department of Environment, Malaysia. Dompok, B. G. (2010). The use of palm biodiesel by Sime Darby vehicles. Speech by Y.B.
Tan Sri Bernard Giluk Dompok, Minister of Plantation Industries and Commodities, 24 March 2010. Carey Island, Selangor, Malaysia.
Ekrem, B. (2010). Effects of biodiesel on a DI diesel engine performance, emission and
combustion characteristics. Fuel 89 (10), 3099-3105. El-Kasaby, M. and Nemit-allah, M. A. (2013). Experimental investigations of ignition
delay period and performance of a diesel engine operated with Jatropha oil biodiesel. Alexandria Engineering Journal 52 (2), 141-149.
United States Energy Information Administration (2010). [Cited 2012, 10th December];
Available from: http://www.indexmundi.com/energy.aspx?region=xx&product=biodiesel&graph=production+consumption.
Faiz, A., Sinha K., Walsh, M., and Varma A. 1990. Automotive Air Pollution: Issues and
Options for Developing Countries. The World Bank.

106
Georgogianni, K. G., Katsoulidis, A. K., Pomonis, P. J., Manos, G., and Kontominas, M. G. (2009). Transesterification of rapeseed oil for the production of biodiesel using homogeneous and heterogeneous catalysis. Fuel Processing Technology 90 (7–8), 1016-1022.
Gumus, M. (2010). A comprehensive experimental investigation of combustion and heat
release characteristics of a biodiesel (hazelnut kernel oil methyl ester) fueled direct injection compression ignition engine. Fuel 89 (10), 2802-2814.
Gumus, M., and Kasifoglu, S. (2010). Performance and emission evaluation of a
compression ignition engine using a biodiesel (apricot seed kernel oil methyl ester) and its blends with diesel fuel. Biomass and Bioenergy 34 (1), 134-139.
Gumus, M., Sayin, C., and Canakci, M. (2012). The impact of fuel injection pressure on the
exhaust emissions of a direct injection diesel engine fueled with biodiesel–diesel fuel blends. Fuel 95 (0), 486-494.
Hirkude, J. B., and Padalkar, A.S. (2012). Performance and emission analysis of a
compression ignition: Engine operated on waste fried oil methyl esters. Applied Energy 90 (1), 68-72.
Hoekman, S. K., Broch, A., Robbins, C., Ceniceros, E., and Natarajan, M. (2012). Review
of biodiesel composition, properties, and specifications. Renewable and Sustainable Energy Reviews 16 (1), 143-169.
How, H. G., Teoh, Y. H., Masjuki, H. H., and Kalam, M. A. (2012). Impact of coconut oil
blends on particulate-phase PAHs and regulated emissions from a light duty diesel engine. Energy 48 (1), 500-509.
Huang, J., Wang, Y., Qin, J.-b., & Roskilly, A. P. (2010). Comparative study of
performance and emissions of a diesel engine using Chinese pistache and jatropha biodiesel. Fuel Processing Technology, 91(11), 1761-1767.
International Energy Agency (IEA). Worl Energy Outlook (2012). [cited 2012 10th December]; Available from: http://www.worldenergyoutlook.org/publications/weo-2012/
Jain, S. and Sharma, M. P. (2010). Biodiesel production from Jatropha curcas oil.
Renewable and Sustainable Energy Reviews 14 (9), 3140-3147. Jain, S. and Sharma, M. P. (2011). Oxidation stability of blends of Jatropha biodiesel with
diesel. Fuel 90 (10), 3014-3020. Jia, L. W., Shen, M. Q., Wang, J., and Lin, M. Q. (2005). Influence of ethanolegasoline
blended fuel on emission characteristics from a four-stroke motorcycle engine. Journal of Hazardous Materials 123 (1-3), 29-34.

107
Leevijit, T., & Prateepchaikul, G. (2011). Comparative performance and emissions of IDI-turbo automobile diesel engine operated using degummed, deacidified mixed crude palm oil–diesel blends. Fuel, 90(4), 1487-1491.
Kafuku, G., & Mbarawa, M. (2010). Alkaline catalyzed biodiesel production from Moringa
oleifera oil with optimized production parameters. Applied Energy, 87(8), 2561-2565.
Karavalakis, G., Alvanou, F., Stournas, S., & Bakeas, E. (2009). Regulated and unregulated emissions of a light duty vehicle operated on diesel/palm-based methyl ester blends over NEDC and a non-legislated driving cycle. Fuel, 88(6), 1078-1085.
Kim, H. and Choi, B. (2010). The effect of biodiesel and bioethanol blended diesel fuel on
nanoparticles and exhaust emissions from CRDI diesel engine. Renewable Energy 35 (1), 157-163.
Knothe, G. (2001). Historical perspectives on vegetable oil-based diesel fuels. Inform 11,
1103-1107. Lapuerta, M., Armas, O., and Rodríguez-Fernández, J. (2008). Effect of biodiesel fuels on
diesel engine emissions. Progress in Energy and Combustion Science 34 (2), 198-223.
Lee, H. V., Taufiq-Yap, Y. H., Hussein, M. Z., and Yunus, R. (2013). Transesterification of
jatropha oil with methanol over Mg–Zn mixed metal oxide catalysts. Energy 49 (0), 12-18.
Liaquat, A. M., Kalam, M. A., Masjuki, H. H., and Jayed, M. H. (2010). Potential
emissions reduction in road transport sector using biofuel in developing countries. Atmospheric Environment 44 (32), 3869-3877.
Liaquat, A. M., Masjuki, H. H., Kalam, M. A., Varman, M., Hazrat, M. A., Shahabuddin,
M., and Mofijur, M. (2012). Application of blend fuels in a diesel engine. Energy Procedia 14 (0), 1124-1133.
Lim, S. and Teong, L. K. (2010). Recent trends, opportunities and challenges of biodiesel
in Malaysia: An overview. Renewable and Sustainable Energy Reviews 14 (3), 938-954.
Lin, B.-F., Huang, J.-H., and Huang, D.-Y. (2009). Experimental study of the effects of
vegetable oil methyl ester on DI diesel engine performance characteristics and pollutant emissions. Fuel 88 (9), 1779-1785.
Lin, L., Cunshan, Z., Vittayapadung, S., Xiangqian, S., and Mingdong, D. (2011).
Opportunities and challenges for biodiesel fuel. Applied Energy 88 (4), 1020-1031. Lopez, G. P. and Laan, T. (2008). Biofuels—at what cost? Government support for
biodiesel in Malaysia. Prepared for the Global Subsidies Initiative (GSI) of the International Institute for Sustainable Development (IISD). Geneva, Switzerland.
108
Malaysia Palm Oil Board (MPOB)a (2010). Available from: http://econ.mpob.gov.my/economy/biodiesel/biodiesel_plant.pdf
M Palash, S., Kalam, M. A., Masjuki, H. H., Masum, B. M., Rizwanul Fattah, I. M., and
Mofijur, M. (2013). Impacts of biodiesel combustion on NOx emissions and their reduction approaches. Renewable and Sustainable Energy Reviews 23 (0), 473-490.
Mallikappa, D. N., Reddy, R. P., and Murthy, C. S. N. (2012). Performance and emission
characteristics of double cylinder CI engine operated with cardanol bio fuel blends. Renewable Energy 38 (1), 150-154.
Monyem, A. and Gerpen, J. (2001). The effect of biodiesel oxidation on engine
performance and emissions. Biomass and Bioenergy 20 (4), 317-325. Moser, B. (2009). Biodiesel production, properties, and feedstocks. In Vitro Cell Dev Biol-
Plant 45, 229–266. Mrad, N., Varuvel, E.G., Tazerout, M., and Aloui, F. (2012). Effects of biofuel from fish oil
industrial residue-Diesel blends in diesel engine. Energy 44 (1), 955-963. Muralidharan, K., Vasudevan, D., and Sheeba, K. N. (2011). Performance, emission and
combustion characteristics of biodiesel fuelled variable compression ratio engine. Energy 36 (8), 5385-5393.
Murillo, S., Míguez, J. L., Porteiro, J., Granada, E., and Morán, J. C. (2007). Performance
and exhaust emissions in the use of biodiesel in outboard diesel engines. Fuel 86 (12–13), 1765-1771.
Ng, J.-H., Ng, H. K., and Gan, S. (2011). Engine-out characterisation using speed–load
mapping and reduced test cycle for a light-duty diesel engine fuelled with biodiesel blends. Fuel 90 (8), 2700-2709.
Ng, J.-H., Ng, H. K., and Gan, S. (2012). Characterisation of engine-out responses from a
light-duty diesel engine fuelled with palm methyl ester (PME). Applied Energy 90 (1), 58-67.
Nabi, N. M., Najmul Hoque, S.M., and Shamim Akhter, Md. (2009). Karanja (Pongamia
Pinnata) biodiesel production in Bangladesh, characterization of karanja biodiesel and its effect on diesel emissions. Fuel Processing Technology 90 (9), 1080-1086.
Oener, C. and Altun. (2009). Biodiesel production from inedible animal tallow and an
experimental investigation of its use as alternative fuel in a direct injection diesel engine. Applied Energy 86 (10), 2114-2120.
Okona-Mensah, K., Battershill, J., Boobis, A., and Fielder, R. (2005). An approach to
investigating the importance of high potency polycyclic aromatic hydrocarbons (PAHs) in the induction of lung cancer by air pollution. Food and Chemical Toxicology 43 (7), 1103-1116.

109
Onursal, B., and Gautam, S.P. 1997. Vehicular Air Pollution. The World Bank, Washington, DC.
Özener, O., Yüksek, L., Ergenç, A. T., and Özkan, M. (2012). Effects of soybean biodiesel
on a DI diesel engine performance, emission and combustion characteristics. Fuel (0).
Özgünay, H., Çolak, S., Zengin, G., Sari, Ö., Sarikahya, H., and Yüceer, L. (2007).
Performance and emission study of biodiesel from leather industry pre-fleshings. Waste Management 27 (12), 1897-1901.
Ozsezen, A. N., Canakci, M., Turkcan, A., and Sayin, C. (2009). Performance and
combustion characteristics of a DI diesel engine fueled with waste palm oil and canola oil methyl esters. Fuel 88 (4), 629-636.
Parawira, W. (2010). Biodiesel production from Jatropha curcas: A review. Scientific
Research and Essays 5.14: 1796-1808. Performance Management and Delivery Unit (PEMANDU) (2010). Economic
transformation programme: a roadmap for Malaysia. Chapter 9, Palm oil. PEMANDU, Prime Minister’s Department, Malaysia.
Qi, D. H., Chen, H., Geng, L. M., and Bian, Y. Z. (2010a). Experimental studies on the
combustion characteristics and performance of a direct injection engine fueled with biodiesel/diesel blends. Energy Conversion and Management 51 (12), 2985-2992.
Qi, D. H., Chen, H., Geng, L. M., Bian, Y. Z., and Ren, X. C. (2010b). Performance and
combustion characteristics of biodiesel–diesel–methanol blend fuelled engine. Applied Energy 87 (5), 1679-1686.
Rajaraman, S., Yashwanth, G. K., T.Rajan, Kumaran, R. S., and P.Raghu. (2009).
Experimental investigations of performance and emission characteristics of Moringa oil methyl ester and its diesel blends in a single cylinder direct injection diesel engine. Proceedings of the ASME 2009 International Mechanical Engineering Congress & Exposition, November 13-19, Lake Buena Vista, Florida, USA.
Ramadhas, Muraleedharan, C., and Jayaraj, S. (2005). Performance and emission
evaluation of a diesel engine fueled with methyl esters of rubber seed oil. Renewable Energy 30 (12), 1789-1800.
Rao, P. V. (2011). Experimental Investigations on the Influence of Properties of Jatropha
Biodiesel on Performance, Combustion, and Emission Characteristics of a DI-CI Engine. World Academy of Science, Engineering and Technology 75, 855-868.
Rashid, U., Anwar, F., Moser, B. R., & Knothe, G. (2008). Moringa oleifera oil: A possible
source of biodiesel. Bioresource Technology, 99 (17), 8175-8179.
Ribeiro, N. M., Pinto, A. C., Quintella, C. M., da Rocha, G. O., Teixeira, L. S. G., Guarieiro, L. L. N., do Carmo Rangel, M., Veloso, M. C. C., Rezende, M. J. C.,

110
Serpa da Cruz, R., de Oliveira, A. M., Torres, E. A., and de Andrade, J. B. (2007). The Role of Additives for Diesel and Diesel Blended (Ethanol or Biodiesel) Fuels: A Review. Energy & Fuels 21 (4), 2433-2445.
Rodríguez, R. P., Perez, L. G., Alfonso, M., Duarte, M., Caro, R., Galle, J., Sierens, R., and
Verhelst, S. (2011). Characterization of Jatropha curcas oils and their derived fatty acid ethyl esters obtained from two different plantations in Cuba. Biomass and Bioenergy 35 (9), 4092-4098.
Sahoo, P. K., Das, L.M., Babu, M.K.G., and Naik, S.N. (2007). Biodiesel development
from high acid value polanga seed oil and performance evaluation in a CI engine. Fuel 86 (3), 448-454.
Sahoo, P. K., Das, L.M., Babu, M.K.G., Arora, P., Singh, V.P., Kumar, N.R., Varyani, T.S.
(2009). Comparative evaluation of performance and emission characteristics of jatropha, karanja and polanga based biodiesel as fuel in a tractor engine. Fuel, 88(9), 1698-1707.
Saleh, H. E. (2009). Experimental study on diesel engine nitrogen oxide reduction running with jojoba methyl ester by exhaust gas recirculation. Fuel 88 (8), 1357-1364.
Sanford, S., White, J., Shah, P., Wee, C., Valverde, M., and Meier, G. (2011). Feedstock
and Biodiesel Characteristics. Retrieved 23th February, 2013, from http://wwwregfuelcom/pdfs/Feedstock%20and%20Biodiesel%20Characteristics%20Reportpdf.
Saravanan, N., Nagarajan, G., and Puhan, S. (2010). Experimental investigation on a DI
diesel engine fuelled with Madhuca Indica ester and diesel blend. Biomass and Bioenergy 34 (6), 838-843.
Saravanan, S., Nagarajan, G., and Narayana Rao, G. L. (2009). Feasibility analysis of crude
rice bran oil methyl ester blend as a stationary and automotive diesel engine fuel. Energy for Sustainable Development 13 (1), 52-55.
Selvam, D. J. P., and Vadivel, K. (2012). Performance and Emission Analysis of DI Diesel
Engine Fuelled with Methyl Esters of Beef Tallow and Diesel Blends. Procedia Engineering 38 (0), 342-358.
Shahabuddin M, Kalam M.A, Masjuki, H. H., Bhuiya, M. M. K., and Mofijur, M. (2012).
An experimental investigation into biodiesel stability by means of oxidation and property determination. Energy 44 (1), 616-622.
Shahabuddin, M., Liaquat, A. M., Masjuki, H. H., Kalam, M. A., and Mofijur, M. (2013).
Ignition delay, combustion and emission characteristics of diesel engine fueled with biodiesel. Renewable and Sustainable Energy Reviews 21 (0), 623-632.
Shahabuddin, M., Masjuki, H. H., Kalam, M. A., Mofijur, M., Hazrat, M. A., and Liaquat,
A. M. (2012). Effect of Additive on Performance of C.I. Engine Fuelled with Bio Diesel. Energy Procedia 14 (0), 1624-1629.

111
Sharma, D., Soni, S. L., and Mathur, J. (2009). Emission Reduction in a Direct Injection Diesel Engine Fueled by Neem-Diesel Blend. Energy Sources, Part A: Recovery, Utilization, and Environmental Effects 31 (6), 500-508.
Silitonga, A. S., Atabani, A. E., Mahlia, T. M. I., Masjuki, H. H., Badruddin, I. A., and
Mekhilef, S. (2011). A review on prospect of Jatropha curcas for biodiesel in Indonesia. Renewable and Sustainable Energy Reviews 15 (8), 3733-3756.
Singh, S. P. and Singh, D. (2010). Biodiesel production through the use of different sources
and characterization of oils and their esters as the substitute of diesel: A review. Renewable and Sustainable Energy Reviews 14 (1), 200-216.
Srivastava, A. and Prasad, R. (2000). Triglycerides-based diesel fuels. Renewable and
Sustainable Energy Reviews 4 (2), 111-133. Tan, P.-q., Hu, Z.-y., Lou, D.-m., and Li, Z.-j. (2012). Exhaust emissions from a light-duty
diesel engine with Jatropha biodiesel fuel. Energy 39 (1), 356-362. Tsolakis, A., Megaritis, A., Wyszynski, M. L., and Theinnoi, K. (2007). Engine
performance and emissions of a diesel engine operating on diesel-RME (rapeseed methyl ester) blends with EGR (exhaust gas recirculation). Energy 32 (11), 2072-2080.
Ulusoy, Y., Arslan, R., and Kaplan, C. (2009). Emission Characteristics of Sunflower Oil
Methyl Ester. Energy Sources, Part A: Recovery, Utilization, and Environmental Effects 31 (11), 906-910.
Usta, N. (2005a). An experimental study on performance and exhaust emissions of a diesel
engine fuelled with tobacco seed oil methyl ester. Energy Conversion and Management 46 (15-16), 2373-2386.
Usta, N. (2005b). Use of tobacco seed oil methyl ester in a turbocharged indirect injection
diesel engine. Biomass and Bioenergy 28 (1), 77-86. Wang, X., Ge, Y., Yu, L., and Feng, X. (2013). Comparison of combustion characteristics
and brake thermal efficiency of a heavy-duty diesel engine fueled with diesel and biodiesel at high altitude. Fuel 107 (0), 852-858.
Xue, J., Grift, T. E., and Hansen, A. C. (2011). Effect of biodiesel on engine performances
and emissions. Renewable and Sustainable Energy Reviews 15 (2), 1098-1116. Zhang, Q., and Zhu Y. (2010). Measurements of ultrafine particles and other vehicular
pollutants inside school buses in South Texas. Atmospheric Environment 44 (2), 253-261.
Zhihao, M., Xiaoyu, Z., Junfa, D., Xin, W., Bin, X., and Jian, W. (2011). Study on
Emissions of a DI Diesel Engine Fuelled with Pistacia Chinensis Bunge Seed Biodiesel-Diesel Blends. Procedia Environmental Sciences 11 (C), 1078-1083.

112
APPENDIX A
PUBLICATIONS
Journal Articles:
Mofijur, M., Atabani, A. E., Masjuki, H. H., Kalam, M. A., Masum, B. M. (2013). A study on the effects of promising edible and non-edible biodiesel feedstocks on engine performance and emissions production: A comparative evaluation. Renewable and Sustainable Energy Reviews 23 (0), 391-404. (ISI Q1)
Mofijur, M., Masjuki, H. H., Kalam, M. A., Atabani, A. E. (2013). Evaluation of biodiesel
blending, engine performance and emissions characteristics of Jatropha curcas methyl ester: Malaysian perspective. Energy 55 (0), 879-887. (ISI Q1)
Mofijur, M., Masjuki, H. H., Kalam, M. A., Atabani A.E., Liaquat A.M., S.M. Ashrafur (2013). Performance and emission analysis of Jatropha curcas and Moringa oleifera methyl ester fuel blends in a multi-cylinder diesel engine. Journal of Cleaner Production. In press corrected proof, available online 5 September 2013 (ISI Q1).
International Conference:
M. Mofijur, H.H Masjuki, M.A. Kalam, M. Shahabuddin. Comparative performance analysis of a compression ignition engine fuelled with biodiesel blends. “The Energy & Materials Research Conference (EMR 2012)”. 20-22 June, 2012, Malaga, Spain.
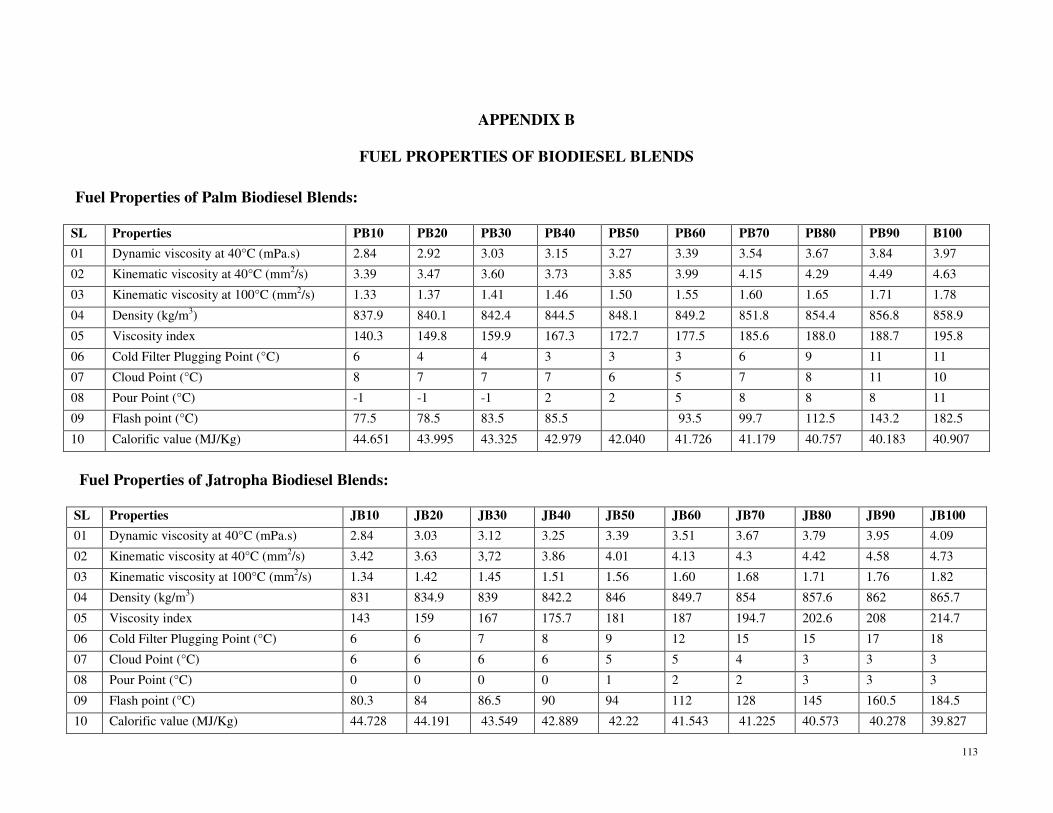
113
APPENDIX B
FUEL PROPERTIES OF BIODIESEL BLENDS
Fuel Properties of Palm Biodiesel Blends:
SL Properties PB10 PB20 PB30 PB40 PB50 PB60 PB70 PB80 PB90 B100
01 Dynamic viscosity at 40°C (mPa.s) 2.84 2.92 3.03 3.15 3.27 3.39 3.54 3.67 3.84 3.97
02 Kinematic viscosity at 40°C (mm2/s) 3.39 3.47 3.60 3.73 3.85 3.99 4.15 4.29 4.49 4.63
03 Kinematic viscosity at 100°C (mm2/s) 1.33 1.37 1.41 1.46 1.50 1.55 1.60 1.65 1.71 1.78
04 Density (kg/m3) 837.9 840.1 842.4 844.5 848.1 849.2 851.8 854.4 856.8 858.9
05 Viscosity index 140.3 149.8 159.9 167.3 172.7 177.5 185.6 188.0 188.7 195.8
06 Cold Filter Plugging Point (°C) 6 4 4 3 3 3 6 9 11 11
07 Cloud Point (°C) 8 7 7 7 6 5 7 8 11 10
08 Pour Point (°C) -1 -1 -1 2 2 5 8 8 8 11
09 Flash point (°C) 77.5 78.5 83.5 85.5 93.5 99.7 112.5 143.2 182.5
10 Calorific value (MJ/Kg) 44.651 43.995 43.325 42.979 42.040 41.726 41.179 40.757 40.183 40.907
Fuel Properties of Jatropha Biodiesel Blends:
SL Properties JB10 JB20 JB30 JB40 JB50 JB60 JB70 JB80 JB90 JB100
01 Dynamic viscosity at 40°C (mPa.s) 2.84 3.03 3.12 3.25 3.39 3.51 3.67 3.79 3.95 4.09
02 Kinematic viscosity at 40°C (mm2/s) 3.42 3.63 3,72 3.86 4.01 4.13 4.3 4.42 4.58 4.73
03 Kinematic viscosity at 100°C (mm2/s) 1.34 1.42 1.45 1.51 1.56 1.60 1.68 1.71 1.76 1.82
04 Density (kg/m3) 831 834.9 839 842.2 846 849.7 854 857.6 862 865.7
05 Viscosity index 143 159 167 175.7 181 187 194.7 202.6 208 214.7
06 Cold Filter Plugging Point (°C) 6 6 7 8 9 12 15 15 17 18
07 Cloud Point (°C) 6 6 6 6 5 5 4 3 3 3
08 Pour Point (°C) 0 0 0 0 1 2 2 3 3 3
09 Flash point (°C) 80.3 84 86.5 90 94 112 128 145 160.5 184.5
10 Calorific value (MJ/Kg) 44.728 44.191 43.549 42.889 42.22 41.543 41.225 40.573 40.278 39.827

114
Fuel Properties of Moringa Biodiesel Blends:
SL Properties MB10 MB20 MB30 MB40 MB50 MB60 MB70 MB80 MB90 MB100
01 Dynamic viscosity at 40°C (mPa.s) 2.94 3,.06 3.19 3.35 3.50 3.66 3.81 3.50 4.19 4.34
02 Kinematic viscosity at 40°C (mm2/s) 3.55 3,.67 3.82 3.99 4.15 4.32 4.48 4.68 4.89 5.05
03 Kinematic viscosity at 100°C (mm2/s) 1.36 1.39 1.48 1.52 1.55 1.64 1.66 1.75 1.82 1.84
04 Density (kg/m3) 830.6 833.6 836.4 840.1 843.4 846.7 849.8 853.5 857.1 859.6
05 Viscosity index 101.1 111.6 121.1 131 140 150.1 157.6 174.7 181.4 184.6
06 Cold Filter Plugging Point (°C) 6 6 7 8 9 12 15 15 17 18
07 Cloud Point (°C) 7 8 9 12 13 14 15 17 18 19
08 Pour Point (°C) 3 6 9 10 12 14 17 16 19 19
09 Flash point (°C) 79.5 82.5 90 94.5 98 105.5 108.5 114.5 131 180.5
10 Calorific value (MJ/Kg) 44.749 43.984 43.869 43.270 42.643 41.842 41.529 40.919 40.389 40.052

115
APPENDIX C
Summary of measurements uncertainty
Measurements Accuracy Relative Uncertainty
Load ± 1 N ± 0.2
Speed ± 10 rpm ± 0.1
BP ± 0.07 kW ±0.243
BSFC ± 5 g/kWh ±0.013
CO ±0.001 %vol ±0.003
NO ±1 ppm ±0.005
HC ±1 ppm ±0.090
CO2 ± 0.01%vol ±0.001