Performance Analysis of DBSs and DSMSs - uio.no · Performance Analysis of DBSs and DSMSs ... •...
54
Performance Analysis of DBSs and DSMSs Vera Goebel Department of Informatics, University of Oslo, 2010 • Performance Analysis (PA) • PA of DBS and DSMS • Raj Jain, The Art of Computer Systems Performance Analysis, 1991 • Jim Gray, The Benchmark Handbook for Database and Transaction Processing Systems, 1991 • The TPC homepage: www.tpc.org Literature
Transcript of Performance Analysis of DBSs and DSMSs - uio.no · Performance Analysis of DBSs and DSMSs ... •...

Performance Analysis
of DBSs and DSMSs
Vera GoebelDepartment of Informatics, University of Oslo, 2010
• Performance Analysis (PA)
• PA of DBS and DSMS
• Raj Jain, The Art of Computer Systems Performance Analysis, 1991
• Jim Gray, The Benchmark Handbook for Database and Transaction Processing Systems, 1991
• The TPC homepage: www.tpc.org
Literature

Overview
• What is performance evaluation and
benchmarking?
– Theory
– Examples
• Domain-specific benchmarks and
benchmarking DBMSs (TPC-…)
• Benchmarking DSMSs

When to do PA?
• Before bying a system (selection decision)
incl. hardware & software
• Comparing systems
• Designing application
• Bottlenecks & tuning

How (for what) to do PA?
• Evaluation models: parameters of design varied
• Selection models:select design with best performance
• Optimization models:find best parameter settings

What is benchmarking?
1. Evaluation techniques and metrics
2. Workload
3. Workload characterization
4. Monitors
5. Representation

Evaluation techniques and
metrics• Examining systems with respect to one or more metrics
– Speed in km/h
– Accuracy
– Availability
– Response time
– Throughput
– Etc.
• An example: Early processor comparison based on the speed of the addition instruction, since it was most used instruction
• Metric selection is based on evaluation technique (next slide)

Three main evaluation techniques
• Analytical modeling:– On paper
– Formal proofs
– Simplifications
– Assumptions
• Simulation:– Closer to reality
– Still omitted details
• Measurements:– Investigate real system

Evaluation techniques and metrics
Technique Analytical
modeling
Simulation Measurement
(concrete syst.)
Stage Any Any Postprototype
Time required Small Medium Varies
Tools Analysts Computer
languages
Instrumentation
Accuracy Low Moderate Varies
Trade-off
evaluation
Easy Moderate Difficult
Cost Small Medium High
Saleability Low Medium High

What is benchmarking?
• “benchmark v. trans. To subject (a system) to a series
of tests in order to obtain prearranged results not
available on competitive systems”
• S. Kelly-Bootle
The Devil’s DP Dictionary
-> Benchmarks are measurements used to compare two or
more systems.
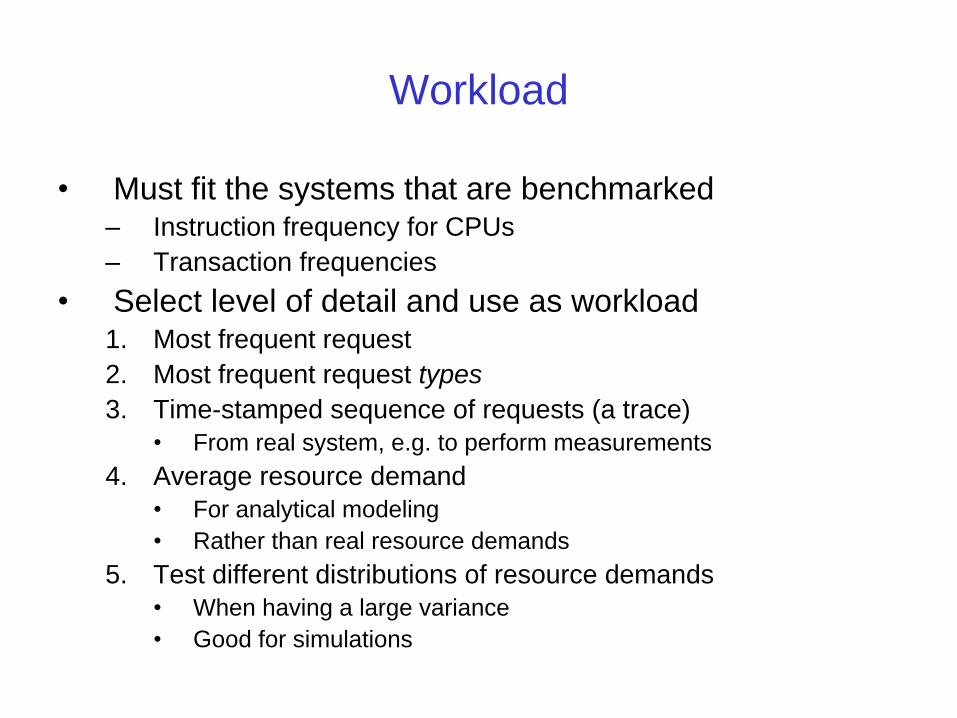
Workload
• Must fit the systems that are benchmarked– Instruction frequency for CPUs
– Transaction frequencies
• Select level of detail and use as workload1. Most frequent request
2. Most frequent request types
3. Time-stamped sequence of requests (a trace)
• From real system, e.g. to perform measurements
4. Average resource demand
• For analytical modeling
• Rather than real resource demands
5. Test different distributions of resource demands
• When having a large variance
• Good for simulations

Workload
• Representativeness
– Arrival rate
– Resource demands
– Resource usage profile
• Timeliness
– Workload should represent usage patterns

Workload characterization
• Repeatability is important
• Observe real-user behavior and create a repeatable workload based on that?
• One should only need to change workload parameters
– Transaction types
– Instructions
– Packet sizes
– Source/destinations of packets
– Page reference patterns
• Generate new traces for each parameter?

Monitors
• How do we obtain the results from sending the workload into the system?
• Observe the activities– Performance
– Collect statistics
– Analyze data
– Display results
– Either monitor all activities or sample
• E.g. top monitor update in Linux
• On-line– Continuously display system state
• Batch– Collect data and analyze later

Monitors
• In system
– Put monitors inside system
– We need the source code
– Gives great detail?
– May add overhead?
• As black-box
– Measure input and output, is that all good?

Benchmarking: Represented by common
mistakes
• Only average behavior represented in test workload
– Variance is ignored
• Skewness of device demands ignored
– Evenly distribution of I/O or network requests during test, which might not be the case in real environments
• Loading level controlled inappropriately
– Think time, i.e. the time between workload items, and number of users increased/decreased inappropriately
• Caching effects ignored
– Order of arrival for requests
– Elements thrown out of the queues?

Common mistakes in benchmarking
• Buffer sizes not appropriate
– Should represent the values used in production systems
• Inaccuracies due to sampling ignored
– Make sure to use accurate sampled data
• Ignoring monitoring overhead
• Not validating measurements
– Is the measured data correct?
• Not ensuring same initial conditions
– Disk space, starting time of monitors, things are run by hand …

Common mistakes in benchmarking
• Not measuring transient performance
– Depending on the system, but if the system is more in
transitions than steady states, this has to be
considered: Know your system!
• Collecting too much data but doing very little analysis
– In measurements, often all time is used to obtain the
data, but less time is available to analyze it
– It is more fun to experiment than analyze the data
– It is hard to use statistical techniques to get significant
results; let’s just show the average

The art of data presentation
It is not what you say, but how you say it.
- A. Putt
• Results from performance evaluations aim to help in
decision making
• Decision makers do not have time to dig into complex
result sets
• Requires prudent use of words, pictures, and graphs to
explain the results and the analysis

Overview
• What is performance evaluation and
benchmarking?
– Theory
– Examples
• Domain-specific benchmarks and
benchmarking DBMSs
– We focus on the most popular one: TPC

Domain-specific benchmarks
• No single metric can measure the
performance of computer systems on all
applications
– Simple update-intensive transactions for
online databases
vs.
– Speed in decision-support queries

The key criteria for a domain-specific
benchmark
• Relevant
– Perform typical operations within the problem domain
• Portable
– The benchmark should be easy to implement and run
on many different systems and architectures
• Scaleable
– To larger systems or parallel systems as they evolve
• Simple
– It should be understandable in order to maintain
credibility

DBS & DSMS Resources
DBS DSMS
Disk
(Memory)
(CPU)
CPU
Memory
(Data rate)
(Query complexity)

DBS Performance Optimization
• Workload!
• DB design (logical and physical)
• Choice of data types!
• Indexes, access paths, clustering,…

TPC: Transaction Processing Performance
Council
• Background– IBM released an early benchmark, TP1, in early 80’s
• ATM transactions in batch-mode
– No user interaction
– No network interaction
• Originally internally used at IBM, and thus poorly defined
• Exploited by many other commercial vendors
– Anon (i.e. Gray) et al. released a more well thought of benchmark, DebitCredit, in 1985
• Total system cost published with the performance rating
• Test specified in terms of high-level functional requirements
– A bank with several branches and ATMs connected to the braches
• The benchmark workload had scale-up rules
• The overall transaction rate would be constrained by a response time requirement
• Vendors often deleted key requirements in DebitCredit to improve their performance results

TPC: Transaction Processing Performance
Council
• A need for a more standardized benchmark
• In 1988, eight companies came together and formed
TPC
• Started making benchmarks based on the domains used
in DebitCredit.
• Still going strong and evolves together with the
technology

Early (and obsolete) TPCs
• TPC-A– 90 percent of transactions must complete in less than 2
seconds
– 10 ATM terminals per system and the cost of the terminals was included in the system price
– Could be run in a local or wide-area network configuration• DebitCredit has specified only WANs
– The ACID requirements were bolstered and specific tests added to ensure ACID viability
– TPC-A specified that all benchmark testing data should be publicly disclosed in a Full Disclosure Report
• TPC-B– Vendors complained about all the extra in TPC-A
– Vendors of servers were not interested in adding terminals and networks
– TPC-B was a standardization of TP1 (to the core)

TPC-C
• On-line transaction processing (OLTP)
• More complex than TPC-A
• Handles orders in warehouses
– 10 sales districts
• 3000 costumers
• Each warehouse must cooperate with the other
warehouses to complete orders
• TPC-C measures how many complete business
operations can be processed per minute

TPC-E
• Is considered a
successor of
TPC-C
• Brokerage house
– Customers
– Accounts
– Securities
• Pseudo-real data
• More complex
than TPC-C
Characteristic TPC-E TPC-C
Tables 33 9
Columns 188 92
Min Cols / Table 2 3
Max Cols / Table 24 21
Data Type Count Many 4
Data Types UID, CHAR,
NUM, DATE,
BOOL, LOB
UID, CHAR, NUM,
DATE
Primary Keys 33 8
Foreign Keys 50 9
Tables w/ Foreign
Keys
27 7
Check
Constraints
22 0
Referential
Integrity
Yes No
© 2
007
TP
C

TPC-E (results)
© 2
009
TP
C

More recent TPCs
• TPC-H– Decision support
– Simulates an environment in which users connected to the database system send individual queries that are not known in advance
– Metric• Composite Query-per-Hour Performance Metric (QphH@Size)
– Selected database size against which the queries are executed
– The query processing power when queries are submitted by a single stream
– The query throughput when queries are submitted by multiple concurrent users
• TPC-Energy
– Important for data centers these days• Energy estimates when system is deployed
– A new add-on for the TPC tests• How much energy when fully ran vs. when idle

Performance Analysis of DSMS
• DSMS Metrics
• Example: Linear Road
• Example: StreamBench

DSMS Recap #1
• Data source:
– Data stream
– Possibly unbound
– Relational tuples with attributes
• Data processing:
– Performed in main memory
– Except for historical queries, where streaming tuples are
joined with tuples in statically stored relational tables
• Query interface:
– E.g., Extended SQL

DSMS Recap #2
• Uncontrollable arrival rate:
– Load Shedding
– Sampling
– Aggregations (windowed)
– Data reduction techniques
e.g., sketching and histograms
• Blocking operator problem:
– Applies to joins and aggregations
– Solutions: Windowing techniques, e.g., sliding windows.
approximations

Metrics
• Response time
– “How long does it take for the system to produce output tuples?”
– Challenge: Windowing!
• Accuracy
– “How accurate the system is for a given load of data arrival and queries?”
– Especially applies to an overloaded system, where approximations rather than correct answers are presented
– Challenge: Need to know the exact expected result
• Scalability
– “How much resources are needed by the system to process a given load with a defined response time and accuracy?”
– Consumption of memory
– Utilization of CPU
• Throughput
– Tuples per second
– Processing rate Prx%(StreamBench)
• Additionally identify how and with what ease queries can be expressed (subjective, thus hard to measure)
[Chaudhry et al. “Stream Data Management”]

Linear Road Benchmark #1
• Master’s thesis at M.I.T
• Linear City
– Traffic in this city, is the actual workload
– Fixed city with roads and generated traffic
– Generated before runtime, and stored in a flat file
• Perform variable tolling
– Based on real-time traffic and traffic congestion
– Every vehicle is transmitting their location periodically
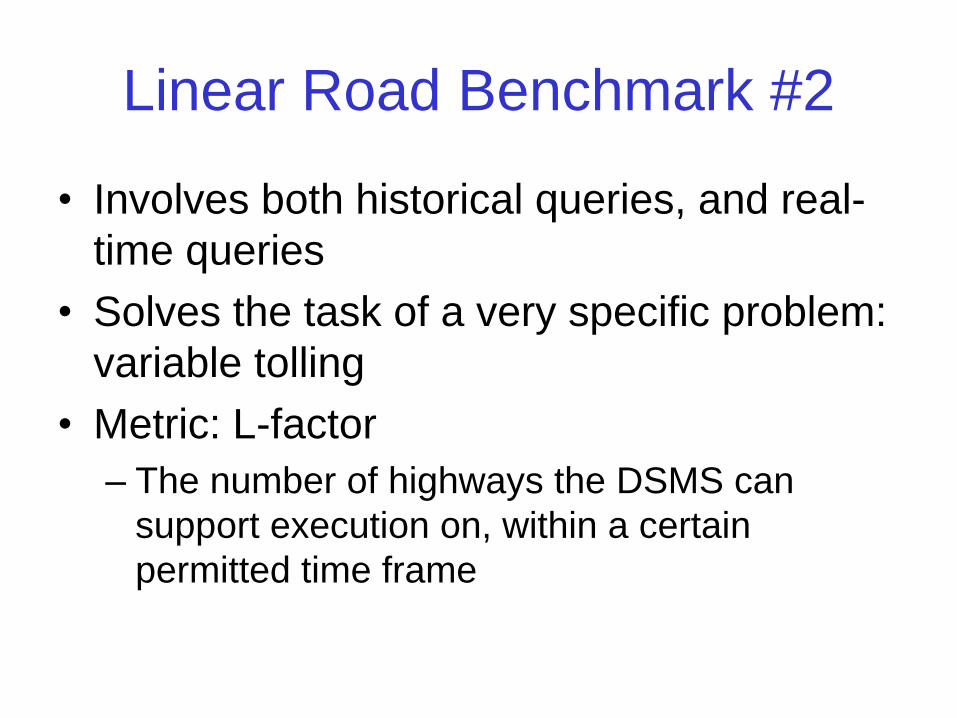
Linear Road Benchmark #2
• Involves both historical queries, and real-
time queries
• Solves the task of a very specific problem:
variable tolling
• Metric: L-factor
– The number of highways the DSMS can
support execution on, within a certain
permitted time frame

Linear Road Benchmark #3
• Benchmarked Systems:
– STREAM
– Relational Database (Commercially available)
– Aurora
– Stream Processing Core (SPC)
– SCSQ

Linear Road Evaluation
• Has proven that DSMS might outperform a commercial available database by a factor of 5*1(+)
• Only a single metric (-)
• “Domain specific benchmark”. Variable traffic tolling is not perhaps easy comparable performancewize with other domains (-)
• The target of the benchmark (Linear Road) is a fairly complex application itself, thus running it is not a simple task (-)
*1 [Arasu et al. “Linear Road: A Stream Data Management Benchmark]

StreamBench Motivation
• Domain specific benchmark
– Real-time passive network monitoring
– Traffic traces are collected and analyzed on
the fly
– TCP and IP packet headers are collected
from a network interface card (NIC)
• Based upon work at DMMS group/Ifi

StreamBench Architecture #1

StreamBench Architecture #2
• Machine B modules:
– DSMS
– fyaf
• Filters traffic between A and C, and sends to DSMS in CSV format
– stim
• Investigates the time it takes from a tuple is received at the NIC (network interface card), to a result tuple is presented by the DSMS
– Various system monitors (e.g., top & sar)
• Monitors the consumption of resources such as CPU and memory
• Machine A and C modules:
– TG 2.0
• Used for generating traffic
– BenchmarkRunner
• Controls the TG instances and generates traffic. Also determines workload and relative throughput

StreamBench Metrics
• Processing rate
– By using fyaf
– Identification of PrX%, where x is the minimum percentage of successfully received tuples (network packets). The x values 100%, 98% and 95% are default
• Response time
– By using stim
– Need to know the DSMS behavior regarding windowing
• Accuracy
– By looking at the DSMS output
– Need to know the result for exact calculation
• Scalability and Efficiency
– By using the Linux utilities top and sar
– Measures of memory and CPU continuously logged during task execution

StreamBench fyaf Module
• fyaf - fyaf yet another filter
• Written in C
• Reads from NIC through the use of PCAP-library
• Filters out unwanted traffic through PCAP filter capabilities
• Converts data from PCAP into comma separated values
(CSV) in strings
• Creates a TCP socket to the DSMS, used for sending the
tuples
• Uses PCAP functionality to identify the number of lost tuples
that the DSMS did not manage to retrieve (due to overload)

StreamBench stim Module
• stim - stim time investigation module
• Written in C
• Used to identify response time
• 3 stages:1. Initialization
2. Wait for available tuples (packets) on NIC (timer is started)
3. Wait for output on DSMS output file (timer is stopped)
• Handles windowing by “sleeping” when window fills up
• Output: the response time of the DSMS

StreamBench
BenchmarkRunner Module• Collection of Perl scripts run on multiple machines
• Controls the execution of TG 2.0, fyaf, stim, top, sar, and as
well the DSMS subject of the benchmark
• Dynamically sets the workload to identify the maximum
workload the DSMS can handle (Pr100%, Pr98% and Pr95%)
• Uses an approach similar to “binary search”
12 3
workload
Search number:
Prx% found!

StreamBench Tasks
1. Projection of the TCP/IP header fields
– Easy to measure response time
2. Average packet count and network load per second over a one minute interval
– Easy to measure accuracy
3. Packet count to certain ports during the last five minutes
– Join a stream and a static table
4. SYN flooding attacks
– A practical task for usability
– We investigate a simple SYN vs. non-SYN packets relation
5. Land attack filter
– Practical task also for usability
– Filter out all SYN packets with same IP destination and source, these packets caused infinite loop on Win 95 servers
6. Identify attempts at port scanning
– Also an practical task
– Count the number of packets sent to distinct ports, should not be to high!

StreamBench Results
• Benchmarking of four systems:
– TelegraphCQ - Public domain discontinued from
Berkeley
– STREAM - Public domain discontinued from
Standford
– Borealis - Public domain from Brandeis, Brown and
M.I.T.
– Esper - Open Source Commercial Java library from
EsperTech

StreamBench Results Task 1
select * from Packets;

StreamBench Results Task 2
select count(*), avg(totallength) from Packets;

StreamBench Results Task 3
select count(*) from Packets, Ports
where Packets.destport = Ports.nr group by destport

StreamBench Results Task 4

StreamBench Results Task 5

StreamBench Results Task 6

DSMS PA - Conclusion
• Systems have different characteristics
regarding CPU and memory consumption,
and also how they handle overload
• If we allow packet loss, STREAM mostly
outperform the other systems.
• If we want 100% packet delivery Esper is
the best