Performance Analysis of Crosstalk Subcarrier Multiplexing ...
33
Performance Analysis of Crosstalk Subcarrier Multiplexing and Wave Division Multiplexing in Optical Communication System Ebrahim E. Elsayed ( [email protected] ) Electronics and Communications Engineering Department, Faculty of Engineering, Mansoura University, Mansoura 35516, El-Dakahilia Governorate, Egypt. https://orcid.org/0000-0002-7208-2194 Research Article Keywords: WDM, BER, OBI, SCM, SNR, SMF Posted Date: April 26th, 2021 DOI: https://doi.org/10.21203/rs.3.rs-460310/v1 License: This work is licensed under a Creative Commons Attribution 4.0 International License. Read Full License
Transcript of Performance Analysis of Crosstalk Subcarrier Multiplexing ...

Performance Analysis of Crosstalk SubcarrierMultiplexing and Wave Division Multiplexing inOptical Communication SystemEbrahim E. Elsayed ( [email protected] )
Electronics and Communications Engineering Department, Faculty of Engineering, Mansoura University,Mansoura 35516, El-Dakahilia Governorate, Egypt. https://orcid.org/0000-0002-7208-2194
Research Article
Keywords: WDM, BER, OBI, SCM, SNR, SMF
Posted Date: April 26th, 2021
DOI: https://doi.org/10.21203/rs.3.rs-460310/v1
License: This work is licensed under a Creative Commons Attribution 4.0 International License. Read Full License
1
Performance Analysis of Crosstalk Subcarrier Multiplexing and
Wave Division Multiplexing in Optical Communication System
Ebrahim E. Elsayed
Electronics and Communications Engineering Department, Faculty of Engineering,
Mansoura University, Mansoura 35516, El-Dakahilia Governorate, Egypt.
Author's email address: [email protected]
Abstract
In traditional optical communication, duplexity is achieved by using two fibers, each
having a transmitter and a receiver. Economically, bidirectional wavelength division
multiplexing (WDM) transmission systems utilizing a single fiber will be more
attractive not only reducing the use of the fiber by a factor of two ,but also the
number of components. Duplex transmissions over a single fiber can double the
capacity of an installed unidirectional link. The idea of this paper is to study another
approach using the subcarrier multiplexing (SCM)-based optical network and
evaluate the physical transmission quality of analog and digital signal using SCM
approach and the characteristic of fiber nonlinear crosstalk such as stimulated
Raman scattering, Cross phase modulation and four-wave mixing in the SCM
externally modulation optical link. A suitable bandwidth of 890 – 950 MHz is selected
for subcarriers and channel bandwidth of 200 KHz and carrier. By measuring the
optical bit interference (OBI) performance limitations of the subcarrier multiplexing
WDM optical transmission system is investigated. The OBI for 10 channels for input
power 1 dB is -40 dB whereas for 110 channels the OBI is -20 dB separation of 250
KHz are considered.
Keywords: WDM, BER, OBI, SCM, SNR, SMF.
1) INTRODUCTION
An optical communications system is similar to other communication systems in
that it consists of the three main parts: Transmitter, Receiver and the
Communication channel [1-3]. In order for a fiber to guide the light signal, it must
consist of a core of material whose refractive index is greater than that of the
surrounding medium, which is called the cladding. Depending on the design of
the fiber, light is constrained to the core by either total internal reflection or
refraction [4].
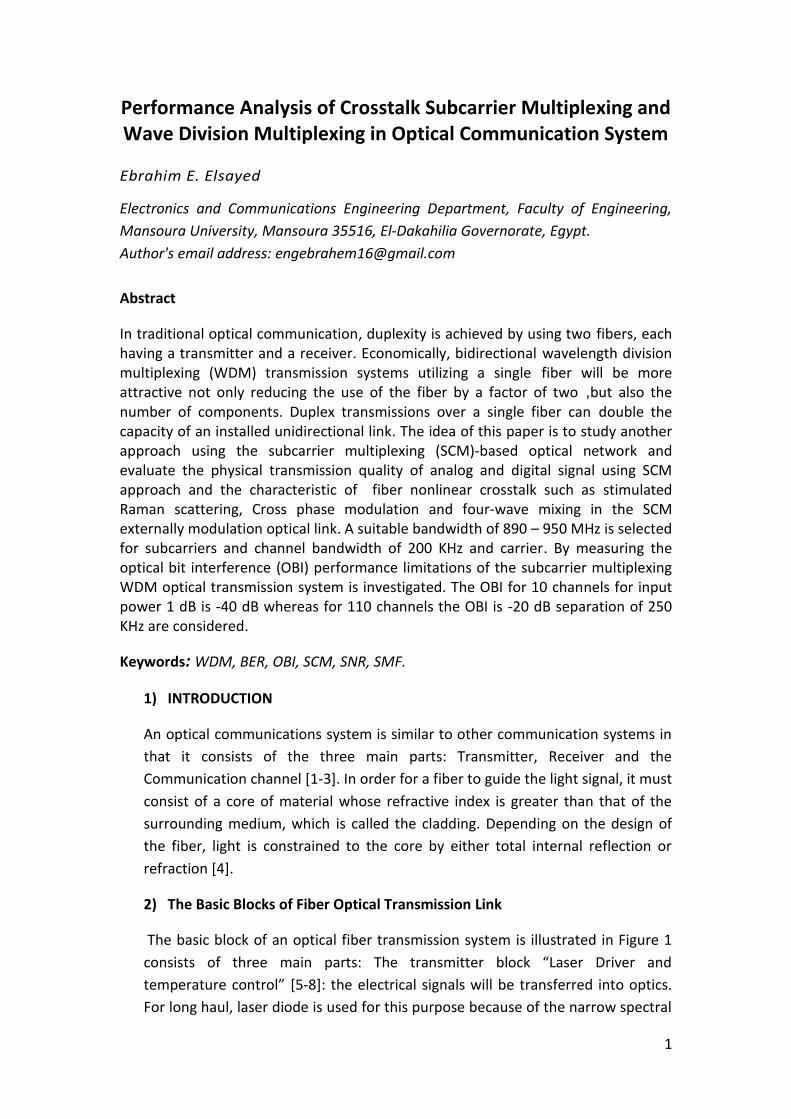
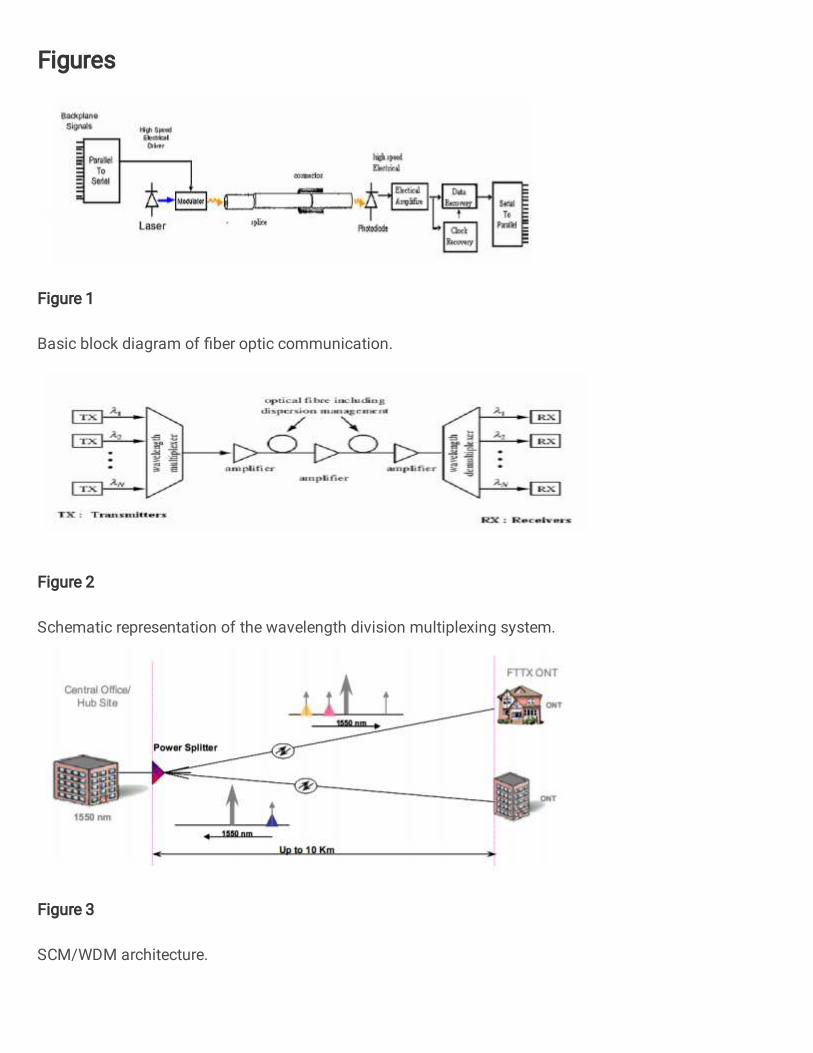
2) The Basic Blocks of Fiber Optical Transmission Link
The basic block of an optical fiber transmission system is illustrated in Figure 1
consists of three main parts: The transmitter block “Laser Driver and
temperature control” [5-8]: the electrical signals will be transferred into optics.
For long haul, laser diode is used for this purpose because of the narrow spectral
2
width and high optical power that is used to carry data over long distance. The
light is then coupled into the transmission channel, the optical fiber cable, where
most of the dispersion and attenuation takes place [5]. The receiver block which
is the last part of the system converts the optical signal back into the replica of
the electrical signal using the Avalanche photodiode (APD) or PIN-type
photodiode then to the amplification stage before reaching the end user [9-12].
Figure 1: Basic block diagram of fiber optic communication.
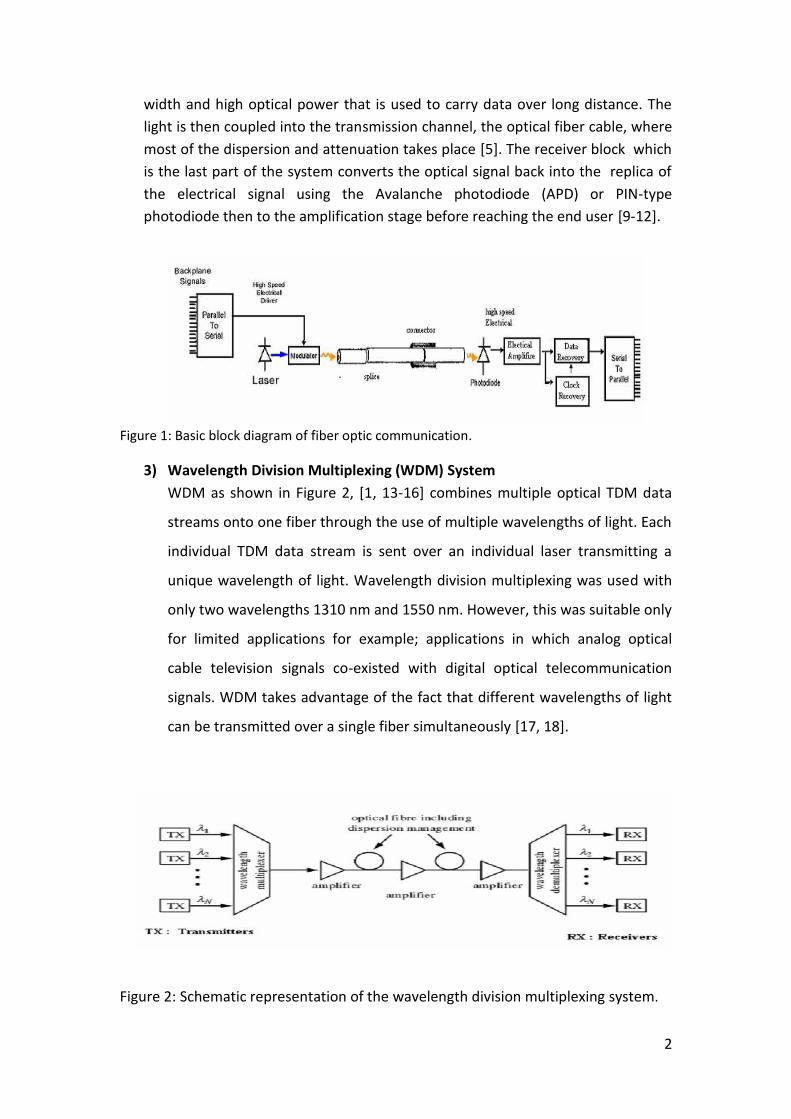
3) Wavelength Division Multiplexing (WDM) System
WDM as shown in Figure 2, [1, 13-16] combines multiple optical TDM data
streams onto one fiber through the use of multiple wavelengths of light. Each
individual TDM data stream is sent over an individual laser transmitting a
unique wavelength of light. Wavelength division multiplexing was used with
only two wavelengths 1310 nm and 1550 nm. However, this was suitable only
for limited applications for example; applications in which analog optical
cable television signals co-existed with digital optical telecommunication
signals. WDM takes advantage of the fact that different wavelengths of light
can be transmitted over a single fiber simultaneously [17, 18].
Figure 2: Schematic representation of the wavelength division multiplexing system.
3
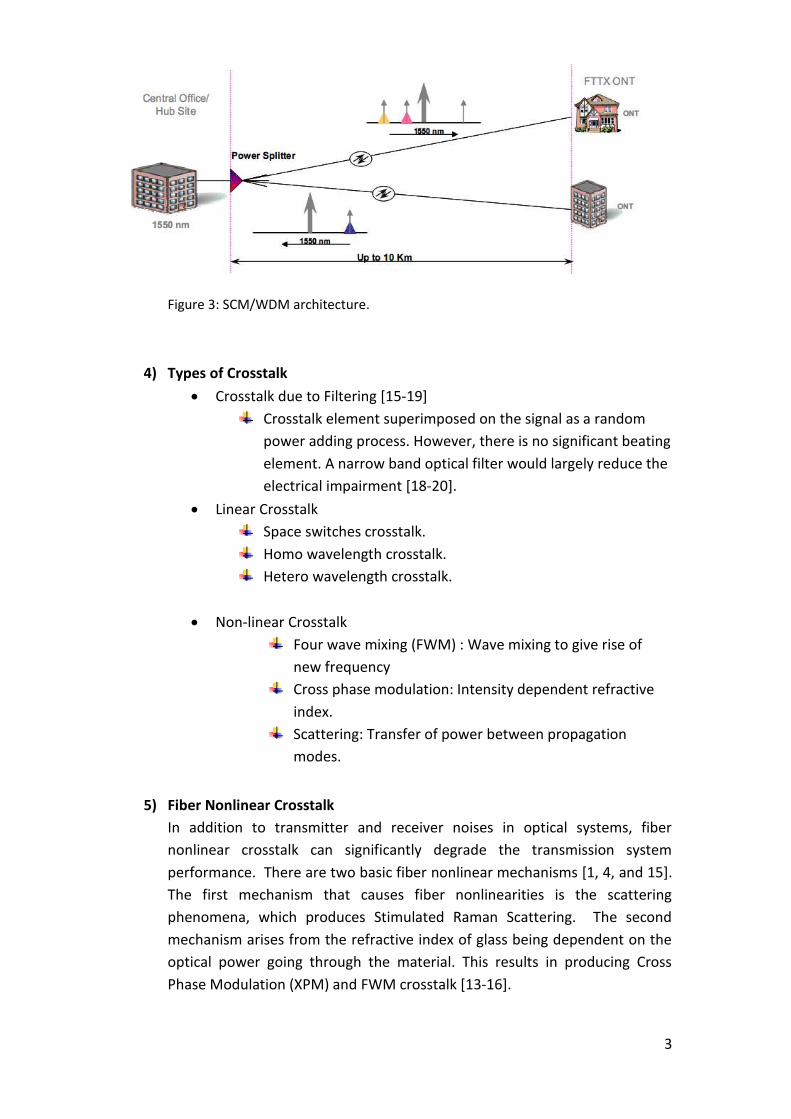
Figure 3: SCM/WDM architecture.
4) Types of Crosstalk
Crosstalk due to Filtering [15-19]
Crosstalk element superimposed on the signal as a random
power adding process. However, there is no significant beating
element. A narrow band optical filter would largely reduce the
electrical impairment [18-20].
Linear Crosstalk
Space switches crosstalk.
Homo wavelength crosstalk.
Hetero wavelength crosstalk.
Non-linear Crosstalk
Four wave mixing (FWM) : Wave mixing to give rise of
new frequency
Cross phase modulation: Intensity dependent refractive
index.
Scattering: Transfer of power between propagation
modes.
5) Fiber Nonlinear Crosstalk
In addition to transmitter and receiver noises in optical systems, fiber
nonlinear crosstalk can significantly degrade the transmission system
performance. There are two basic fiber nonlinear mechanisms [1, 4, and 15].
The first mechanism that causes fiber nonlinearities is the scattering
phenomena, which produces Stimulated Raman Scattering. The second
mechanism arises from the refractive index of glass being dependent on the
optical power going through the material. This results in producing Cross
Phase Modulation (XPM) and FWM crosstalk [13-16].

4
Stimulated Raman Scattering (SRS) Crosstalk Frequency Response.
Stimulated Raman Scattering (SRS) is a nonlinear phenomenon found
in wavelength-division multiplexed (WDM) transmission system. As
shown in figure 3, where the shorter wavelength channels are robbed
of power and that power feeds the longer wavelength channel [9, 20-
26].
Figure 4: Stimulated Raman scattering (SRS) crosstalk frequency
response.
As for the crosstalk interaction between pump channel and signal channel in the
SCM/WDM system, assuming pump channel has a shorter wavelength than probe
channel, the most significant crosstalk term is due to the SRS interaction between
pump channel optical carrier and probe channel subcarriers [18-20, 26-30].
A formal approach to determining SRS crosstalk levels is to solve the coupled
propagation equations for the optical intensity I at wavelengths λ1 and λ2 [10, 15]. ( ) ( )
Where z is the distance along the fiber, g is the Raman gain (loss) coefficient
and ν is the group velocity of each channel in the fiber. Assuming λ2 < λ1
(channel 2 is designated as pump channel and channel 1 as probe channel).
By neglecting the SRS term, on the right hand side Eq. 1 of and solving
for ; then substituting into Eq.2 and solving for are gets [10, 15]:
( ) ( ) * ∫ ( ) +

5
( ) ( ) * ∫ ( ) +
Where = | | is the group velocity mismatch between the pump and
signal channels and
A similar approach can be used to solve for by neglecting the SRS term, on
the right hand side of Eq.2 and solving for , then substituting into Eq.1 to get [10,
15]
( ) ( ) * ∫ ( ) +
6) Analysis of SCM in Presence of OBI
There are M numbers of subcarrier multiplexing (SCM) in a given optical
channel, having the same average power. Each of these fields can be
represented by [11, 12]: ( ) √ ( )
Where the intensity modulation by an RF is signal of center frequency and can
be represented by [11-15]: ( ) ( )
Where m(t) is NRZ data signal with bit period .
The total field in an optical channel is the sum of M fields and can be represented as
[11, 20]:
( ) ∑ ( )
The electric field at the output of the fiber is given by:
( ) | ( ) ( )|
Where α is the fiber attenuation coefficient, L is the fiber length and ( )
represents the fiber impulse response.
The photodetector (PD) converts this field into an electrical signal proportional to
the field intensity.

6
( ) {∑ ( ) } Eq.10 ( ) { ∑ ∑ ( ) ( )} Eq.11
Here ( ) contributes nonzero beat interference terms. The output of the PD is
passed through a pre-amplifier followed by a band pass filter. If any of the spectral
components of ( ) falls within the bandwidth of any of the M users BPF, it will
cause OBI.
( ) ∫ ( ) ( ) ( ) ( ) ( ) , ( ) ( )- ( )
Where represents the required subcarrier frequency.
The power spectrum of the i-th subscriber's signal component can be expressed as: ( )( ) , ( )( )- ( ) ( ) , ( ) ( )- . /
Using band pass filter, output signal power of the required sub-carrier can be
calculated as [11-15]:
( )=∫ ( ) ( ) ∫ . / , ( )-
Where B is the specified bandwidth of the subcarrier or bandwidth of the BPF.
This (cross) is the source of the OBI.
SNR= ( ) ( )
BER = 0.5erfc (√ Eq.16

7
7) Four-Wave Mixing Crosstalk in SCM Externally Modulated Optical Link
Four-wave mixing crosstalk is one of the major limiting factors in SCM/WDM
optical fiber communications systems that use narrow channel spacing, low
chromatic dispersion and high optical channel power. The time-averaged optical
power ( ) through the FWM process for the frequency
component fijk is Written in as [22].
( ) ( ) ( ) |{ ( ) }* + |
where is the third-order nonlinear susceptibility, (which is related to nonlinear refractive ( ) The generated wave efficiency η, with respect to
phase mismatch ∆βL [10, 22]
η= ( ) ( ) |{ ( ) } * + | * ( )( ) +
where ∆β is the propagation constant difference written as
0 ( )1
Assuming the equivalent frequency separation ∆f = ( ) 0 ( ) 1
The time-average optical power generated through the FWM process can be
modified in terms of generated wave efficiency as [10, 22]
( ) ( ) ( )
Using D = 6 (none of frequencies are the same).

8
8) Dual Parallel Linearized External Modulators
The basic configuration of optical dual parallel linearization technique is
shown below in figure [5].
Figure 5: Dual parallel MZ modulator in [6].
By providing less optical power and higher RF drive power to the secondary
modulator, the secondary modulator has higher OMI and greater distortion. By
providing more optical power to the primary MZ modulator, the third-order
distortion products created in the secondary modulator can be made to cancel the
distortion products from the primary modulator with a small cancellation of the
fundamental signal, result with MATLAB in fig [14-16].
[ ( ) ] ( ) [ ( ) ] ( ( ) ( ) ( ) )
where A is the splitting ratio of the input power divider and B is the ratio of RF
drive power. Assuming V (t) is a multi-sinusoidal signal, using trigonometric
identities and Bessel functions, the amplitude of the fundamental carrier with
frequency can be expressed as [10]: ( ) ( ) ( ) ( ) ( )

9
And the amplitude of the third-order intermodulation component of the frequency can be expressed as ( ) ( ) ( ) ( ) ( ) The third-order intermodulation product can be cancelled when
A= . / . / . / . / . / . /
9) Results
Figure 6: Plot of the optical bit interference (OBI) vs channel number for input
power, Pi = 1 dB, 10 dB and 20 dB.

10
Figure 7: Plot of the signal to interference ratio (SIR) vs channel number for
input power, Pi = 1 dB, 10 dB and 20 dB.
Figure 8: Plot of the bit-error-rate (BER) vs channel number for input power,
Pi = 1 dB, 10 dB and 20 dB.

11
Figure 9: Channel number vs. BER.
10) Discussion
The number of channels can be increased without significant penalty if the
input power is kept low. The number of channels can also be increased if the
bandwidth is taken more for more carrier separation.
Parameters of Design Consideration [10, 16]
Bandwidth: 890 MHz – 960 MHz.
Channel Spacing: 200 KHz.
Modulation: QPSK modulation.
Line Coding: NRZ input data.
Interchannel Spacing and number of Channels: 250 KHz.
Noise: Noise other than OBI is not considered.

12
Figure 10: Power spectrum of 10 channels at 7 MHz separation carrier wave.
Figure 11: Power Spectrum of 10 channels at 7 MHz separation carrier wave.

13
Figure 12: Power spectrum of 10 channels at 7 MHz separation carrier wave.
Figure 13: Spaced frequency vector with NumUnique Pts points. And the magnitude of fft of
x and scale the fft so that it is not a function of the length of x.

14
Figure 14: DPMZ power divider ratio vs. OMI (optical modulation index).
Figure 15: C/CTB performance with B=2 and A=0.87, 0.88 & 0.89.

15
Figure 16: Carrier to third & fifth order distortion vs. OMI.
11) Source Code
%%C. MATLAB Code for Channel vs SNR & BER clc
clear all
close all
p=[1 5 10 20];
snr1=[27.78 22.40 19.44 15.23 13.60 11.04 8.53 6.61 5.25 4.86];
snr10=[25.36 20.60 17.87 14.46 12.60 10.26 7.83 6.29 5.10 4.64];
snr20=[22.9497 18.7589 16.2029 13.2505 11.5074 9.5336 7.052 5.7121
5.0435 4.2542];
channel=[11 21 29 41 47 57 71 83 94 107];
BER1=[2.10E-23 1.93E-13 4.53E-10 1.79E-07 6.09E-06 7.95E-05 2.68E-04
0.0017 0.0019 0.0021];
BER5=[5.55E-21 1.75E-12 1.70E-09 1.67E-06 9.57E-06 5.65E-05 3.30E-04
0.0018 0.0024 0.004];
BER10=[3.64E-18 2.90E-11 1.10E-08 1.14E-05 8.81E-05 3.54E-04 9.42E-04
0.004 0.0054 0.003];
BER20=[3.31E-14 1.95E-09 7.79E-07 7.96E-05 5.75E-04 1.12E-03 5.38E-03
0.0057 0.0043 0.0039];

16
OBI1=[-40.63 -35.24 -32.29 -28.07 -26.47 -23.89 -21.41 -19.44 -18.24
-17.54];
OBI5=[-25.63 -20.53 -17.69 -14.13 -12.06 -9.93 -8.06 -5.39 -4.26 -
3.56];
OBI10=[-18.21 -13.44 -10.70 -7.28 -5.42 -4.06 -1.64 0.88 1.77 2.43];
OBI20=[-9.77 -5.55 -2.98 1.23 2.7 3.75 5.44 7.50 7.81 8.52];
ber11=[2.10E-23 5.55E-21 3.64E-18 3.31E-14];
ber21=[1.93E-13 1.75E-12 2.90E-11 1.95E-09];
hold on
plot(channel,OBI20);
title('OBI Vs Channel');
xlabel('Channel (Number)');
ylabel('OBI (dB)');
axis([10 108 -45 10])
grid on
figure(2)
plot(channel,snr1);
hold on
plot(channel,snr10);
hold on
plot(channel,snr20);
title('SIR Vs Channel');
xlabel('Channels (Number)');
ylabel('SIR (dB)');
%axis([889 925 0 2])
grid on
figure(3)
semilogy(channel,BER1);
hold on
semilogy(channel,BER5);
hold on
semilogy(channel,BER10);
hold on
semilogy(channel,BER20);
title('Channel Vs BER');
xlabel('Channels (Number)');
ber29=[4.53E-10 1.70E-09 1.10E-08 7.79E-07];
ber41=[1.79E-07 1.67E-06 1.14E-05 7.96E-05];
ber47=[6.09E-06 9.57E-06 8.81E-05 5.75E-04];
ber57=[7.95E-05 5.65E-05 3.54E-04 1.12E-03];
ber71=[2.68E-04 3.30E-04 9.42E-04 5.38E-03];
17
ber83=[0.0017 0.00180 0.004 0.0057];
ber94=[0.0019 0.0024 0.0054 0.0043];
ber107=[0.0021 0.004 0.003 0.0039];
figure(1)
plot(channel,OBI1);
hold on
plot(channel,OBI5);
hold on
plot(channel,OBI10);
ylabel('OBI ');
%axis([889 925 0 2])
grid on
figure(4)
semilogy(p,ber11);
hold on
semilogy(p,ber21);
hold on
semilogy(p,ber29);
hold on
semilogy(p,ber41);
hold on
semilogy(p,ber47);
hold on
semilogy(p,ber57);
hold on
semilogy(p,ber71);
hold on
semilogy(p,ber83);
hold on
semilogy(p,ber94);
hold on
semilogy(p,ber107);
title('Channel Vs BER');
xlabel('Channels (Number)');
ylabel('BER ');
%axis([889 925 0 2])
grid on
18
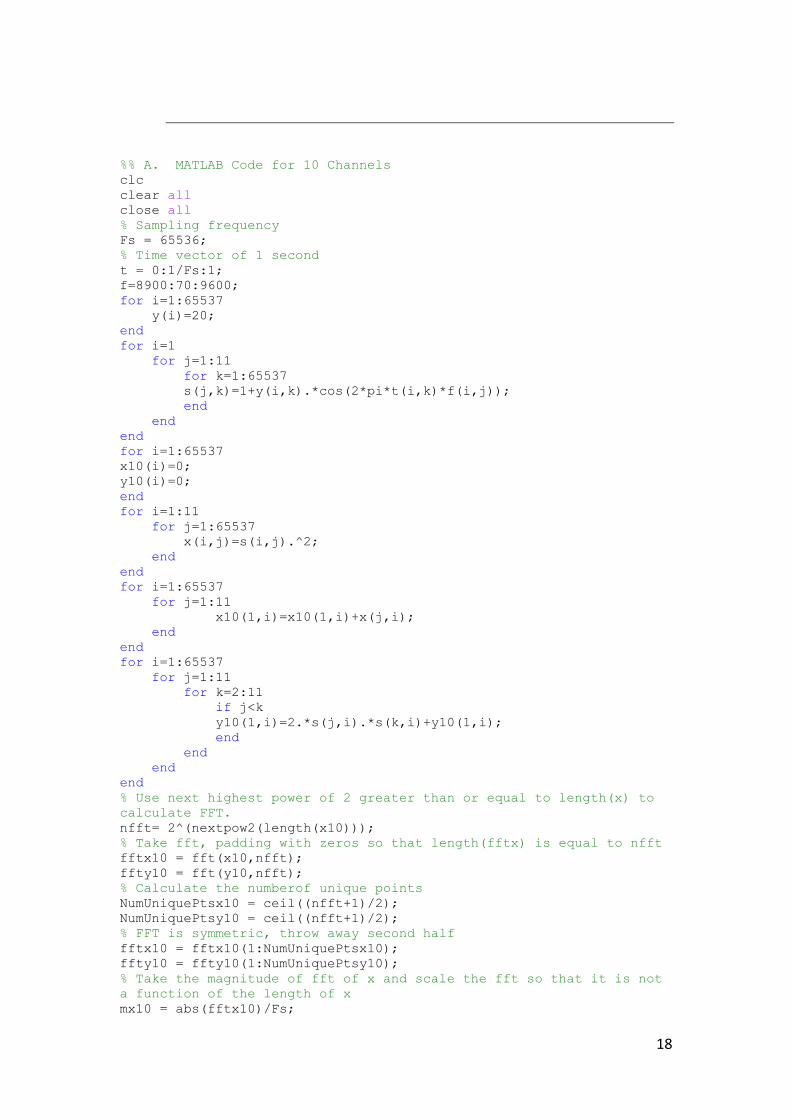
%% A. MATLAB Code for 10 Channels clc clear all close all % Sampling frequency Fs = 65536; % Time vector of 1 second t = 0:1/Fs:1; f=8900:70:9600; for i=1:65537 y(i)=20; end for i=1 for j=1:11 for k=1:65537 s(j,k)=1+y(i,k).*cos(2*pi*t(i,k)*f(i,j)); end end end for i=1:65537 x10(i)=0; y10(i)=0; end for i=1:11 for j=1:65537 x(i,j)=s(i,j).^2; end end for i=1:65537 for j=1:11 x10(1,i)=x10(1,i)+x(j,i); end end for i=1:65537 for j=1:11 for k=2:11 if j<k y10(1,i)=2.*s(j,i).*s(k,i)+y10(1,i); end end end end % Use next highest power of 2 greater than or equal to length(x) to calculate FFT. nfft= 2^(nextpow2(length(x10))); % Take fft, padding with zeros so that length(fftx) is equal to nfft fftx10 = fft(x10,nfft); ffty10 = fft(y10,nfft); % Calculate the numberof unique points NumUniquePtsx10 = ceil((nfft+1)/2); NumUniquePtsy10 = ceil((nfft+1)/2); % FFT is symmetric, throw away second half fftx10 = fftx10(1:NumUniquePtsx10); ffty10 = ffty10(1:NumUniquePtsy10); % Take the magnitude of fft of x and scale the fft so that it is not a function of the length of x mx10 = abs(fftx10)/Fs;

19
my10 = abs(ffty10)/Fs; % Take the square of the magnitude of fft of x. %mx = mx.^2; % Since we dropped half the FFT, we multiply mx by 2 to keep the same energy. % The DC component and Nyquist component, if it exists, are unique and should not be multiplied by 2. if rem(nfft,2) % odd nfft excludes Nyquist point mx10(2:end) = mx10(2:end)*2; else mx10(2:end -1) = mx10(2:end -1)*2; end if rem(nfft,2) % odd nfft excludes Nyquist point my10(2:end) = my10(2:end)*2; else my10(2:end -1) = my10(2:end -1)*2; end % This is an evenly spaced frequency vector with NumUniquePts points. fx10 = ((0:NumUniquePtsx10-1)*Fs/nfft)/10; fy10 = ((0:NumUniquePtsy10-1)*Fs/nfft)/10; %Generate the plot, title and labels. figure(1) plot(fx10,mx10); title('Power Spectrum of 10 channels at 7 MHz seperation Carrier Wave'); xlabel('Frequency (MHz)'); ylabel('Power'); axis([925 962 0 25]) grid on F=f/10; areamx10=0; areamy10=0; si=0; ei=0; si1=0; ei1=0; si=find(fx10==(925-0.1)); ei=find(fx10==(925+0.1)); df=fx10(si:ei); dmx=mx10(si:ei); areamx10=trapz(df,dmx); si1=find(fx10==920.4); ei1=find(fx10==922.6) ; df=fx10(si1:ei1); dmy=mx10(si1:ei1); areamy10=trapz(df,dmy) ; snr10=areamx10/areamy10; snr10db=20.*log10(snr10) ; ber10=0.5*erfc(sqrt(2*snr10)) ; title('Power Spectrum of 10 channels at 7 MHz seperation Carrier Wave'); xlabel('Frequency (MHz)'); ylabel('Power'); axis([889 925 0 2]) grid on figure(2) plot(fx10,mx10); title('Power Spectrum of 10 channels at 7 MHz seperation Carrier Wave'); xlabel('Frequency (MHz)');

20
ylabel('Power'); axis([925 962 0 2]) grid on figure(3) plot(fy10,my10); title('Power Spectrum of 10 channels at 7 MHz seperation Carrier Wave'); xlabel('Frequency (MHz)'); ylabel('Power'); axis([889 925 0 25]) grid on figure(4) plot(fy10,my10); f=8900:6.5:9600; for i=1:65537 y(i)=0.01; end for i=1 for j=1:108 for k=1:65537 s(j,k)=1+y(i,k).*cos(2*pi*t(i,k)*f(i,j)); end end end for i=1:65537 x100(i)=0; y100(i)=0; end for i=1:108 for j=1:65537 x(i,j)=s(i,j).^2; end end for i=1:65537 for j=1:108 x100(1,i)=x100(1,i)+x(j,i); end end for i=1:65537 for j=1:108 for k=2:108 if j<k y100(1,i)=2.*s(j,i).*s(k,i)+y100(1,i); end end end end

21
%Program 3: Dual Parallel Linearized MZ Modulator clear all; close all index=0; index1=0; index2=0; index3=0; %Modulation Index mod1=[[0.01:0.0005:0.05],[0.051:0.005:0.11]]; mod2=mod1; m=mod2; M=mod1.*sqrt(78); M1=mod2.*sqrt(78); B=[2,2.5,3]; for n=1:length(B) index=index+1; A1(index,:)=(B(n)*(mod1./2)).^3; A2(index,:)=exp(-B(n)^2*(M.^2)./4); A3(index,:)=(mod1./2).^3; A4(index,:)=exp(-(M.^2)./4); end for n=1:length(B); index1=index1+1; A(index1,:)=(A1(n,:).*A2(n,:))./((A3(n,:).*A4(n,:))+(A1(n,:).*A2(n,:))); end CONV_IMD=128./(3*m.^4*78^2); CONV_IMD5=(m./2).^8*(78^4/12); figure(1) plot(mod1,A);grid;hold; title('Figure 4-6 DPMZ Power Divider Ratio vs. OMI'); xlabel('Optical Modulation Index m'); ylabel('Power Divider Ratio(A)'); h = legend('B=2','B=2.5','B=3'); axis([0.01,.1,0.8,1]) a=[0.88,0.93,0.96]; b=[2,2.5,3]; for n1=1:length(b) index2=index2+1; IMD1(index2,:)=a(n1).*(m./2).^3; IMD2(index2,:)=exp(-(M1.^2)./4); IMD3(index2,:)=(1-a(n1)).*(b(n1).^3*(m./2).^3); IMD4(index2,:)=exp(-b(n1).^2*(M1.^2)./4); C1(index2,:)=a(n1).*(m./2); C2(index2,:)=exp(-(M1.^2)./4); C3(index2,:)=(1-a(n1)).*(b(n1)*(m./2)); C4(index2,:)=exp(-b(n1).^2*(M1.^2)./4); IMD5_1(index2,:)=a(n1).*(m./2).^5; IMD5_2(index2,:)=exp(-(M1.^2)./4); IMD5_3(index2,:)=(1-a(n1)).*(b(n1).^5*(m./2).^5); IMD5_4(index2,:)=exp(-b(n1).^2*(M1.^2)./4);

22
test_imd5(index2,:)=(b(n1).^4)*(m./2).^8*(78^4/12); end total_IMD=(IMD1.*IMD2)-(IMD3.*IMD4); total_IMD_5=(IMD5_1.*IMD5_2)-(IMD5_3.*IMD5_4); total_C=(C1.*C2)-(C3.*C4); CTB=(total_IMD./total_C).^2*(3*78^2/8); CTB_5=(total_IMD_5./total_C).^2*((78^4)/12); CTB_IMD5=CTB+test_imd5; figure(2) plot(m, 10*log10(1./CTB));grid;hold plot(m, -10*log10(1./CONV_IMD),'r'); figure(3) plot(m, -10*log10(CTB(1,:)),'b');grid;hold plot(m, -10*log10(test_imd5(1,:)),'b.'); plot(m, -10*log10(CTB(2,:)),'r'); plot(m, -10*log10(test_imd5(2,:)),'r.'); plot(m, -10*log10(CTB(3,:)),'k'); plot(m, -10*log10(test_imd5(3,:)),'k.'); axis([0.01,.1,0,120]) title('Figure 4-11 Carrier to Third & Fifth order distortion vs. OMI'); xlabel('Optical Modulation Index m'); ylabel('C/CTB & C/CIR5(dB)'); h = legend('Case I: Third Order Distortion','Case I: Fifth Order Distortion','Case II: Third Order Distortion','Case II: Fifth Order Distortion','Case III: Third Order Distortion','Case III: Fifth Order Distortion');

23
References
[1] R. Hui, B. Zhu, R. Huang, C. Allen, K. Demarest, D. Richards, “Subcarrier Multiplexing for High-speed Optical Transmission,” Journal of Lightwave Technology, vol. 20, no. 3, March 2002.
[2] R. Olshansky, “Optimal Design of Subcarrier Multiplexed lightwave systems employing linearized external modulators,” Journal of Lightwave Technology, vol. 10, no.3 March, 1992.
[3] G Keiser, Optical fiber Communication, Boston, 2000.
[4] W. Way, Broadband Hybrid Fiber/Coax Access System Technologies, San
Diego, CA: Academic, 1999.
[5] G. Smith, D. Novak, Z. Ahmed, “Overcoming Chromatic-Dispersion Effects in
Fiber-Wireless Systems Incorporating External Modulators,” IEEE Transactions on Microwave Theory and Techniques, vol. 45, no. 8, August
1997.
[6] J. Brooks, G. Maurer, R. Becker, “Implementation and Evaluation of a Dual Parallel Linearization System for AM-SCM Video Transmission,” Journal of Lightwave Technology, vol. 11, no. 1, January 1993.
[7] FCC Standard and Regulations: Section 76.605 “Multichannel Video and Cable
Television Service”. [8] J. Chiddix, H. Laor, D. Pangrac, L. Williamson & R. Wolfe, “AM Video on Fiber
in CATV systems: Need and Implementation”, IEEE Journal on Selected Areas in Communications, vol. 8, no. 7, September 1990.
[9] S. Bigo, S. Gauchard, A. Bertaina, & J. Hamaide, “Experimental Investigation of Stimulated Raman Scattering Limitation on WDM Transmission Over
Various Types of Fiber Infrastructures,” IEEE Photonics Technology Letters, vol. 11, no. 6 June 1999.
[10] M Phillips & D. Ott, “Crosstalk Due to Optical Fiber Nonlinearities in WDM CATV Lightwave Systems,” Journal of Lightwave Technology, vol 17, no. 10, Oct. 1999.
[11] Simon Haykin, Communication Systems (John Wiley & Sons Inc., 4 Editions.)
[12] Simon Haykin, Digital Communications (Wiley India Edition, 1st Edition.)
[13] Lathi B.P., Modern Digital and Analog Communication Systems (Oxford
University Press, 3rd Edition.)
[14] Yang S. & Yao J.G., Impact of Crosstalk Induced Beat Noise on the size of
Semiconductor Laser Amplifier Based Optical Space Switch Structures, IEEE
Photonics Technology Letters, Vol. 4. , No. 7, July 1996.
[15] Gyselings Tim, Morthier Geert & Baets Roel, Crosstalk Analysis of
Multiwavelength Optical Cross Connects, Journal of Light wave Technology,
Vol. 17, No. 8, August 1999.
24
[16] Mizuochi Takashi, Kitayama Tadayoshi, Shimizu Katshuhiro & Ito Atsuyoshi,
Interferometric Crosstalk-Free Optical Add/Drop Multiplexer Using Mach-
Zehnder Based Fiber Gratings, Journal of Light wave Technology, Vol 16, No.
2, February 1998.
[17] Phase Modulation in Wikipedia, Available:
http://en.wikipedia.org/wiki/phase_modulation
[18] Timercon website [online]. Available: http://en.timercon.com/BER/.
[19] Accumulated noise in yahoo answer. Available:
http://en.answer.com/topic/accumulated _noise/ (2002) The IEEE website.
[Online] Available: http://ieee_xplore.com/topic/ effect_of_crosstalk
_on_wdm_mux-demux/
[20] Crosstalk topics. Available: http://www.crosstalkamerica.com/.
[21] Modulation in Wikipedia. Available: http://en.wikipedia.org/wiki/Modulation
[22] N. Shibata, R. Braun, R. Waarts, “Phase Mismatch Dependence of Efficiency of Wave Generation Through Four-Wave Mixing in a Single-Mode Optical
Fiber,” IEEE Journal of Quantum Electronics, vol QE-23, no. 7, July 1987.
[23] E. E. Elsayed and B. B. Yousif, “Performance evaluation and enhancement of
the modified OOK based IM/DD techniques for hybrid fiber/FSO
communication over WDM-PON systems,” Opt. Quantum Electron., vol. 52,
no. 9, 2020, doi: 10.1007/s11082-020-02497-0.
[24] B. B. Yousif, E. E. Elsayed, and M. M. Alzalabani, “Atmospheric turbulence
mitigation using spatial mode multiplexing and modified pulse position
modulation in hybrid RF/FSO orbital-angular-momentum multiplexed based
on MIMO wireless communications system,” Opt. Commun., vol. 436, pp.
197–208, 2019, doi: 10.1016/j.optcom.2018.12.034.
[25] A. M. Mbah, J. G. Walker, and A. J. Phillips, “Outage probability of WDM free-
space optical systems affected by turbulence-accentuated interchannel
crosstalk,” IET Optoelectron., vol. 11, no. 3, pp. 91–97, 2017, doi: 10.1049/iet-
opt.2016.0057.
[26] B. B. Yousif and E. E. Elsayed, “Performance Enhancement of an Orbital-Angular-Momentum-Multiplexed Free-Space Optical Link under Atmospheric
Turbulence Effects Using Spatial-Mode Multiplexing and Hybrid Diversity
Based on Adaptive MIMO Equalization,” IEEE Access, vol. 7, pp. 84401–84412,
2019, doi: 10.1109/ACCESS.2019.2924531.
[27] E. E. Elsayed and B. B. Yousif, “Performance enhancement of hybrid diversity for M-ary modified pulse-position modulation and spatial modulation of
MIMO-FSO systems under the atmospheric turbulence effects with geometric
spreading,” Opt. Quantum Electron., vol. 52, no. 12, 2020, doi:
10.1007/s11082-020-02612-1.
[28] Ebrahim E. Elsayed, Bedir B. Yousif, and Mahmoud M. Alzalabani,
"Performance enhancement of the power penalty in DWDM FSO

25
communication using DPPM and OOK modulation", Optical and Quantum
Electronics, vol. 50 (7), pp. 282, (26 June 2018).
[29] Ansari, N., Zhang, J.: ‘Media access control and resource allocation for next generation passive optical networks’ (Springer, 2013)
[30] Ebrahim E. Elsayed and Bedir B. Yousif, "Performance enhancement of the
average spectral efficiency using an aperture averaging and spatial-coherence
diversity based on the modified-PPM modulation for MISO FSO links", Optics
Communications, vol. 463, pp. 125463, (15 May 2020).
Compliance with ethical standards
Conflict of interest: The author declares that there is no conflict of interest regarding
the manuscript. The author is responsible for the content and writing of this article.
The author declares that he has no known competing financial interests or personal
relationships that could have appeared to influence the work reported in this paper.
Figures
Figure 1
Basic block diagram of �ber optic communication.
Figure 2
Schematic representation of the wavelength division multiplexing system.
Figure 3
SCM/WDM architecture.

Figure 4
Stimulated Raman scattering (SRS) crosstalk frequency response.
Figure 5
Dual parallel MZ modulator in [6].

Figure 6
Plot of the optical bit interference (OBI) vs channel number for input power, Pi = 1 dB, 10 dB and 20 dB.
Figure 7
Plot of the signal to interference ratio (SIR) vs channel number for input power, Pi = 1 dB, 10 dB and 20dB.
Figure 8

Plot of the bit-error-rate (BER) vs channel number for input power, Pi = 1 dB, 10 dB and 20 dB.
Figure 9
Channel number vs. BER.
Figure 10
Power spectrum of 10 channels at 7 MHz separation carrier wave.

Figure 11
Power Spectrum of 10 channels at 7 MHz separation carrier wave.
Figure 12
Power spectrum of 10 channels at 7 MHz separation carrier wave.

Figure 13
Spaced frequency vector with NumUnique Pts points. And the magnitude of fft of x and scale the fft sothat it is not a function of the length of x.
Figure 14
DPMZ power divider ratio vs. OMI (optical modulation index).

Figure 15
C/CTB performance with B=2 and A=0.87, 0.88 & 0.89.
Figure 16
Carrier to third & �fth order distortion vs. OMI.