Perceptions of Informed Stakeholders to measure Regulatory Efficacy Helani Galpaya LA@5 Colombo Dec...
25
Perceptions of Informed Stakeholders to measure Regulatory Efficacy Helani Galpaya LA@5 Colombo Dec 2009 Using the TRE survey
-
Upload
bathsheba-gray -
Category
Documents
-
view
215 -
download
0
Transcript of Perceptions of Informed Stakeholders to measure Regulatory Efficacy Helani Galpaya LA@5 Colombo Dec...

Perceptions of Informed Stakeholders to measure Regulatory Efficacy
Helani GalpayaLA@5
Colombo Dec 2009
Using the TRE survey

Investment by competitive operators is key to good sector performance
• Good sector performance can be defined as – increased connectivity– decreasing price– increased quality of service– increase in choice of services
• All 4 can only happen with sustained/long term investment– with competition for and in the market, by multiple players– not under pure monopoly conditions– not solely high-risk capital that flows out quickly
• Less arbitrary the policies/regulation about investment and operation more attractive a country or sector is to an investor– How will I be treated compared to others? – How will I be treated now vs. in the future?

Evaluation of risks at point of investment (or re-investment) is both subjective and objective• Market risk: cost of capital, demand for product etc.
– Often objectively evaluated • Country risk: macro-level factors such as exchange rate,
inflation, political stability– Some evaluated objectively (e.g., expected inflation rates,
growth rates, etc.)– But others subjectively (e.g., Doing Business survey by WB,
Investment Climate survey by WEF)• Regulatory risk (risk emanating from government action,
including but not limited to sector regulator -- Spiller & Levy 1994)– Includes governance/institutional framework, process, outcome– Different ways to evaluate

Multiple ways of evaluating regulatory environment (institutional framework, processes, outputs)
• Mostly objective– “Is there a RIO”? – Answer: Yes or No (1 or 0)– E.g. unpublished work by Waverman (2008)/Edwards &
Waverman’s work using EU Regulatory Institutions database to measure regulatory independence
• More subjective, but still objective at base– “Is the RIO implemented? /how often?”– Answer: “Yes, sometimes”, “No, only 30% of the time”
etc.• Mostly subjective
– “Is the RIO good”/ “Does is unduly benefit one party?”– Answer depends on who you ask – But ask enough people (with different interests), you
get a rough idea about how good it is…
LOW
HIGH
Leve
l of s
ubje
ctivi
ty o
f ev
alua
tion

To meaningfully evaluate regulatory risk subjective evaluations are a must/best. Evaluation has to include more than what's written down in the law• Different aspects of the regulatory environment
influence risk– Governance/institutional framework: how independent is
the regulator? To who does it report? Etc– Process: How are regulatory decisions made? In real life?
Does the regulator follow the same process every time? – Substance (outcomes/output): Are the regulatory
decisions sound? Do they impact the sector positively?• Theory and practice can often differ
– E.g. MV and PK regulates price (in theory, as per Act)– But not in practice

TRE : a measure of the perceived efficacy of the overall regulatory environmentEncompasses regulatory governance, regulatory substance and regulatory outputs

TRE: an evaluation of the Telecom Policy and Regulatory Environment in a country, along 7 dimensions
• Asks respondents to evaluate TRE on 7 dimensions– Market Entry– Allocation of Scarce Resources– Interconnection, – Regulation of Anti-Competitive Practices– Universal Service Obligations– Tariff Regulation central to most regulators’ activities– Quality of Service becomes important as markets mature
• For 3 sub-sectors separately: fixed, mobile, BB
Directly from GATS regulatory reference paper
Directly from GATS regulatory reference paper

Target a minimum of 45 senior stakeholders per country, from 3 categories (other than micro states)
• Minimum of 15 respondents per category x 3 = 45– Category 1: those directly involved in the sector such as
operators, equipment vendors– Category 2: those indirectly associated with the sector and
those studying/observing the sector with broader interest such as consultants and lawyers
– Category 3: those who represent the broader public interest such as media personnel, other government officials, retired regulators, civil society organizations
• Each category should get equal weight in final “score”– But not possible to guarantee equal # responses per category– Use weights to ensure equal contribution by each category

Short Questionnaire using a Likert Scale. 5-7 minutes to complete, on average
• Each dimension evaluated on Likert Scale of 1 to 5– Minimum 1 = highly ineffective– Maximum 5 = highly effective
• E.g., • “Please Tick the Number that best represents the quality
of the regulatory environment for…
• …etc. 21 such questions/boxes• Brevity ensures an assistant won’t complete survey
Market Entry Highly effective
Highly ineffective1 2 3 4 5

Ways to use the results
• Compare countries (by sector, by dimension etc)– To identify best practices– For regional investors, to identify/assess opportunities
• To compare changes in perceived effectiveness of TRE over time– Might need to account for “lag” between regulatory action
and increased/decreased TRE score/perception• As a diagnostic tool within one country
– Best use: same set of respondents giving different scores to each dimensions

Comparing/Ranking countries: using 2008 TRE survey results Do countries with best practices come out on top? And “worst practices” at the bottom?

A note on comparability of countries
• Different people evaluating each country: comparable? – Not ideal. But similar to rankings done by other surveys (e.g.
Investment climate studies)• Need to avoid comparing apples to oranges
– Are microstates comparable to larger markets? – Do monopoly or duopoly markets allow for honest expression of
opinion, however much confidentiality is promised? • E.g. Maldives
– Microstate: population ~ 300,000– Duopoly with strong incumbent with majority government
ownership– Island nation/culture: friendly, everyone knows everyone

Market Entry: PK leads with clear (yet expensive) licensing conditions. LK low scores related to delays in Airtel market entry (2007-09)
PK: Best performer
PK: Best performer
LK: Worst Performer
LK: Worst Performer
Note: In the 2008 TRE survey average # respondents received per country was 57 (except Maldives which was 16). In 2006 average completed responses per county was 60.4

PK: Expensive but transparent licensing conditions; no restrictions on foreign ownership
• Clear rules: payment of fee guarantees license renewal– Even though very expensive @ USD 291 MM, price determined
by auction• Unbundled licensing for fixed
– investors can enter, offer services in area of their choice• Mobile Number Portability since 2007
– even smaller (new entrants) have a fighting chance to capture market share
• No limitations to foreign ownership, M&A activity– USD 1.4 billion in FDI in 2007-2008– accounts for 27% of all FDI into Pakistan
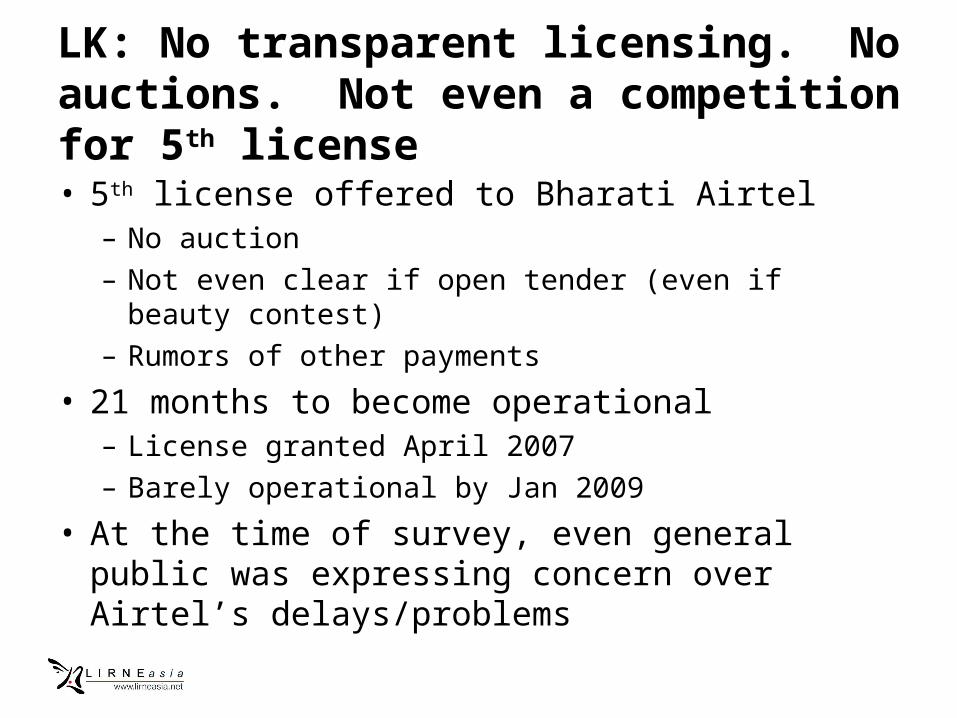
LK: No transparent licensing. No auctions. Not even a competition for 5th license
• 5th license offered to Bharati Airtel– No auction– Not even clear if open tender (even if beauty contest)– Rumors of other payments
• 21 months to become operational– License granted April 2007 – Barely operational by Jan 2009
• At the time of survey, even general public was expressing concern over Airtel’s delays/problems

TRE is a diagnostic tool in a country Are good (or bad) regulatory actions reflected in TRE scores? Are improvements reflected in TRE scores over time?

In 2006 USO was India's worst performing dimension. India also received lowest USO TRE score in the region.

Mobiles drove rural penetration. But USO policy charged 5% of mobile gross revenues and funded only fixed. 2nd largest undisbursed USF in world

Even if demand side data is questionable, supply side data revealed the poor were using phones, and planning to buy
South Asia South East Asia
Pakistan India Sri Lanka Philippines Thailand
Used phone in last 3 months
98% 94% 92% 93% 95%
Non-owners who plan to buy a phone in the next two years
53%
38%
53%
42%38%
0%
10%
20%
30%
40%
50%
60%
Pakistan India Sri Lanka Philippines Thailand
% o
f n
on
-ow
ner
s
plan to buy a phone in the next tw o years
% of the BOP who had used a phone
% of the BOP who had used a phone

…and that the phones they planned to buy were mobile phones, nearly always
Type of phone prospective owners would buy
23% 29%
52%
8%
68%67%
40%
91%
9% 4% 7% 1%
0%
10%
20%
30%
40%
50%
60%
70%
80%
90%
100%
Pakistan India Sri Lanka Philippines
Not decided yet
Mobile
Fixed phone
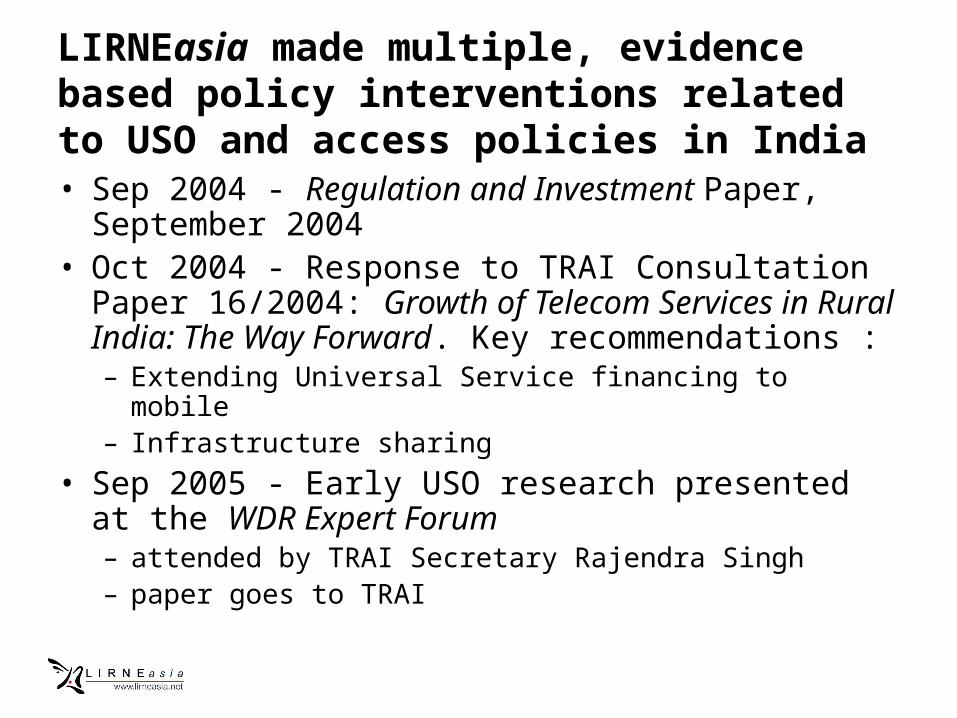
LIRNEasia made multiple, evidence based policy interventions related to USO and access policies in India• Sep 2004 - Regulation and Investment Paper, September
2004• Oct 2004 - Response to TRAI Consultation Paper
16/2004: Growth of Telecom Services in Rural India: The Way Forward. Key recommendations : – Extending Universal Service financing to mobile – Infrastructure sharing
• Sep 2005 - Early USO research presented at the WDR Expert Forum – attended by TRAI Secretary Rajendra Singh– paper goes to TRAI

• Oct 31 2005 - Indian Express, op-ed piece by Payal Malik– Rural telephony: TRAI got it right finally!
• Dec 2006 - Conversation with Shanthanu Consul, administrator USF, DoT at ITU Telecom World
• March 2007 - Meeting with USF administrator– Sharing of the BoP results and backhaul infrastructure
study done by HV Singh

Directly and through the media
• “A study by Colombo-based LIRNEasia (Learning Initiatives on Reforms for Network Economies) claims that the telecom regulatory mechanism in India is way behind Pakistan in five of the six parameters it considered…...”.– The Business World
• “Pakistan Bests India in Telecoms Regulation”– Hindustan Times, 20 Dec 2006
• Rural telephony: TRAI got it right finally!– Indian Express, op-ed, Payal Malik, Oct 31 2005
• 27 different articles after a TRE dissemination even in PK• etc.

TRAI agreed, with us (and others)
• In March 2007: mobile sector allowed to receive funds– Increase in TRE scores
• But still USD 4 billion undisbursed– TRE scores barely above average
• Did subsequent TRE scores change? – 2006 USO scores in India were terrible– We did the TRE survey in 2008

Post-policy change, TRE for USO increased 64%. Biggest change ever observed. Stakeholders rewarding policy, even though funds still undisbursed
64% increase
36% increase
Perception measures (tracked with sound methodology)
CAN reflect what’s right or wrong with policy &
regulation, over time and across countries